wind-tunnel development of an sr-71 aerospike rocket … … · · 2013-06-27national aeronautics...
TRANSCRIPT

National Aeronautics andSpace Administration
NASA Technical Memorandum 4749
Wind-Tunnel Development of an SR-71 Aerospike Rocket Flight Test Configuration
Timothy R. Moes, Brent R. Cobleigh, Timothy R. Conners, Timothy H. Cox, Stephen C. Smith, and Norm Shirakata
June 1996

National Aeronautics andSpace Administration
Dryden Flight Research CenterEdwards, California 93523-0273
1996
NASA Technical Memorandum 4749
Wind-Tunnel Development of an SR-71 Aerospike Rocket Flight Test Configuration
Timothy R. Moes, Brent R. Cobleigh, Timothy R. Conners, and Timothy H. Cox
NASA Dryden Flight Research CenterEdwards, California
Stephen C. Smith
NASA Ames Research CenterMoffett Field, California
Norm Shirakata
Lockheed-Martin Skunk WorksPalmdale, California

WIND-TUNNEL DEVELOPMENT OF AN SR-71 AEROSPIKEROCKET FLIGHT TEST CONFIGURATION
Timothy R. Moes,* Brent R. Cobleigh,*
Timothy R. Conners,* and Timothy H. Cox†
NASA Dryden Flight Research CenterEdwards, California
Stephen C. Smith,*
NASA Ames Research CenterMoffett Field, California
Norm Shirakata‡
Lockheed-Martin Skunk WorksPalmdale, California
Abstract
A flight experiment has been proposed to investigatethe performance of an aerospike rocket motor installedin a lifting body configuration. An SR-71 airplane wouldbe used to carry the aerospike configuration to thedesired flight test conditions. Wind-tunnel tests werecompleted on a 4-percent scale SR-71 airplane with theaerospike pod mounted in various locations on the upperfuselage. Testing was accomplished using sting andblade mounts from Mach 0.6 to Mach 3.2. Initial testobjectives included assessing transonic drag andsupersonic lateral–directional stability and control.During these tests, flight simulations were run withwind-tunnel data to assess the acceptability of theconfigurations. Early testing demonstrated that theinitial configuration with the aerospike pod near theSR-71 center of gravity was unsuitable because of largenosedown pitching moments at transonic speeds. Theexcessive trim drag resulting from accommodating thispitching moment far exceeded the excess thrustcapability of the airplane. Wind-tunnel testing continuedin an attempt to find a configuration suitable for flighttest. Multiple configurations were tested. Resultsindicate that an aft-mounted model configurationpossessed acceptable performance, stability, and controlcharacteristics.
*Aerospace Engineer. AIAA member.†Aerospace Engineer.‡Retired Aerospace Engineer.Copyright 1996 by the American Institute of Aeronautics and
Astronautics, Inc. No copyright is asserted in the United States underTitle 17, U.S. Code. The U.S. Government has a royalty-free license toexercise all rights under the copyright claimed herein for Governmentalpurposes. All other rights are reserved by the copyright owner.
1American Institute of Aero
Nomenclature
B.L. butt line, in.
drag coefficient
lift coefficient
rolling moment coefficient (stability axis)
pitching moment coefficient
zero lift pitching moment coefficient
yawing moment coefficient (stability axis)
surface pressure coefficient
side force coefficient
c.g. center of gravity
DFRC NASA Dryden Flight Research Center, Edwards, California
F.S. fuselage station, in.
KEAS equivalent airspeed, kn
LASRE Linear Aerospike SR-71 Experiment
M Mach number
m.a.c. mean aerodynamic chord
NTS National Technical Systems
SSTO single stage to orbit
W.L. waterline
wing reference plane angle of attack, deg
angle of sideslip, deg
increment from baseline SR-71 aircraft
CD
CL
Cl
Cm
Cm0
Cn
Cp
CY
α
β
∆
nautics and Astronautics

elevon deflection, deg
rudder deflection, deg
Aerodynamic Model Reference Quantities
bref reference span, 56.7 ft
cref reference chord = m.a.c., 37.7 ft
Sref reference area,1605 ft2
Xref longitudinal moment reference, F.S. 900 (25 percent m.a.c.)
Yref lateral moment reference, B.L. 0
Zref vertical moment reference, W.L. 100
Introduction
Recent emphasis on single-stage-to-orbit (SSTO)vehicle technology has led the National Aeronautics andSpace Administration (NASA) to request proposals foran SSTO Technology Demonstrator Flight Vehiclewhich has become known as the X-33. A contractorteam, led by Lockheed-Martin Corporation, Marrietta,Georgia, developed an X-33 concept which incorporatesa linear aerospike rocket engine in a lifting body vehicleconfiguration. The aerospike rocket was first developedand ground tested in the 1960’s.1,2 The principleadvantage of the aerospike rocket is the inherent altitudecompensation provided by the nozzle. Thiscompensation results in increased specific impulseperformance during the low-altitude portion of a flightwhen compared to a conventional bell nozzle rocket
(fig. 1). Altitude compensation is a result of the plumebeing able to expand to the slipstream static pressure.The slipstream pressure, however, is necessarily reducedbecause of flow expansion around the rocket nozzlecowl. This decrease in pressure causes the plume tooverexpand slightly; hence, an expected loss ofperformance occurs. This phenomenon has been labeledthe “slipstream effect” and is dependent on theconfiguration, Mach number, chamber pressure ratio,and Reynolds number.
In an effort to obtain data for the X-33 concept,Lockheed-Martin and Rocketdyne, Canoga Park,California (builder of the aerospike rocket), initiated aprogram with NASA to flight test the aerospike rocketengine using an SR-71 airplane as the carrier vehicle ina project known as the Linear Aerospike SR-71Experiment (LASRE). The aerospike rocket and itsassociated components, referred to as the aerospike pod,will be mounted on the SR-71 upper fuselage surfacecenterline. Figure 2 shows the pod installation on thewind-tunnel model. Note that the vertical tails of theSR-71 airplane were removed for this photograph. Theaerospike pod components are referred to as the canoe,kayak, reflection plate, and a half-span model of a liftingbody configuration. The canoe is installed on the SR-71fuselage and contains the gaseous hydrogen fuel andliquid water needed for cooling. The kayak, locatedbeneath the reflection plate and on top of the canoe, isused to incline the model at a 2° nosedown incidenceangle. This angle aligns the lower part of the model withthe local flow over the top of the SR-71 airplane. The
δe
δr
2American Institute of Aeronautics and Astronautics
Figure 1. Qualitative comparison of aerospike and bell nozzle specific impulse.
Specific impulse
Altitude
Sea level High altitude
Bell nozzle Aerospike nozzle
Bell nozzle
Aerospike nozzle
960227

Figure 2. Aerospike pod wind-tunnel installation.
Canoe
Reflection plateModel
Kayak
960228
reflection plate is mounted on top of the kayak topromote uniform flow in the region of the model. Liquidoxygen and ignitor materials required to operate theengine are located in the model. The model is mountedvertically so that sideslip of the SR-71 airplane impartsangle of attack on the model. Unlike an actual X-33configuration, the model has no camber so as not toproduce side force when the SR-71 airplane is at0° sideslip. The desired Mach number and altituderanges for the test extend to Mach 3.2 and an altitude of84,000 ft which are near the limits of the basic SR-71flight envelope.
A series of wind-tunnel tests was conducted tosupport this flight project. The objectives were to definea LASRE configuration that could successfully be flownto the desired test points and to identify any aircraftenvelope limitations. Principle areas of concern weretransonic drag, supersonic stability, and control.Aerodynamic increments obtained in the wind tunnelrepresent the aerodynamic changes caused by theaddition of the LASRE pod to the baseline SR-71airplane.
The excess thrust available for the SR-71 airplane isminimal at transonic speeds. As a result, minimizing thetransonic drag caused by the aerospike pod wasnecessary. The incremental drag obtained in wind-tunnel testing was incorporated into simulations ofcomplete flight profiles. These simulations were done to
determine if the configuration could meet the testobjectives and to develop flight techniques for thetransonic acceleration that would minimize fuel usage.
Stability and control issues investigated in the windtunnel were primarily lateral–directional at takeoff andlanding speeds and at the maximum Mach number. Atlow speeds, the cross-wind landing criterion with oneengine not functioning needed to be satisfied with theaerospike pod configuration. At supersonic speeds,the SR-71 lateral–directional stability minimum occursat Mach 3.2. Ensuring that the aerospike podconfiguration does not significantly reduce the stabilityat Mach 3.2 was necessary. The incremental stabilityand control derivatives were added to the flightsimulations to assess handling qualities and enveloperestrictions caused by control surface authoritylimitations.
This report presents selected results from three wind-tunnel entries and flight simulation results based onwind-tunnel data. Potential flow analyses are alsopresented to help interpret the wind-tunnel results. Thediscussion of the results includes the unexpectednosedown pitching moment encountered with the firstconfiguration tested and the solution to the pitchingmoment problem by altering the location of aerospikemodel; drag, stability, and control of variousconfigurations; envelope limitations for the LASREconfiguration; and maximum Mach number
3American Institute of Aeronautics and Astronautics

Figure 3. Comparison between wind tunnel and flight Reynolds numbers (based on aerospike model length).
.50
10
20
30
40
50
60
1.0
Reynolds number, million
Flight test
envelope
1.5 2.0Mach number
2.5 3.0 3.5
960229
Wind tunnel
7 ft 4 ft
performance expected in flight. Use of trade names ornames of manufacturers in this report does notconstitute an official endorsement of such products ormanufacturers, either expressed or implied, by NASA
Wind-Tunnel Facilities
Two wind-tunnel facilities were used to test theLASRE configuration: the National Technical Systems(NTS) 4- × 4-ft blowdown wind tunnel in Saugus,California,¶ and the MicroCraft 7- × 7-ft blowdownwind tunnel in El Segundo, California.** Minimumoperating Reynolds numbers were adequate for thesetests; therefore, these Reynolds numbers were used toconserve tank pressure and to maximize the timeavailable for testing. Figure 3 shows a comparison ofwind-tunnel and flight Reynolds numbers data. Themodel installation and test procedures for each facilityare described next.
NTS 4- × 4-ft Blowdown Wind Tunnel
The model was tested from Mach 0.6 to Mach 3.2. Atransonic cart was inserted in the wind tunnel for testingat Mach 1.4 and below. The 22-percent porous walls ofthe transonic cart were actively suctioned to minimize
¶Wind Tunnel User’s Manual, Kelly Johnson Research andDevelopment Center at Rye Canyon, Lockheed Aeronautical SystemsCompany, Fluid Dynamics Laboratory, June 1990. [NTS; Rye CanyonResearch, Development, and Test Center; 25100 Rye Canyon Road;Building 202; Valencia, California 91355, Telephone: (805) 259-8184,FAX: (805)257-3539]
**Mennell, R.C., MicroCraft Trisonic Wind Tunnel User’s Manual,NA-90-1484, MicroCraft, Inc., El Segundo, California, Jan. 18, 1994.[MicroCraft, Inc., Trisonic Wind Tunnel; 400 Duley Rd.; El Segundo,California 90245, Telephone: (310) 335-1585, FAX: (310) 640-1056]
reflected shocks and to set subsonic and transonic Machnumbers. The transonic cart was removed for Mach 1.6and above. Supersonic Mach number was controlled bycontouring the upstream nozzle. At 8° angle of attack, α,wind-tunnel blockage was approximately 4.7 percent.
The model was supported with a sting mount enteringthe aft end of the fuselage. The force and momentbalance was aligned with the fuselage reference plane ofthe model. Angle of attack was referenced to the wingreference plane which has an incidence angle of –1.2°with respect to the fuselage reference plane. A standardsix-component balance was used for Mach 2.0 andbelow.
A five-component instrumented sting was speciallyfabricated and used from Mach 1.6 to Mach 3.2. Theinstrumented sting was necessary because the standardbalance was not expected to be able to withstand thewind-tunnel start-up loads at the high Mach numbers.The five-component instrumented sting did not have anaxial force measurement; therefore, lift and drag couldnot be computed.
The majority of the longitudinal aerodynamics datawas obtained during angle-of-attack sweeps at 0°sideslip. Some angle-of-attack sweeps were also done at–5° sideslip. Lateral–directional data were obtainedduring angle-of-sideslip sweeps with an angle of attackof 4° (approximate cruise flight value).
MicroCraft 7- × 7-ft Blowdown Tunnel
The model was tested from Mach 0.6 to Mach 1.6. Alltesting was done in the transonic section which had19.7-percent porous walls. Mach number was controlled
4American Institute of Aeronautics and Astronautics

in the test section by adjusting the flexible nozzle, thedownstream diffuser configuration, and a Mach numbercontrol flap which operated at 40 Hz. At 8° angleof attack, wind-tunnel blockage was approximately1.5 percent.
The model was supported by a blade mount attachedto the fuselage underside. A six-component balance wasinstalled in the model to obtain the aerodynamic loads.Mach number was limited to Mach 1.6 because of wind-tunnel start-up loads on the balance. Angle-of-attacksweeps were used to obtain longitudinal data. Angle-of-attack sweeps at –5° sideslip were used to obtainlateral–directional data because angle-of-sideslipsweeps were not possible using the blade mount.
Wind-Tunnel Models
An existing 4-percent scale model of the SR-71airplane was used for these tests. The main fuselage andwings were constructed of cast bronze. Aluminum wasused for the forebody and tails. Flow through inlets wereused for the model. The aft fuselage and inboard elevonswere modified to accommodate the sting mount at the4-ft tunnel. The true aft fuselage was used at the 7-fttunnel test in which the model was blade mounted. Thevertical tails were manually positioned with brackets for0°, 5°, and 10° rudder deflections. Separate inboardelevons were fabricated for –10°, 0°, and 10° elevondeflections.
The aerospike pod consisted of a canoe, reflectionplate, model, and, in some cases, a kayak (fig. 2). Thepod was tested in various locations on the SR-71airplane. The two primary configurations were referred
to as the forward model and aft model (figs. 4 and 5).The majority of the pod components were fabricated ofaluminum. The lone exception is the reflection platewhich was fabricated of stainless steel. Two canoes wereused. The first canoe was used with the forward modelconfiguration, and the slightly longer second canoe wasused with the aft model configuration. Use of the kayakwas limited to the aft model configuration. Grit stripswere used on the pod to create a turbulent boundarylayer over the pod components at approximately5-percent chord. The grit grain was sized to 0.0034 in.for all tests.
Wind-Tunnel Testing
Table 1 summarizes the wind-tunnel test sequence.The first wind-tunnel entry occurred at the NTS 4- × 4-fttunnel. The initial LASRE configuration tested was theforward model configuration (fig. 4). After testingnumerous configurations, the final configuration testedwas an initial aft model configuration. Because of thelimited amount of wind-tunnel time remaining, only apartial set of aerodynamic data was obtained for thisconfiguration. Before the second wind-tunnel entry, theaft model configuration was modified slightly byextending the length of the canoe and adding the sectionknown as the kayak to incline the reflection plate 2°nosedown (fig. 5).
The second wind-tunnel entry occurred at theMicroCraft 7- × 7-ft wind tunnel because it couldaccommodate a blade mount. The blade mount wasnecessary because testing the configuration with the trueSR-71 aft fuselage was desired. Testing was primarilyon the aft model configuration from Mach 0.6 to
5American Institute of Aeronautics and Astronautics
Table 1. Wind-tunnel test summary.
Entry Facility Mount BalanceMach
number Objectives
1 NTS Sting Six component 0.6–2.0Transonic dragStabilityRudder effectiveness
Five component 2.5–3.2StabilityRudder effectiveness
2 MicroCraft Blade Six component 0.6–1.6
Transonic dragStabilityRudder effectivenessElevon effectiveness
3 NTS Sting Five component 1.6–3.2StabilityRudder effectivenessElevon effectiveness

Figure 4. LASRE forward model configuration.
F.S.934.5
F.S.900
F.S.736.5
F.S.102
F.S.754.5 F.S.1226.5
20°2°
F.S.1295Sting mount
F.S.1355
57.8 in.
W.L.131
W.L.154.9F.S.726.5
F.S.102
B.L.45B.L.16.5
45°
F.S.736.5
F.S.1355
F.S.1226.5
F.S.1295
B.L.58.8Sting mount
960230
Mach 1.6. Data were also obtained for the forwardmodel configuration at Mach 1.1 with the modified andtrue SR-71 aft fuselages. For this entry, elevoneffectiveness was also tested.
The final entry occurred at the NTS 4- × 4-ft windtunnel. The instrumented sting was used for testing theaft model configuration from Mach 1.6 to Mach 3.2. Thestandard balance was not used for Mach 2.0 and belowto save wind tunnel set up time. In addition, drag wasnot a required measurement for these tests. Elevoneffectiveness was again tested with special elevonsfabricated to accommodate the sting mount.
Aerodynamic Model
Aerodynamic data for the baseline SR-71 and LASREconfigurations were obtained in these wind-tunnel tests.Increments in the aerodynamic coefficients andderivatives were calculated by subtracting the wind-tunnel baseline SR-71 data from the wind-tunnel datafor the LASRE configuration. These increments werethen added to the baseline SR-71 rigid bodyaerodynamic model3 to obtain the LASRE aerodynamicmodel. This model was then used in the simulations forperformance, stability and control, handling qualitiesanalysis, mission planning, and crew training.
6American Institute of Aeronautics and Astronautics

Figure 5. LASRE aft model configuration.
45°
B.L.16.5
B.L.340.2
B.L.58.8
Sting mount
B.L.45B.L.16.5
9.76°9.76°
F.S.1033.0
F.S.1041.9
F.S.1196.5
F.S.1230.9
F.S.1244.6Sting mount
F.S.1295F.S.1355
2°57.8 in.
F.S.102
W.L.131
W.L.154.2
F.S.749.6 F.S.900
F.S.1023.0
960231
Flexibility corrections to the rigid body aerodynamicsof the baseline SR-71 airplane are documented inreference 3 and included in the simulation. No attemptwas made to identify the flexibility corrections causedby the addition of the LASRE pod. The force andmoment equations used in the simulations are shownbelow with the inclusion of the increments measuredduring wind-tunnel testing. The form of these equationswas determined as a result of the wind-tunnel testing.The only increments included in the aerodynamic modelwere those needed to adequately represent the LASREconfiguration aerodynamics. Some of these increments
are a function of Mach number; whereas, others are afunction of Mach number and angle of attack.
CL CLBaseline= ∆CL M α,( )+
CD CDBaseline= ∆CD M α,( )+
Cm CmBaseline∆Cm M α,( ) ∆Cmδe
M( )δe+ +=
7American Institute of Aeronautics and Astronautics

The reference area for the SR-71 airplane is 1605 ft2,the reference chord is 37.7 ft, and the reference span is56.7 ft. The moment reference is located at fuselagestation (F.S.) 900, waterline (W.L.) 100, and butt line(B.L.) 0.
Wind-Tunnel Comparisons
A limited number of data comparisons between thetwo wind-tunnels was made. Of particular interest werethe transonic results because reflected shocks and tunnelblockage in these small wind tunnels were a concern.Figure 6 shows comparisons for the aft modelconfiguration. The transonic data in the 7-ft tunnel weretaken with the final aft model configuration. Thetransonic data in the 4-ft tunnel came from the first windtunnel entry before the final configuration wasestablished. The configuration used in the 4-ft tunneltest did not include the kayak, and the reflection platewas not inclined 2°. The reflection plate was raisedapproximately 3/16 in. at three post locations. Inaddition, the length of the canoe was slightly shorter inthe 4-ft tunnel test. The aerodynamic effect of thesedifferences was assumed to be minor.
The untrimmed drag data showed excellent agreementbetween the two tunnels for supersonic Mach numbers(fig. 6(a)). The 7-ft wind tunnel showed significantlylarger drag increments for Mach 0.9 and Mach 0.95 thanthe 4-ft wind tunnel. The reason for this difference isunknown. Because blockage was low for the 7-ft tunneland these results were conservative, the drag incrementsfrom this 7-ft tunnel were used in the subsequentperformance studies. Figure 6(b) shows the pitchingmoment increments at 4° angle of attack for the twowind tunnels. The shapes of these curves agree wellas seen in the peak nosedown pitching moment atMach 0.9 and the peak nose-up pitching moment atMach 1.05.
Wind-Tunnel Measurement Accuracies
The expected accuracies of the internal six-component balances used were 0.25 percent of appliedload. The expected accuracy of the five-component
instrumented sting was 1 percent of applied load. Goodrepeatability of these data within this accuracy wasdemonstrated at the 7-ft tunnel. Repeatability was not asgood at the 4-ft tunnel when comparisons were made ofruns from different days.
On the other hand, good repeatability was obtained inthe 4-ft tunnel for data runs that occurred during sameday testing. In terms of force and moment accuracies atthis wind tunnel, the worst repeatabilities resulted in
differences of 0.006, differences of 0.03,and differences of 0.0025. The force and momentbalance results presented here are more nearly accuratethan these quoted differences because wherever possibleincrements were obtained from same day testing.
(a) Untrimmed drag increment.
(b) Pitching moment increment.
Figure 6. Comparisons of data from the 4- and 7-ft windtunnels for the LASRE aft model configuration.
CY CYBaseline∆CYβ
M α,( )β ∆CYδrM( )δr+ +=
Cl ClBaseline∆Clβ
M α,( )β ∆ClδrM( )δr+ +=
Cn CnBaseline∆Cnβ
M α,( )β ∆CnδrM( )δr+ +=
∆Cm ∆CL∆CD
.002
.004
.006
.008
.010
.012
.014
1.0.5 1.5 2.0 2.5
∆CD
Mach number
4° angle of attack
960232
Wind tunnel
7 ft 4 ft
–.020
–.015
–.010
–.005
0
.005
1.0.5 1.5 2.0 2.5
∆Cm
Mach number
4° angle of attack
960233
Wind tunnel
7 ft 4 ft
8American Institute of Aeronautics and Astronautics

The majority of the flow angle accuracies were wellwithin 0.2°. The 7-ft tunnel flow angle data wereexpected to be within 0.1° because there was not muchdeflection of the blade mount. On the other hand, some“slop” in the installation was attributed to an unknownerror of ±0.05°. For the sting-mounted tests at the 4-fttunnel, additional uncertainty existed because of fairlylarge sting deflections.
Potential Flow Computer Tools
A computational analysis of the LASRE configurationwas conducted to validate the wind-tunnel results and toallow diagnosis of the aerodynamic phenomenonassociated with many of the LASRE configurationstested. The two codes used in this study are commonlyknown as A5024 and TranAir.5,6 The A502 code, alinear potential (Prandtl-Glauret) flow solver, was runon a workstation and is useful for subsonic andsupersonic flows but not for transonic. TranAir is afinite-element, full-potential flow solver and can,therefore, be run at transonic Mach numbers. TranAirwas run on a Cray C-90 (Cray Research, Inc.,Minneapolis, Minnesota) computer at the NASA AmesResearch Center, Moffett Field, California. The inputgrid for A502 and TranAir is identical.
Flight Simulation
Flight simulations using the LASRE aerodynamicdatabase were integral to developing the finalconfiguration. These simulations assessed performance,stability and control, and handling qualities associatedwith the various configurations. Flight simulations wereconducted concurrently with wind-tunnel testing, andthe results were used to modify the wind-tunnel testplan.
Three simulations were used at DFRC duringdevelopment of the LASRE configuration. Thesesimulations are referred to as the batch sim,performance sim, and real-time sim. The batch sim wasrun on a workstation for a prescribed flight trajectory.Outputs from the batch sim were used for stability andcontrol, handling qualities, operational limits, andperformance analyses. The trimmed drag outputs fromthe prescribed trajectory were the primary input to theperformance sim. The performance sim was also run ona workstation and was used to assess transonic andmaximum Mach number performance of the LASREconfiguration. The real-time sim is a full-cockpit,piloted simulation in which project pilots could developflight trajectories and assess handling qualities.Developing a flight trajectory that would minimize the
fuel use during the acceleration through the transonicMach numbers and, therefore, maximize the final Machnumber attainable for testing was of particular interest.
Results and Discussion
This section presents representative wind-tunnelresults and some comparisons with potential flowresults. The forward model configuration is discussedfirst because it was the initial LASRE configuration.This configuration was unacceptable because of anexcessive amount of nosedown pitching moment attransonic speeds. Numerous configuration investigationsrevealed that the aft model configuration wasacceptable. A discussion of the aerodynamics associatedwith the aft model configuration is followed by adescription of the causes of the nosedown pitchingmoment. This section concludes with the ramificationsof the aerospike pod on SR-71 performance and control.
Forward Model Configuration
Figure 4 shows the forward model configuration.Before wind-tunnel testing, this configuration was thebaseline for the LASRE project because of center ofgravity (c.g.) and flow quality considerations. Theaerodynamic model increments obtained for the forwardmodel configuration are tabulated in appendix A.
Longitudinal aerodynamic increments are tabulated intables A-1, A-2, and A-3. Trim angle of attack for theSR-71 airplane is roughly 4° for the majority of theflight Mach numbers. Figure 7 shows the untrimmeddrag and pitching moment increment curves for 4° angle
0
.002
.004
.006
.008
.010
.012
.014
1.0.5 1.5 2.0 2.5
∆CD
Mach number
4° angle of attack
960234
(a) Untrimmed drag increment.
Figure 7. Aerodynamic increments caused by the aero-spike pod with the model in the forward position.
9American Institute of Aeronautics and Astronautics

of attack. These data were obtained in the 4-ft windtunnel. The peaks in the drag and pitching momentoccur at Mach 1.1. For 4° angle of attack, the maximumuntrimmed drag increment is 128 drag counts (fig. 7(a)),and the maximum nosedown pitching momentincrement is 0.0208 (fig. 7(b)). This amount ofnosedown pitching moment is excessive, and the causeis discussed in the Nosedown Pitching Momentsubsection.
Figure 8 shows the trim drag penalty associated withthe forward model configuration. The flight simulatorsshowed that the combined pod and trim drag incrementwas greatly in excess of the power available foracceleration through the transonic Mach numbers.
Hinge moment analysis also showed that there was notenough actuator control power for trim.
Lateral–directional stability of the forward modelconfiguration was investigated in the 4-ft tunnel. Themodel was swept through ±8° angle of sideslip with theangle of attack set to a value near the expected trimangle of 4°. Data were obtained at four Mach numbers(table A-4).
Figure 9 shows the yawing and rolling moment
sideslip derivatives for the baseline SR-71 airplane and
the forward model LASRE configuration. The is
significantly reduced for the LASRE configuration and
rapidly approached instability as the Mach number
increased. This configuration would have resulted in the
LASRE being limited to a maximum of approximately
Mach 1.9 because of decreased directional stability. The
rolling moment derivative, , demonstrated an
unexpected decrease in rolling stability. It was thought
that this derivative would become more negative
because of the large lifting body above the SR-71
centerline.
Aft Model Configuration
Figure 5 shows the aft model configuration. Thecomplete set of aerodynamic model increments
∆Cm
–.025
–.020
–.015
–.010
–.005
0
1.0.5 1.5 2.0Mach number
4° angle of attack
960235
(b) Pitching moment increment.
Figure 7. Concluded.
.012
.010
.008
.006
.004
.002
01.0.5 1.5 2.0 2.5
∆CD
Mach number
4° angle of attack
960236
Figure 8. Trim drag increment caused by the aerospikepod with the model in the forward position.
.003
.002
.001
0
–.001
–.002
Stability derivative,
deg
Stable Cnβ
Approximately 4° angle of attack
1.0.5 1.5 2.0 2.5 3.0Mach number
960237
Baseline SR-71 Clβ
Baseline SR-71 Cnβ LASRE forward configuration Clβ
LASRE forward configuration Cnβ
Stable Clβ
Figure 9. Yawing and rolling moment sideslip deriva-tives for the baseline SR-71 airplane and the LASREforward model configuration.
Cnβ
Clβ
10American Institute of Aeronautics and Astronautics
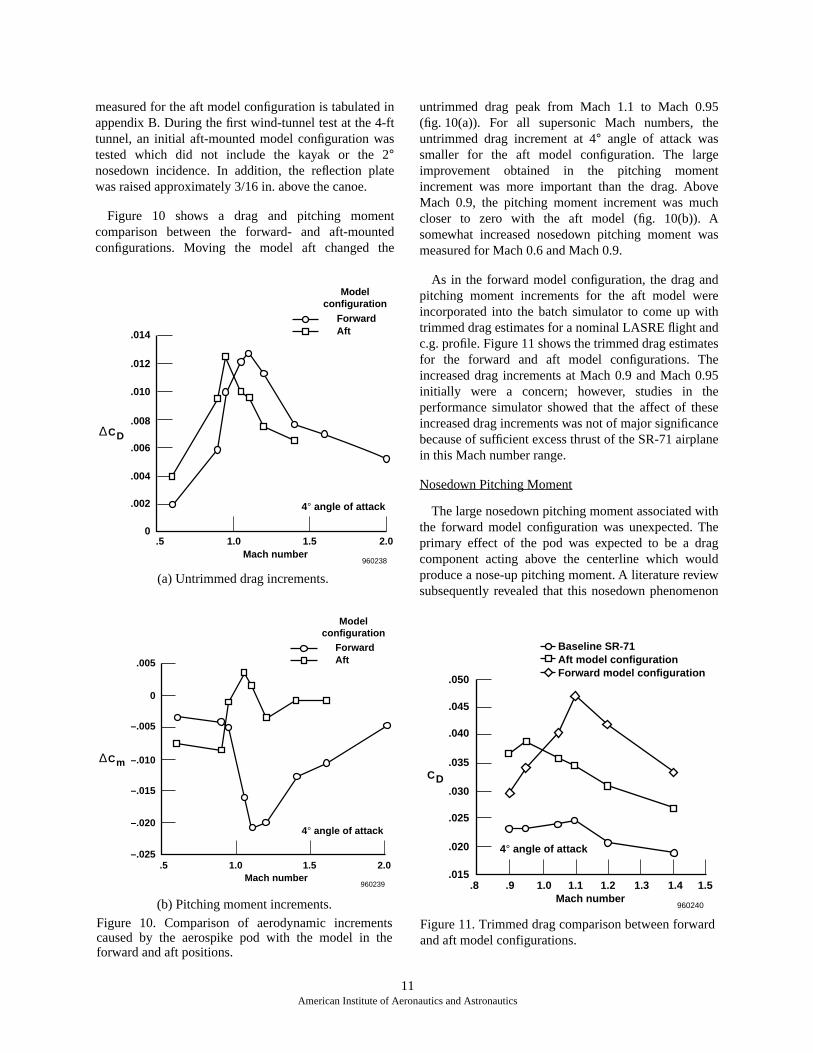
measured for the aft model configuration is tabulated inappendix B. During the first wind-tunnel test at the 4-fttunnel, an initial aft-mounted model configuration wastested which did not include the kayak or the 2°nosedown incidence. In addition, the reflection platewas raised approximately 3/16 in. above the canoe.
Figure 10 shows a drag and pitching momentcomparison between the forward- and aft-mountedconfigurations. Moving the model aft changed the
untrimmed drag peak from Mach 1.1 to Mach 0.95(fig. 10(a)). For all supersonic Mach numbers, theuntrimmed drag increment at 4° angle of attack wassmaller for the aft model configuration. The largeimprovement obtained in the pitching momentincrement was more important than the drag. AboveMach 0.9, the pitching moment increment was muchcloser to zero with the aft model (fig. 10(b)). Asomewhat increased nosedown pitching moment wasmeasured for Mach 0.6 and Mach 0.9.
As in the forward model configuration, the drag andpitching moment increments for the aft model wereincorporated into the batch simulator to come up withtrimmed drag estimates for a nominal LASRE flight andc.g. profile. Figure 11 shows the trimmed drag estimatesfor the forward and aft model configurations. Theincreased drag increments at Mach 0.9 and Mach 0.95initially were a concern; however, studies in theperformance simulator showed that the affect of theseincreased drag increments was not of major significancebecause of sufficient excess thrust of the SR-71 airplanein this Mach number range.
Nosedown Pitching Moment
The large nosedown pitching moment associated withthe forward model configuration was unexpected. Theprimary effect of the pod was expected to be a dragcomponent acting above the centerline which wouldproduce a nose-up pitching moment. A literature reviewsubsequently revealed that this nosedown phenomenon
0
.004
.002
.006
.008
.010
.012
.014
1.0.5 1.5 2.0
∆CD
Mach number
4° angle of attack
960238
Model configuration
Forward Aft
.005
0
–.005
–.010
–.015
–.020
–.025
∆Cm
4° angle of attack
1.0.5 1.5 2.0Mach number
960239
Model configuration
Forward Aft
(b) Pitching moment increments.
Figure 10. Comparison of aerodynamic incrementscaused by the aerospike pod with the model in theforward and aft positions.
(a) Untrimmed drag increments.
.050
.045
.040
.035
.030
.025
.020
.015
CD
.8 .9 1.0 1.1 1.2 1.51.3 1.4Mach number
4° angle of attack
960240
Baseline SR-71 Aft model configuration Forward model configuration
Figure 11. Trimmed drag comparison between forwardand aft model configurations.
11American Institute of Aeronautics and Astronautics

was not without precedent. A search of the Lockheed-Martin archives uncovered a wind-tunnel test in which atop-mounted payload caused a similarly large nosedownpitching moment.7
Because trim drag is a key performance issue in thedesign, an effort was made to understand the causes ofthe nosedown pitching moment. A component buildupof the configuration and an investigation into the aftfuselage effects were conducted in the wind tunnel.Potential flow analyses were also done to helpunderstand this phenomenon.
Component Buildup
The additive pitching moment effects of theindividual components of the forward modelconfiguration were measured at Mach 1.1 and Mach 1.6in the 4-ft tunnel. The component buildup consisted ofthe baseline SR-71 airplane and then individuallyadding the canoe, reflection plate, and model. ForMach 1.1, the addition of the canoe alone wasresponsible for the majority of the negative shift(fig. 12).
The team speculated that for supersonic Machnumbers, the shock on the bow of the canoe caused ahigh-pressure region forward of the moment reference(F.S. 900). In addition, expansion fans on the aft end ofthe canoe caused a low-pressure region far aft of themoment reference. Both of these effects wouldcontribute to a nosedown pitching moment. Theaddition of the reflection plate had minimal affect on thepitching moment. The addition of the model increased
the nosedown pitching moment for angles of attackgreater than 0°. For angles of attack greater than 3°, one-half of the nosedown pitching moment was caused bythe canoe, and one-half was caused by the model.Similar results were shown in the component buildup atMach 1.6 (fig. 13). At Mach 1.6, the model added a
approximately equal to that of the canoe.
Aft Fuselage Effects
For the first wind-tunnel test, the aft fuselage of theSR-71 airplane was modified to accommodate the stinginstallation. Uncertainty existed as to whether or not themodification contributed to the large nosedown pitchingmoment. The second wind-tunnel test provided anopportunity to determine if there was an effect becausethe model was blade-mounted and had the true aftfuselage. The baseline SR-71 airplane and forwardmodel configurations were tested with the actual andmodified SR-71 aft fuselages.
Figure 14 shows the results for Mach 1.1.Figure 14(a) shows the pitching moment as a function ofangle of attack, and figure 14(b) shows the pitchingmoment increments. The aft fuselage modification didnot significantly affect the nosedown pitching momentincrement at any angle of attack (fig. 14(b)).
Potential Flow Analysis
TranAir analyses were done at Mach 1.1 to assess theinfluence of the canoe and the SR-71 aft fuselage on thepitching moment. In the component buildup phase ofthe wind-tunnel test, results were obtained for the
Cm0
.02
.01
0
–.01
–.02
–.03
–.04
–.05
–.06
Cm
–2 0 2 4 6 108Angle of attack, deg
960241
Baseline SR-71 Canoe only Canoe and reflection plane Model in forward position
Figure 12. Pitching moment coefficient for the forwardmodel configuration component buildup at Mach 1.1 inthe 4-ft wind tunnel.
Cm0
Baseline SR-71 Canoe only Canoe and reflection plane Model in forward position
.03
.02
.01
0
–.01
–.02
–.03
–.04
–.05
Cm
–2 0 2 4 6 108Angle of attack, deg
960242
Figure 13. Pitching moment coefficient for the forwardmodel configuration component buildup at Mach 1.6 inthe 4-ft wind tunnel.
12American Institute of Aeronautics and Astronautics

canoe-only configuration with the SR-71 aft fuselagemodified for the sting mount.
Figure 15 shows pitching moment increments causedby the canoe from TranAir and the wind tunnel. TheTranAir increments agree well with the wind-tunneldata. In addition, TranAir validated that the SR-71 aftfuselage configuration had no major affect on thepitching moment increment.
Figure 16 displays TranAir surface pressures for thebaseline SR-71 airplane and canoe-only configurationsat 4° angle of attack. A high-pressure region existsforward of the canoe, and a low-pressure region existsaft of the canoe as compared to the baseline SR-71airplane (figs. 16(a) and 16(b)).
These pressures can also be seen in the fuselagesurface pressure distribution for B.L. 19.4 (which isslightly outboard of the canoe outer wall at B.L. 15.0)(fig. 17). Recalling that the moment reference is atF.S. 900 easily clarifies how the canoe alone can cause anosedown pitching moment. A shock is formed off thebow of the canoe, pressurizing the SR-71 fuselageforward of the canoe. In addition, an expansion fan isextended at the end of the canoe, lowering the pressureon the fuselage.
Unlike the supersonic data, wind-tunnel results(fig. 10(b)) showed that subsonically the aft modelconfiguration had a larger nosedown pitching momentincrement than the forward model configuration. Toidentify the reason for this, A502 code analyseswere completed at Mach 0.6 for the baseline SR-71airplane, canoe-only, forward model, and aft modelconfigurations. For the forward configuration, theA502 code predicted a pitching moment increment of–0.0018; whereas, the wind-tunnel increment was–0.0034. For the aft model configuration, A502 codepredicted an increment of –0.0076; whereas, the wind-tunnel increment was –0.0084. Hence, A502 codeconcurred that the pitching moment becameincreasingly negative as the model was moved aft.
Baseline SR-71 (true aft fuselage) Forward model (true aft fuselage) Baseline SR-71 (modified aft fuselage) Forward model (modified aft fuselage)
.04
.02
0
–.02
–.04
–.06
Cm
– 4 – 2 0 4 62 8Angle of attack, deg
960243
0
–.005
–.010
–.015
–.020
∆Cm
–2 0 2–4 4 6 8Angle of attack, deg
960244
True SR-71 aft fuselage Modified SR-71 aft fuselage
(a) Pitching moments.
(b) Pitching moment increments.
Figure 14. Comparison of pitching moment effectscaused by the true SR-71 aft fuselage and the modifiedaft fuselage for the forward model configuration(Mach 1.1, 7-ft wind tunnel).
0
–.005
–.010
–.015
–.020
∆Cm
0 2–2 4 6 8Angle of attack, deg
960245
Wind tunnel with modified aft fuselage TranAir with modified aft fuselage TranAir with true SR-71 aft fuselage
Figure 15. Comparison of TranAir and wind-tunnelresults for the canoe-only configuration at Mach 1.1.
13American Institute of Aeronautics and Astronautics

(a) Baseline SR-71 airplane.
(b) Canoe-only configuration.
Figure 16. TranAir surface pressure maps at Mach 1.1 and 4° angle of attack.
B.L. 19.4B.L. 19.4
960246Cp = -1.0
Cp = 0.5
Lower pressure
Higher pressure
B.L. 19.4
960247
14American Institute of Aeronautics and Astronautics

The baseline SR-71 airplane, canoe-only, forwardmodel, and aft model configuration pressure maps areshown in figures 18(a) through 18(d). Figure 19 showsthe chordwise pressure distributions for the 22-percentsemispan wing station. Note that for the canoe-onlyconfiguration, comparing figures 18(a) with figure 18(b)and from figure 19 reveals a slightly increased pressure
region forward of the canoe. More significantly, adecreased pressure region extends from the canoe to thewing at the location where the canoe width starts todecrease. The combination of these effects would causea nosedown pitching moment for the canoe-onlyconfiguration. The A502 code predicted a pitchingmoment increment of –0.0032 for the canoe-onlyconfiguration.
With the model installed, low-pressure regions areseen on the leading edge of the aerospike model and onthe SR-71 fuselage and wing adjacent to the model(figs. 18(c) and 18(d)). The extremely low-pressureregion on top of the model is unrealistic and related tothe fact that A502 is a potential flow code. Potential flowcodes do not accurately handle separated flow. Instead,such codes accelerate flows around sharp corners;however, this influence on the pitching momentincrement is small. The low-pressure region on thefuselage and wing adjacent to the model has the mostsignificant effect on pitching moment. In the forwardmodel position, this low-pressure region is forward ofthe moment reference location (F.S. 900) and, hence,reduces the nosedown pitching moment. For the aftmodel configuration, this low-pressure region combineswith the low-pressure flow around the aft end of thecanoe to increase the nosedown pitching moment.
.3
.2
.1
0
–.1
–.2
–.3
–.4
–.5
–.6
–.7
Cp
700 800 900600 1000 1100 13001200Fuselage station, in.
Canoe
Moment reference (F.S. 900)
960248
Baseline SR-71 Canoe-only configuration
Figure 17. TranAir pressure distributions at B.L. 19.4for the canoe-only configuration at Mach 1.1 and 4°angle of attack.
15American Institute of Aeronautics and Astronautics
(a) Baseline SR-71 airplane.
Figure 18. A502 surface pressure maps at Mach 0.6 and 4° angle of attack.
Cp = -1.0
Cp = 0.5
Canoe
960249

(b) Canoe-only configuration.
(c) Forward model configuration.
Figure 18. Continued.
Higher pressure
Lower pressure
960250
Low pressure regionadjacent to the model
960251
F.S. 900
16American Institute of Aeronautics and Astronautics
(d) Aft model configuration.
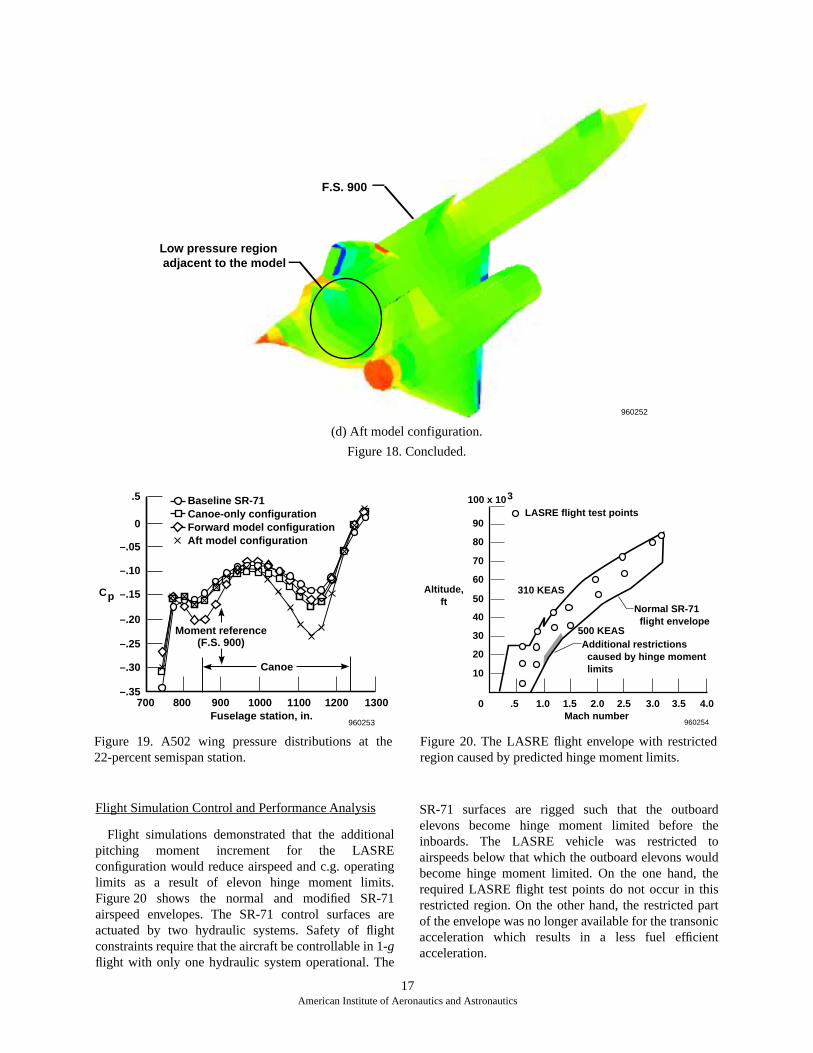
Figure 18. Concluded.
960252
Low pressure region adjacent to the model
F.S. 900
Flight Simulation Control and Performance Analysis
Flight simulations demonstrated that the additionalpitching moment increment for the LASREconfiguration would reduce airspeed and c.g. operatinglimits as a result of elevon hinge moment limits.Figure 20 shows the normal and modified SR-71airspeed envelopes. The SR-71 control surfaces areactuated by two hydraulic systems. Safety of flightconstraints require that the aircraft be controllable in 1-gflight with only one hydraulic system operational. The
SR-71 surfaces are rigged such that the outboardelevons become hinge moment limited before theinboards. The LASRE vehicle was restricted toairspeeds below that which the outboard elevons wouldbecome hinge moment limited. On the one hand, therequired LASRE flight test points do not occur in thisrestricted region. On the other hand, the restricted partof the envelope was no longer available for the transonicacceleration which results in a less fuel efficientacceleration.
Canoe
Baseline SR-71 Canoe-only configuration Forward model configuration Aft model configuration
Moment reference (F.S. 900)
.5
0
–.05
–.10
–.15
–.20
–.25
–.30
–.35
Cp
700 800 900 1000 1100 13001200Fuselage station, in.
960253
Figure 19. A502 wing pressure distributions at the22-percent semispan station.
40
30
20
10
0
100 x 103
90
80
70
60
50
.5 1.0 1.5 2.0 2.5 3.0 3.5 4.0Mach number
500 KEAS
310 KEASAltitude, ft
960254
LASRE flight test points
Normal SR-71 flight envelope
Additional restrictions caused by hinge moment limits
Figure 20. The LASRE flight envelope with restrictedregion caused by predicted hinge moment limits.
17American Institute of Aeronautics and Astronautics

Figure 21 shows how the airspeed limits were derived.These limits were based on the outboard hinge momentbeing limited in a dive maneuver. In this scenario, thevehicle climbs to an altitude of 33,000 ft at a constantMach 0.9 followed by a constant rate dive. Constantdescent rates from 1000 to 6000 ft/min are plotted infigure 21 for a 120,000 lbf aircraft with the c.g. at24-percent m.a.c. The outboard actuators are hingemoment limited at equivalent airspeeds ofapproximately 465 to 475 kn. The inboard elevons donot become limited for at least another 25 kn.
The piloted, real-time simulation was used with theLASRE mass and drag properties to estimate themaximum Mach number attainable with the aft modelconfiguration. The simulation was run with standardJ-58 engines (Pratt & Whitney, Palm Beach, Florida)and with engines upgraded for enhanced thrustperformance. The majority of the thrust enhancementwas derived from manually uptrimming the exhaust gastemperatures from Mach 1.0 to Mach 2.5. The entirepod weight was assumed to be 13,838 lb.
Figure 22 shows a level acceleration at an altitude of25,000 ft from Mach 0.75 to 450 KEAS followed by a450 KEAS climb at standard day atmosphericconditions. For operational reasons, the aircraftwas required to cease testing and return to base when20,000 lb of fuel remained. This requirement includes5000 lb of unusable fuel which was needed as forwardballast to counter the additional aft-mounted weight of the aerospike pod. With thrust enhancement, the vehicle
reached the desired Mach 3.2 with enough fuelremaining for approximately 2.5 min of cruise flightbefore having to return to base. Without enhancementthe vehicle only reached Mach 3.09 before having toreturn to base.
Figure 22 also shows results using a transonic climband dive maneuver. Starting at Mach 0.75 and analtitude of 25,000 ft, the vehicle accelerated at levelaltitude to Mach 0.9 for a constant Mach number climbto an altitude of 33,000 ft. At this point, a 3000 ft/mindescent was begun. At an altitude of 26,000 ft, a 450KEAS climb was initiated. Using thrust enhancement,the vehicle accelerated to Mach 3.2 with enough fuelremaining for 3.6 min of cruising flight before return tobase. Hence, the climb and dive maneuver provided asmall performance benefit in terms of fuel saved duringthe transonic portion of the acceleration.
Concluding Remarks
A series of wind-tunnel tests was completed insupport of the Linear Aerospike SR-71 Experiment
30
25
20
15
10
60 x 103
55
50
45
40
35
.9
KEAS = 400
KEAS = 450
KEAS = 475
KEAS = 500
6000 fpm
3000 fpm2000 fpm
1000 fpm
KEAS = 300
.8 1.0 1.1 1.2 1.3 1.4 1.5 1.6Mach number
Altitude, ft
960255
Outboard hinge moment limits with one hydraulic system
Inboard hinge moment limits with one hydraulic system
Figure 21. Airspeed limits in a dive maneuver causedby predicted outboard and inboard elevon hingemoment limits.
Level acceleration, no enhancement
Climb-dive acceleration, with enhancement
Level acceleration, with enhancement
70 x 103
65
60
55
50
45
40
35
30
25
20
151.0 2.01.5 2.5 3.0
Mach number
Return to base
Fuel quantity,
lb
960256
Figure 22. Performance simulation results for theLASRE configuration with and without thrustenhancement.
18American Institute of Aeronautics and Astronautics

flight test program. These tests identified problems withthe initial forward model configuration caused by anunexpected and excessive nosedown pitching moment.In addition, an aft model configuration that is expectedto meet performance, stability, and control requirementsduring the flight test program was identified. The causeof the nosedown pitching moment was investigated bycomponent buildup in the wind tunnel and withpotential flow computational analyses. For supersonicMach numbers, the nosedown pitching moment wascaused by the combination of a high-pressure regionforward of the canoe because of the bow shock and alow-pressure region aft of the canoe because of theexpansion fans.
The canoe alone caused a significant nosedownpitching moment. Adding the model in the forwardposition increased the nosedown pitching moment;whereas, adding the model in the aft position negatedthe majority of the canoe-induced nosedown pitchingmoment. The additional trim drag and elevon actuatorlimits associated with the forward model configurationprevented the vehicle from being able to acceleratethrough the transonic speeds and, hence, made thisconfiguration unacceptable. At subsonic Mach numbers,the nosedown pitching moment was worse for the aftmodel configuration. Potential flow analysis showedthat this effect was caused by a low-pressure regioncreated on the fuselage and wing adjacent to the model.The additional subsonic trim drag for the aft modelconfiguration did not significantly affect performance;hence, the aft model configuration was shown to haveacceptable drag and stability increments.
Ground-based flight simulations were critical inassessing the acceptability of these configurations.
These simulations focused on control authority andperformance. Envelope restrictions were applied to theLinear Aerospike SR-71 Experiment configurationbased on hinge moment limits. The real-time simulationwas used to verify that the aircraft could be acceleratedthrough the transonic Mach numbers. In addition, themaximum desired Mach number of Mach 3.2 wasobtainable although only a few minutes of test timewere available before having to cease testing and returnto base.
APPENDIX AFORWARD MODEL
AERODYNAMIC INCREMENTS
This appendix describes the aerodynamic modelincrements for the forward LASRE configuration(fig. 4). In creating these tables, conservative (readpessimistic) engineering judgements were always madein regard to LASRE performance, stability, and control.Data for this configuration are from the 4-ft wind tunnelfor Mach 0.6 through Mach 3.2. A completeaerodynamic model was not obtained in the wind tunnelbecause this configuration was not acceptable for theLASRE experiment. The data that were obtained arepresented here to document the aerodynamiccharacteristics of a payload mounted mostly forward ofthe pitching moment reference on top of the SR-71airplane.
Tables A-1 through A-3 list the drag, lift, and pitchingmoment increments as a function of Mach number andwing reference plane angle of attack.
Table A-1. The increment caused by the LASRE pod with the model in the forward position.
Angle of attack, deg
Mach number –2° –1° 0° 1° 2° 3° 4° 5° 6° 7° 8°
0.90 0.0039 0.0046 0.0050 0.0053 0.0054 0.0058 0.0059 0.0065 0.0066 0.0062 0.0082
0.95 0.0062 0.0059 0.0054 0.0086 0.0090 0.0080 0.0100 0.0095 0.0104 0.0093 0.0104
1.05 0.0082 0.0085 0.0089 0.0101 0.0109 0.0113 0.0121 0.0128 0.0128 0.0134 0.0126
1.10 0.0088 0.0090 0.0103 0.0109 0.0115 0.0124 0.0128 0.0133 0.0133 0.0133 0.0123
1.20 0.0082 0.0086 0.0094 0.0100 0.0105 0.0111 0.0113 0.0113 0.0114 0.0106 0.0095
1.40 0.0066 0.0070 0.0074 0.0079 0.0077 0.0070 0.0076 0.0075 0.0068 0.0071 0.0066
1.60 0.0058 0.0060 0.0065 0.0070 0.0068 0.0066 0.0068 0.0064 0.0060 0.0055 0.0055
2.00 0.0055 0.0060 0.0058 0.0058 0.0055 0.0051 0.0051 0.0052 0.0048 0.0045 0.0042
CD
19American Institute of Aeronautics and Astronautics

Table A-4 lists the side force, rolling moment, andyawing moment sideslip derivative increments. Thesedata were obtained using sideslip sweeps at a set angleof attack. The approximate angle of attack for eachMach number is listed in the table.
Table A-2. The increment caused by the LASRE pod with the model in the forward position.
Angle of attack, deg
Mach number –2° –1° 0° 1° 2° 3° 4° 5° 6° 7° 8°
0.90 0.0090 0.0080 0.0090 0.0090 0.0110 0.0090 0.0060 0.0080 0.0060 0.0060 0.0110
0.95 0.0020 0.0130 0.0180 0.0070 0.0070 0.0130 0.0110 0.0070 0.0060 0.0080 0.0070
1.05 0.0150 0.0170 0.0160 0.0200 0.0210 0.0200 0.0220 0.0210 0.0200 0.0150 0.0090
1.10 0.0200 0.0210 0.0210 0.0250 0.0240 0.0260 0.0260 0.0230 0.0230 0.0220 0.0180
1.20 0.0170 0.0150 0.0150 0.0180 0.0170 0.0180 0.0170 0.0140 0.0110 0.0040 0.0000
1.40 0.0070 0.0060 0.0030 0.0040 –0.0020 –0.0040 –0.0020 –0.0010 –0.0060 –0.0020 –0.0060
1.60 0.0000 0.0000 0.0000 0.0000 0.0000 0.0000 0.0000 0.0000 0.0000 0.0000 0.0000
2.00 –0.0100 –0.0100 –0.0100 –0.0100 –0.0100 –0.0100 –0.0100 –0.0100 –0.0100 –0.0100 –0.0100
CL
Table A-3. The increment caused by the LASRE pod with the model in the forward position.
Angle of attack, deg
Mach number –2° –1° 0° 1° 2° 3° 4° 5° 6° 7° 8°
0.90 –0.0039 –0.0034 –0.0039 –0.0044 –0.0041 –0.0042 –0.0042 –0.0059 –0.0068 –0.0069 –0.0111
0.95 –0.0027 –0.0063 –0.0075 –0.0037 –0.0038 –0.0057 –0.0050 –0.0061 –0.0064 –0.0073 –0.0092
1.05 –0.0072 –0.0084 –0.0101 –0.0116 –0.0130 –0.0146 –0.0160 –0.0169 –0.0162 –0.0159 –0.0147
1.10 –0.0077 –0.0115 –0.0129 –0.0143 –0.0160 –0.0183 –0.0208 –0.0219 –0.0222 –0.0227 –0.0225
1.20 –0.0129 –0.0142 –0.0160 –0.0175 –0.0190 –0.0199 –0.0199 –0.0191 –0.0197 –0.0156 –0.0137
1.40 –0.0163 –0.0144 –0.0147 –0.0146 –0.0132 –0.0129 –0.0128 –0.0124 –0.0115 –0.0119 –0.0119
1.60 –0.0160 –0.0140 –0.0130 –0.0135 –0.0130 –0.0120 –0.0105 –0.0095 –0.0090 –0.0095 –0.0095
2.00 –0.0055 –0.0055 –0.0050 –0.0050 –0.0045 –0.0045 –0.0045 –0.0043 –0.0040 –0.0045 –0.0050
Cm
Table A-4. Sideslip derivative increments caused by theLASRE pod with the model in the forward position.
Mach number
Angle of attack, deg
,
per deg
,
per deg
,
per deg
0.60 4.1° –0.00138 0.00031 –0.00078
0.95 5.2° –0.00055 0.00061 –0.00101
1.20 4.8° –0.00051 0.00089 –0.00104
2.00 4.6° –0.00008 0.00053 –0.00076
∆CYβ∆Clβ
∆Cnβ
20American Institute of Aeronautics and Astronautics

APPENDIX B AFT MODEL AERODYNAMIC
INCREMENTS
This appendix describes the aerodynamic modelincrements for the LASRE configuration with the modelmounted in the aft position (fig. 5). In creating thesetables, conservative engineering judgements werealways made in regard to LASRE performance, stability,and control. Data for this configuration are from the 7-ftwind tunnel for Mach 0.6 through Mach 1.6 and fromthe 4-ft wind tunnel for the higher Mach numbers.
Table B-1 lists the drag increment as a function ofMach number and wing reference plane angle of attack.Drag data at Mach 1.6 were not used because of ananomaly in these data. Mach 2 data were obtained in thefirst 4-ft wind tunnel test using the initial aft-mountedmodel configuration. This initial configuration hassimilar supersonic drag increments as the final aft-mounted model configuration (fig. 6(a)). The Mach 2.5and Mach 3.2 data were extrapolated from the Mach 2.0data using engineering analysis to adjust for thechanging wave drag. No viscous drag corrections weremade to account for the fact that wind-tunnel Reynoldsnumbers were less than flight Reynolds numbers. Theflight viscous drag component would be lower than thewind tunnel because of higher flight Reynolds numbers.
Because of the relatively small size of the aerospikepod, however, the viscous drag correction, at most, givesa reduction of six drag counts. In addition, these dragdata do not include trim drag increments associated withthe aft model configuration. Wind-tunnel data show thatdrag resulting from elevon deflection was not affectedby the model in the aft configuration.
Table B-2 lists the lift increment as a function ofMach number and wing reference plane angle of attack.These data were obtained from the 7-ft tunnel and fromMach 0.6 to Mach 1.6. Hold last values were used atinstances above Mach 1.6 and below Mach 0.6.
Table B-3 lists the pitching moment increment as afunction of Mach number and wing reference planeangle of attack.
Table B-4 lists the pitching moment elevoneffectiveness increment as a function of Mach number.Only the inboard elevons were adjusted in these testsbecause the outboard elevons were not expected to beaffected by the LASRE pod. The elevons used in the 4-ftwind tunnel at Mach 3.2 had a 33-percent spanreduction because of the aft end modificationto accommodate the sting mount. The incrementmeasured at Mach 3.2 was adjusted for a full-spanelevon; however, no significant increment in elevoneffectiveness was measured at Mach 3.2.
Table B-1. The increment caused by the LASRE pod with the model in the aft position.
Angle of attack, deg
Mach number –2° –1° 0° 1° 2° 3° 4° 5° 6° 7° 8°
0.00 0.0038 0.0038 0.0040 0.0042 0.0041 0.0041 0.0036 0.0034 0.0032 0.0028 0.0033
0.60 0.0038 0.0038 0.0040 0.0042 0.0041 0.0041 0.0036 0.0034 0.0032 0.0028 0.0033
0.90 0.0102 0.0103 0.0105 0.0105 0.0103 0.0100 0.0095 0.0091 0.0087 0.0082 0.0087
0.95 0.0143 0.0143 0.0143 0.0139 0.0132 0.0133 0.0129 0.0125 0.0117 0.0107 0.0109
1.05 0.0128 0.0125 0.0120 0.0116 0.0111 0.0106 0.0101 0.0095 0.0091 0.0088 0.0085
1.10 0.0122 0.0116 0.0112 0.0107 0.0101 0.0098 0.0094 0.0089 0.0084 0.0082 0.0081
1.20 0.0097 0.0091 0.0089 0.0085 0.0083 0.0081 0.0078 0.0078 0.0075 0.0075 0.0073
1.40 0.0066 0.0067 0.0066 0.0066 0.0067 0.0066 0.0065 0.0062 0.0058 0.0056 0.0054
1.60 0.0060 0.0061 0.0060 0.0060 0.0059 0.0058 0.0056 0.0055 0.0051 0.0047 0.0045
2.00 0.0049 0.0050 0.0047 0.0048 0.0044 0.0041 0.0040 0.0040 0.0037 0.0029 0.0025
2.50 0.0046 0.0047 0.0044 0.0045 0.0041 0.0038 0.0037 0.0037 0.0034 0.0026 0.0022
3.20 0.0043 0.0044 0.0041 0.0042 0.0038 0.0035 0.0034 0.0034 0.0031 0.0023 0.0019
CD
21American Institute of Aeronautics and Astronautics

Tables B-5 through B-7 list the side force, rollingmoment, and yawing moment sideslip derivativeincrements.
Table B-8 lists the side force, rolling moment, andyawing moment rudder control derivative increments asa function of Mach number.
Table B-2. The increment caused by the LASRE pod with the model in the aft position.
Angle of attack, degMach
number –2° –1° 0° 1° 2° 3° 4° 5° 6° 7° 8°
0.00 0.0046 0.0033 0.0052 0.0073 0.0017 0.0033 –0.0035 –0.0048 –0.0057 –0.0084 –0.00680.60 0.0046 0.0033 0.0052 0.0073 0.0017 0.0033 –0.0035 –0.0048 –0.0057 –0.0084 –0.00680.90 –0.0010 –0.0052 –0.0063 –0.0094 –0.0100 –0.0112 –0.0144 –0.0149 –0.0165 –0.0172 –0.01330.95 –0.0224 –0.0211 –0.0220 –0.0220 –0.0192 –0.0181 –0.0190 –0.0200 –0.0213 –0.0249 –0.02871.05 –0.0180 –0.0183 –0.0183 –0.0187 –0.0170 –0.0188 –0.0200 –0.0211 –0.0235 –0.0224 –0.01841.10 –0.0190 –0.0193 –0.0164 –0.0168 –0.0175 –0.0160 –0.0168 –0.0176 –0.0188 –0.0185 –0.02161.20 –0.0120 –0.0115 –0.0110 –0.0109 –0.0106 –0.0100 –0.0097 –0.0093 –0.0103 –0.0118 –0.01441.40 –0.0099 –0.0095 –0.0094 –0.0099 –0.0098 –0.0103 –0.0120 –0.0132 –0.0133 –0.0136 –0.00841.60 –0.0069 –0.0072 –0.0072 –0.0074 –0.0074 –0.0061 –0.0068 –0.0071 –0.0081 –0.0077 –0.00812.00 –0.0069 –0.0072 –0.0072 –0.0074 –0.0074 –0.0061 –0.0068 –0.0071 –0.0081 –0.0077 –0.00812.50 –0.0069 –0.0072 –0.0072 –0.0074 –0.0074 –0.0061 –0.0068 –0.0071 –0.0081 –0.0077 –0.00813.20 –0.0069 –0.0072 –0.0072 –0.0074 –0.0074 –0.0061 –0.0068 –0.0071 –0.0081 –0.0077 –0.0081
CL
Table B-3. The increment caused by the LASRE pod with the model in the aft position.
Angle of attack, degMach
number –2° –1° 0° 1° 2° 3° 4° 5° 6° 7° 8°
0.00 –0.0086 –0.0083 –0.0085 –0.0090 –0.0087 –0.0091 –0.0084 –0.0083 –0.0079 –0.0078 –0.00740.60 –0.0086 –0.0083 –0.0085 –0.0090 –0.0087 –0.0091 –0.0084 –0.0083 –0.0079 –0.0078 –0.00740.90 –0.0105 –0.0090 –0.0090 –0.0087 –0.0093 –0.0098 –0.0092 –0.0094 –0.0091 –0.0087 –0.00710.95 0.0038 0.0029 0.0027 0.0026 0.0010 –0.0002 –0.0006 –0.0008 –0.0008 0.0000 0.00101.05 0.0032 0.0036 0.0031 0.0040 0.0039 0.0039 0.0040 0.0040 0.0041 0.0032 0.00321.10 0.0030 0.0034 0.0027 0.0026 0.0027 0.0027 0.0020 0.0015 0.0013 0.0006 0.00151.20 –0.0013 –0.0015 –0.0022 –0.0025 –0.0027 –0.0030 –0.0033 –0.0035 –0.0036 –0.0032 –0.00261.40 –0.0017 –0.0015 –0.0016 –0.0014 –0.0012 –0.0011 –0.0008 –0.0006 –0.0011 –0.0013 –0.00191.60 –0.0011 –0.0011 –0.0011 –0.0010 –0.0008 –0.0010 –0.0010 –0.0010 –0.0007 –0.0005 –0.00032.00 0.0000 0.0002 0.0001 0.0000 0.0000 0.0000 0.0000 0.0002 0.0005 0.0011 0.00142.50 0.0016 0.0014 0.0008 0.0009 0.0011 0.0011 0.0014 0.0010 0.0008 0.0007 0.00113.20 0.0029 0.0026 0.0024 0.0027 0.0024 0.0023 0.0021 0.0022 0.0023 0.0022 0.0024
Cm
Table B-4. Elevon effectiveness increment caused by the LASRE pod with the model in the aft position.
Mach number
,
per deg0.0 0.000170.6 0.000171.1 0.000281.4 0.000083.2 0.00000
Cm
∆Cmδe
22American Institute of Aeronautics and Astronautics

Table B-5. The increment (per deg) caused by the LASRE pod with the model in the aft position.
Angle of attack, deg
Mach number –2° –1° 0° 1° 2° 3° 4° 5° 6° 7° 8°
0.00 –0.00092 –0.00070 –0.00080 –0.00127 –0.00064 –0.00112 –0.00106 –0.00114 –0.00120 –0.00110 –0.00114
0.60 –0.00092 –0.00070 –0.00080 –0.00127 –0.00064 –0.00112 –0.00106 –0.00114 –0.00120 –0.00110 –0.00114
0.95 –0.00144 –0.00160 –0.00133 –0.00145 –0.00142 –0.00154 –0.00127 –0.00082 –0.00073 –0.00070 –0.00040
1.10 –0.00027 –0.00007 0.00012 0.00026 0.00045 0.00054 0.00067 0.00022 0.00083 0.00032 0.00105
1.60 –0.00215 –0.00236 –0.00233 –0.00225 –0.00219 –0.00212 –0.00241 –0.00208 –0.00216 –0.00227 –0.00199
2.00 –0.00095 –0.00116 –0.00113 –0.00105 –0.00099 –0.00092 –0.00121 –0.00088 –0.00096 –0.00107 –0.00079
3.20 –0.00080 –0.00077 –0.00052 –0.00037 –0.00044 –0.00036 –0.00034 –0.00036 –0.00030 –0.00027 –0.00012
Table B-6. The increment (per deg) caused by the LASRE pod with the model in the aft position.
Angle of attack, deg
Mach number –2° –1° 0° 1° 2° 3° 4° 5° 6° 7° 8°
0.00 0.00023 0.00023 0.00023 0.00022 0.00023 0.00027 0.00025 0.00031 0.00023 0.00037 0.00034
0.60 0.00023 0.00023 0.00023 0.00022 0.00023 0.00027 0.00025 0.00031 0.00023 0.00037 0.00034
0.95 0.00028 0.00024 0.00026 0.00028 0.00032 0.00035 0.00031 0.00035 0.00031 0.00040 0.00048
1.10 0.00051 0.00048 0.00043 0.00044 0.00038 0.00034 0.00025 0.00019 0.00020 0.00019 0.00038
1.60 0.00026 0.00030 0.00030 0.00030 0.00032 0.00031 0.00029 0.00032 0.00031 0.00030 0.00032
2.00 0.00021 0.00025 0.00025 0.00024 0.00026 0.00026 0.00023 0.00027 0.00025 0.00024 0.00026
3.20 0.00010 0.00010 0.00010 0.00009 0.00009 0.00009 0.00007 0.00007 0.00008 0.00008 0.00009
Table B-7. The increment (per deg) caused by the LASRE pod with the model in the aft position.
Angle of attack, deg
Mach number –2° –1° 0° 1° 2° 3° 4° 5° 6° 7° 8°
0.00 –0.00015 –0.00016 –0.00014 –0.00020 –0.00018 –0.00019 –0.00018 –0.00016 –0.00014 –0.00015 –0.00020
0.60 –0.00015 –0.00016 –0.00014 –0.00020 –0.00018 –0.00019 –0.00018 –0.00016 –0.00014 –0.00015 –0.00020
0.95 0.00018 0.00016 0.00012 0.00013 0.00012 0.00014 0.00008 –0.00005 –0.00011 –0.00011 –0.00014
1.10 –0.00038 –0.00052 –0.00064 –0.00073 –0.00076 –0.00078 –0.00078 –0.00078 –0.00075 –0.00071 –0.00079
1.60 0.00029 0.00035 0.00038 0.00041 0.00045 0.00049 0.00051 0.00052 0.00055 0.00059 0.00058
2.00 –0.00003 0.00003 0.00006 0.00009 0.00013 0.00017 0.00019 0.00020 0.00023 0.00027 0.00026
3.20 –0.00015 –0.00017 –0.00021 –0.00023 –0.00019 –0.00020 –0.00016 –0.00011 –0.00012 –0.00010 –0.00011
CYβ
Clβ
Cnβ
23American Institute of Aeronautics and Astronautics

References
1Martinez, A., Aerodynamic Nozzle Study, vol. 1,Rocketdyne Final Report R-6582, North AmericanAviation, Inc., Los Angeles, California, July 15, 1966.
2Martinez, A., Aerodynamic Nozzle Study, SlipstreamStudies, vol. III, Rocketdyne Interim Report R-6273,North American Aviation, Inc., Los Angeles, California,July 31, 1965.
3Meyer, J.E., McMaster, J.R., and Moody, R.L.,Handling Qualities of the SR-71, Lockheed Aircraft
Corporation, Report no. SP-508, Burbank, California,Oct. 29, 1964.
4Saaris, Gary R., A502I User’s Manual - PAN AIRTechnology Program for Solving Problems of PotentialFlow about Arbitrary Configurations, Document no.D6-54703, The Boeing Company, Seattle, Washington,Feb. 1992.
5Johnson, F. T., Samant, S. S., Bieterman, M. B.,Melvin, R.G., Young, D.P., Bussoletti, J.E., and Hilmes,C.L., TranAir: A Full-Potential, Solution-Adaptive,Rectangular Grid Code for Predicting Subsonic,Transonic, and Supersonic Flows About ArbitraryConfigurations—Theory Document, NASA CR 4348,1992.
6Johnson, F.T., Samant, S.S., Bieterman, M.B.,Melvin, R.G., Young, D.P., Bussoletti, J.E., and Hilmes,C.L., TranAir: A Full-Potential Solution-Adaptive,Rectangular Grid Code for Predicting Subsonic,Transonic, and Supersonic Flows About ArbitraryConfigurations—User’s Manual, NASA CR 4349, 1992.
7Meyer, J.E. and Campbell, D.H., The YF-12A as aPrototype Inlet Flight Test Bed, Lockheed AircraftCorporation - Advanced Development Projects, Reportno. SP-4137A, Burbank, California, Mar. 15, 1974.
Table B-8. Rudder control derivative increments causedby the LASRE pod with the model in the aft position.
Mach
number
,
per deg
,
per deg
,
per deg
0.0 –0.0001148 0.0000552 0.0000597
0.6 –0.0001148 0.0000552 0.0000597
1.1 –0.0006052 0.0000409 0.0003059
1.6 0.0000000 0.0000238 0.0000000
3.2 0.0000000 0.0000000 0.0000000
∆CYδr∆Clδr
∆Cnδr
24American Institute of Aeronautics and Astronautics

REPORT DOCUMENTATION PAGE Form ApprovedOMB No. 0704-0188
Public reporting burden for this collection of information is estimated to average 1 hour per response, including the time for reviewing instructions, searching existing data sources, gathering and maintaining the data needed, and completing and reviewing the collection of information. Send comments regarding this burden estimate or any other aspect of this col-lection of information, including suggestions for reducing this burden, to Washington Headquarters Services, Directorate for Information Operations and Reports, 1215 Jefferson Davis Highway, Suite 1204, Arlington, VA 22202-4302, and to the Office of Management and Budget, Paperwork Reduction Project (0704-0188), Washington, DC 20503.
1. AGENCY USE ONLY (Leave blank) 2. REPORT DATE 3. REPORT TYPE AND DATES COVERED
4. TITLE AND SUBTITLE 5. FUNDING NUMBERS
6. AUTHOR(S)
8. PERFORMING ORGANIZATION REPORT NUMBER
7. PERFORMING ORGANIZATION NAME(S) AND ADDRESS(ES)
9. SPONSORING/MONOTORING AGENCY NAME(S) AND ADDRESS(ES) 10. SPONSORING/MONITORING AGENCY REPORT NUMBER
11. SUPPLEMENTARY NOTES
12a. DISTRIBUTION/AVAILABILITY STATEMENT 12b. DISTRIBUTION CODE
13. ABSTRACT (Maximum 200 words)
14. SUBJECT TERMS 15. NUMBER OF PAGES
16. PRICE CODE
17. SECURITY CLASSIFICATION OF REPORT
18. SECURITY CLASSIFICATION OF THIS PAGE
19. SECURITY CLASSIFICATION OF ABSTRACT
20. LIMITATION OF ABSTRACT
NSN 7540-01-280-5500 Standard Form 298 (Rev. 2-89)Prescribed by ANSI Std. Z39-18298-102
Wind-Tunnel Development of an SR-71 Aerospike Rocket Flight Test Configuration
WU 505-68-52
Timothy R. Moes, Brent R. Cobleigh, Timothy R. Connors, Timothy H. Cox, Stephen C. Smith, and Norm Shirakata
NASA Dryden Flight Research CenterP.O. Box 273Edwards, California 93523-0273
H-2108
National Aeronautics and Space AdministrationWashington, DC 20546-0001 NASA TM-4749
A flight experiment has been proposed to investigate the performance of an aerospike rocket motor installed in a liftingbody configuration. An SR-71 airplane would be used to carry the aerospike configuration to the desired flight test condi-tions. Wind-tunnel tests were completed on a 4-percent scale SR-71 airplane with the aerospike pod mounted in variouslocations on the upper fuselage. Testing was accomplished using sting and blade mounts from Mach 0.6 to Mach 3.2. Ini-tial test objectives included assessing transonic drag and supersonic lateral–directional stability and control. During thesetests, flight simulations were run with wind-tunnel data to assess the acceptability of the configurations. Early testing dem-onstrated that the initial configuration with the aerospike pod near the SR-71 center of gravity was unsuitable because oflarge nosedown pitching moments at transonic speeds. The excessive trim drag resulting from accommodating this pitch-ing moment far exceeded the excess thrust capability of the airplane. Wind-tunnel testing continued in an attempt to find aconfiguration suitable for flight test. Multiple configurations were tested. Results indicate that an aft-mounted model con-figuration possessed acceptable performance, stability, and control characteristics.
Aerodynamic models; Aerospike; Flight simulations; Rocket; SR-71 airplane; Wind tunnel A03
27
Unclassified Unclassified Unclassified Unlimited
June 1996 Technical Memorandum
Available from the NASA Center for AeroSpace Information, 800 Elkridge Landing Road, Linthicum Heights, MD 21090; (301)621-0390
Presented as AIAA 96-2409 at the 14th Applied Aerodynamics Conference, New Orleans, Louisiana, June 17–20, 1996. Timothy R. Moes, Brent R. Cobleigh, Timothy R. Conners, and Timothy H. Cox, NASA Dryden Flight Research Center, Edwards, CA; Stephen C. Smith, NASA Ames Research Center, Moffett Field, CA; Norm Shirakata, Lockheed-Martin Skunk Works, Palmdale, CA.
Unclassified—UnlimitedSubject Category 02

PostScript error (--nostringval--, get)PostScript error (--nostringval--, get)PostScript error (--nostringval--, get)PostScript error (--nostringval--, get)PostScript error (--nostringval--, get)PostScript error (--nostringval--, get)