wind turbine design and implementation phase...
TRANSCRIPT

Wind Turbine design and implementation phase III
Project: SDMAY11-01
Iowa State University: Department of Electrical and Computer Engineering
Members:
Andrew Nigro
Shonda Butler
Chad Hand
Luke Rupiper
Ryan Semler
Final Design Report

DISCLAIMER: This document was developed as a part of the requirements of an Electrical and Computer engineering course at Iowa State University, Ames, Iowa. This document does not constitute a professional engineering design or a professional land surveying document. Although the information is intended to be accurate, the associated students, faculty, and Iowa State University make no claims, promises, or guarantees about the accuracy, completeness, quality, or adequacy of the information. The user of this document shall ensure that any such use does not violate any laws with regard to professional licensing and certification requirements. This use includes any work resulting from this student-prepared document that is required to be under the responsible charge of a licensed engineer or surveyor. This document is copyrighted by the students who produced this document and the associated faculty advisors. No part may be reproduced without the written permission of the Senior Design course coordinator.
Table of Contents1 | P a g e

List of Figures 3 1. Project Overview 4
1.1. Executive Summary 41.2. Acknowledgement 41.3. Problem Statement 51.4. Operating Environment 51.5. Intended Users and Uses 61.6. Limitations 61.7. Expected End Product and Other Deliverables6-7
2. Design Requirements 72.1. Functional Requirements 72.2. Non-Functional Requirements 82.3. Technology Requirements 82.4. Design Requirements – Design Constraints8
3. Detailed Design 93.1. Platform 103.2. Mounting 10-143.3. Sensors 14-163.4. Wind Turbine 16-173.5. Inverter 17-183.6. Load 18-193.7. Interface 19
4. System and Unit Level Testing Cases 204.1. Motor Control 204.2. Turbine Testing 20-214.3. Battery Testing 214.4. Inverter Testing 21-224.5. Load Testing 224.6. Sensor Testing 22-234.7. Full System Test 23
5. Recommended Project Continue 246. Estimated Resources and Schedule 24-267. Closure Material 27
7.1. Project Team Information 277.2. Closing Summary 28
8. Reference Material and Technical Specifications 288.1. Reference Material 28-298.2. Technical Specifications and References 30-33
List of FiguresImage 1: Full System Block Diagram 9Image 2: Finished Platform 10Image 3: (Step 1) Conceptual Drawing of New Mount
11
2 | P a g e

Image 4: (Step 2) CAD 2D model with measurements12
Image 5: (Step 3) Full 3D CAD model of new mounting system13
Image 6: (Step 4) Completed Turbine/Motor Mount 14Image 7: Reed Sensor operation
14 Image 8: Hall Sensor operation 14Image 9: Optical RPM Sensor 14Image 10: Hamlin Hall Sensor 15Image 11: Hamlin Hall Sensor Wire Diagram 15Image 12: Anomemter and Wind Vane 16Image 13: LabVIEW wind speed input block diagram
16Image 14: Inverter System 18Image 15: 175A, 120VDC Single Pole Breaker Providing DC Protection
18Image 16: Marine 30A Fuse for AC Protection 18Image 17: Interface Front Panel 19Image 18: Inverter Modes Courtesy of Outback
22Image 19: Wiring Connection Diagram 29
Sheet 1: Individual Team Member Effort 24Sheet 2: Required Resources 24-25Sheet 3: Project Schedule 26Sheet 4: Student Contact Information 27
1. Project Overview
3 | P a g e

The first section of this design document provides an overview of the Wind Turbine Design and Implementation Phase III Project. This section includes the project background, the problem statement, the operating environment, its users and uses, assumptions and limitations, as well as the product deliverables.
1.1.Executive Summary:
Over the last century electrical needs have been steadily increasing due to population growth and technological and industrial expansion. Growing environmental concerns and the depletion of fossil fuels have influenced the increased production of electricity from renewable resources. Iowa is the second largest producer of wind generated electricity in the United States, and Iowa State University has been taking strong steps to implement new ideas to decrease its environmental impact and increase self -sustainability.
Our senior design team has expanded and fine tuned a previous wind energy project led by Dr. Ajjarapu. The project consists of a wind turbine driven by a three phase motor that is controlled by an external power source. The goal of the project is to accurately simulate wind conditions to the turbine in a controlled environment and monitor voltage, current, power, and speed. As a team, we had to first understand what was designed and built by the previous group. We needed to clearly understand how the system is controlled and document all of our progress.The end product resembles a small scale renewable electrical network. We simulate wind conditions to our turbine through data received from wind sensors, these sensors were provided by another senior design group. The power generated from the turbine charges a bank of batteries. The direct current (DC) is converted to alternating current (AC) through an inverter. From the inverter, a load consisting of two light bulbs and an outlet is powered.
1.2.Acknowledgement:
Professor Ajjarapu – Faculty Advisor – Provided us with advice on project management as well as technical and financial support.
Coover Parts Department – Provided us with hardware support. NI forums – Provided us with hardware support. Brandon Janssen – Worked on previous project team. Brought us up to speed on the
previous system. Senior Design Team DEC10-05: Provided us with wind speed data and equipment. Leland Harker: Provided us with CAD model of mounting, and fabrication assistance.
1.3.Problem Statement: This project was a continuation of two previous senior design groups. The final implementation of this project will be to design a wind turbine electrical generation system and integrate the power generated into the power grid. A wind turbine will be installed on the exterior of Coover
4 | P a g e

Hall. Our extension of the project was to be able to receive and integrate a wind profile wirelessly from wind sensors placed outside Coover Hall. This wind data is used as an input to our motor controls allowing us to adjust the speed of the motor to simulate changing wind speeds. This allows us to take a wind profile for a given time period and operate the turbine continuously for that time. Originally the motor speed is adjusted using a voltage knob on the interface. The voltage knob would change the voltage sent from the power supply to the motor and therefore change the speed of the turbine. This did not allow the speed of the turbine to change according to the changing wind speeds. Another major point of concern was the motor and turbine platforms. Previously the motor and wind turbine were coupled together on separate mounting systems. Issues we experienced with this system included bowing wood on the turbine platform, dangerous movement of the wind turbine during simulation, and inaccurate motor to turbine coupling height. Minimal project documentation was provided to get started on our phase of the project. This caused a lot of initial confusion. There were no wiring diagrams or documentation of how the interface worked. This made for a long delay while we had to learn how the system operated.
1.4.Operating Environment:
Ideally the wind turbine would be mounted to the roof of a building, such as Coover Hall, and be integrated into the power grid at Iowa State. Although this is ideal, it was not within the scope of our senior design group due to budget constraints. Our system is not intended for outdoor use; instead we are simulating wind conditions in a controlled environment inside a power lab in Coover 1102. However, elements intended for future outdoor use within our system are able to handle all environmental conditions such as dust, extreme temperatures, rain and other weather elements should future innovations include outdoor implementation. Wind simulation is achieved using a three-phase AC motor along with sensors to read current and voltage levels as well as rpm measurements. Data is also provided via wireless signals from wind sensors mounted outside, which will be used to simulate changing wind speeds for pitch control. An interactive graphical user interface (GUI) in LabVIEW is used during simulations to display readings and measurements sent from the various sensors.
1.5.Intended User(s) and Use(s):
Intended Users:
The simulation environment is intended to be used by students of the Iowa State University Electrical and Computer Engineering department. These students will have at least a high school
5 | P a g e

education and an interest in using wind as a renewable source of energy. Primary users will consist of Dr. Ajjarapu and future senior design projects for its expansion. There is also a possibility of using this project in future power labs. Secondary users will consist of students viewing the simulation as a display.
Intended Uses:
This environment will be used to simulate wind energy generation. This simulation is intended to be an educational tool used to study power generation from small wind turbines. Where the turbine will be rotated by a motor at a previously recorded wind speed, charge its battery bank, and power a load according to its current generation level. The load is not intended to provide a primary light source for a room and the battery bank is not intended to power any devices other than the simulation environment.
1.6.Limitations:
Limitations:
The budget of $400 left little room for any equipment malfunctions so it was necessary for our group to be completely knowledgeable of the system and its mechanical limitations.
The budget did not allow proper funding for field testing the equipment in its intended environment, mounted to the top of Coover Hall.
There was a lack of documentation (schematics, wiring diagrams, and system manual) of the previous group’s work.
Our group needed to wait for the other senior design group we were working with to finish before we began testing the full system.
1.7. Expected End Product and Other Deliverables
Wind Speed Simulation:
We will be expanding on the previous groups control interface to include motor control that will accurately simulate wind speed. This interface will be programmed in LabVIEW and will be used to control and monitor the entire system.
Variable Load:
We will be creating a variable load to connect to our power generation system in order to simulate the system being connected to a real grid. This grid will have voltage and current sensors so it can report back to our interface the amount of power being used and the power output can be adjusted accordingly.
6 | P a g e

Wind Turbine Mount:
A new mounting system will be designed in order to stabilize the system and avoid damage to the turbine and the motor. This will involve a thicker base that will solve the problem of the previous group having the base bow down making the system unbalanced. It will also include a stabilization plate that will decrease the vibrations that the turbine receives from the motor increasing efficiency and avoiding damage to the system.
User Manual/Diagrams/Descriptions:
We will be working with a current EE 491 group to create an operations manual that will help future groups and other users become acquainted with the setup more quickly. This will save others time and hopefully avoid future mistakes. We will also be creating wiring diagrams and descriptions of system components and functionality.
2. Design Requirements
The following sections describe the specific requirements defined by the project design. All solutions must meet the requirements in this section.
2.1.Functional Requirements
FR01 The turbine will generate a 24V DC output. FR02 The turbine will generate a 400W peak output. FR03 The test-bed connection will serve to simulate the load. FR04 The motor will simulate outdoor wind speed. FR05 The sensors to gather wind data will be an anemometer and wind vane. FR06 The RPM sensor will accurately reflect the speed of the motor within ±5%. FR07 The wind turbine will supply an AC Load FR08 The user interface will display accurate measurements of DC voltage and current,
RPM, and real power produced.
2.2.Non-Functional Requirements:
NFR01 The project will comply with all state and federal electrical regulations. NFR02 The turbine will be remounted to a new stable operating platform. NFR03 The project will be documented through technical manual and in-depth schematics. NFR04 Wiring and connections will be redone in a professional manner.
2.3.Technology Requirements:
Motor and turbine must be coupled at proper height.
7 | P a g e

Wind sensor hardware must withstand a temperature range of -30 to 100 degrees Fahrenheit. All sensor equipment must be compatible with DAQ module.
2.4.Design Requirements – Design Constraints: Wind speed signal can be lost. Wind speed can be higher than our simulated limits. Motor will spin while turbine can be braking.
3. Detailed Design
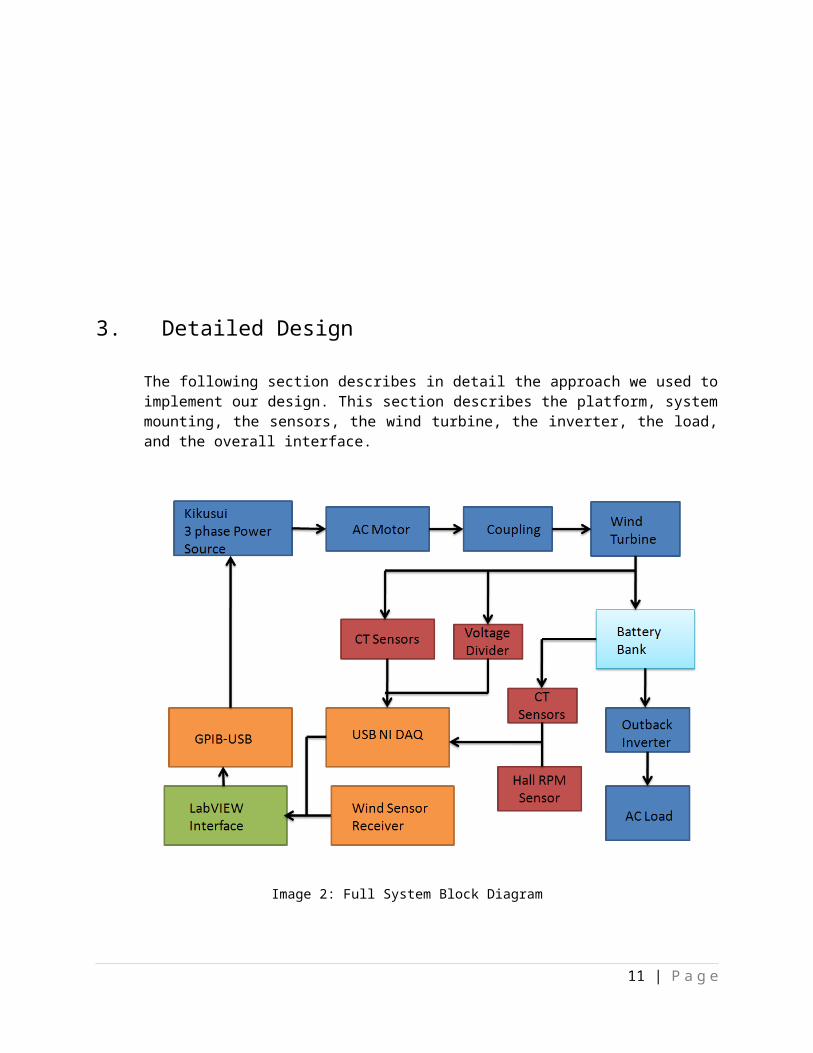
The following section describes in detail the approach we used to implement our design. This section describes the platform, system mounting, the sensors, the wind turbine, the inverter, the load, and the overall interface.
8 | P a g e

Image 2: Full System Block Diagram
The process of our simulation is to wirelessly receive data from a wind speed sensor and simulate a wind turbine powering a load from this wind speed. The wind sensor receiver will give the outdoor wind speed, but not direction. LabVIEW will convert the wind speed to a calculated RPM for the AC motor. The GPIB-USB interfaces LabVIEW and the Kikusui 3 phase Power Source. The AC motor is coupled to the turbine to simulate the blades of the turbine in an outdoor environment. The wind turbine’s generated power charges the 24V battery bank. The battery bank provides DC power to the Outback inverter which converts this to AC power for our load. The sensors provide data to our USB NI DAQ which is displayed in LabVIEW. The LabVIEW interface gives voltage and current data from the sensors, RPM of the motor, and total power generated.
3.1.Platform
The platform for our project is a ¾” MDF board. This was chosen because of its durability, lightweight, and allowed easy mounting of all of our components. The platform dimensions 30.5”x33.5”were chosen so that the whole platform covers the table and allowed plenty of room to place the components without clutter. The turbine was mounted towards the back of
9 | P a g e

the platform giving plenty of room towards the front for our load display and appropriate wiring, breakers, CTs, and switches. A picture of the finished platform is shown below:
Image 2: Finished Platform
Wiring for the load is encased in conduit to keep the project up to electric code and ensure the safety of the operator. All hot terminals are covered in heat shrink to also ensure the safety of the operator. All the DC wiring was secured to the board to prevent movement during operation. The CTs and voltage divider were attached to printed circuit boards, so gluing them to the platform was ideal to prevent damage to the leads of the components. The platform can be easily transported in the future if needed.
3.2.Mounting
In order for the wind turbine to be operational indoors it needed to be securely coupled to the motor that acts as the wind input. Since the turbine utilizes a tail that manually moves towards the direction of the wind, the turbine is free to move side to side. When the turbine is coupled to the motor, it does not stay in place. Instead the side to side movement could cause the internal damage to the generator destroying the turbines ability to produce power.
Since we could not risk damaging our equipment, a new mount for both the motor and turbine has been designed. With the guidance of Leland Harker we compared two alternatives during the planning phase of the project. Ultimately, we decided that we would use extruded aluminum to construct a strong and level platform for our system. Extruded aluminum has the benefit of being slotted so that construction with l-brackets and screw inserts was simple. A plate of aluminum was cut to fit against the turbine face to support the weight and keep the connection between the motor and turbine level.
10 | P a g e
Design Documents:
Image 3: (Step 1) Conceptual Drawing of New Mount
11 | P a g e
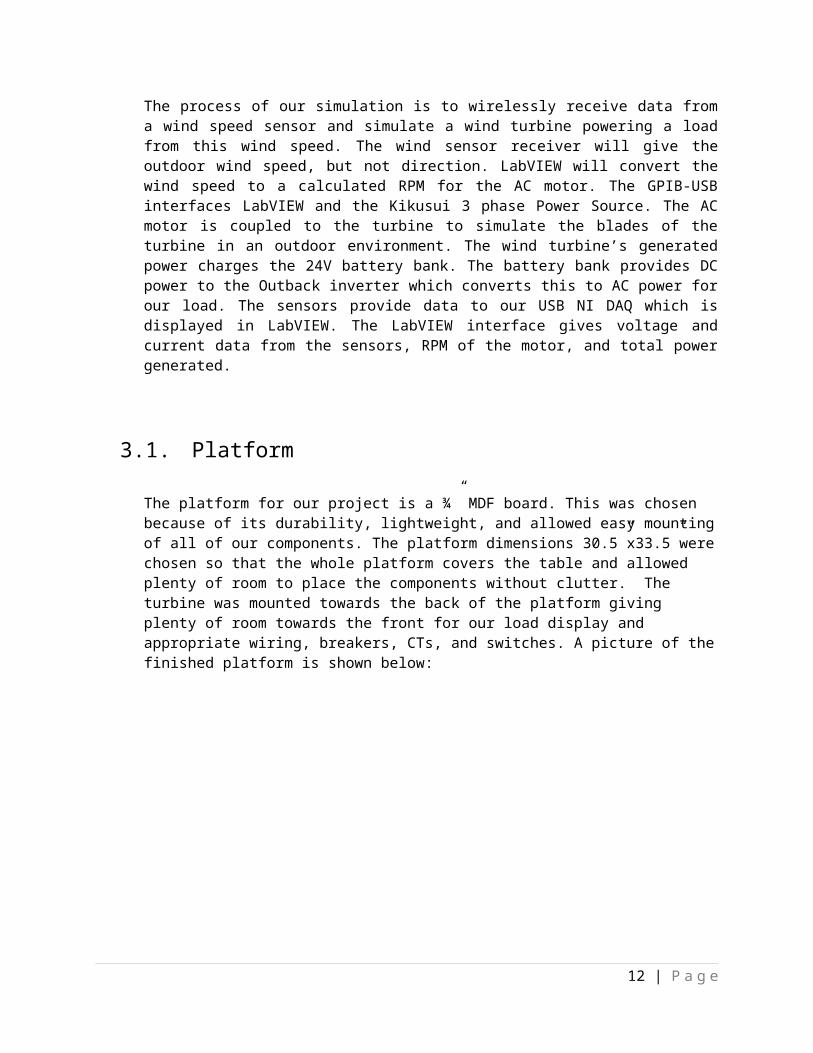
Image 4:
12 | P a g e

Image 5: (Step 3) Full 3D CAD model of new mounting system designed by Leland Harker
Materials:
80/20 Inc. Rectangular Extruded Aluminum RodsSteel L Brackets¾” slab of Medium Density FiberwoodM5x40 SS Socket Head ScrewsAluminum PlatingButton Head Hex ScrewsSliding T-Nut Inserts
Construction:
Please review the above pictures while reading
A 36” x 28” sheet of MDF (Medium Density Fiberboard) lays flat on the surface of a table. Four extruded aluminum rods lay flat and provide a square base, which is secured to the MDF platform with two L-brackets. Four extruded aluminum rods extend from the two furthest corners and in the middle upwards. Two more extruded aluminum rods are placed perpendicular to the four vertical rods to create a rectangular box for the motor to sit. Each of these connections are made with L-brackets, button head hex screws, and the sliding t-nut inserts. From the outside of the rods in the middle, an aluminum plate is bolted. Three M5x40 SS
13 | P a g e

socket head screws bolt directly to the turbine face to hold it in place. Four bolts are used to mount the motor to sliders in the extruded aluminum.
Results:
Image 6: (Step 4) Completed Turbine/Motor Mount
The end product was completed a little after January and has been fully operational since. The structure itself is very sturdy, but does result in some vibrations. The vibrations, however, are not a threat to the turbine or the motor integrity. The mount allows for the turbine and motor to be coupled or disassembled quickly for testing. Overall the mount accomplishes what it was constructed to do, keep the motor and turbine level and hold them securely in place while in operation.
3.3.Sensors
RPM Sensor:
Reed Sensor Hall Sensor Optical Sensor
Image 7: Reed Sensor operation Image 8: Hall Sensor operation Image 9: Optical RPM SensorCourtesy of: Left (http://www.chicagosensor.com/images/HowItWorksReed.jpg), Center (http://upload.wikimedia.org/wikipedia/commons/7/7e/Hall_sensor_tach.gif)
14 | P a g e

We created a new mounting system so the bulky fragile RPM sensor the previous group built on a testboard was not ideal for continuous use. The RPM sensor they created was an optical detector and a Schmitt trigger to create a digital signal for every turn the motor made. We wanted to replace this easily with something more compact and easily mounted. Our three options are shown above and consist of a reed sensor, a hall sensor, or new optical sensor. The reed sensor was determined to be too fragile, the optical sensors all required a mounting system to be fabricated, and the hall sensor is a linear device. We found a hall sensor with additional circuitry to create a digital device similar to the bulky one we replaced.
Image 10: Hamlin Hall Sensor Image 11: Hamlin Hall Sensor Wire Diagram
Courtesy of: http://media.digikey.com/photos/Hamlin%20Photos/55100-3H-02-A.jpg
The RPM sensor we chose is the Hamlin 55100-3H-02-A-ND. The 55100 is a mini flange mount hall effect sensor. The 55100 was chosen for the prefabricated mounting design over other similar sensors. This model has an operating voltage of 3.8 to 24v, this allows the 5v output of the DAQ to power the sensor rather than an external supply as previously used. The 55100 has a built in switch and comparator to act as a digital sensor rather than the typical linear hall sensor. This makes placement into the already designed interface easy. We have chosen the sensor with an activation distance of 18.0mm which gives us enough distance to not be activated in error, and does not have to be mounted in a manner that is difficult. We use the LabVIEW software and our sensor to count our rotations per a given time, and then calculate RPM.
Current Sensors:
The current sensors previously chosen are the current transducers LEM LA 55-P. They allow us to see the current being generated by the wind turbine, and the current powering the inverter from the batteries. The transducers are hall sensors that give a voltage output versus current through the wire.
Please review the technical specifications on the LEM LA 55-P at the end of the document
Voltage Sensor:
The voltage sensor we used is a voltage divider using a 100kOhm and 390kOhm resistor. This gives us a scaled down voltage to the DAQ which is then calculated in LabVIEW to give actual battery voltage.
15 | P a g e

Wind Sensor:
Image 12: Anomemter and Wind Vane Image 13: LabVIEW wind speed input block diagram
Courtesy of: Left (http://www.nrgsystems.com/~/media/ProductImages/1900/1900.ashx), Center (http://www.nrgsystems.com/~/media/ProductImages/1904/1904.ashx), Right (http://forums.ni.com/ni/attachments/ni/170/236901/1/read%20lines.JPG)
The wind sensor data was provided by the “Ridgeline Meteorological Sensor Network” senior design group. We were provided with a USB receiver to export data from their wireless network. The data received from the wind sensors can be imported into PuTTY and then placed in a text file. The program we received was intened to be imported directly into a text file, but we found the additional step necessary in order to record a wind profile. We are using our LabVIEW interface to simulate the data received from this file.
3.4.Wind Turbine
We are using a Southwest Windpower Air X 400 wind turbine for our project. This was chosen by a previous senior design team. The Air X 400 does not allow the user to change the control system of the turbine. Ideally we would like to choose a turbine that would allow us to manage the control functions of machine. The budget did not allow us to choose a different model with better controllability.
Please see the user manual for most in depth information about this specific wind turbine.
The Air X 400 turbine has to meet some criteria for proper usage which we had followed in our project design:
The turbine must see a battery bank connected with at a minimum 7 VDC to operate. The turbine will sense and compare the turbine voltage to the battery voltage so that it
does not overcharge and damage the battery bank. The maximum voltage capacity of the battery bank is 27 VDC; this is when our turbine will automatically go into shutdown mode
The Air X needs to see at least 8 mph or 500 rpm to start producing power The Air X goes into regulation (slow down) mode when a wind speed of 35 mph is
sensed The wind turbine goes into shutdown mode when a wind speed of 50 mph or greater is
sensed to protect the structural integrity of the machine
16 | P a g e

We installed a coupling directly on the shaft of the rotor on the turbine to connect directly to the motor. The faceplate of the turbine is screwed directly onto an aluminum plate to keep the turbine stable. The turbine flashes an LED light quickly when it sees that a battery bank is connected. The LED stays solid when the turbine is in operational mode and producing power. Our turbine is rated at 92% efficiency and can produce a maximum of 400W of power at the optimal wind conditions.
3.5.Inverter
The inverter is one of the most crucial parts of any renewable energy system. It takes 24V DC power from the battery bank supplied by the turbine and converts it to 120V AC for use by the load. The senior design teams prior to ours chose the single phase Outback GTFX2500 VA grid-tie inverter for this process. The inverter also contains an internal controller that manages the input voltage needed for a stable output voltage. This inverter was picked to match the input voltage and maximum power of the turbine (400W & 24V DC) and the output current, voltage, and power of the load (Single Phase 120V AC & 10A load). This particular inverter is a hybrid type which can be used in either stand-alone or grid connected mode. For our project, we operate the inverter in stand-alone mode because we are not connecting directly to the Iowa State grid.
Wiring and Protection:
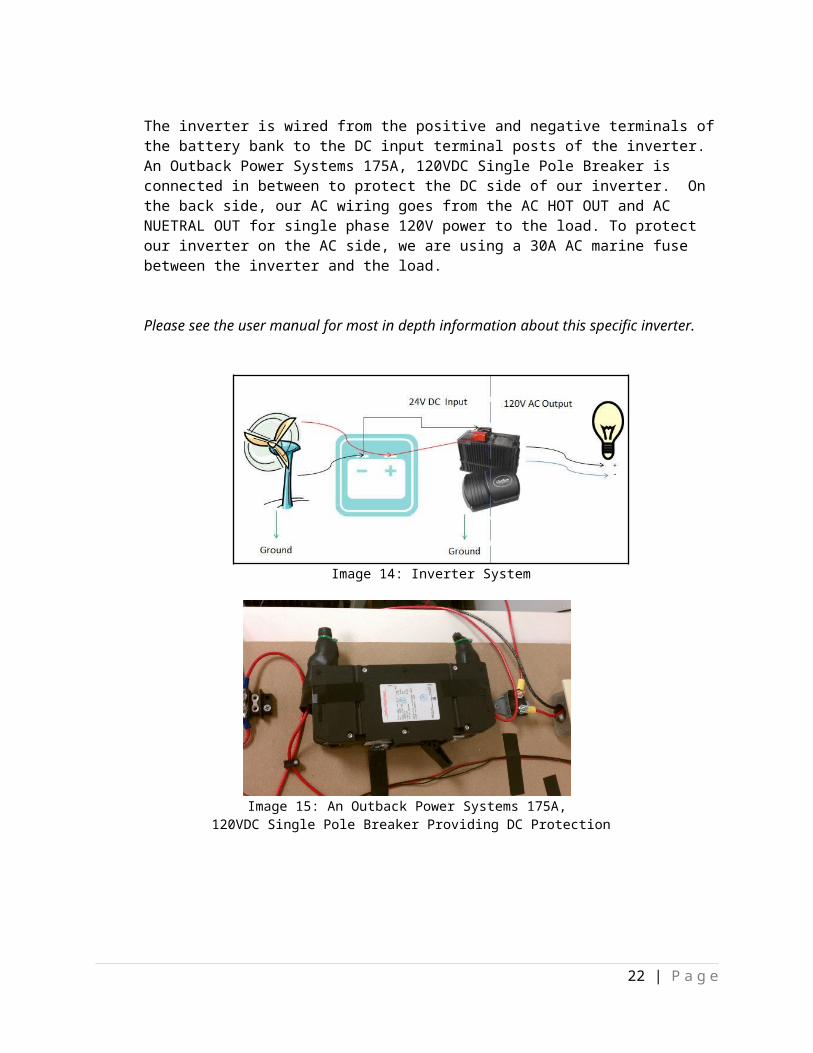
The inverter is wired from the positive and negative terminals of the battery bank to the DC input terminal posts of the inverter. An Outback Power Systems 175A, 120VDC Single Pole Breaker is connected in between to protect the DC side of our inverter. On the back side, our AC wiring goes from the AC HOT OUT and AC NUETRAL OUT for single phase 120V power to the load. To protect our inverter on the AC side, we are using a 30A AC marine fuse between the inverter and the load.
Please see the user manual for most in depth information about this specific inverter.
Image 14: Inverter System
17 | P a g e

Image 15: An Outback Power Systems 175A, 120VDC Single Pole Breaker Providing DC Protection
Image 16: Marine 30A Fuse for AC Protection
3.6.Load
A load is used to demonstrate the operation of the system by simulating actual loads used in a common household. The load also provides a visual reference of the power being produced. The load provided to the system consists of two 75W incandescent light bulbs and an outlet connected in parallel. One of the bulbs is controlled by a light switch. The light bulbs act as a resistive load so the light intensity will be affected by the variation in the power produced. This is why we also chose to use an outlet-load, so the variation in power will not be noticed. This outlet also provides the opportunity to increase the load greatly depending on the device being plugged in. The load is setup so the operator can increment the load from the base load of 75W to a max load of 400W, which is the maximum output of our turbine. A 30A AC fuse is connected between the inverter and load to prevent any possible damage to the inverter.
3.7.InterfaceOur team designed a full user interface for this project. The user interface was designed with LabVIEW. Its main purpose is to control motor speed through the control of our power supply. The NI USB-6008 DAQ is used to bring in readings from various sensors to monitor voltage and
18 | P a g e

current at multiple locations in the system. The DAQ takes readings from the sensors and passes them to our interface. Some of these readings require mathematical manipulation to be correct. For instance, our CT has a 1000:1 ratio but is being measured over a 100 ohm resistor so we have to take the voltage reading that is coming out of the CT and multiply it by 100. To find the power we simply multiplied the calculated voltages and currents. The gauges on the front panel are used to display these values.
Interface Front Panel
The front panel of our system is where all the different readings that are being taken by our system are displayed. The user simply has to start the program and choose the wind profile that they wish to use and the system is fully automated. The front panel gives the user the different values monitored by the system. The user can observe the power being drawn by the load by looking at the load voltage and current meters. The wind speed that is being used for the motor control is displayed in the digital meter in mph. We use the hall rpm sensor to monitor the speed at which the turbine is spinning this can also be seen on the front panel and displayed in rpm.
Image 17: Interface Front Panel
4. System and Unit Level Testing Cases
The following section defines the various test cases that were conducted. Unit level testing was conducted to confirm the operational specifications and capabilities of the individual components. A full system test was conducted to confirm that overall simulation meets the specific requirements stated earlier.
4.1.Motor Control19 | P a g e

The motor control was tested by passing several different voltages and phases to the power source through the interface in the form of wind speeds. We then measured the output with the rpm sensor as well as visually. When a discrepancy was noticed we went back and made sure the numbers we were using to convert from wind speed to voltage and phase were correct. Once the output matched the expected input we ran an extended test using a sample wind profile to check that the changes in motor speed were correctly simulating the given wind speeds for our turbine.
4.2.Turbine Testing
The turbine was tested using the manufacturer supplied manual. The following tests can be found in the Air X Owner’s Manual. From the three tests given we have verified the turbine is in proper working order.
Test 1 (On/Off Testing)This test will determine the working order of the internal on/off switch. When the turbine leads are shorted it will prevent the turbine from spinning freely.1. Remove blade assembly from turbine and place in a safe location. (Do not stand the blade
assembly against a wall.)2. Spin rotor shaft with your fingers or the Allen Wrench provided while at the same time
connecting and disconnecting the Red and Black yaw wires. (Be careful not to press the rotor shaft into the turbine body.)
3. With the yaw wires connected, the rotor shaft should become more difficult to rotate and feel “lumpy”. With the yaw wires disconnected it should spin freely. If these conditions do not exist, you should contact your turbine dealer or Southwest Windpower.
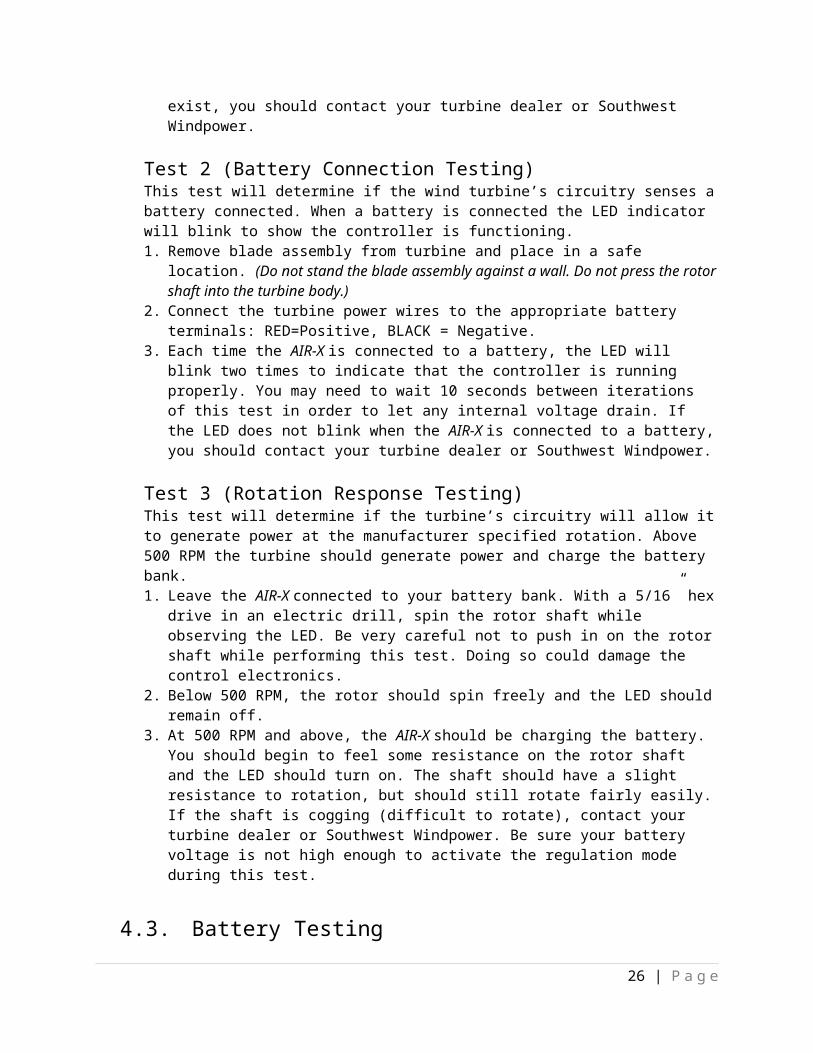
Test 2 (Battery Connection Testing)This test will determine if the wind turbine’s circuitry senses a battery connected. When a battery is connected the LED indicator will blink to show the controller is functioning. 1. Remove blade assembly from turbine and place in a safe location. (Do not stand the blade
assembly against a wall. Do not press the rotor shaft into the turbine body.)2. Connect the turbine power wires to the appropriate battery terminals: RED=Positive, BLACK
= Negative.3. Each time the AIR-X is connected to a battery, the LED will blink two times to indicate that
the controller is running properly. You may need to wait 10 seconds between iterations of this test in order to let any internal voltage drain. If the LED does not blink when the AIR-X is connected to a battery, you should contact your turbine dealer or Southwest Windpower.
Test 3 (Rotation Response Testing)This test will determine if the turbine’s circuitry will allow it to generate power at the manufacturer specified rotation. Above 500 RPM the turbine should generate power and charge the battery bank.1. Leave the AIR-X connected to your battery bank. With a 5/16” hex drive in an electric drill,
spin the rotor shaft while observing the LED. Be very careful not to push in on the rotor shaft while performing this test. Doing so could damage the control electronics.
20 | P a g e

2. Below 500 RPM, the rotor should spin freely and the LED should remain off.3. At 500 RPM and above, the AIR-X should be charging the battery. You should begin to feel
some resistance on the rotor shaft and the LED should turn on. The shaft should have a slight resistance to rotation, but should still rotate fairly easily. If the shaft is cogging (difficult to rotate), contact your turbine dealer or Southwest Windpower. Be sure your battery voltage is not high enough to activate the regulation mode during this test.
4.3.Battery Testing
The batteries should hold a charge of 12V each, giving 24V in series. This was tested with a volt meter. We tested each battery separately to verify that it was holding the desired voltage by itself and then tested the bank by connecting them in series and using the volt meter to measure across the system. The batteries passed both tests.
4.4.Inverter Testing
The inverter is used to convert the DC power from the battery to AC power. To test the inverter we first needed to verify that the voltage supplied to the turbine by the batteries was sufficient to turn on the inverter. The battery bank consisting of two 12V batteries supplies 24V total to the inverter. The inverter is also connected to a ground, and a jumper is used to turn the inverter on. When the inverter is connected to the battery bank and the jumper is in place, we verified that it displayed what operation mode it is in. A green led was lit signaling the inverter was in the correct operational mode.
Image 18: Inverter Modes Courtesy of Outback
4.5.Load Testing21 | P a g e
Another unit level test we conducted was load testing. To test the base load is working properly we connected the battery bank to the inverter. The first light bulb lit when the inverter breaker was on which signaled that the connection from the inverter to the load was done correctly. To test the second light bulb we turned on the switch controlling it. When it lit we knew that the second light bulb, as well as the switch, was in working order. To test the outlet we plugged in several devices and monitor the behavior of the load. To test the 30A AC breaker we pushed the button while the load is operating to make sure the breaker is cutting off current flowing from the inverter to the load.
4.6.Sensor Testing
The current transducers are used to detect the current flowing through a wire. We are using them to measure the current flowing through the positive wire from the turbine and the positive wire connected to the batteries. These were tested by measuring the voltage across a 100Ω resistor that was connected in series with the output of the 1000:1 ratio CT. This voltage was first measured with multi-meter and then with the DAQ assist. This test was successful as the respective voltage measured with the multi-meter matched that in the DAQ assist. These values were then scaled by 100 corresponding to (1000:1)/100Ω and displayed on the front panel of our interface.
We have chosen to use a low cost Hamlin Hall Effects Sensor to record the AC motor’s RPM. We tested it by passing a magnet over the sensor and measuring the output voltage using a multi-meter. This test was successful as the output voltage was 5V when the sensor was near. This was then imported into our interface with a counter when the voltage pulsated at 5V. This was then used to calculate the RPM and displayed on the front panel.
The voltage divider in our system converts the full output of the turbine to a smaller voltage that is safer for the DAQ. We tested this voltage divider by first measuring our battery voltage and then measuring the output across the voltage divider with a multi-meter. This test was successful and the voltage divider was then input into the interface. This voltage was then scaled to represent the actual voltage across the batteries, due to the internal resistance of the DAQ this input voltage was further scaled to represent the actual voltage measured across the batteries with the multi-meter.
4.7.Full System TestA final test was performed to ensure all requirements of the designed system are fulfilled. A checklist was followed and repeated to ensure that no errors occurred. If a mistake or miscalculation arose while testing, we stopped, took note of it, resolve the issue, and continued the process from the beginning.
Steps:
1. Check all wires, bolts, screws and the coupling for secure connections.
22 | P a g e

2. Remove all unnecessary materials from the testing area.3. Insure that all safety precautions are followed. For example, high voltage signs are
posted and more than one person is in the room during testing.4. Turn on LabVIEW GUI and load all necessary drivers.5. Turn on all power sources, check LED status to ensure that all sources are active.6. Make connection with wind sensor data and upload the wind profile for the current conditions.7. Run program that utilities data profile and automatically controls input voltage and frequency to the motor.8. Check LabVIEW GUI for RPM, current, voltage, and power readings.9. Check that wind turbine LED has lit up.10. Monitor battery voltage to ensure they are not overcharged.11. Make sure the automatic stop switch will kill the motor.12. Turn motor back on and start data profile again.13. Check that the inverter has turned on and LEDs signify the quality of the battery power.14. Ensure that the two light bulbs are lit and flick the switch to add more lights (load).15. Check LabVIEW GUI for RPM, current, voltage, and power readings.16. Run for at least 5 to 15 minutes to ensure that the motor changes in sync with the
weather data that is loaded into the program.17. Turn off motor first through the GUI. Then shut off all power supplies. Turn the wind turbine switch to lock it in the off position. Remove the power jumper from the inverter. Now the system has been completely shut down.18. Run this process several times with varying weather data and time inputs.
5. Recommend Project Continuance We recommend that this project continue so that the power generated by the wind turbine can be incorporated into the Iowa State University power grid. Our interface can also be reused to repeat this simulation for other buildings on campus. When budgets allow, this turbine and others could be placed outdoors and our interface can be modified to monitor the power generated. We were not able to complete the real time connection from the sensors to our interface. We have laid a good foundation for this but ran into problems with limited knowledge of the specific model of the Arduino within the wind sensor receiving node. Further research and completion of this would be a good way to improve on the project. We also recommend that the project procure its own computer as the one currently in use belongs to the power lab. This will provide a permanent set up to study the simulation.
6. Estimated Resources and Schedule
The following section includes the resources we will use and our current project schedule.
23 | P a g e

Individual Team Member Effort (hours)Task: 1 2 3 4 5 6 7 8 9 10 11Team Member: TotalsAndrew Nigro 50 7 3 18 20 0 10 45.5 10 8 5 166.5Chad Hand 6 43 3 8 15 0 49 20 10 8 5 167Luke Rupiper 7 5 3 8 84 0 8 20 10 8 5 158Ryan Semler 6 5 25 8 15 0 42 30 10 8 5 154Shonda Butler 16 3 6 20 75 0 10 20 10 8 5 173Totals 85 63 40 62 209 0 109 135.5 50 40 25 818.5
Sheet 1: Estimated Individual Team Member Effort
Required Resources
Parts and Materials:Team Hours
Other Hours
Cost without Labor
Cost with Labor ($20/hr)
Purchased by Phase I:Turbine- Air X 400 $700 $700Inverter-Outback GTFX2524 $1,400 $1,400Battery Bank $100 $100NI USB-6008 $170 $170
Purchased by Phase II:Coupling $112 $112Current Transducer $21 $21Stop Switch $16 $16Kikusui Power Supply Borrowed $03-phase AC Motor Borrowed $0
Phase III Estimates:Mounting Platform: 44 $80 $960Load Platform 50 $42 $1042Wire 33 $0 $660Battery Bank 55 $452 $1552RPM Sensor 40 $7 $807Inverter Breaker 5 $95 $195Turbine Breaker 3 $6 $66
Services:Wind Sensor- Other Senior Design Group (Dec 10-05) 2 $40Technical Manual- Engl 314 Group 20 $400Knowledge of Project- Dr. Ajjarapu 30 $600Knowledge of Project-Previous Senior Design Team member 2 $40
24 | P a g e

Turbine Expertise- National Instruments Forums 1 $0Totals: 230 55 $3201 $8,881
Sheet 2: Required Resources
Tasks:Task 1: Complete mount fabrication and constructionTask 2: Reorganize wiring for turbine and sensorsTask 3: Complete hall sensor installation Task 4: Text file wind data gatheringTask 5: Real-time wind data gatheringTask 6: Load curve and wind profiling via MATLAB*Changed to An Independent StudyTask 7: Variable load controlTask 8: Full system test with wind sensorsTask 9: VEISHEA DemoTask 10: Project Documentation ManualTask 11: Project Display Poster
25 | P a g e
Week 1
Week 2
Week 3
Week 4
Week 5
Week 6
Week 7
Week 8
Week 9
Week 10
Week 11
Week 12
Week 13
Week 14
Week 15
Week 16
Jan 10th - 16thJan 17th - 23rd
Jan 24th - 30thJan 31st - Feb 6th
Feb 7th - 13thFeb 14th - 20th
Feb 21st - 27thFeb 28th - M
ar 6thM
arch 7th - 13thMarch 14th - 20th
March 21st - 27th
March 28th - Apr 3rd
Apr 4th - 10thApr 11th - 17th
Apr 18th - 24thApr 25th - M
ay 1stAnticipated Task 1Actual Task 1Anticipated Task 2Actual Task 2Anticipated Task 3Actual Task 3Anticipated Task 4Actual Task 4Anticipated Task 5Actual Task 5Anticipated Task 6Actual Task 6Anticipated Task 7Actual Task 7Anticipated Task 8Actual Task 8Anticipated Task 9Actual Task 9Anticipated Task 10Actual Task 10Anticipated Task 11Actual Task 11
Sheet 3: Project Schedule
26 | P a g e

7. Closure Material
The following includes the closure material consisting of our project team information and a closing summary.
7.1.Project Team Information
Client:Iowa State University : Department of Electrical and Computer Engineering
Faculty Advisor:Dr. Venkataramana Ajjarapu
1122 Coover Hall Ames, IA 50011-3060 Phone #: (515) 294-7687 [email protected]
http://www.ece.iastate.edu/who-we-are/faculty-and-staff/faculty-new/index/detail/abc/289.html
Student Team:Sheet 4: Student Contact Information
Andrew NigroElectrical Engineering2129 Sunset DrAmes, IA 50014-7074Cell: (402) 917-4753Email: [email protected]
Chad HandElectrical Engineering3114 Woodland StreetAmes, IA 50014-7074Cell: (563) 210-6631Email: [email protected]
Luke RupiperElectrical Engineering3506 Lincoln Way Unit 22Ames, IA 50014Cell: (612) 840-4465Email: [email protected]
Ryan SemlerElectrical Engineering1005 Pinon Dr Unit 3Ames, IA 50014-7944Cell: (515) 451-9336Email: [email protected]
Shonda ButlerElectrical Engineering1317 Roosevelt AveAmes, IA 50010Cell: (210) 834-6114Email: [email protected]
27 | P a g e
7.2.Closing Summary
The United States continues to increase its electrical consumption and recently has stressed the need for solutions from renewable resources. Our project focuses on the electrical needs of Iowa State University and aims at taking advantage of an abundance of wind energy in the Iowa area. By creating a simulated environment, we can work in a controlled laboratory to test load control with a wind turbine. By accurately monitoring the output of the turbine and control its ability to feed a load, future groups will be able to easily use our system and interface to design other wind turbine systems for campus buildings.
8. Reference Material & Technical SpecificationsThe final section of this document includes the technical specifications of each component.
8.1.Reference Material
Operations Manual
Setting up the full system test on the wind turbine and interface, it is just a matter of making sure the individual components are up and ready and that all power electronics supplies are good to go. Once all of the hardware is ready, then the team makes sure the LabVIEW GUI is up and running too since this where the entire system is controlled. Below are some of the main steps observed at their project station in the power electronics lab:
1. Connect the battery terminals in series.2. Remove any unnecessary materials from the area.3. Make sure that at least 2 people are present during testing for safety.4. Make sure the stop switch is in the on position and the motor-turbine coupling spins
freely.5. Make sure the AC Breaker is in the on position.6. Check that the inverter has turned on and LEDs signify the quality of the battery power.7. Ensure that the one light bulb is lit and flick the switch to add more lights and/or plug a
device into the outlet to add more loads.8. Turn on all power sources; this includes the 3 phase power supply for the motor and the
±15V for the CT biasing.9. Double click on the WindTurbine.vi file to launch the LabVIEW GUI 10. Click the arrow on the top left to run the LabVIEW program and select the previously
recorded wind profile text file. This will automatically control the input voltage and frequency to the motor according to the wind speed.
11. Click on the “ON” button on the LabVIEW GUI to begin running the motor, it will change speed every 10 seconds to the next recorded wind speed.
12. Check LabVIEW GUI for RPM, current, voltage, and power readings.13. Check that wind turbine LED has lit up indicating it is charging when the wind speed is
greater than 8 mph.
28 | P a g e

14. Monitor battery voltage to ensure they are not overcharged; the turbine will go into a breaking mode when the battery voltage reaches 27V.
15. Click on the “OFF” button on the LabVIEW GUI to stop the motor.16. Shut off all power supplies. 17. Turn the wind turbine switch to lock it in the off position. 18. Remove the power jumper from the inverter. 19. Disconnect the battery connection to avoid dissipation when it is not in use. 20. Now the system has been completely shut down. Run this process several times with
varying weather data and time inputs to achieve more diverse testing.
To record a wind profile:
1. Make sure distant nodes have power through a USB or battery pack.2. Double click on PuTTY program.3. Select serial connection type.4. Type in COM4 in the serial line (speed 9600).5. Click open. 6. A terminal will display wind speeds recorded at distant nodes. Transfer these speeds to
a text file and save it as your new wind profile.7. Disconnect by closing PuTTY.
Image 19: Wiring Connection Diagram
8.2.Technical Specifications
29 | P a g e

Technical Specifications Inverter:
Nominal DC Input 24 VDCContinuous Power Rating 2500 VAAC Voltage/Frequency 120 VAC 60 HzContinuous AC RMS Output 20.8 Amps ACIdle Power 6-20 WattsTypical Efficiency 92%Total Harmonic Distortion 2-5%Output Voltage Regulation ± 2%Maximum Output Voltage 50 amps AC RMSAC Overload Capability Surge 6000 VA
5 seconds 4800 VA 30 minutes 3200 VA
AC Input Current Max 60 amps ACAC Input Voltage/Frequency 80-150 VAC 58-62 HzDC Input Range 21-34 VDCWeight 56 lbs
Technical Specifications DAQ NI 6008 USB:
8 analog inputs (12-bit, 10 kS/s) 2 analog outputs (12-bit, 150 S/s); 12 digital I/O; 32-bit counter Bus-powered for high mobility; built-in signal connectivity OEM version available Compatible with LabVIEW, LabWindows/CVI, and Measurement Studio for Visual
Studio .NET NI-DAQmx driver software and NI LabVIEW SignalExpress LE interactive data-logging
software
Technical Specifications LEM LA 55-P Current Transducer:
30 | P a g e

Technical Specifications Southwest Windpower Air X 400:
31 | P a g e

Rotor Diameter 46 in.Weight 13 lbStart-Up Wind Speed 8 mphVoltage 24 VDCRated Power 400 watts at 28 mphTurbine controller Micro-processor based smart internal regulatorBody Cast aluminumBlades 3-Carbon fiber compositeOverspeed Protection Electronic torque controlKilowatt Hours/Month 38 kWh/mo at 12 mphSurvival Wind Speed 110 mph
Technical Specifications Hamlin Hall Sensor:
32 | P a g e

33 | P a g e