windpro / energy - emd international a/s · pdf filewindpro / energy modelling of the...
TRANSCRIPT

WindPRO / ENERGY
Modelling of the Variation of
Air Density with Altitude through Pressure, Humidity and Temperature
99.3 99.4 99.5 99.6 99.7 99.8 99.9 100.00
1000
2000
3000
4000
5000
Ratio of Moist Air Density to Dry Air Densi ty
Ratio [%]
Height [m]
RH = 25%RH = 50%RH = 75%
RH = 100%
EMD International A/S Niels Jernes Vej 10, DK-9220 Aalborg, Denmark
www.emd.dk or www.windpro.comphone +45 9635 4444, fax. +45 9635 4446
e-mail: [email protected]

Published by: EMD International A/S Niels Jernesvej 10 9220 Aalborg Ø Tel: +45 9635 4444 Fax: +45 9635 4446 Email: [email protected] web: www.emd.dk Author(s) Morten Lybech Thøgersen, M.Sc., Document history 18-05-05 - 1st draft – Morten Lybech Thøgersen, M.Sc., [email protected] 24-05-05 – 2nd draft – proof reading by Heidi Iversen & Thomas Sørensen, EMD 24-05-05 – 1st edition 14-12-05 – User guide added – Thomas Sørensen Front cover The front cover shows the air density variation with height – calculated using the U.S. Standard Atmosphere parameters. Also shown is the relative influence of moist air. Copyright This document is copyrighted EMD International A/S. Unauthorized use is prohibited. The document may be used as reference manual only by registered users WindPRO or by users with a valid time limited registration key to the WindPRO software system. Other use requires a written permission from EMD International A/S.

Table of Contents 1. Introduction 1-1
References 1-1 2. Dry Air Density Variation with Altitude 2-1 Geopotential Altitude 2-1 The Perfect Gas Law 2-2
Temperature Variation in the Atmosphere 2-2 The Hydrostatic Equation 2-3 Air Density Calculations with Pressure Changes 2-3 U.S. Standard Atmosphere 2-3 References 2-4
3. Density of Moist Air 3-1 Density of Moist Air – Governing Equation 3-1 Saturation Vapor Pressure 3-2 Different Measures of Humidity 3-2
Calculating the Air Density of Moist Air 3-2 Sample Calculation with US Standard Atmosphere Parameters 3-3 Air Density Variation with Humidity and Pressure (alternative equations) 3-4
References 3-5 4. User Guide 4-1 Default settings 4-1 User control of the air density calculation 4-2 A fixed air density for the calculation 4-2 A fixed air density based on known temperature and height (the 2.4 way) 4-2 Using the climate data base 4-3 Using measurements on site 4-4 Advanced mode 4-4 References 4-5

1. Introduction
1. Introduction The air density calculations have been subjected to international standardization, presumably because the air density influences the lifting capacity of aircrafts. The air density varies with altitude and temperature. For wind turbines, the air density is a key parameter when estimating wind energy, as the energy output from the WTGs proportionally depends on this parameter. The estimated power output from the WTG, P, is given in the equation below.
5.0 3eCAwP ⋅⋅⋅⋅= ρ (1)
where P is the produced power output [W]
ρ is the air density [kg/m3] w is the wind speed [m/s] A is the area swept by the rotor [m2]
Ce is the total efficiency of the WTG at the given wind speed While the energy calculations typically are calculations over a large time scale, the air density must be given as the expected mean density over the period considered. As an alternative to using a constant air density – which is reasonable assumption in most terrains - WindPRO offers a model to take the variations in air density with air temperature and pressure into account. This model could be used in mountainous terrains. The model for the varying dry air density is mainly based on equations in the US Standard Atmosphere Model from 1976 [1]. Since moist air is less dense than dry air, also a model for including the variation in humidity is also implemented. This is based on equations from M. Salby [2]. The WindPRO model offers the option for the user to set site-specific temperatures, humidity and pressure parameters – thus enabling a detailed air density description for turbines situated with very varying hub- heights.
References [1] U.S. Standard Atmosphere, 1976, U.S. Government Printing Office, Washington, D.C. [2] Murry L. Salby: Fundamentals of Atmospheric Physics, Academic Press, 1996, Elsevier Science
Page 1-1

2. Dry Air Density Variation with Altitude
2. Dry Air Density Variation with Altitude
Cronalaght Wind Farm, Ireland.
This chapter gives an introduction to the physical and theoretical considerations needed when developing the set of equations describing the variation of dry air with altitude.
Geopotential Altitude Modelling of the standard atmosphere is typically done in terms of the geopotential altitude. This is due to a simplification of the equations describing the atmosphere. The idea behind the geopotential altitude is that a small change in geopotential altitude will cause the same change in gravitational potential energy as the same change in geometric altitude at sea level. This is mathematically expressed as: (1) GdHdZZg =)( where g(Z) is the acceleration of gravity (decreases at increasing altitudes) Z is the geopotential altitude G is the acceleration of gravity at sea level dH is the geometric altitude The value of the gravity varies with height, and is found to follow the equation below
2)(⎟⎠⎞
⎜⎝⎛
+=
EZE
GZg (2)
where E is the radius of the earth (∼6535 km) Combining the two equations above and integrating yields give an expression for the geopotential altitude.
HEEHZ
ZEEZdZ
EZEdHH
dZEZ
EdZGgdH
ZH
+=
+=⎟
⎠⎞
⎜⎝⎛
+==
⎟⎠⎞
⎜⎝⎛
+==
∫∫0
2
0
2
(3), (4), (5)
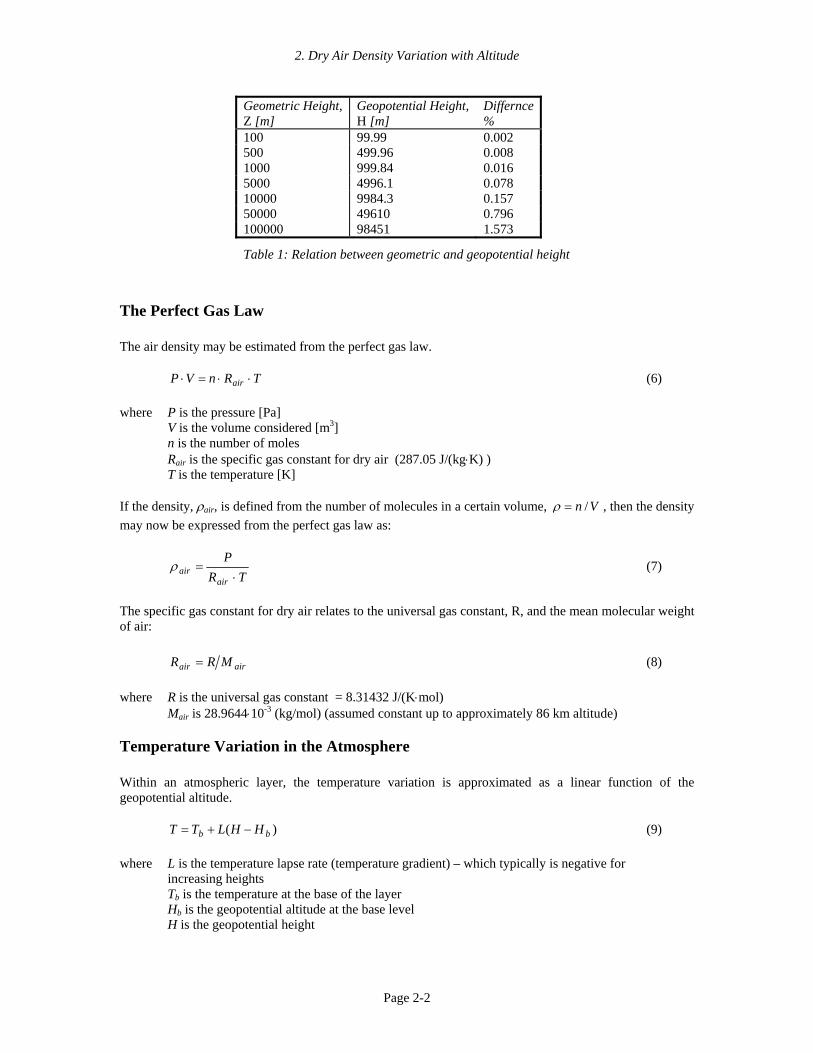
The relation between geopotential height and geometric height is used to calculate the table below. It is seen, that the difference between the two altitude measures is marginal for the lower levels of the atmosphere where wind turbines are situated. Thus, in WindPRO we approximate the geopotential height with the geometric height.
Page 2-1
2. Dry Air Density Variation with Altitude
Geometric Height,Z [m]
Geopotential Height, H [m]
Differnce%
100 99.99 0.002 500 499.96 0.008 1000 999.84 0.016 5000 4996.1 0.078 10000 9984.3 0.157 50000 49610 0.796 100000 98451 1.573
Table 1: Relation between geometric and geopotential height
The Perfect Gas Law The air density may be estimated from the perfect gas law. (6) TRnVP air ⋅⋅=⋅ where P is the pressure [Pa] V is the volume considered [m3] n is the number of moles Rair is the specific gas constant for dry air (287.05 J/(kg⋅K) ) T is the temperature [K] If the density, ρair, is defined from the number of molecules in a certain volume, Vn /=ρ , then the density may now be expressed from the perfect gas law as:
TR
P
airair ⋅
=ρ (7)
The specific gas constant for dry air relates to the universal gas constant, R, and the mean molecular weight of air: airair MRR = (8) where R is the universal gas constant = 8.31432 J/(K⋅mol) Mair is 28.9644⋅10-3 (kg/mol) (assumed constant up to approximately 86 km altitude)
Temperature Variation in the Atmosphere Within an atmospheric layer, the temperature variation is approximated as a linear function of the geopotential altitude. )( bb HHLTT −+= (9) where L is the temperature lapse rate (temperature gradient) – which typically is negative for
increasing heights Tb is the temperature at the base of the layer Hb is the geopotential altitude at the base level H is the geopotential height
Page 2-2

2. Dry Air Density Variation with Altitude
The Hydrostatic Equation Hydrostatic modelling of the atmosphere is a reasonable approximation – even if the atmosphere is in motion. This is because the vertical displacements of air and their time derivatives are small compared to the forces in the hydrostatic equation – see M. Salby [1]. The basic hydrostatic equation is
GdH
dZZgdPρρ
−=−= )(
(10)
Air Density Calculations with Pressure Changes Using the hydrostatic equation with the perfect gas law and the stepwise linear temperature variation assumption, the hydrostatic equation yield:
dHHHLT
PRMGdP
bbair ))(( −+−= (11)
Integrating the equation gives the relation between base variables and the ones in the specified height [2]
∫∫ −+−=
G
H bbair
P
P bb
dHHHLTR
MGdPP ))((
11
0for )(
exp =⎥⎦
⎤⎢⎣
⎡ −−= L
RTHHGM
PP
b
b
b and (12), (13), (14)
0for )( RLGM
≠⎥⎦
⎤⎢⎣
⎡ −+= L
THHLT
PP
b
bb
b
US Standard Atmosphere The US Standard Atmosphere, published in 1986, holds a model for the development of pressure and density with altitude over the sea level. The model used in WindPRO is based on the specification for the lower 11 km of the atmosphere. In the US Standard Atmosphere, seven fundamental layers are defined in the lower 86 kilometres of the atmosphere:
h1 [km] 0 11 20 32 47 51 71 h2 [km] 11 20 32 47 51 71 84.852 L (dT/dh) [K/km] -6.5 0.0 1.0 2.8 0.0 -2.8 -2.0
The heights are given in geopotential heights. 84.852 km corresponds to a geometric height of 86 km. Standard values of other important parameters are:
Page 2-3

2. Dry Air Density Variation with Altitude
Sea level pressure, p0 101325 N/m2 Sea level temperature, T0 288.15 K Hydrostatic constant 34.1631947 K/km
The standard sea level density that is calculated from the settings above is 1.225 kg/m3. The variation of dry air density and pressure - using the US standard atmosphere parameters - are shown in the Figure 1 and Figure 2 below.
Figure 1: Dry Air Density Variation.
Figure 2: Dry Air Pressure Variation-
References [1] Murry L. Salby: Fundamentals of Atmospheric Physics, Academic Press, 1996, Elsevier Science [2] Ralph L. Carmichael, The Hydrostatic Equations, 2003 (internet note, www.pdas.com/coesa.htm)
Page 2-4

3. Density of Moist Air
3. Density of Moist Air
Brokilde Wind Farm, Denmark.
Even if moist air is less dense than dry air, the water vapor seldom represents more than a few percent of the air mass. The model for moist air is based on the Dalton law for partial pressures, and is included in WindPRO in order to complete the description of the air density variation. The description is based on M. Salby [1], and is valid for air not condensed. In WindPRO the user may input three different measures of the vapor:
• Relative humidity • Dew point temperature • Specific humidity
The user inputs are – however – always converted into a relative humidity – which is saved with the WindPRO project.
Density of Moist Air – Governing Equation The density is determined as a mixture of dry air molecules and water vapour molecules
TRTP
TRTP
v
v
d
dair
)()(+=ρ (1)
where ρair is the density [kg/m3] Pd is the partial pressure of dry air [Pa] Pv is the water vapour partial pressure [Pa] Rd is the specific gas constant for dry air [J/(kgK)] ) = 287.05 Rv is the specific gas constant for water vapour [J/(kgK)] = 461.495 T is the temperature [K]
Saturation Vapor Pressure In order to calculate the density of moist air, we need to know the saturated vapour pressure. This concept is related to the process of evaporation. Considering a closed container with water and air, the evaporation process will proceed until there are as many molecules returning to the liquid as there are escaping. When this balance is achieved then the vapour is said to be saturated (and the corresponding pressure denoted saturated vapour pressure). When the saturated vapour
Figure 1: Variation of the saturation vapor pressure.
Page 3-1
3. Density of Moist Air
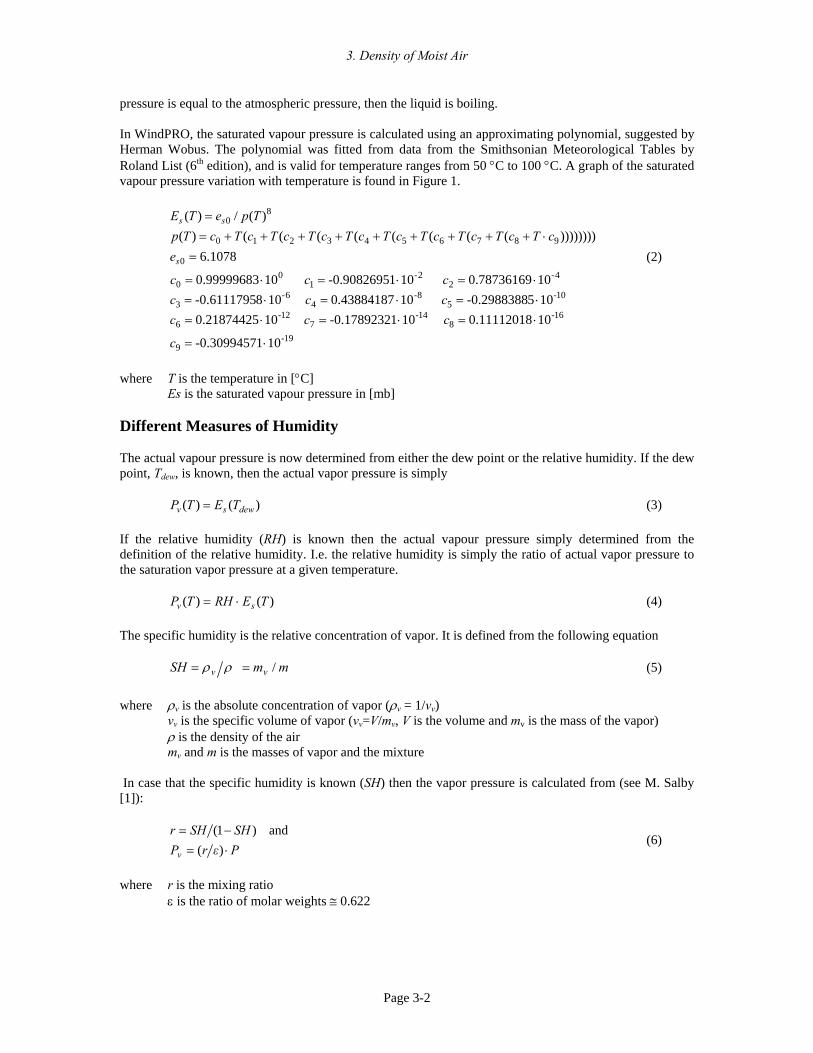
pressure is equal to the atmospheric pressure, then the liquid is boiling. In WindPRO, the saturated vapour pressure is calculated using an approximating polynomial, suggested by Herman Wobus. The polynomial was fitted from data from the Smithsonian Meteorological Tables by Roland List (6th edition), and is valid for temperature ranges from 50 °C to 100 °C. A graph of the saturated vapour pressure variation with temperature is found in Figure 1.
(2)
19-9
16-8
14-7
12-6
10-5
8-4
6-3
4-2
2-1
00
0
9876543210
80
101-0.3099457
100.11112018101-0.1789232100.21874425105-0.2988388100.43884187108-0.6111795100.78736169101-0.9082695100.99999683
6.1078))))))))(((((((()(
)(/)(
⋅=
⋅=⋅=⋅=⋅=⋅=⋅=⋅=⋅=⋅=
=⋅+++++++++=
=
c
ccccccccc
ecTcTcTcTcTcTcTcTcTcTp
TpeTE
s
ss
where T is the temperature in [°C] Es is the saturated vapour pressure in [mb] Different Measures of Humidity The actual vapour pressure is now determined from either the dew point or the relative humidity. If the dew point, Tdew, is known, then the actual vapor pressure is simply (3) )()( dewsv TETP = If the relative humidity (RH) is known then the actual vapour pressure simply determined from the definition of the relative humidity. I.e. the relative humidity is simply the ratio of actual vapor pressure to the saturation vapor pressure at a given temperature. (4) )()( TERHTP sv ⋅= The specific humidity is the relative concentration of vapor. It is defined from the following equation mmSH vv /== ρρ (5) where ρv is the absolute concentration of vapor (ρv = 1/vv)
vv is the specific volume of vapor (vv=V/mv, V is the volume and mv is the mass of the vapor) ρ is the density of the air mv and m is the masses of vapor and the mixture
In case that the specific humidity is known (SH) then the vapor pressure is calculated from (see M. Salby [1]):
PεrPSHSHr
v ⋅=−=
)(and )1(
(6)
where r is the mixing ratio ε is the ratio of molar weights ≅ 0.622
Page 3-2

3. Density of Moist Air
Calculating the Air Density of Moist Air The specific gas constant of the mixture of dry and moist air is expressed as:
d
dd
vdmix
RSH
RSHRSH
RSHRSHR
⋅⎟⎠⎞
⎜⎝⎛ −+=
⋅+⋅−=
⋅+⋅−=
)111(
)1(
)1(
ε
ε (7)
Using this new gas constant with the equations (13) and (14) established in the previous Chapter 2, enables us to calculate the density of moist air. Note, it is an implicit assumption that the gas constant of the mixed gas remains constant through varying heights. This is presumably a reasonable assumption – because the correction due to moisture is very small. Sample Calculation with US Standard Atmosphere Parameters In the Figure 2 and Figure 3 the air density variation with height is shown for the U.S. Standard Atmosphere, 1976. Included are also different measures of relative humidity – which are shown to have only a quite small influence.
Figure 2: Moist Air Density Variation.
Figure 3: Moist Air Pressure Variation.
In Figure 4 the relative difference between dry air and moist air is shown for the first 5000 meters above the sea level. It is observed that the difference is below 0.7%. Again, the figure is calculated using the US Standard Atmosphere parameters.
Page 3-3

3. Density of Moist Air
99.3 99.4 99.5 99.6 99.7 99.8 99.9 100.00
1000
2000
3000
4000
5000
Ratio of Moist Air Density to Dry Air Density
Ratio [%
Height [m]
RH = 25%RH = 50%RH = 75%
RH = 100%
Figure 4: Ratio of Moist Air to Dry Air.
Air Density Variation with Humidity and Pressure (alternative equations) The CRC Handbook of Chemistry and Physics [2] holds an alternative description of the of the moist air density variation with temperature, pressure and vapor pressure. The relation is:
( ) ( )[ ]760/7383.0/13.2732929.1 eBTD −⋅= (8) where T is the absolute temperature (degK) B is the barometric pressure (mmHG) e is the vapor pressure (mmHG) This equation (8) is now used to make a sensitivity study of the influence of moist air. This is done by calculating the ratio of moist air density to dry air density. This calculation is shown – for temperatures 5oC - 20 oC in the figures below. From the Figure 5 - Figure 8 it is observed, that the density influence of moist air is less than 1.7 percent for the considered temperature range. Higher temperatures yield a higher influence. For wind turbine applications the air moisture density influence could – in most cases – be ignored (i.e. it is a reasonable assumption to use the dry air properties).
Figure 5: Density Ratio for Temperature = 5 deg C in [%].
Page 3-4

3. Density of Moist Air
Figure 6: Density Ratio for Temperature = 10 deg C in [%].
Figure 7: Density Ratio for Temperature = 15 deg C in [%].
Figure 8: Density Ratio for Temperature = 20 deg C in [%].
References [1] Murry L. Salby: Fundamentals of Atmospheric Physics, Academic Press, 1996, Elsevier Science [2] CRC Handbook of Chemistry and Physics, CRC Press Inc., 60th edition, 1981,
Page 3-5

4. User Guide
4. User Guide This chapter gives instructions on how to operate the air density calculator. Compared to earlier editions of WindPRO the air density calculation has with WindPRO 2.5 become rather more sophisticated and therefore also more complex for the user. The theoretical background is covered in the previous two chapters.
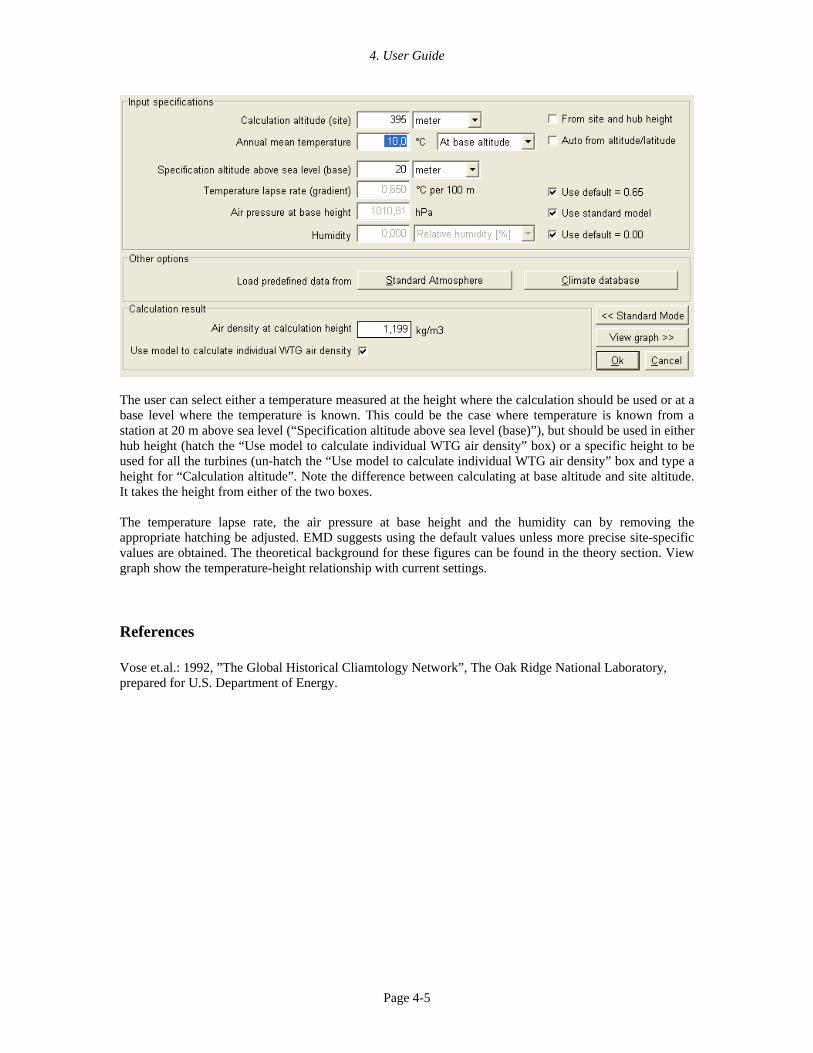
Default settings WindPRO will by default try to calculate the air density of the site. If the user do nothing else but accept the suggestion from WindPRO the air density field will be greyed out with a hatching in the Auto / Individual box. The default settings of the Air Density Calculator can be seen by pressing the Edit/View button and is shown below.
Since the individual WTG air density box is checked WindPRO will calculate an individual value for each of the turbines including the location of the key result. The hatching of the “From site and hub height” box means that WindPRO calculates the height above sea level of the hubs of each of the turbines. The height in the greyed box is the height above sea level of the site data object + the key result height. Please note that WindPRO can only calculate the height above sea level for the turbines if the z coordinate is given in the WTG properties either through individual values or from the DHM. If a WAsP interface or an ATLAS calculation is made the heights for the turbines come from the site data object, for a METEO calculation they come from the Meteo object. The hatching of the “Auto from altitude/latitude” means that WindPRO tries by itself to calculate a temperature at hub height. This is based on the latitude of the location and the height above sea level. For the latitude WindPRO applies the location of the site to a best-fit relation between latitude and temperature at sea level. It is a sound assumption that temperature decreases with distance from the equator, but local climate factors can influence the temperature radically. The most prominent example is the difference between Europe and North America (and indeed Asia too) caused by the Gulf Stream. The temperature in Europe is for the same latitude significantly higher than in North America. For this reason a separate relation is used for Europe. The two relations are shown below.
Page 4-1

4. User Guide
Auto-temperature vs. Latitude, Europe (Lon -23 to +35; Lat>35)
y = -0,0068x2 + 0,0439x + 26,763
-60
-50
-40
-30
-20
-10
0
10
20
30
40
-100 -50 0 50 100
Latitude
Tem
pera
ture
(oC)
Temp-elev <25mPoly. (Temp-elev <25m)
Auto-temperature vs. Latitude, NON Europe (Outside Lon -23 to +35 or LAT<35)
y = -0,008x2 + 0,0008x + 27,313
-60
-50
-40
-30
-20
-10
0
10
20
30
40
-100 -50 0 50 100
Latitude
Tem
pera
ture
(oC)
Temp-elev <25mPoly. (Temp-elev <25m)
From this temperature at sea level the temperature at hub height is found using the temperature/height relationship discussed in the theoretical sections. The temperature shown in the greyed box is the temperature at key result height above the location of the site data object. The air density in the calculation result box is the calculated air density at key result height above the site data object.
User control of the air density calculation The user has a number of options for influencing the air density calculation. The options are discussed in the below case situation.
A fixed air density for the calculation. If a fixed air density is wanted, to be used for all the turbines in the calculation you do not even have to access the air density calculator. Simply remove the hatching for “Auto/Individual” and type the wanted air density.
A fixed air density based on known temperature and height (the 2.4 way). If you access the air density calculator, remove all the three visible hatchings and type in the temperature and height above sea level, then you get a calculated air density that will be used for all the turbines and the key result calculation. This is exactly what was done in earlier versions of WindPRO. This setup is shown below.
Page 4-2

4. User Guide
Using the climate data base The user can access the climate database by pressing the “Climate database” button. This starts a search through the climate database for the 20 closest stations. When the search is done the following window appear.
The climate database is from the “Global Historical Climatology Network ” (vers. 1) from The Oak Ridge National Laboratory (Vose et.al. 1992). Highlighting a station either in the list or on the map lists the properties of this station in the lower two windows. Here profiles on temperature, pressure and humidity can be seen. Pressing Ok returns the average temperature and height above sea level to the air density calculator.
Page 4-3

4. User Guide
Please note that the hatching is now removed from the height “from site and hub height” and temperature “auto from altitude/latitude” boxes. Instead the air density is calculated based on a specific height and temperature. The relations discussed in the theory section then translate this to an air density for each hub height and as shown as the calculation result for the key result height above the site data object. For resetting the model press “Standard Atmosphere” and the settings returns to normal.
Using measurements on site. If measurements were made on the site you can enter the average temperature measured and the height above sea level for the measurements (base height of the tower + the metering height). This requires that the two hatchings related to height and temperature is removed. Keeping the “Use model to calculate individual WTG air density” box hatched will then translate the air density to the hub height of each turbine.
Advanced mode Pressing the “Advanced Mode” button gives you the full view of the air density calculator. Here you have the full flexibility to design your own air density calculator.
Page 4-4
4. User Guide
The user can select either a temperature measured at the height where the calculation should be used or at a base level where the temperature is known. This could be the case where temperature is known from a station at 20 m above sea level (“Specification altitude above sea level (base)”), but should be used in either hub height (hatch the “Use model to calculate individual WTG air density” box) or a specific height to be used for all the turbines (un-hatch the “Use model to calculate individual WTG air density” box and type a height for “Calculation altitude”. Note the difference between calculating at base altitude and site altitude. It takes the height from either of the two boxes. The temperature lapse rate, the air pressure at base height and the humidity can by removing the appropriate hatching be adjusted. EMD suggests using the default values unless more precise site-specific values are obtained. The theoretical background for these figures can be found in the theory section. View graph show the temperature-height relationship with current settings.
References Vose et.al.: 1992, ”The Global Historical Cliamtology Network”, The Oak Ridge National Laboratory, prepared for U.S. Department of Energy.
Page 4-5