wing ground contact revi
TRANSCRIPT

Comparison of Point of Actual Ground Contact with Data Derived from [1]. PAGE 1
Comparison of Point of Actual Ground Contact with Data Derived from [1]
Summary: The theoretical work of Proffesor Kowaleczko [1], can at first glance lead to the false impression, that data of the MAK report [2] are consistent with theory. This present note takes a closer look at a few of the consequences of the results presented in [1] with focus on the ground traces and plane orientation prior to ground contact, and demonstrates this is not the case.
ROBUST A/S Glenn A. Jørgensen.
Comparison of Point of Actual Ground Contact with Data Derived from [1]. PAGE 2
Abstract Based on data of [1] :
• The initial point of wing contact can be found (X=-551m) and a comparison to the actual ground traces as shown in the MAK report and reported in KBWLLP (-518m) show a large inconsistency. Even Kowaleczko’s miscalculated value of (X=-533m) is a significant distance away from the actual ground traces.
• Shifting the trajectory based on Kowaleczko’s data to achieve the calculated point of wing ground contact to the actual location results in the plane flying 11m - 13.7m over the terrain of the Birch tree claimed to hit the wing.
• The three dimensional orientation of the plane as suggested by [1] leads to a contact point between tail and ground much after the point of wing contact, where ground traces show the opposite picture.
• The three dimensional orientation of the plane as suggested by [1] does by no means correlate with the other ground traces as found from satellite photos.
• A good correlation is on the other hand found, if the left wing is assumed significantly shorter than claimed by [1] with values of roll angle, pitch angle and lost wing length as found during the calculations presented in [5] consistent with the roll angle recordings of the black box.
The work by Professor Kowaleczko lacks effort to correlate the results of his theoretical work with some relevant “real world” observations, such as:
o Tying his work in with the recorded ground traces or o giving any indication of the nature of the sudden significant changes in recorded
vertical and horizontal accelerations or o explaining why the left horizontal tail was lost (when the plane according to Mr.
Kowaleczko was near its highest) or o why the FMS system indicated a total power failure 75m prior to the crash.
Another relevant aspect not included in this note, could be the possibility of the plane being further broken in the air prior to the final ground contact. Author: Ms.Sc. Mech. Eng. Glenn A. Jørgensen. 16-01-2014. Rev.I
ROBUST A/S Glenn A. Jørgensen.

Comparison of Point of Actual Ground Contact with Data Derived from [1]. PAGE 3
1. RESULTS 1.1 Point of Ground Contact of Wing Tip.
The wing tip elevation relative to the crash site can by simple geometry be estimated in a conservative manner by:
(1.1)
This taking the main effects related to the roll and pitch angle into account. In the next chapter an even more exact evaluation will be done based on a 3D model of the TU-154 and orienting this according to the calculation performed in [1]. By the later approach the effect of sweep etc. are taken into account as well, and the result only differs minor from the result obtained by equation (1.1) above, where (1.1) is slightly to the conservative side for the relevant input as provided by [1]. Where
See appendix 2 for actual values of H(x), H0, Φ(x) and Θ(x) obtained from [1]. Calculated wing tip elevations relative to the crash site as found by (1.1) are shown in Fig. 1 together with the ground elevation also relative to the crash site as pr. MAK [2] fig. 35 bottom part. From Fig. 1 it is seen, that the wing tip is expected to make ground contact at at distance XKow=-547.5m. By taking the actual wing geometry (sweep etc) into account the distance is pushed further away from the runway by an additional -4.2m (see chapter 1.3) bringing the XKow=-551m. From the satellite picture Fig. 3 taken fromthe MAK report (ref :[2] fig. 35 top part) the actual wing contact occurs at about Xactual = -518m
ROBUST A/S Glenn A. Jørgensen.

Comparison of Point of Actual Ground Contact with Data Derived from [1]. PAGE 4
Fig. 1. Wing tip elevation relative to the terrain of the crash site. The black dotted line is the trajectory as found by data from [1] shifted upwards to achieve the correct position of the initial contact between the left wing tip and the ground. From this one can see, that the height of the plane over the terrain of the Birch tree is 13.7m. This conclusion is independant of the X=-551m found in this work, but merely depening on the trajectory by Kowaleczko’s data. Ground elevation relative to crash site is based on MAK [2] fig 35.
Fig. 2. Same as Fig. 1, but also showing the the trajectory by Kowaleczko based on his incorrect ground level at the crash area. Note even by this the plane flew 11m above the birch tree. This is consistent with the results presented at the Smolensk Conference [5].
ROBUST A/S Glenn A. Jørgensen.

Comparison of Point of Actual Ground Contact with Data Derived from [1]. PAGE 5
Fig. 3. Actual and derived ground contact based on data from [1]. See chapter 1.3 for detailed explanation of the derived distance of -551m.
ROBUST A/S Glenn A. Jørgensen.
Comparison of Point of Actual Ground Contact with Data Derived from [1]. PAGE 6
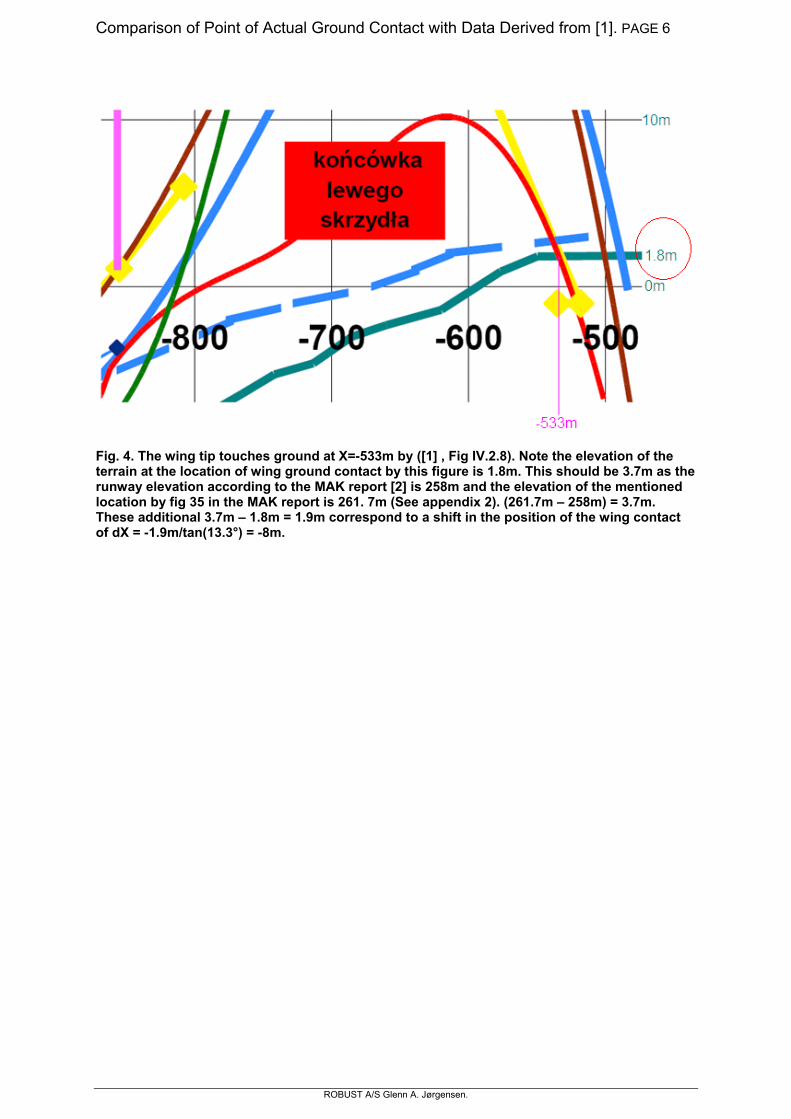
Fig. 4. The wing tip touches ground at X=-533m by ([1] , Fig IV.2.8). Note the elevation of the terrain at the location of wing ground contact by this figure is 1.8m. This should be 3.7m as the runway elevation according to the MAK report [2] is 258m and the elevation of the mentioned location by fig 35 in the MAK report is 261. 7m (See appendix 2). (261.7m – 258m) = 3.7m. These additional 3.7m – 1.8m = 1.9m correspond to a shift in the position of the wing contact of dX = -1.9m/tan(13.3°) = -8m.
ROBUST A/S Glenn A. Jørgensen.
Comparison of Point of Actual Ground Contact with Data Derived from [1]. PAGE 7
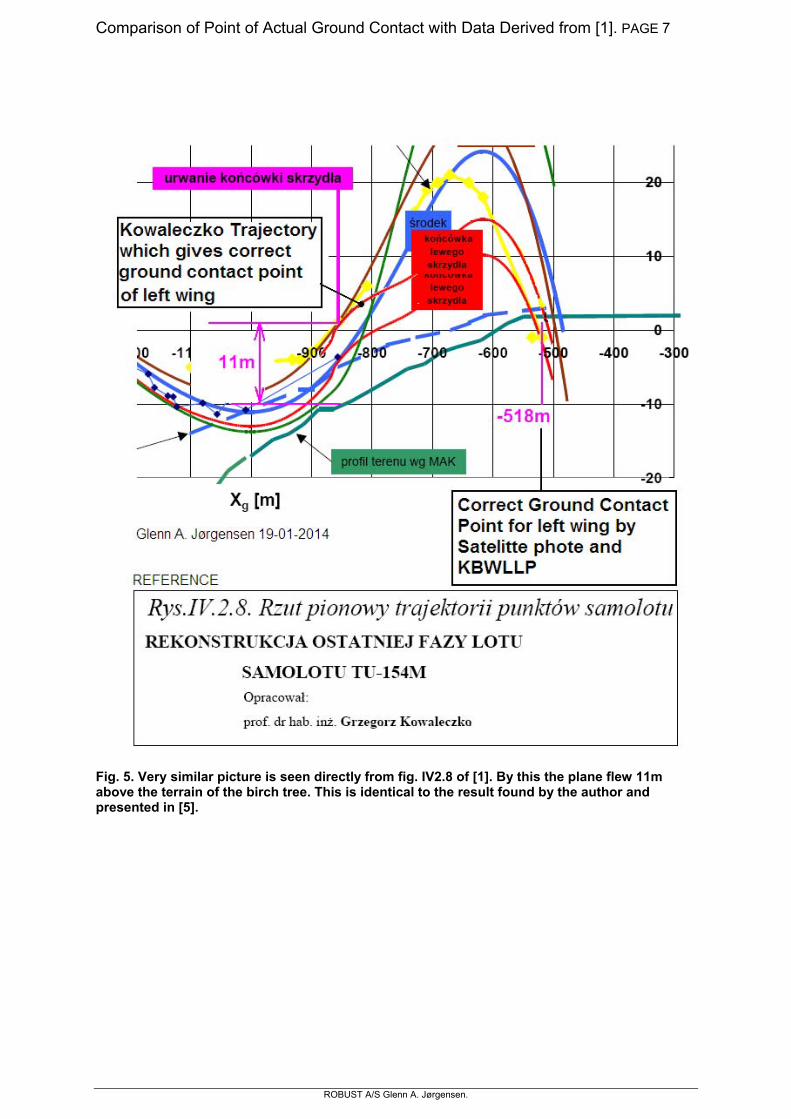
Fig. 5. Very similar picture is seen directly from fig. IV2.8 of [1]. By this the plane flew 11m above the terrain of the birch tree. This is identical to the result found by the author and presented in [5].
ROBUST A/S Glenn A. Jørgensen.

Comparison of Point of Actual Ground Contact with Data Derived from [1]. PAGE 8
ROBUST A/S Glenn A. Jørgensen.
Fig. 6. Distance of ground contact derived from data by [1] using equation (1.1) for two different lost tip lengths.
In [1] two different lost wing lengths are present. One of 6.5m and another of 5.6m (or 5.54m rounded up). It is not clearly stated in [1] which lost wing length is used for calculating the wing tip trajectory presented in figure IV.2.8 of [1], nor is the equation for this presented to the reader. If the lost tip length in [1] is Ltip = 6.5m and not Ltip = 5.54m as should be, then this can according to Fig. 6 explain 4m of the difference from -533 m found by [1] and the -551m found in this work. The line of ground elevation by Kowaleczko is incorrect in Fig. 4 taken from [1] with respect to the MAK data (ref [2], fig 35), and should be drawn at least 1.9m higher at the final right hand part. Then the corrected value of initial ground contact of [1] is : X=-533m - 1.9m/tan(13.3) -4m = -533m -8m -4m = -545m, which then is close to the value found in this work (-551m). Another explanation for the slightly lower value found in [1] could be that the wing tip trajectory is based on a similar simple and conservative approach similar to equation (1.1) of this work, not taking the 3D effects into account. Doing so this adds dX= -3.8m to the distance. Again the reader is left to guess.
1.2 Orientation of the Plane by [1] at initial Ground Contact. From Fig. 1 it can be found that by Eq (1.1) the derived point of ground contact occurs at XKow=-547.5m. By data listed in appendix 2, the following main values of the plane are present in the vicinity of this point of ground contact: Significance Param. Value Unit References Distance to Runway by (1.1) XKow -547.5 m Fig. 1
Distance to Birch xb 312.1 m xb = (859.6m – XKow), Fig. 29
Approximate Time by plots in [1] T 12.5 sec Fig. 33
Height of centre of gravity above runway
Zg 16.1 m Fig. 29, Fig. 30, Fig. 31
Height of centre of gravity above crash site
H-Hcrashsite
12.4 m Fig. 30
Roll angle θ -108 deg Fig. 25, Fig. 26
Yaw Angle ψ -23.7 deg Fig. 27, Fig. 28
Pitch Angle Θ ≈0° deg Fig. 38
Table 1. Key Values of the Plane Orientation at Initial Wing Ground Contact.

Comparison of Point of Actual Ground Contact with Data Derived from [1]. PAGE 9
1.3 3D orientation of the Plane.
Fig. 7. The coordinate system used in this work. See appendix 3 for further information.
In Fig. 9 the plane is oriented according to table 1. See appendix 3 for further details. Of course some variation might be seen to the angles of rotation, but this has only little influence on the obtained results as demonstrated in Fig. 10, and in the sensitivity analysis found in appendix 4.
ROBUST A/S Glenn A. Jørgensen.
Comparison of Point of Actual Ground Contact with Data Derived from [1].PAGE 10
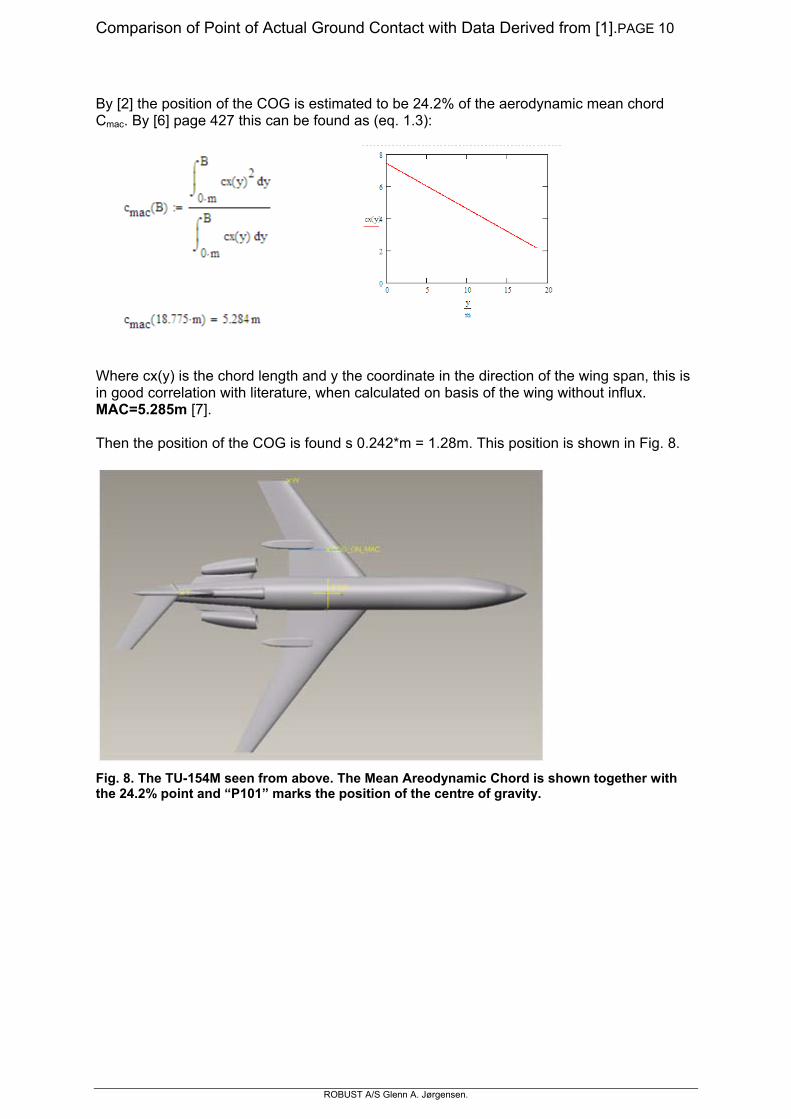
By [2] the position of the COG is estimated to be 24.2% of the aerodynamic mean chord Cmac. By [6] page 427 this can be found as (eq. 1.3):
Where cx(y) is the chord length and y the coordinate in the direction of the wing span, this is in good correlation with literature, when calculated on basis of the wing without influx. MAC=5.285m [7]. Then the position of the COG is found s 0.242*m = 1.28m. This position is shown in Fig. 8.
Fig. 8. The TU-154M seen from above. The Mean Areodynamic Chord is shown together with the 24.2% point and “P101” marks the position of the centre of gravity.
ROBUST A/S Glenn A. Jørgensen.

Comparison of Point of Actual Ground Contact with Data Derived from [1].PAGE 11
Fig. 9. Side view. 3D Orientation of the Plane at Ground Contact. Angle of roll is Φ=-108°, angle of yaw is ψ=-23.7° and pitch angle is Θ=0°. The centre of gravity moves with an angle of about β=13.3deg (see appendix 2) on the final flight according to the calculation of [1]. The left wing is in this view shortened by Ltip = 5.54m.
From this it is seen, that the height of the centre of gravity above the crash site is 12.3 m or about 0.1 m lower at the point of initial wingtip ground contact than found by (1.1). This corresponds to a position of the COG closer to the site of crash of: Δx1 = Δz/tan(β) = 0.1m/tan(13.3deg) = 0.1m/0.236 = +0.4m The angle β is found in appendix 2. Due to the backward sweep of the wing and general wing design, the distance between the centre of gravity and the point where the wing tip initially touches ground projected in the direction of movement (shown as points CG and W in Fig. 9) can be found as Δx2 = -4.2m. (see Fig. 9). Thus including the minor 3D effects the position of the initial contact point of wing tip moves dX = Δx1 + Δx2 = +0.4 - 4.2m = -3.8m , e.g. further away from the site of crash to the position, leading to the more accurate value of:
Xwing_Tip_Position = -547.5m -3.8m = -551m. (1.4) The distance dX is found in a similar manner for a large combination of roll angles and pitch angles (and it is insensitive to the yaw angle). The result is shown in Fig. 10. From this it is seen that the found contact point does not vary a great deal even for a wide span of input variables. In appendix 4 this is repeated for a change in the position of gravity from 24.2% to 34% of the MAC, and the overall result is the same.
ROBUST A/S Glenn A. Jørgensen.
Comparison of Point of Actual Ground Contact with Data Derived from [1].PAGE 12
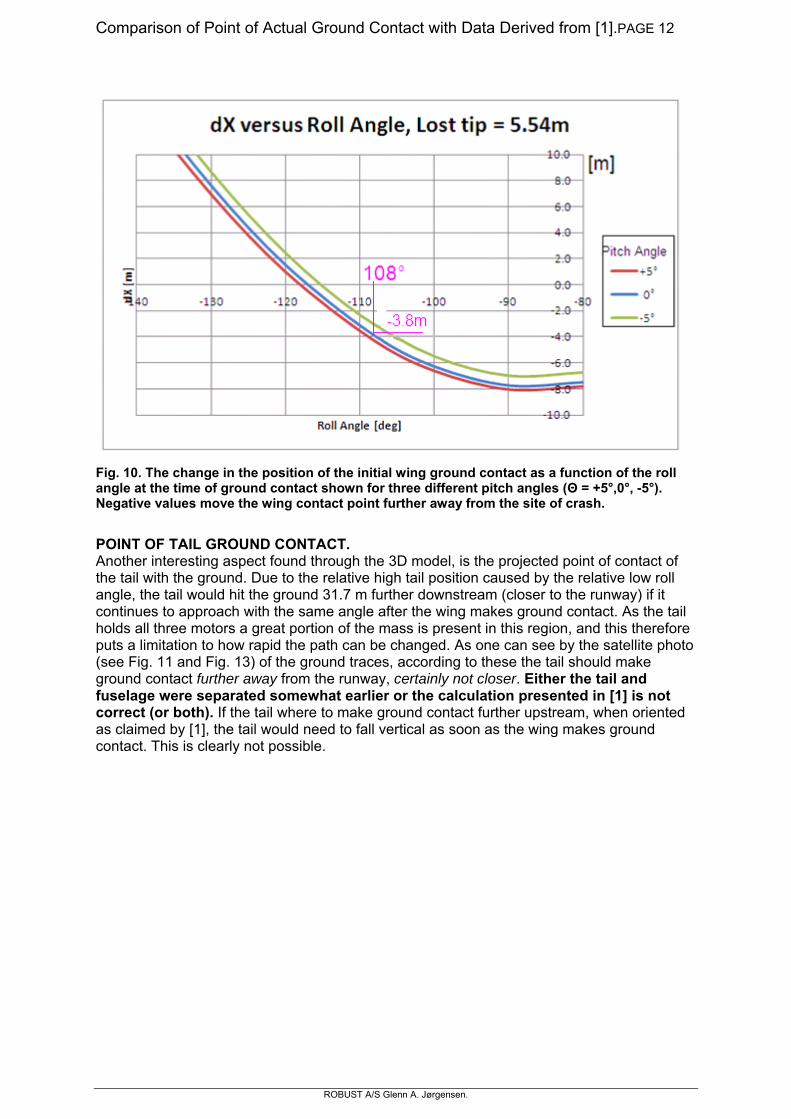
Fig. 10. The change in the position of the initial wing ground contact as a function of the roll angle at the time of ground contact shown for three different pitch angles (Θ = +5°,0°, -5°). Negative values move the wing contact point further away from the site of crash.
POINT OF TAIL GROUND CONTACT. Another interesting aspect found through the 3D model, is the projected point of contact of the tail with the ground. Due to the relative high tail position caused by the relative low roll angle, the tail would hit the ground 31.7 m further downstream (closer to the runway) if it continues to approach with the same angle after the wing makes ground contact. As the tail holds all three motors a great portion of the mass is present in this region, and this therefore puts a limitation to how rapid the path can be changed. As one can see by the satellite photo (see Fig. 11 and Fig. 13) of the ground traces, according to these the tail should make ground contact further away from the runway, certainly not closer. Either the tail and fuselage were separated somewhat earlier or the calculation presented in [1] is not correct (or both). If the tail where to make ground contact further upstream, when oriented as claimed by [1], the tail would need to fall vertical as soon as the wing makes ground contact. This is clearly not possible.
ROBUST A/S Glenn A. Jørgensen.

Comparison of Point of Actual Ground Contact with Data Derived from [1].PAGE 13
Fig. 11. Photo of the ground traces [5].
Fig. 12. Tu154M shown together with the parameters Xp and Xwt.
ROBUST A/S Glenn A. Jørgensen.

Comparison of Point of Actual Ground Contact with Data Derived from [1].PAGE 14
Fig. 13. In the following chapter it is shown, that the ground traces as seen on this satellite photo are not possible with a lost length of Ltip = 5.54m. They correlate very well with theory when assuming the wing is additionally shortened prior to ground contact . A fine correlation is obtained with a lost length of 10 m -11.5 m and a roll angle of Φ ≈130°, the plane COG moving towards the ground with about 15° and a pitch angle of Θ = -4°. These values correlate very well with the calculation of the case of additional wing loss as presented in [5] and the resulting change in roll angle as a function of time correlate with the black box recordings. (The latter is not the case for any of the calculations found in [1].)
ROBUST A/S Glenn A. Jørgensen.
Comparison of Point of Actual Ground Contact with Data Derived from [1].PAGE 15
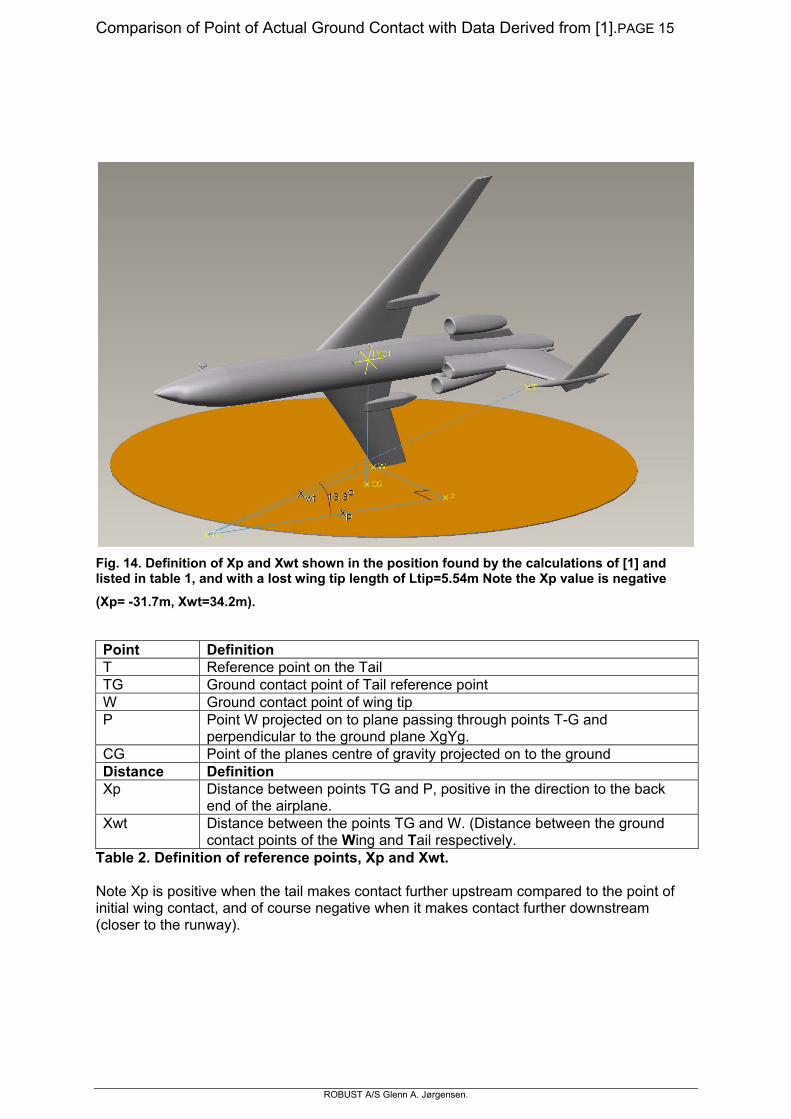
Fig. 14. Definition of Xp and Xwt shown in the position found by the calculations of [1] and listed in table 1, and with a lost wing tip length of Ltip=5.54m Note the Xp value is negative
(Xp= -31.7m, Xwt=34.2m).
Point Definition T Reference point on the Tail TG Ground contact point of Tail reference point W Ground contact point of wing tip P Point W projected on to plane passing through points T-G and
perpendicular to the ground plane XgYg. CG Point of the planes centre of gravity projected on to the ground Distance Definition Xp Distance between points TG and P, positive in the direction to the back
end of the airplane. Xwt Distance between the points TG and W. (Distance between the ground
contact points of the Wing and Tail respectively. Table 2. Definition of reference points, Xp and Xwt. Note Xp is positive when the tail makes contact further upstream compared to the point of initial wing contact, and of course negative when it makes contact further downstream (closer to the runway).
ROBUST A/S Glenn A. Jørgensen.

Comparison of Point of Actual Ground Contact with Data Derived from [1].PAGE 16
Fig. 15. Xp and Xwt shown with a lost wing tip length of Ltip=5.54m and a roll angle of Φ=-145°, Angle of yaw ψ=-23.7°, Pitch angle Θ=0°. Note the Xp value is positive (Xp=8m, Xwt=18.6m).
By rotating the 3D model and measuring the distances Xp and Xwt for a range of roll angles and pitch angles the correlation to these can be found. This is done for the setup as pr. [1] and for the case of additional lost wing lengths. The results are shown in Fig. 17 From data shown in Fig. 17 it is seen that no combination of roll angle and pitch angle correlate to the measured distances Xp and Xwt based on the satellite photo when input variables as claimed in [1] are used. From data shown in Fig. 19 and Fig. 20 it is seen that the combination of roll angle Φ = -127°, pitch angle Θ=-4° and a lost wing length of 10m -11m correlate very well with the measured distances Xp and Xwt based on the aerial photo. This is very close to the case II of additional wing loss as stated in [5].
ROBUST A/S Glenn A. Jørgensen.

Comparison of Point of Actual Ground Contact with Data Derived from [1].PAGE 17
Fig. 16. Xp and Xwt shown for a series of roll angles. Yaw angle is 23.7°. Pitch angle 0°.
ROBUST A/S Glenn A. Jørgensen.
Comparison of Point of Actual Ground Contact with Data Derived from [1].PAGE 18
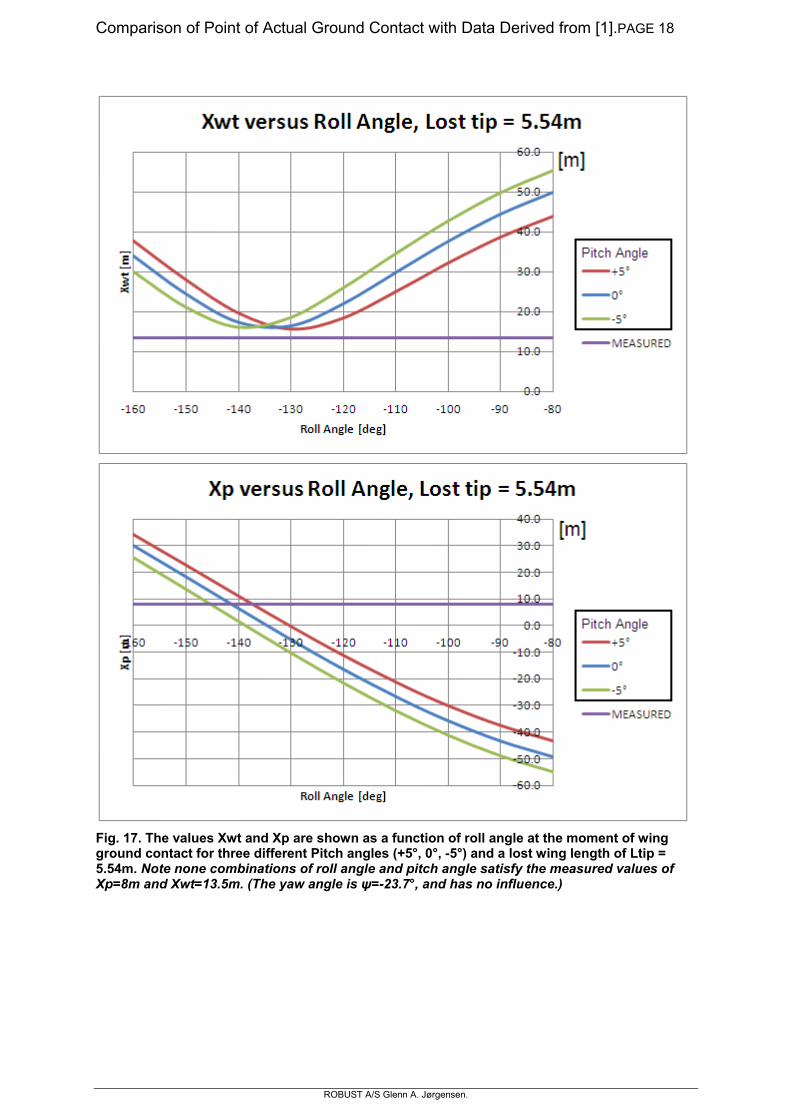
Fig. 17. The values Xwt and Xp are shown as a function of roll angle at the moment of wing ground contact for three different Pitch angles (+5°, 0°, -5°) and a lost wing length of Ltip = 5.54m. Note none combinations of roll angle and pitch angle satisfy the measured values of Xp=8m and Xwt=13.5m. (The yaw angle is ψ=-23.7°, and has no influence.)
ROBUST A/S Glenn A. Jørgensen.
Comparison of Point of Actual Ground Contact with Data Derived from [1].PAGE 19
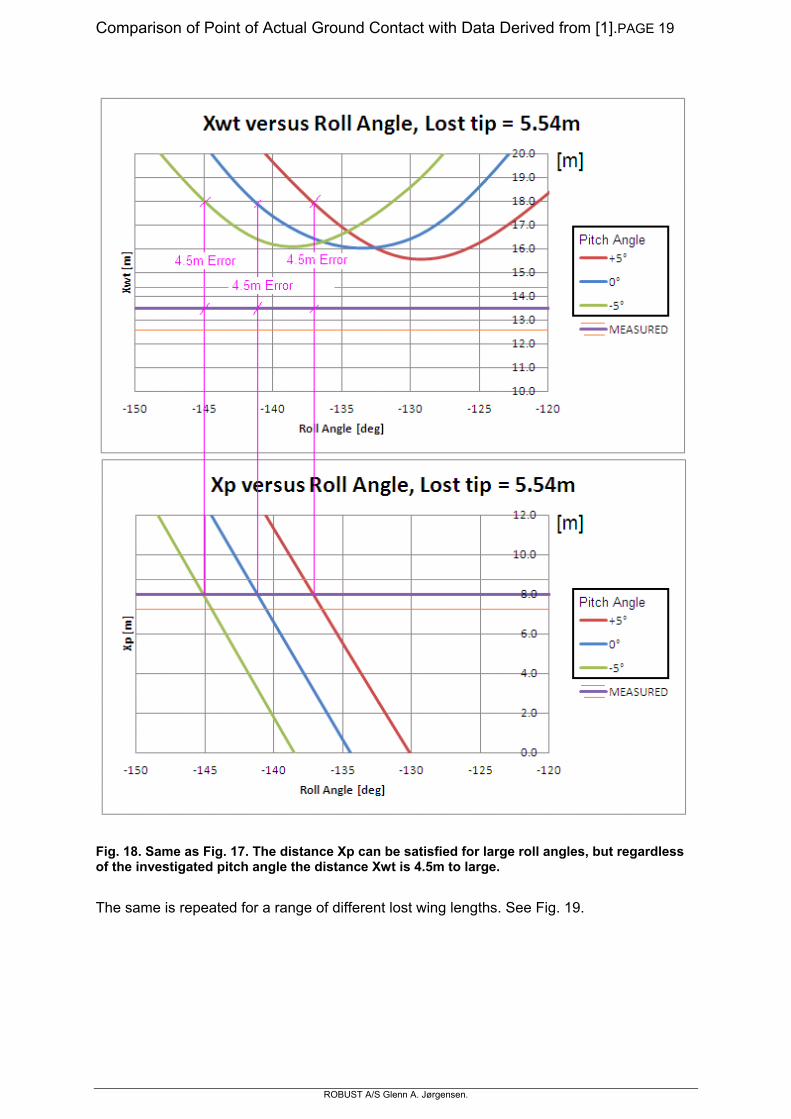
Fig. 18. Same as Fig. 17. The distance Xp can be satisfied for large roll angles, but regardless of the investigated pitch angle the distance Xwt is 4.5m to large.
The same is repeated for a range of different lost wing lengths. See Fig. 19.
ROBUST A/S Glenn A. Jørgensen.

Comparison of Point of Actual Ground Contact with Data Derived from [1].PAGE 20
Fig. 19. The values Xwt and Xp are shown as a function of roll angle at the moment of wing ground contact for four different lost wing lengths. Note the lost length of Ltip = 10m - 11.5m satisfies the measured values of Xp=8m and Xwt=13.5m within a reasonable uncertainty. (The yaw angle is ψ=-23.7°, and has no influence.)
ROBUST A/S Glenn A. Jørgensen.

Comparison of Point of Actual Ground Contact with Data Derived from [1].PAGE 21
Fig. 20. The values Xwt and Xp are shown for evaluating the contact at the front edge, 0.25 chord or at the trailing edge for a lost wing length of 11.5m. Regardless of the method all three give a good correlation between the measured values and calculated values. The corresponding range of roll angle is Φ=126°±4°. From this is is seen, that the resulting lost wing lengths are nearly independent of the choice of reference point on the wing, only the resulting roll angle will shift slightly.
ROBUST A/S Glenn A. Jørgensen.

Comparison of Point of Actual Ground Contact with Data Derived from [1].PAGE 22
Fig. 21. The ground traces correlate with a wing length as shown in the upper part and a roll angle of about 130°. The remaining of the P101 is shown on the lower part for reference. Note the similarity between the two left root wing sections. Earlier work calculating the final flight [5] has demonstrated that a similar wing loss will result in a roll angle very close to this value, and at the same time correlate very nice with the recorded roll angle by the black box system.
Fig. 22. same as above.
ROBUST A/S Glenn A. Jørgensen.

Comparison of Point of Actual Ground Contact with Data Derived from [1].PAGE 23
Fig. 23. Top picture shows the case of additional wing loss (lost length = 11.5m) in the position that correlates both with calculations and with the ground traces. One should expect the area of the wing encircled to be bent back from ground contact. Bottom picture shows photo from the MAK report [2] of this wing section. Note also the soiled and clean parts with a distinct separation.
ROBUST A/S Glenn A. Jørgensen.

Comparison of Point of Actual Ground Contact with Data Derived from [1].PAGE 24
2 CONCLUSION. • The distance for ground contact derived from data presented in [1] does not correlate
with the actual measured position of ground contact as can be seen by satellite photo from the MAK report [2] and claimed in KBWLLP.
• This can indicate the actual length of the left wing is significantly shorter than
assumed by [1] e.g. indicating an additional wing loss.
• The orientation of the plane as claimed by [1] does not correlate with the recorded ground traces, leaving these totally unexplained by the work of [1].
• As earlier stated [5] the ground traces correlate with the case of additional wing loss (Lost wing length 10m -11.5m, rollangle Φ ≈ -130°)
• Shifting the trajectory based on Kowaleczko’s data to achieve the calculated point of wing ground contact to the actual location results in the plane flying 11m – 13.7m over the terrain of the Birch tree claimed to hit the wing.
3 REMARKS. The work by Professor Kowaleczko lacks effort to correlate the results of his theoretical work with some of the relevant real world observations such as:
o Tying his work in with the recorded ground traces or o giving any indication of the nature of the sudden significant changes in recorded
vertical and horizontal accelerations or o explaining why the left horizontal tail was lost (when the plane according to Mr.
Kowaleczko was near its highest) or o why the FMS system indicated a total power failure 75m prior to the crash.
Another relevant aspect not included in this note, could be the possibility of the plane being further broken in the air prior to the final ground contact.
4 REFERENCES. [1] REKONSTRUKCJA OSTATNIEJ FAZY LOTU SAMOLOTU TU-154M. Prof. dr
hab. inż. Grzegorz Kowaleczko, 31-dec-2013. (Published 04.01.2014). [2] Final Report Tu-154M Tail Number 101, Republic of Poland. MAK report Eng.
version. (MAK Report). [3] Data sent to the author of this report by Mr. Grzegorz Kowaleczko oct. 2013. [4] В. П. Бехтир, В. М. Ржевский, В. Г. Ципенко, ПРАКТИЧЕСКАЯ АЭРОДИНАМИКА
САМОЛЕТА Ту-154М, [5] Presentation held at Smolensk Conference 2013 by Glenn A. Jørgensen. [6] Aerodynamics for Engineering Students. Third edition. E.L. Houghton and N.B.
Carruthers. [7] Tupolev Tu-154, The USSR’s Medium Range Jet Airliner, Dmitriy Komissarov,
ISBN 1-85780-241-1 2007.
ROBUST A/S Glenn A. Jørgensen.
Comparison of Point of Actual Ground Contact with Data Derived from [1].PAGE 25
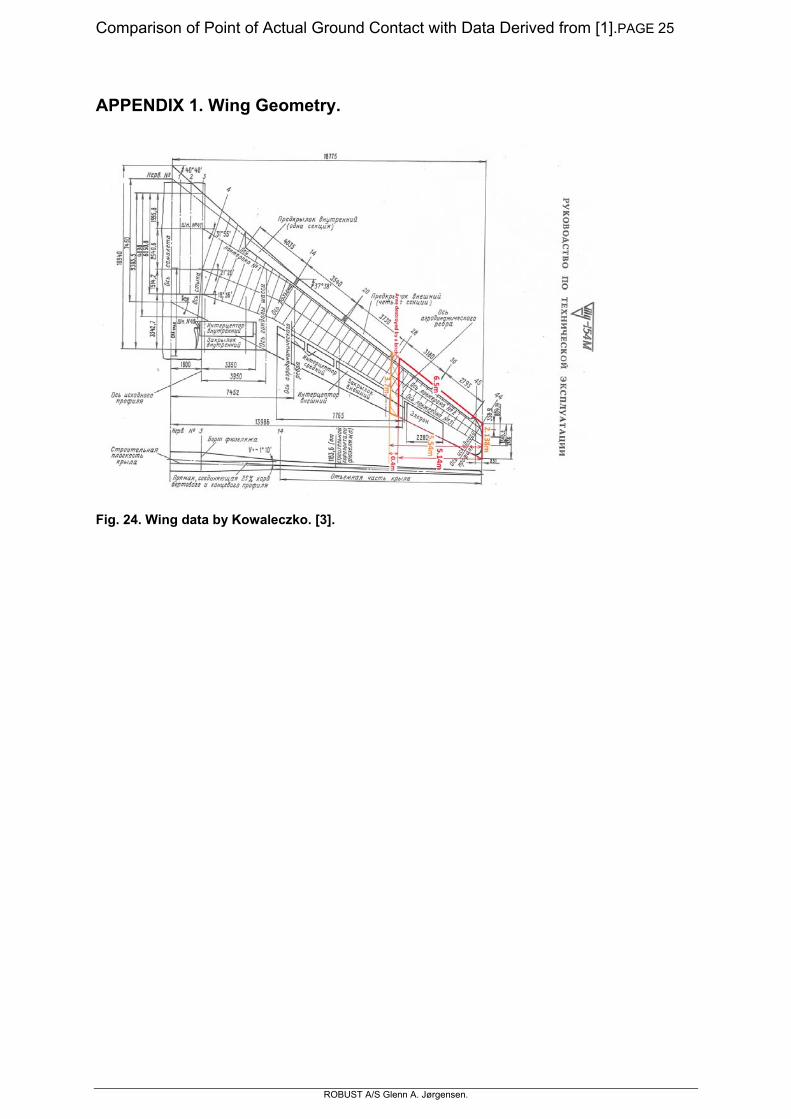
APPENDIX 1. Wing Geometry.
Fig. 24. Wing data by Kowaleczko. [3].
ROBUST A/S Glenn A. Jørgensen.

Comparison of Point of Actual Ground Contact with Data Derived from [1].PAGE 26
APPENDIX 2. DATA.
Fig. 25. Angle of roll by [1], Figure IV.2.4. Time t =8.3 sec at Birch Impact.
Fig. 26.Roll angle as pr. fig. above and curve by linear regression.
ROBUST A/S Glenn A. Jørgensen.

Comparison of Point of Actual Ground Contact with Data Derived from [1].PAGE 27
Fig. 27. Yaw Angle by [1], Figure IV.2.5.
Fig. 28. Yaw angle as pr. fig. above and curve by linear regression.
ROBUST A/S Glenn A. Jørgensen.

Comparison of Point of Actual Ground Contact with Data Derived from [1].PAGE 28
Fig. 29. Height above Runway by [1], figure IV.2.6, page 90. Xbirch = -859.6m.
Fig. 30. Height as pr. fig. above and curve by linear regression.
Height at a Distance to the Birch of xb=321.6m (at point of inital ground contact) is 2.6 m. See Fig. 36. The angle of the COG falling towards the ground can be found from Fig. 30 evaluating 20 m to each side of the point of ground contact: β = atan(ΔZg/Δx) = atan((9.3m – 18.7m)/(-520m – (-560m)) = 13.3 deg
ROBUST A/S Glenn A. Jørgensen.
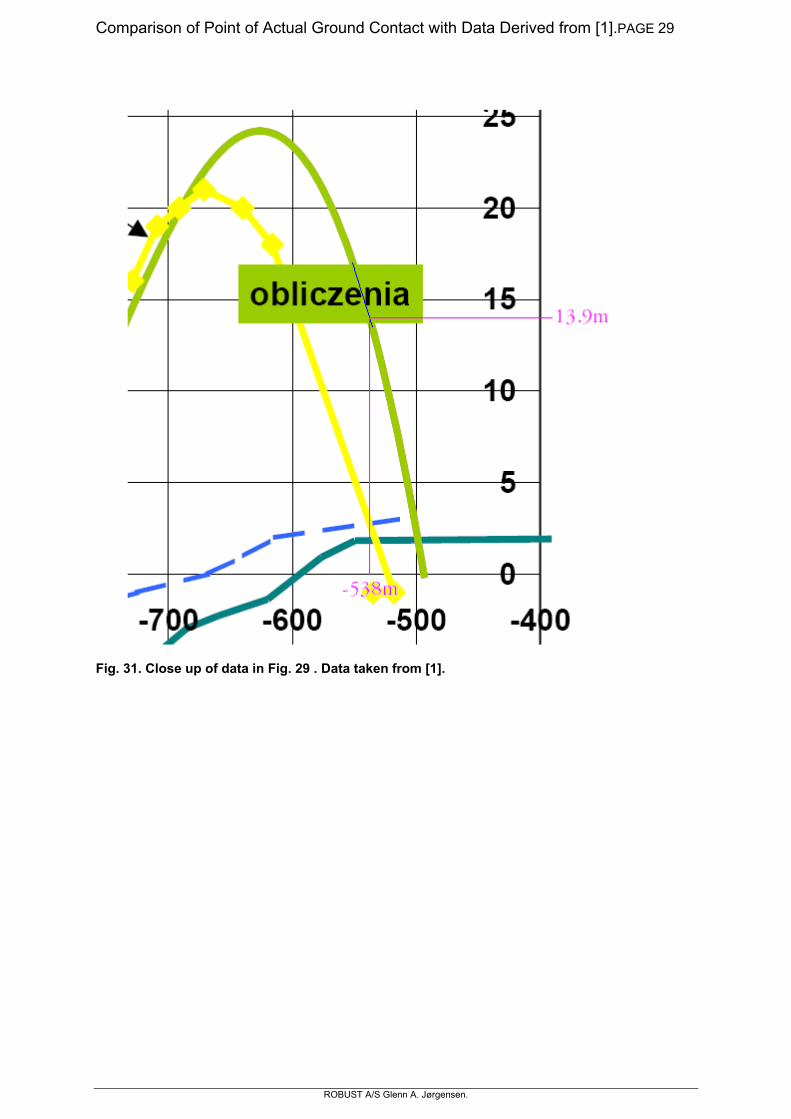
Comparison of Point of Actual Ground Contact with Data Derived from [1].PAGE 29
Fig. 31. Close up of data in Fig. 29 . Data taken from [1].
ROBUST A/S Glenn A. Jørgensen.

Comparison of Point of Actual Ground Contact with Data Derived from [1].PAGE 30
Fig. 32. Recorded velocity by MAK. Taken from [1].
Fig. 33. Calculated Distance based on Vmak versus time t.
The MAK report only lists recorded velocities up to t=12 sec. In the final about Δt=0.5 sec till the wing by [1] makes ground contact the velocity is assumed to continue its increment. This estimate is without any significant importance to the conclusions drawn in this report.
ROBUST A/S Glenn A. Jørgensen.
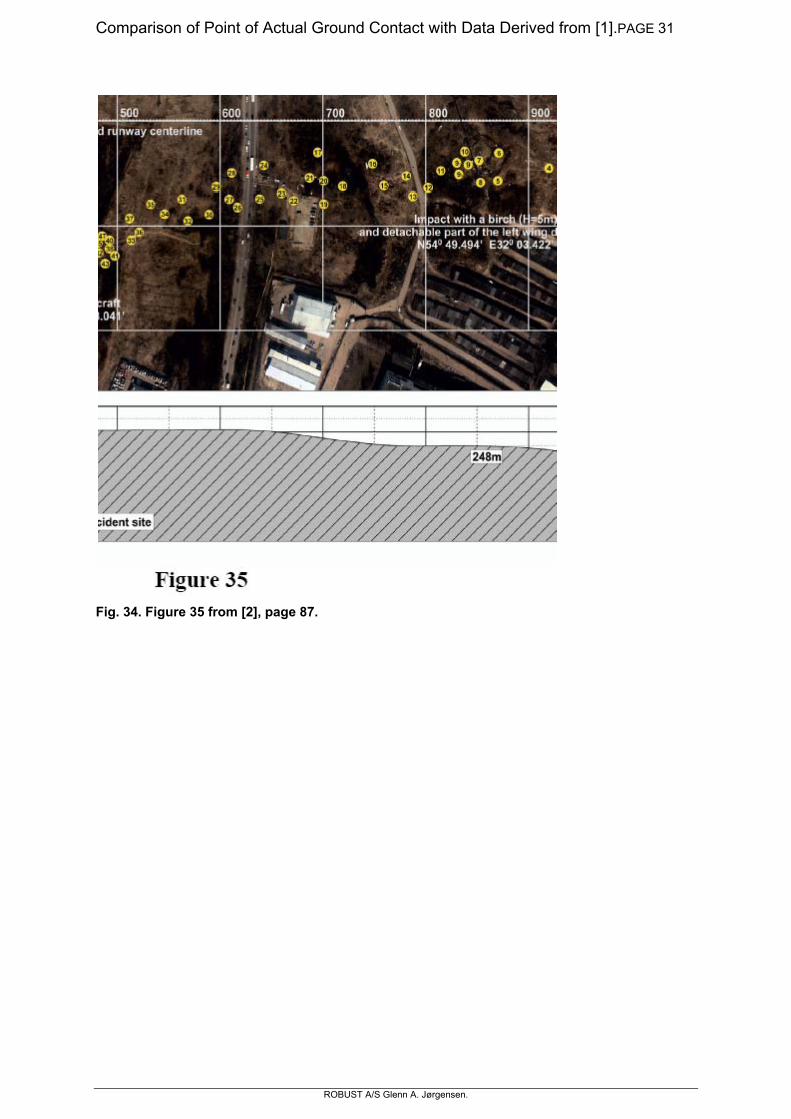
Comparison of Point of Actual Ground Contact with Data Derived from [1].PAGE 31
Fig. 34. Figure 35 from [2], page 87.
ROBUST A/S Glenn A. Jørgensen.
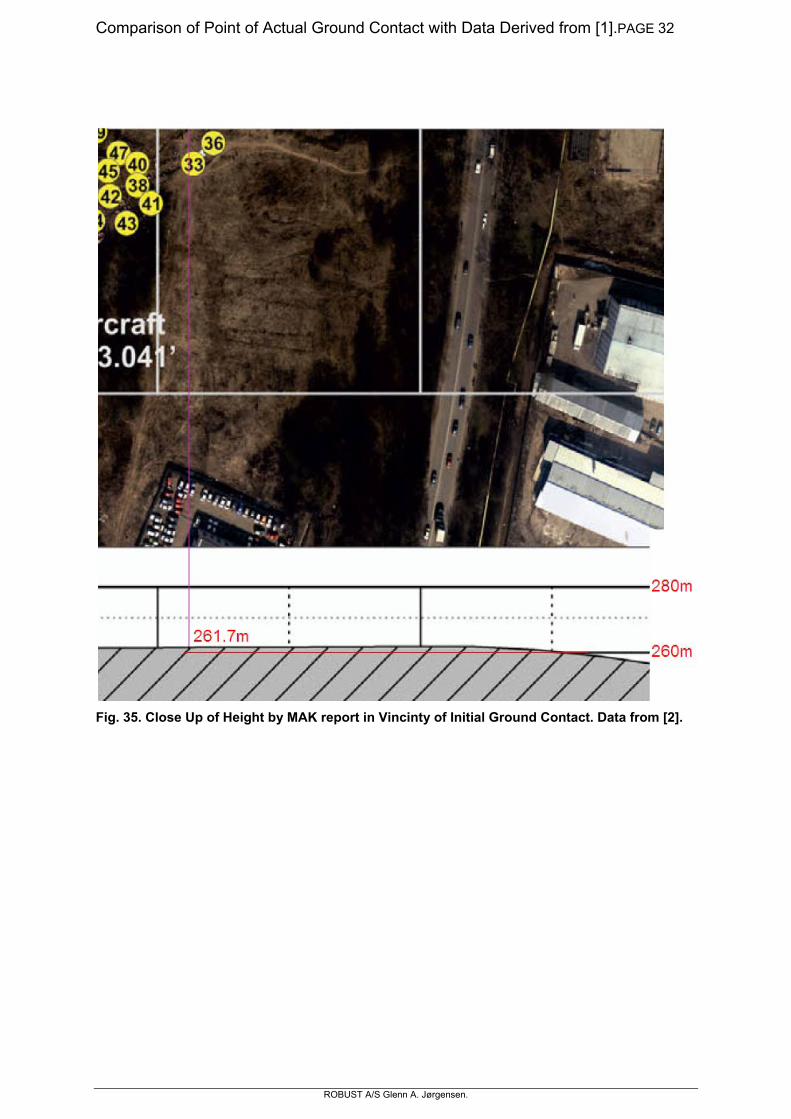
Comparison of Point of Actual Ground Contact with Data Derived from [1].PAGE 32
Fig. 35. Close Up of Height by MAK report in Vincinty of Initial Ground Contact. Data from [2].
ROBUST A/S Glenn A. Jørgensen.

Comparison of Point of Actual Ground Contact with Data Derived from [1].PAGE 33
Fig. 36. Height of terrain by [2], figure 35.
The height of the runway by the MAK report is 258m ([2], page 13, line 1).
Fig. 37. The red curve shows the wing tip height found by [1], figure IV.2.8 page 91.
ROBUST A/S Glenn A. Jørgensen.
Comparison of Point of Actual Ground Contact with Data Derived from [1].PAGE 34
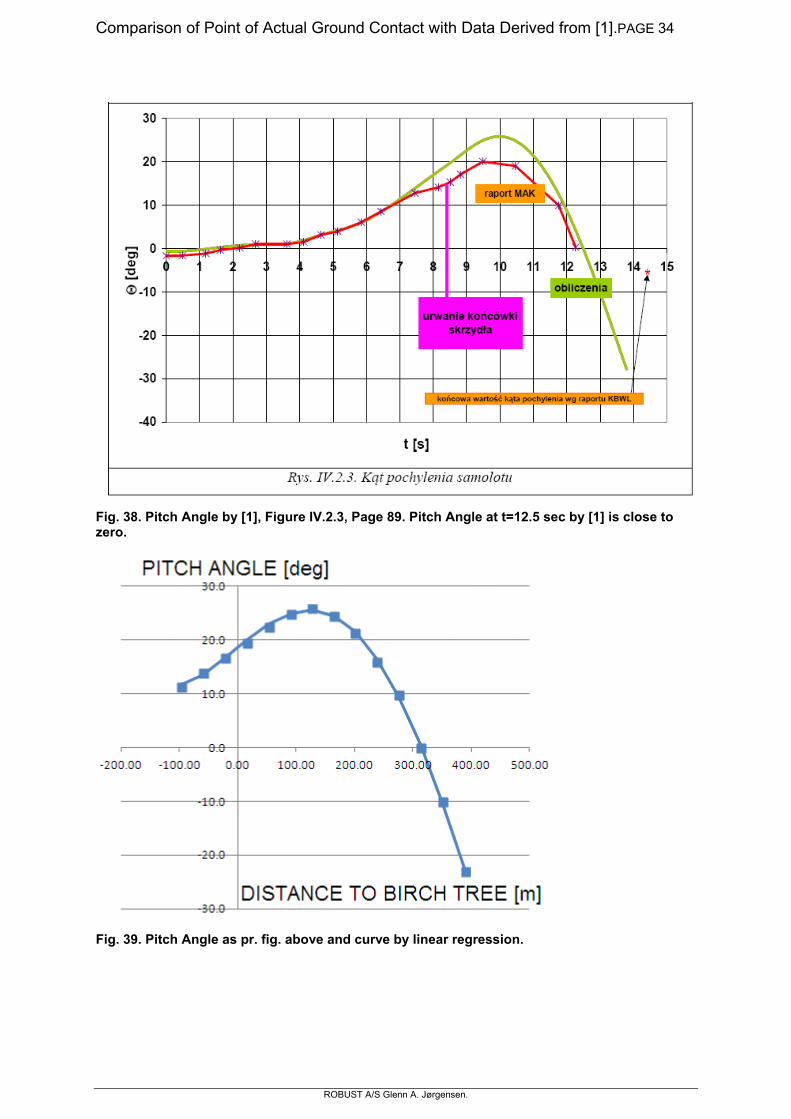
Fig. 38. Pitch Angle by [1], Figure IV.2.3, Page 89. Pitch Angle at t=12.5 sec by [1] is close to zero.
Fig. 39. Pitch Angle as pr. fig. above and curve by linear regression.
ROBUST A/S Glenn A. Jørgensen.
Comparison of Point of Actual Ground Contact with Data Derived from [1].PAGE 35
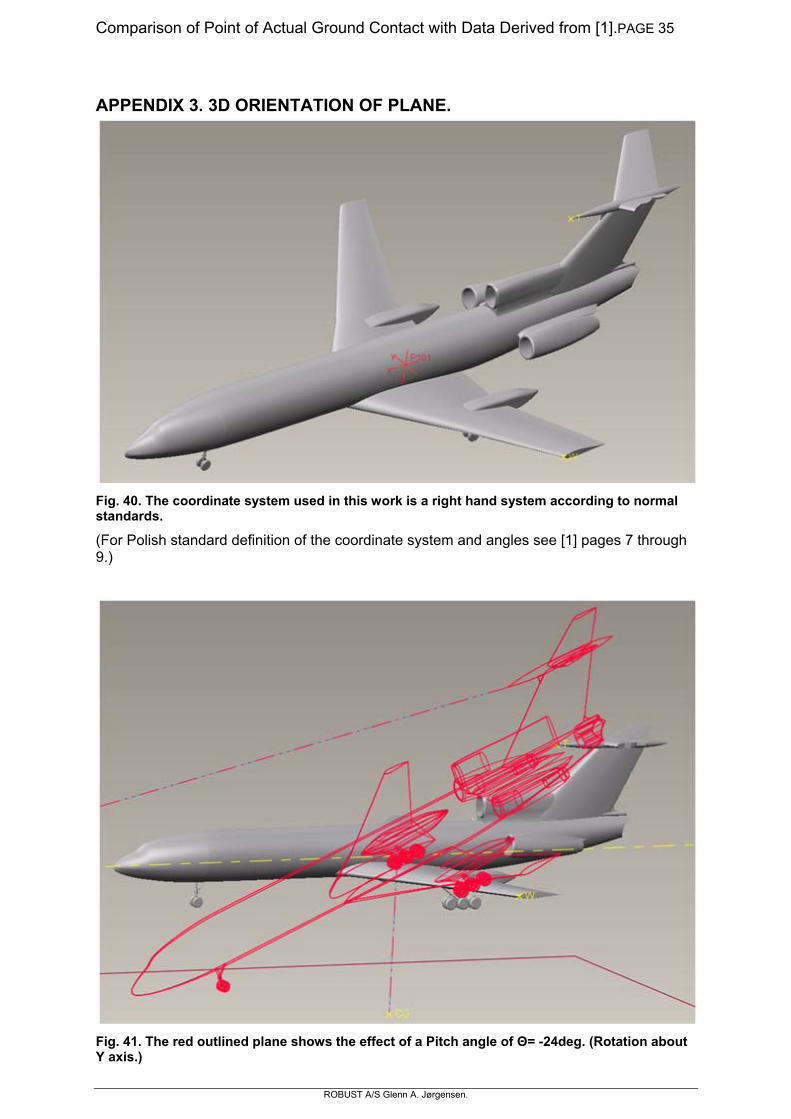
APPENDIX 3. 3D ORIENTATION OF PLANE.
Fig. 40. The coordinate system used in this work is a right hand system according to normal standards.
(For Polish standard definition of the coordinate system and angles see [1] pages 7 through 9.)
Fig. 41. The red outlined plane shows the effect of a Pitch angle of Θ= -24deg. (Rotation about Y axis.)
ROBUST A/S Glenn A. Jørgensen.
Comparison of Point of Actual Ground Contact with Data Derived from [1].PAGE 36
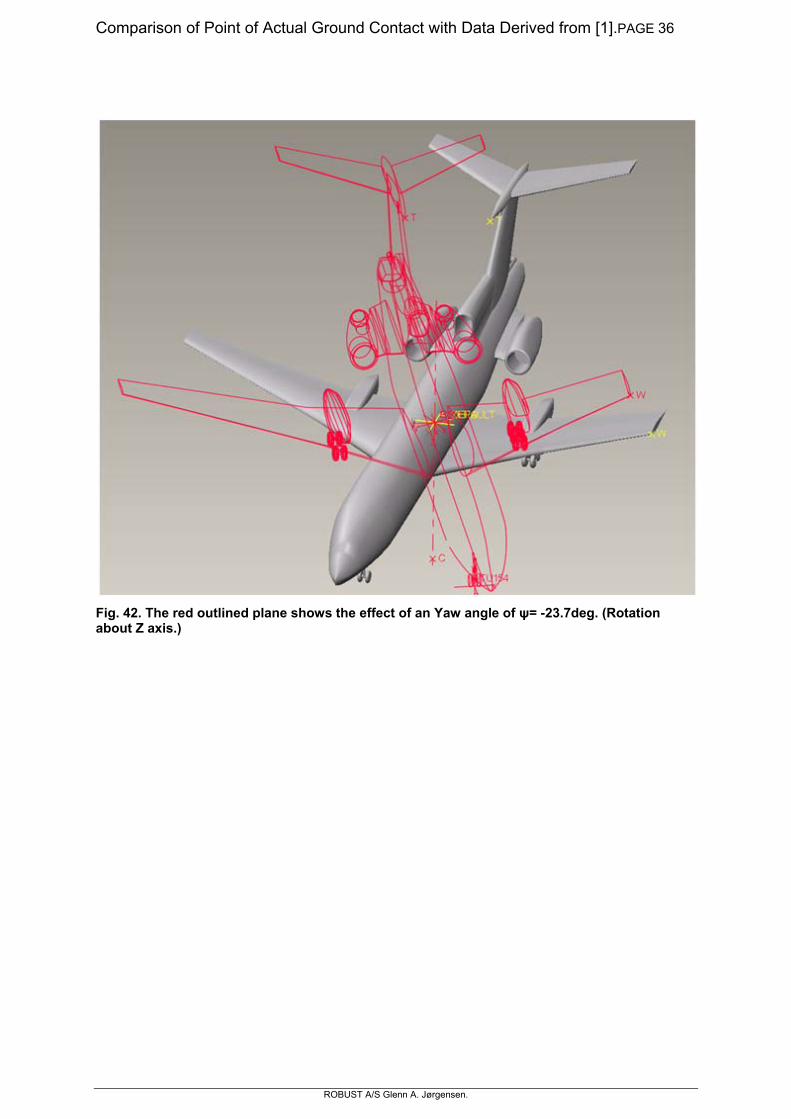
Fig. 42. The red outlined plane shows the effect of an Yaw angle of ψ= -23.7deg. (Rotation about Z axis.)
ROBUST A/S Glenn A. Jørgensen.
Comparison of Point of Actual Ground Contact with Data Derived from [1].PAGE 37
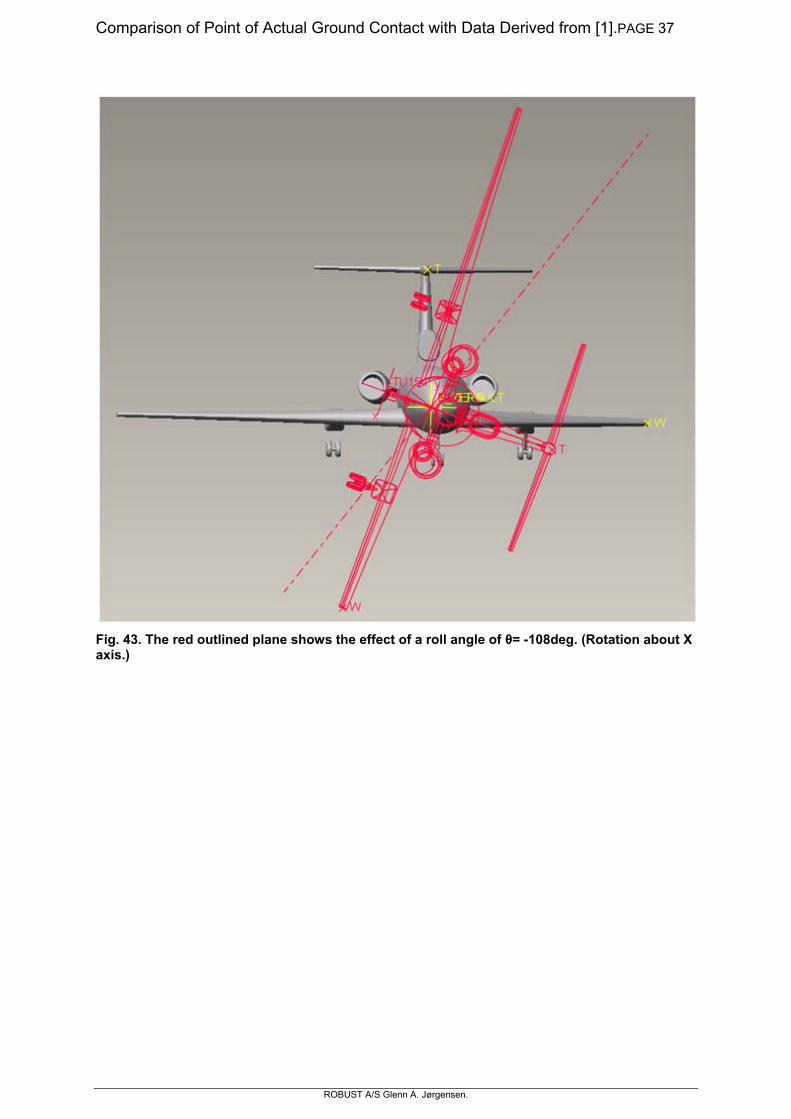
Fig. 43. The red outlined plane shows the effect of a roll angle of θ= -108deg. (Rotation about X axis.)
ROBUST A/S Glenn A. Jørgensen.
Comparison of Point of Actual Ground Contact with Data Derived from [1].PAGE 38
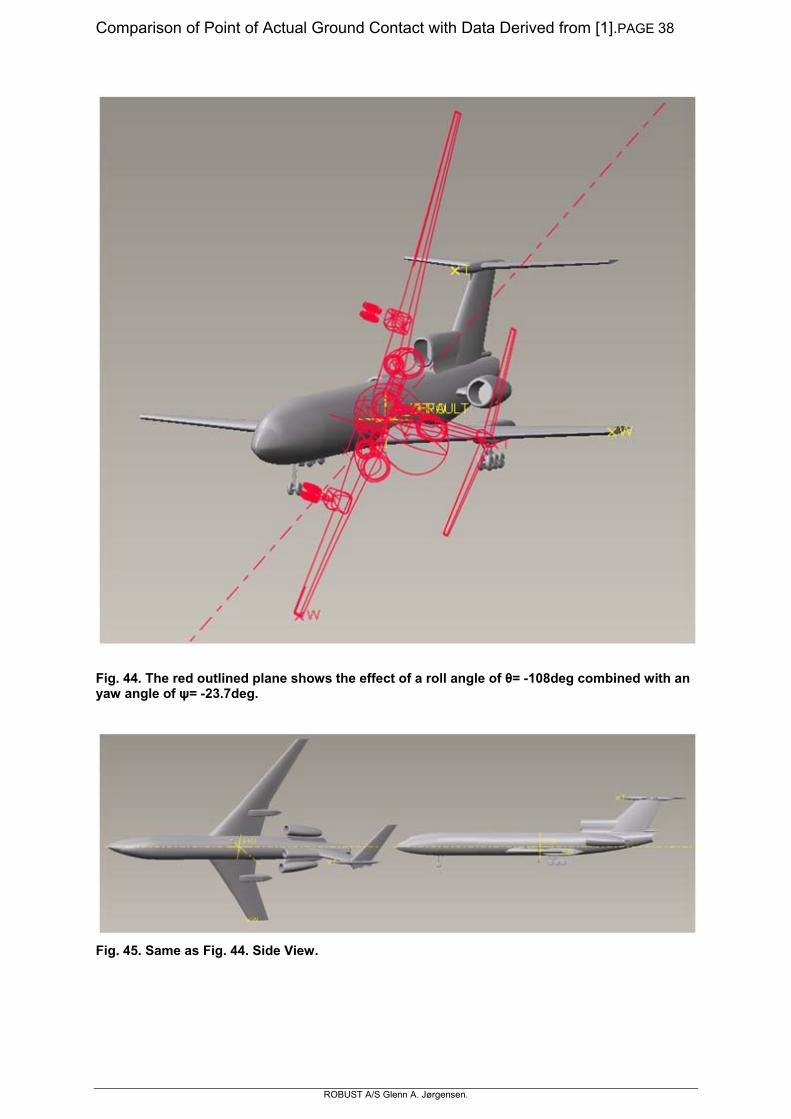
Fig. 44. The red outlined plane shows the effect of a roll angle of θ= -108deg combined with an yaw angle of ψ= -23.7deg.
Fig. 45. Same as Fig. 44. Side View.
ROBUST A/S Glenn A. Jørgensen.

Comparison of Point of Actual Ground Contact with Data Derived from [1].PAGE 39
Fig. 46. Same as Fig. 44. Top View.
ROBUST A/S Glenn A. Jørgensen.

Comparison of Point of Actual Ground Contact with Data Derived from [1].PAGE 40
APPENDIX 4. SENSITIVITY ANALYSIS.
Fig. 47. The values Xwt and Xp are shown as a function of roll angle at the moment of wing ground contact for three different Pitch angles (+5°, 0°, -5°) and a lost wing length of Ltip = 5.54m. Note none combinations of roll angle and pitch angle satisfy the measured values of Xp=8m and Xwt=13.5m. (The yaw angle is ψ=-24°, and has no influence.) In these calculations the position of the COG is set to 34% of MAC. The conclusion is the same as for the position of 24.2% of MAC.
ROBUST A/S Glenn A. Jørgensen.

Comparison of Point of Actual Ground Contact with Data Derived from [1].PAGE 41
ROBUST A/S Glenn A. Jørgensen.
Fig. 48. Data taken from Fig. 18 and Fig. 19.