winning essays - washington local schools
TRANSCRIPT

Linear analysis of melt band formation by simple shear
Marc SpiegelmanLamont-Doherty Earth Observatory of Columbia University, Palisades, New York, 10964, USA([email protected])
[1] Recent experiments by Holtzman et al. [2003] demonstrate that partially molten aggregates of many
mantle materials undergoing simple shear (from �100–500% strain) will spontaneously develop localized
melt-rich bands. These bands develop at small strains but persist at low angles to the plane of shear (�15–
20�) even at large shear strains. The melt-rich bands also appear to form localized weak regions that act as
strain guides for the solid matrix flow. These experiments provide an opportunity to test the equations
governing flow in deformable porous media developed by McKenzie [1984] and others. Here we present
linear analysis of these equations for a solid with a porosity weakening viscosity undergoing simple shear.
This analysis calculates the growth in porosity of a plane wave perturbation that initiates at an angle q0 tothe plane of shear after some amount of finite strain. For a strain of 300%, the maximum growing melt
band initiates at 16.8� (but rotates to �70� in the linear analysis). We also calculate the additional solid
shear induced by the localized weak regions and show that it develops a sense of shear consistent with
observations only for melt bands less that 45�. These two results suggest that only low angle bands are
favored under shear, consistent with the observations. The linear analysis, however, does not allow the
porosity growth and shear to interact which causes the initially low angle bands to be rotated to higher
angles by the background simple shear. To follow the further development of the bands requires solutions
of the full nonlinear equations. Nevertheless, the linear analysis provides useful insights into the
development of the shear bands and suggests that the theory is useful for describing partially molten
systems.
Components: 5195 words, 8 figures.
Keywords: Melt localization; deformable porous media; linear analysis.
Index Terms: 8434 Volcanology: Magma migration; 3210 Mathematical Geophysics: Modeling.
Received 19 December 2002; Revised 6 June 2003; Accepted 11 June 2003; Published 12 September 2003.
Spiegelman, M., Linear analysis of melt band formation by simple shear, Geochem. Geophys. Geosyst., 4(9), 8615,
doi:10.1029/2002GC000499, 2003.
————————————
Theme: The Oman Ophiolite and Mid-Ocean Ridge ProcessesGuest Editors: Peter Kelemen, Chris MacLeod, and Susumu Umino
1. Introduction
[2] Understanding the dynamics and properties of
partially molten regions has been a goal of exper-
imentalists, theorists, and observationalists for
some time now. An outstanding challenge, howev-
er, has been to integrate these different techniques.
Recent experiments on the deformation of partially
molten materials [e.g., Zimmerman et al., 1999;
Renner et al., 2003; Holtzman et al., 2003] provide
G3G3GeochemistryGeophysics
Geosystems
Published by AGU and the Geochemical Society
AN ELECTRONIC JOURNAL OF THE EARTH SCIENCES
GeochemistryGeophysics
Geosystems
Article
Volume 4, Number 9
12 September 2003
8615, doi:10.1029/2002GC000499
ISSN: 1525-2027
Copyright 2003 by the American Geophysical Union 1 of 14

an important opportunity for consolidating exper-
iment and theory because these experiments should
be describable using the prevailing macroscopic
theory for partially molten materials [McKenzie,
1984; Scott and Stevenson, 1984; Fowler, 1985;
Scott and Stevenson, 1986; Scott, 1988; Spiegelman,
1993a, 1993b; Bercovici et al., 2001a; Ricard et al.,
2001; Bercovici et al., 2001b]. Directly testing and
calibrating the theory against physical experiments
should allow us to extrapolate laboratory conditions
to the mantle and help design new and diagnostic
experiments.
[3] Here we are motivated by a set of experi-
ments by Zimmerman et al. [1999] and Holtzman
et al. [2003] that demonstrate that partially mol-
ten aggregates can spontaneously develop local-
ized ‘‘melt-rich bands’’ that form at small strains
and low angles to the plane of shear (�15–20�)and persist at these low angles even in samples
deformed to large strains of 200–500% (Figures 1
and 2). Theory suggests that the intrinsic length
scale in partially molten systems is the compac-
tion length d ¼ffiffiffiffiffiffiffiffiffiffiffiffiffiffiffiffiffiffiffiffiffiffiffiffiffiffiffiffiffiffiffikf zþ 4h=3ð Þ=m
p[e.g., McKenzie,
1984; Spiegelman, 1993a, 1993b] which depends
on the permeability, kf, and the ratio of solid
viscosities (z + 4h/3) and melt viscosity m. Owingto uncertainties in all of these quantities (particu-
larly the permeability), the exact compaction
length of any sample is difficult to determine.
However, by varying the material properties of
both melt and solid phases, the experimenters
varied the relative compaction length of the
sample with respect to the size of the experiment
and suggested that the melt bands form in sys-
tems larger than the compaction length. The
authors state that in all band-forming experi-
ments, there was a distribution of bands with
fewer large bands and more numerous, more
closely spaced smaller bands between them. The
authors measure the distance between the ‘‘largest
melt bands,’’ and while acknowledging that this
is somewhat subjective, argue that there is a
preferred inter-band spacing of approximately
0.15–0.2d.
[4] These melt segregations are suggestive of
those calculated by Stevenson [1989] for a system
undergoing pure shear. To test this idea, we revisit
his calculation for the problem of simple shear and
show that the theory provides useful insights into
the behavior of the experiments.
2. Governing Equations
[5] The analysis follows closely that of Stevenson
[1989] and begins with the equations for conser-
vation of mass and momentum of a two phase
mixture of melt in a deformable matrix with
variable shear viscosity. Neglecting melting, and
assuming the solid and liquid densities (rs, rf) areconstant, these equations can be written dimen-
sionally as
@f@t
þrrrrr � fv½ ¼ 0 ð1Þ
@
@t1 fð Þ þ rrrrr � 1 fð ÞV½ ¼ 0 ð2Þ
f v Vð Þ ¼ kf
mrrrrrP rf g
h ið3Þ
rrrrrP ¼ rrrrr � h rrrrrVð Þ þ rrrrrVð ÞTh i
þrrrrr z 2h3
� �rrrrr � Vþ �rg
ð4Þ
where f is the porosity, v, V are the melt and solid
velocities, kf = k0fn is the permeability, which is
assumed to be a nonlinear increasing function of
porosity. P is the fluid pressure, g is the
acceleration due to gravity, rrrrrV is the velocity
gradient tensor whose i, jth component is @Vi/@xj, zand h are the matrix bulk and shear viscosities
respectively and �r = [rs(1 f) + rf f] is the mean
density of the two-phase mixture. For these
problems we assume that the viscosity is only a
function of porosity and is porosity weakening
[Hirth and Kohlstedt, 1995a, 1995b; Mei et al.,
2002].
[6] If the porosity (and therefore the viscosity)
is constant, however, and melting is neglected,
Spiegelman and McKenzie [1987] and Spiegelman
[1993a] show that these equations reduce to the
problem of solving only for the incompressible
flow of the solid. For the case of a constant
GeochemistryGeophysicsGeosystems G3G3
spiegelman: melt band formation by simple shear 10.1029/2002GC000499
2 of 14
porosity medium undergoing simple shear, the
solid velocity field is
V0 ¼ _gyi ð5Þ
where _g = @U0/@y is the constant shear strain rate.
[7] We now consider the behavior of infinitesimal
perturbations to this basic state in the absence of
gravity (which should have small effects in these
experiments). To develop equations for these per-
turbations, we first rewrite equations (1)–(4) as
@f@t
þ V � rrrrrf ¼ 1 fð ÞC ð6Þ
C ¼ r � kfm
rrrrr � h rrrrrVþrrrrrVT� �
þrrrrr z 2h3
� �C
ð7Þ
0 ¼ rrrrr� rrrrr � h rrrrrVþrrrrrVT� �� �� �
ð8Þ
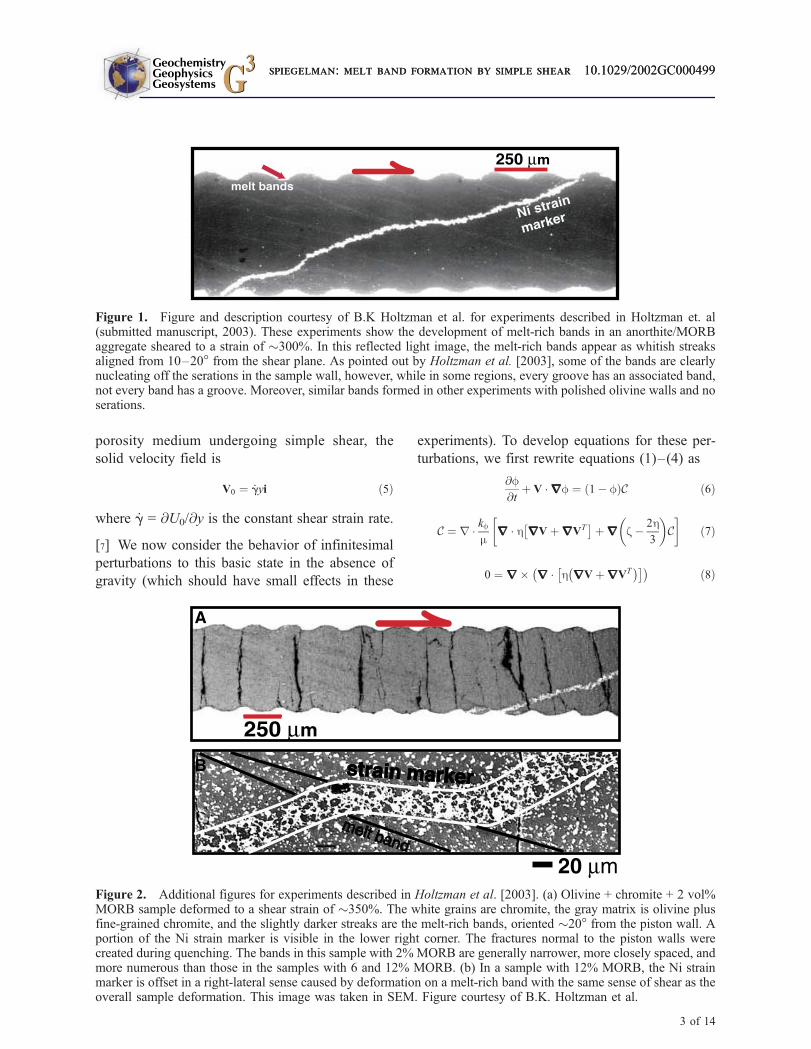
Figure 1. Figure and description courtesy of B.K Holtzman et al. for experiments described in Holtzman et. al(submitted manuscript, 2003). These experiments show the development of melt-rich bands in an anorthite/MORBaggregate sheared to a strain of �300%. In this reflected light image, the melt-rich bands appear as whitish streaksaligned from 10–20� from the shear plane. As pointed out by Holtzman et al. [2003], some of the bands are clearlynucleating off the serations in the sample wall, however, while in some regions, every groove has an associated band,not every band has a groove. Moreover, similar bands formed in other experiments with polished olivine walls and noserations.
Figure 2. Additional figures for experiments described in Holtzman et al. [2003]. (a) Olivine + chromite + 2 vol%MORB sample deformed to a shear strain of �350%. The white grains are chromite, the gray matrix is olivine plusfine-grained chromite, and the slightly darker streaks are the melt-rich bands, oriented �20� from the piston wall. Aportion of the Ni strain marker is visible in the lower right corner. The fractures normal to the piston walls werecreated during quenching. The bands in this sample with 2% MORB are generally narrower, more closely spaced, andmore numerous than those in the samples with 6 and 12% MORB. (b) In a sample with 12% MORB, the Ni strainmarker is offset in a right-lateral sense caused by deformation on a melt-rich band with the same sense of shear as theoverall sample deformation. This image was taken in SEM. Figure courtesy of B.K. Holtzman et al.
GeochemistryGeophysicsGeosystems G3G3
spiegelman: melt band formation by simple shear 10.1029/2002GC000499spiegelman: melt band formation by simple shear 10.1029/2002GC000499
3 of 14

where C = rrrrr�V is the isotropic strain rate or
‘‘compaction rate.’’ Equation (6) is the expansion
of equation (2) and shows that changes in porosity
are caused by advection by the solid flow and
compaction/expansion of the matrix. Equation (7)
combines equations (1)–(4) to show that volume
changes of the matrix result from the divergence of
the melt flux. In the absence of gravity, this flux is
driven solely by pressure gradients caused by
viscous deformation. Finally, equation (8) is the
curl of equation (4) and controls incompressible
flow of the solid. Spiegelman [1993a] presents this
decomposition in more detail.
[8] We now consider the behavior of infinitesimal
perturbations to the constant porosity state by
letting
f ¼ f0 þ ef1
C ¼ 0þ eC1
V ¼ _gyiþ e rrrrr� ys1k þrrrrrU1
� �kf ¼ k0 þ ek1
h ¼ h0 þ eh1
ð9Þ
Here we have decomposed the perturbed solid
velocity V1 = rrrrr � y1sk + rrrrrU1 into its
incompressible and compressible components.
Substituting into equations (6)–(8) and collecting
terms of order e yields, after a bit of algebra, the
equations for the perturbations
@f1
@tþ _gy
@f1
@x¼ 1 f0ð ÞC1 ð10Þ
d2r2C1 þ C1 ¼ 2 _gd2
z0 þ 4h0=3ð Þ@ 2h1@x@y
ð11Þ
r2U1 ¼ C1 ð12Þ
r2 r2ys1
� �¼ _g
h0
@ 2h1@x2
@ 2h1@y2
� �ð13Þ
where d = [k0(z0 + 4h0/3)/m]1/2 is the compaction
length at the reference porosity f0. Equation (10)
states that changes in porosity will be controlled by
advection by the simple shear flow and any com-paction or expansion of the solid. Equations (11)
and (13) state that compaction and the incompres-
sible shear flow are driven by simple shear, _g,interacting with variations in the shear viscosity, h.Equation (12) calculates the compressible velocity
field given the compaction rate and follows directly
from the definitions of C and U.
[9] To close these equations requires a relationship
between the perturbed shear viscosity and the other
first order variables. Here we assume that the shear
viscosity is only a function of porosity h(f) =
h0 f(f) (where f(f0) = 1). Therefore the order eterm of the Taylor expansion of h(f0 + ef1) is h1 =h0af1 where a = df/df(f0). Note that a is negative
for a porosity weakening material.
[10] This derivation is independent of the functional
form of the viscosity h(f). On the basis of a
compilation of published creep experiments, how-
ever, Kelemen et al. [1997] suggested that h(f) =hde
bf where hd is the shear viscosity of melt free
systems (which can be a function of temperature,
pressure and stress). Kelemen et al. [1997] used b =45 although (Holtzman et al., submitted manuscript,
2003) suggest b = 25 based on more recent experi-
ments [Mei et al., 2002]. This functional form gives
a � b which is clearly porosity weakening.
[11] Finally, we nondimensionalize equations
(10)–(13) using the scaling
t ¼ 1
_gt0 x ¼ dx0
C1 ¼ _gC01 ys1;U1
� �¼ _gd2 ys
1;U1
� �0 ð14Þ
Here, time is scaled by the strain rate _g such that
the dimensionless time t0 = _gt is just the total strain.Distance is scaled by the compaction length d.Substituting this scaling and h1 = h0af1 into
equations (10)–(13) and dropping primes yields
@f1
@tþ y
@f1
@x¼ 1 f0ð ÞC1 ð15Þ
r2C1 þ C1 ¼ 2ax@ 2f1
@x@yð16Þ
r2U1 ¼ C1 ð17Þ
r4ys1 ¼ a
@ 2f1
@x2 @ 2f1
@y2
� �ð18Þ
GeochemistryGeophysicsGeosystems G3G3
spiegelman: melt band formation by simple shear 10.1029/2002GC000499
4 of 14

where x = h0/(z0 + 4h0/3) = O(1). Note that in this
scaling the behavior is independent of strain rate
and only depends on a.
3. Solutions-Infinite Domains
[12] For the case of infinite domains, equations
(15)–(18) have analytic solutions that provide
useful insights into the process of melt-band for-
mation. We present two solutions here. The first is
for general perturbations to a constant viscosity
flow which demonstrates that arbitrary perturba-
tions are only sheared by the background flow if
there is no feedback between porosity and viscos-
ity. This solution, however, helps set up the more
general solution for plane wave perturbations in a
porosity weakening flow which can grow unstably
into melt-rich bands.
3.1. Constant Viscosity, Time-DependentSolutions (A = 0)
[13] For constant viscosity, time-dependent flows,
a = 0 which admits solutions C1 = U1 = y1s = 0 for
boundary conditions where these perturbations
vanish as jjxjj ! 1. Under these conditions,
equations (15)–(18) reduce to just a single equa-
tion for porosity
@f1
@tþ y
@f1
@x¼ 0 ð19Þ
Equation (19) can be solved by the method of
characteristics [e.g., Whitham, 1974] to give the
general solution
f1 x; y; tð Þ ¼ f x yt; yð Þ ð20Þ
where f is an arbitrary function that satisfies the
initial condition f1(x0, y0, 0) = f(x0, y0). Equation
(20) is just shear of a function along horizontal
planes. An example that is useful for the next
section is an infinite plane wave with initial wave
vector k0 = kx0i + ky
0j, such that the initial condition
f1(x, 0) = exp(ik0 � x) becomes
f1 x; tð Þ ¼ exp i k0x x ytð Þ þ k0y y �h i
¼ exp ik tð Þ � x½ ð21Þ
where
k tð Þ ¼ k0x iþ k0y k0x t �
j ð22Þ
is a time-dependent wave vector that rotates with
the flow and changes length. For example, a
perturbation oriented like the melt bands has an
initial wave vector with ky0 > kx
0 > 0. In this case, k
initially reduces in length and the wavelength
appears to increase (see Figures 3a and 3b).
3.2. Nonconstant Viscosity Solutions
[14] Given solutions for plane waves with a = 0,
we now seek solutions for the full linearized
equations of the form
f1 ¼ exp ik tð Þ � xþ s tð Þ½ ð23Þ
C1 ¼ C* tð Þexp ik tð Þ � xþ s tð Þ½ ð24Þ
U1 ¼ U* tð Þexp ik tð Þ � xþ s tð Þ½ ð25Þ
ys1 ¼ y* tð Þexp ik tð Þ � xþ s tð Þ½ ð26Þ
where k(t) is given by equation (22) and es(t) is the
amplitude of the porosity plane wave after time t.
[15] Substituting equations (23)–(24) into (15)–
(16) yields a set of equations for the time-depen-
dent amplitudes
ds
dt¼ 2ax 1 f0ð Þ kxky
k2 þ 1ð27Þ
C* tð Þ ¼ 2axkxky
k2 þ 1ð28Þ
U* tð Þ ¼ C* tð Þ=k2 ð29Þ
y� tð Þ ¼ ak2y k2x
k4ð30Þ
where k2(t) = k � k.
[16] Equation (27) can be integrated directly for
s(t)
s tð Þ ¼ 2ax 1 f0ð ÞZ t
0
k0y k0x t �
k0x� �2þ1þ k0y k0x t
�2k0x dt ð31Þ
to yield
s tð Þ ¼ ax 1 f0ð Þln 1þ k2 0ð Þ1þ k2 tð Þ
ð32Þ
GeochemistryGeophysicsGeosystems G3G3
spiegelman: melt band formation by simple shear 10.1029/2002GC000499
5 of 14

Therefore the amplitude of the plane wave at time
t is
A tð Þ ¼ es tð Þ ¼ 1þ k2 0ð Þ1þ k2 tð Þ
ax 1f0ð Þ
ð33Þ
which depends only on a and the wave number at
time t relative to its initial value, not the orientation
of the wave. It is the rotation by simple shear that
drives the change in wave number.
[17] For illustration, Figure 3 shows one solution
of these equations for an initial perturbation that
begins at q = 30� with a wave number k = 4p (and
a = 1). As in the constant viscosity case, these
bands rotate in the shear, however, a porosity
weakening viscosity (a < 0) causes the amplitude
of the perturbation to initially grow. Variable vis-
cosity also causes additional shear along the
porosity bands. The growth of perturbations and
Figure 3. Linearized solution for the evolution of porosity, melt flux and enhanced solid shear for a plane waveperturbation with initial wavenumber k = 4p and initial angle q0 = 30� from the horizontal shear plane. Here theshear viscosity is only mildly porosity weakening (a = 1) to be able to track the perturbations to high strains.Colored fields show porosity. Black arrows show perturbed melt flow vectors, and white arrows show theperturbed solid velocity field. Time t is total strain. Simple shear rotates the initial perturbation while increasing itswavelength (decreasing k) up to q = 90�. Beyond 90� the wavelength decreases. If the viscosity is also porosityweakening, then the initial rotation causes the high porosity regions to have a lower pressure which sucks in meltcausing the melt bands to grow in porosity. Melt is expelled from the bands at angles greater than 90�. Variableshear viscosity also causes additional solid flow parallel to the melt bands. The sense of shear, however, changessign at 45,135,225 and 315�.
GeochemistryGeophysicsGeosystems G3G3
spiegelman: melt band formation by simple shear 10.1029/2002GC000499
6 of 14

the additional shear are decoupled in the linearized
solutions (although probably not in the full solu-
tions) and can be discussed separately.
3.2.1. Growth of Melt Bands
[18] Equation (27) gives the instantaneous growth
rate of a plane wave with wave vector k. For a
porosity-weakening shear viscosity (a < 0), growth
is positive for all wave vectors with kx, ky > 0. If
we write the components of the wave vectors as
kx = k sin q, ky = k cos q where k = jjkjj and q is
the angle that the wave makes with the shear
plane, it is clear that all waves with angles 0 < q <90� increase in amplitude while those with 90 < q< 180� decrease. The maximum instantaneous
growth rate occurs for q = 45� which is the
maximum opening direction in simple shear.
However, because these waves continue to rotate
in time, initially fast growing waves will get
rotated out of their favorable position (and may
eventually reduce in amplitude) after a finite
amount of strain. Thus for large strains, the waves
that demonstrate the largest amount of growth
after a fixed time all initiate at angles smaller than
45�. The initial angle, q0, of the largest growing
wave is apparent in Figure 4 which plots A(t, q0).This angle can be found by noting that in the
limit k � 1, the amplitude is independent of k
and simplifies to
A t; q0ð Þ ! 1
sin2 q0 þ cos q0 t sin q0ð Þ2
" #ax 1f0ð Þ
ð34Þ
which has a maximum at time t for initial angle
qmax tð Þ ¼ 1
2tan1 2
tð35Þ
Figure 4. Plane wave amplitude A(t, q0) (equations (33) and (34)) as a function of time (strain) and initial anglefor a = 1. The colored field shows A(t, q0) for a high frequency plane wave (k(0) = 4p) as in Figure 3. The thickwhite curve shows qmax(t) (equation (35)). The dashed white line is 2qmax. The black contours show the final angleachieved at time t and the black dotted arrow shows the trajectory of the plane wave illustrated in Figure 3 thatstarts at q0 = 30� and ends around qf = 140�. However, the wave that grows the most by t = 3 is the wave thatinitiates around 17� and rotates to about 70�. More strongly porosity weakening systems have more negativevalues of a and grow to larger amplitudes faster. However, changing a only scales the magnitude of this image,not the angular dependence.
GeochemistryGeophysicsGeosystems G3G3
spiegelman: melt band formation by simple shear 10.1029/2002GC000499
7 of 14

This analysis also shows that only initial angles
less than 2qmax grow at all. Initial angles greater
than this eventually decrease in amplitude. For a
total strain of 3, (qmax = 16.8�), waves that initiatearound 17� to the shear plane show the most
growth. (Figures 4 and 5).
[19] Figure 4 is calculated for a single initial wave
number k = 4p. Figure 5, however, shows how
amplitude depends on wave number by plotting the
amplitude at a fixed time (t = 3) as a a function of
initial angle and initial wave number k(0). Again, the
maximum amplitude is attained for waves that start
around 17� for all waves with k(0)^ 2p (i.e., wave-
lengths shorter than a compaction length). Longer
wavelengths growmore slowly, however, there is no
obvious ‘‘fastest’’ growing wave in this analysis.
[20] The physical basis for the growth of porosity
becomes clear when we consider the perturbed
separation flux (v1 V1) = rrrrrP1 where
rrrrrP1 ¼ xrrrrr�rrrrr2ys1k þrrrrrC1 þ axRrf1 ð36Þ
Equation (36) is the perturbed pressure gradient
which is controlled by three terms. The first term
describes pressure gradients induced by incom-
pressible shear (y1s). These gradients are parallel to
the wave fronts, however and do not induce
growth. The second term describes pressure
gradients due to viscous volume changes (C1)which are oriented normal to the wave fronts.
These gradients, however, actually drive fluid out
of the melt bands. It is the final term that controls
the growth of the porosity bands and describes the
pressure gradients induced by shear across viscos-
ity variations. Here
R ¼0 1
1 0
24
35
is the reflection matrix that maps (kx, ky) to (ky, kx)
by reflecting around a plane oriented at 45 degrees.
The final term in equation (36) dominates the
perturbed fluid flow and draws melt into the low-
Figure 5. Final amplitude and angle after a dimensionless time of t = 3 as a function of initial angle and initialwavenumber. The amplitude is given in the colored background; the final angles as numbered solid contours.Maximum growth occurs for all wavenumbers ^2p (wavelengths smaller than the compaction length) that initiate atangles of qmax = 16.8�. There is no largest growing wavenumber in this analysis. The dashed lines shows the contourfor no growth, A(t) = 1.
GeochemistryGeophysicsGeosystems G3G3
spiegelman: melt band formation by simple shear 10.1029/2002GC000499
8 of 14

angle melt bands if the viscosity is porosity
weakening (a < 0). Figure 3 also shows the
instantaneous melt flux vectors v1, aft different
times. Note that when q < 90� the perturbed melt
flux goes into the melt-bands while for q > 90� melt
is expelled.
[21] This solution is similar to that of Stevenson
[1989] for pure shear, however, his solution
purposely neglects advection of the perturbation
by the background solid flow. In the case of
pure shear, this approximation is reasonable,
however, for simple shear, it is the rotation of
weak melt-rich bands that is responsible for their
growth. These linearized solutions rotate signif-
icantly more than the observed melt-rich bands,
however, these solutions still provide some
clue as to the behavior of the fully nonlinear
problem.
3.2.2. Enhanced Matrix Shear
[22] In these linearized solutions, the rotation is
driven by the zeroth order flow field which is not
modified by the growing perturbations. In the
experiments, however, it is clear that once the
melt bands attain a sufficiently large porosity,
they become weak regions that act as strain
guides for matrix shear (that may actually reduce
or stop the rotation). Some of this behavior,
however, is captured in the linearized solutions.
The perturbed stream function y1s, has the same
functional form as the porosity. Therefore, stream-
lines will be coincident with porosity contours
implying solid flow along the bands. In particular,
for a porosity weakening viscosity, the perturbed
solid flow V1 = rrrrr � y1sk produces a right-lateral
shear across the melt bands (as is seen in the
experiments) for melt bands at angles 0 < q < 45�(Figure 3a). For angles between 45 and 135�, thesense of shear is reversed (Figure 3b). Figure 6
summarizes all the possible combinations of melt
and solid flow velocities for perturbations in
different orientations. Only low angle perturbations
at angles less than 45� from the shear plane both
grow and have a sense of shear across them that is
consistent with and enhances the zeroth order
simple shear. This orientation is the one seen in the
experiments.
[23] A more quantitative measure of the shear is the
perturbed vorticity, W1 = rrrrr2y1sk. For simple
shear, the zeroth order vorticity is constant and
negative for right-lateral shear (i.e., W0 = _gk). Itis useful to define the enhanced shear rate as
S tð Þ ¼ W1 � W0
k W0 k¼ a
k2y k2x
�k2
A tð Þ ð37Þ
which is the magnitude of the perturbed vorticity in
the direction of the background vorticity. S(t) is
positive when the perturbed shear is in the same
direction as the applied shear, and negative when
opposed. Figure 7 shows the enhanced shear as a
function of initial angle and time for a more
strongly porosity weakening material with a =
25. The amplitude of the perturbation grows
rapidly in this problem so that it increases by two
orders of magnitude by t = �0.65. Beyond this
time, the assumption of a small perturbation is
probably questionable. Figure 7 shows that only
waves at angles <45� have the correct sense of
shear with a maximum value of S(t) for waves
around �30�. Waves steeper than 45� have a senseof shear opposed to the background. The most
negative shear occurs for waves oriented at �60�with a rate of opposing shear that is �3 times
larger than that for the low angle waves. If the
selection of the preferred angle of the melt-rich
bands depends on shear as well as porosity growth,
it suggests that higher angle perturbations may be
suppressed.
[24] The shear rate can be compared to the growth
rate for the same problem
s tð Þ ¼ dA
dt¼ 2ax 1 f0ð Þ kxky
k2 þ 1A tð Þ ð38Þ
which is approximately the same magnitude as S(t)
(i.e., both are of order aA(t)). Figures 8a and 8b
compares the shear rate to the growth rate where
each is normalized by the largest positive rate at
any given time. The fastest shearing waves occur at
low angles q = 20–30� while the fastest growing
waves occur around 45� (but have negligible
shear). Figure 8c shows the product of the
GeochemistryGeophysicsGeosystems G3G3
spiegelman: melt band formation by simple shear 10.1029/2002GC000499
9 of 14

Figure 6. Summary cartoon showing qualitative behavior of the linearized solutions for perturbations in fourdifferent orientations with a porosity weakening viscosity (a < 0). (a) 0 < q < 45�. Low angle perturbations grow inporosity and develop a right-lateral sense of solid shear across them. (b) 45 < q < 90� Higher angle perturbations stillgrow, but the sense of solid shear is reversed. (c) 90 < q < 135� Perturbations at angles greater than 90� close up (andhere have a reversed sense of shear). (d) these perturbations will enhance shear but continue to close. Only low-angleperturbations (configuration Figure 5a) both grow and enhance the solid shear.
GeochemistryGeophysicsGeosystems G3G3
spiegelman: melt band formation by simple shear 10.1029/2002GC000499
10 of 14

normalized shear and growth rates for positive
values and again, suggests that only a relatively
narrow band of angles (here �20–30�) have both
significant growth and enhanced shear.
4. Discussion
[25] The results of this linear analysis are encour-
aging and suggest that the theory of flow in
deformable porous media should be applicable
for explaining and quantifying the laboratory
experiments. Nevertheless, there are several impor-
tant differences between the linearized solutions
and the experiments that require further work to
explain (although the results of the linear analysis
suggest some reasonable solutions).
[26] First, the linearized solutions do not dem-
onstrate a preferred wavelength as is claimed to
be seen in the experiments ‘‘for the largest melt
bands.’’ In the linear analysis, all perturbations
with wavelengths shorter than about 0.5 com-
paction lengths grow at the same rate. This
result is the same as Stevenson [1989] and
may simply arise from the lack of any surface
energy terms in the governing equations. At the
scale of these experiments (and certainly near
the grain scale), surface energy terms should
become important and will act as nonlinear
diffusive terms that redistribute melt from high
porosity regions to low porosity regions [e.g.,
see Riley and Kohlstedt, 1991]. Such a process
would reduce the growth of very short wave-
length perturbations and give rise to a preferred
length scale. Further work to model experimental
charges should probably include surface energy
effects.
[27] For strongly porosity weakening systems,
significant growth in amplitude can occur at
strains less than 1. This is consistent with some
of the lower porosity experiments (f0 = 0.02)
which show that the bands are observable at
strains as low as 1.1 (although more melt rich
systems don’t develop bands until strains of �2
which might imply that there is some porosity
Figure 7. Rate of shear for strongly porosity weakening material a = 25 as a function of time and initial angle(colored field). Black contours show the final angle achieved by a given q0 at any time t. Positive regions for qf < 45�have shear in the same sense as the overall simple shear. Negative regions for qf > 45� have the opposing sense ofshear. The white dashed contour shows qf = 45� where S(t) = 0.
GeochemistryGeophysicsGeosystems G3G3
spiegelman: melt band formation by simple shear 10.1029/2002GC000499
11 of 14

Figure 8. Comparison of normalized shear rate (a) to normalized growth rate (b) for a = 25. The maximum rate ofshear occurs for low angle waves at �20–30�, while the maximum growth rate occurs for waves around 45�. If bothshear and growth are important for selecting the preferred angle, this analysis suggests that only low angleperturbations have a favorable sense of shear and growth rate. (c) The product of the normalized shear and growthrates (Figures 8a and 8b) just for positive values which gives an indication of the angles over which shear and growthreinforce each other.
GeochemistryGeophysicsGeosystems G3G3
spiegelman: melt band formation by simple shear 10.1029/2002GC000499
12 of 14

dependence in a). The most noticable difference
between theory and experiment, however, is that
the experimentally produced melt-rich bands
remain at low angles to the shear plane (�20�)even after very large amounts of simple shear.
In the linearized solutions, the largest growing
perturbations begin at low angles but eventually
rotate to about 60–80� after about a strain of 3
(Figure 4).
[28] Nevertheless, there are several features miss-
ing from this analysis that might explain this
discrepancy. First, these linearized solutions are
for infinite domains whereas the experiments are
tightly confined by upper and lower boundaries
that are impermeable to both solid and melt flow.
Such boundaries should introduce another length
scale into the problem as well as impose impor-
tant constraints on the growth of shear bands.
Figures 6–8 suggest that only low-angle melt
bands will be favorable for both growth and
enhanced right-lateral shear along the melt
bands. While higher angle melt bands can still
grow, their sense of shear is reversed and would
develop significant discrepancies in solid and
melt flow at the boundaries and might be sup-
pressed. Future numerical analysis will investigate
the possible role of the impermeable boundary
conditions.
[29] Finally, the linearized solutions (by definition)
do not allow any feedback between the perturbed
solid flow field and the melt bands. The growth of
porosity is driven completely by the rotations
induced by the zeroth order simple shear. In the
full nonlinear problem, however, once the bands
become sufficiently weak, they become strain
guides which redirect the solid flow along the
bands rather than through them. This should also
reduce the amount of rotation that the bands
experience. To find a full solution that couples
both shear and porosity growth through decom-
paction, requires numerical schemes that can accu-
rately solve for both solid and fluid flow in a
variable viscosity medium with strongly localized
viscosity variations. This in turn requires a variable
viscosity, solid flow solver with accurate pressures
to calculate the feedback between fluid flow and
viscosity variations. Such schemes are likely to be
numerically challenging to develop. However, the
Figure 8. (continued)
GeochemistryGeophysicsGeosystems G3G3
spiegelman: melt band formation by simple shear 10.1029/2002GC000499
13 of 14

existence of well characterized physical experi-
ments should make the development and validation
of such codes easier.
Acknowledgments
[30] This work was supported by NSF grant OCE-0207851 to
Spiegelman. Many thanks to B. Holtzmann and D. Kohlstedt
who provided early preprints of their experimental work as
well as insightful discussions and reviews. Thanks also to
D. Stevenson and an anonymous reviewer for additional
helpful reviews. This is LDEO contribution 6490.
References
Bercovici, D., Y. Ricard, and G. Schubert, A two-phase model
for compaction and damage: 1. General theory, J. Geophys.
Res., 106, 8887–8906, 2001a.
Bercovici, D., Y. Ricard, and G. Schubert, A two-phase model
for compaction and damage: 3. Applications to shear locali-
zation and plate boundary formation, J. Geophys. Res., 106,
8925–8939, 2001b.
Fowler, A. C., A mathematical model of magma transport in
the asthenosphere, Geophys. Astrophys. Fluid Dyn., 33, 63–
96, 1985.
Hirth, G., and D. L. Kohlstedt, Experimental constraints on the
dynamics of the partially molten upper mantle: Deformation
in the diffusion creep regime, J. Geophys. Res., 100, 1981–
2002, 1995a.
Hirth, G., and D. L. Kohlstedt, Experimental constraints on the
dynamics of the partially molten upper mantle: 2. Deforma-
tion in the dislocation creep regime, J. Geophys. Res., 100,
15,441–15,052, 1995b.
Holtzman, B. K., N. J. Groebner, M. E. Zimmerman, S. B.
Ginsberg, and D. L. Kohlstedt, Stress-driven melt segrega-
tion in partially molten rocks, Geochem. Geophys. Geosyst.,
4(5), 8607, doi:10.1029/2001GC000258, 2003.
Kelemen, P. B., G. Hirth, N. Shimizu, M. Spiegelman, and
H. J. B. Dick, A review of melt migration processes in the
adiabatically upwelling mantle beneath oceanic spreading
ridges, Philos. Trans. R. Soc. London Ser. A, 355, 283–
318, 1997.
McKenzie, D., The generation and compaction of partially
molten rock, J. Petrol., 25, 713–765, 1984.
Mei, S.,W.Bai, T.Hiraga, andD.Kohlstedt, Influence ofmelt on
the creep behavior of olivine-basalt aggregates under hydrous
conditions, Earth Planet. Sci. Lett., 201, 491–507, 2002.
Renner, J., K. Visckupic, G. Hirth, and B. Evans, Melt extrac-
tion from partially molten peridotites, Geochem. Geophys.
Geosyst., 4(5), 8606, doi:10.1029/2002GC000369, 2003.
Ricard, Y., D. Bercovici, and G. Schubert, A two-phase model
for compaction and damage: 2. Applications to compaction,
deformation, and the role of interfacial surface tension,
J. Geophys. Res., 106, 8907–8924, 2001.
Riley, G. N., and D. L. Kohlstedt, Kinetics of melt migration in
upper mantle-type rocks, Earth Planet. Sci. Lett., 105, 500–
521, 1991.
Scott, D. R., The competition between percolation and circula-
tion in a deformable porous medium, J. Geophys. Res., 93,
6451–6462, 1988.
Scott, D. R., and D. Stevenson, Magma solitons, Geophys.
Res. Lett., 11, 1161–1164, 1984.
Scott, D. R., and D. Stevenson, Magma ascent by porous flow,
J. Geophys. Res., 91, 9283–9296, 1986.
Spiegelman, M., Flow in deformable porous media: Part 1.
Simple analysis, J. Fluid Mech., 247, 17–38, 1993a.
Spiegelman, M., Flow in deformable porous media: Part 2.
Numerical analysis—The relationship between shock waves
and solitary waves, J. Fluid Mech., 247, 39–63, 1993b.
Spiegelman, M., and D. McKenzie, Simple 2-D models for
melt extraction at mid-ocean ridges and island arcs, Earth
Planet. Sci. Lett., 83, 137–152, 1987.
Stevenson, D. J., Spontaneous small-scale melt segregation in
partial melts undergoing deformation, Geophys. Res. Lett.,
16, 1067–1070, 1989.
Whitham, G., Linear and nonlinear waves, John Wiley, New
York, 1974.
Zimmerman, M. E., S. Q. Zhang, D. L. Kohlstedt, and
S. Karato, Melt distribution in mantle rocks deformed in
shear, Geophys. Res. Lett., 26, 1505–1508, 1999.
GeochemistryGeophysicsGeosystems G3G3
spiegelman: melt band formation by simple shear 10.1029/2002GC000499
14 of 14