winning profit in the age of continuous innovation - ispe · winning profit in the age of...
TRANSCRIPT
Winning Profit in the Age of Continuous InnovationThe BusIness CAse for AdvAnCIng ProduCT QuAlITy
ChAPTer 2 I n A s er I es
2
executive overview
The top strategic objective identified by Manufacturing companies is to produce products that are consistently of high quality. And for good reason – high quality is the best predictor of sustained corporate health. Companies that produce consistently high quality products enjoy
•Top Market share•stronger Customer loyalty•Wider Profit Margins•More efficient strategic Asset utilization•lower Brand risk exposure.
The competitive separation of companies that achieve high product quality from those that don’t is the effectiveness of the three factors that determine success
• People• Process• enabling Technology.
This eBook chapter explores the differences that separate the leaders from the laggards in the latter two success factors. We assume our entire set of companies have talented individuals working with the goal of advancing product quality. We detail the Camstar Model for Advancing Product Quality, which includes a closed-loop quality process and the enabling technology to support it. We then provide a business case framework for comparing companies that have adopted the model with companies that have not. We then provide a comprehensive set of actual business cases taken from companies that have invested in this model.
The evidence is clear - companies that align their talent with a closed-loop quality process and an enterprise-technology built to support it are able to bring innovative products to market faster and at consistently higher quality than their competitors.

3
Chapter 1 review: Closed-loop Quality execution defined
In Chapter 1 of this series, we described the market conditions that were accelerating innovation while increasing pressure on operational efficiency – all bearing down on the organization’s ability to produce high quality end product in a predictable and stable manner.
Closed-loop quality execution requires the alignment of people, processes, and enabling technology. In Chapter 1, we defined the requirements of enabling technology that brings together historic quality silos of logistics (erP), product design (PlM), supply chain (sCM), and customer experience (CrM) into an end-to-end approach to advancing product quality.
In Chapter 2 of our eBook series, we introduce Camstar’s model for Advancing Product Quality, based on the Closed-loop Quality process, and examine the impact the model has had on real companies that have adopted it.
value Chain
Innov
ation
lifec
ycle
PortfolioManagement
Innovation Management
new Product development
sourcing /supply Chain
sales &Marketing
ProductionPlanning
deliverylogistics
After salesservice
Manufacturing & Quality operations
Product fieldPerformance
sales/Marketing/Planninglogistical Information flow
erP
sourcingsupplier Information flow
sCM
r&d/engineeringProduct Information flow
PlM
distribution and field usefield Information flow
CrM
Camstar defined an approach, “Closed-loop Quality execution,” that accelerates product innovation while rapidly optimizing quality. The process is characterized by these key capabilities:
1. Predictive Warnings and notification2. Intelligent root-Cause Analysis3. risk-Based Management4. early Concurrent Process & Product development5. Proactive Action enforcement6. Automated effectivity Assurance7. global visibility & Coordination

4
What is Product Quality?
first, let us define product quality from an innovation perspective and an operational perspective. There are many quality models that may be used - but for our analysis, we are using the garvin1 product quality model, which defines the following critical dimensions of product quality that may be used for strategic analysis:
1. features2. Aesthetics3. Performance4. reliability5. durability6. serviceability7. Perceived Quality
Innovation excellence refers to a company’s ability to continually introduce new products to the market that function in a new way, or packaged for a new purpose. If we look at the list of quality attributes, “features” and “aesthetics” are most strongly aligned with “innovation”.
The other five elements primarily impact the design, manufacturing, and field use of the product. While the quality of the innovation drives initial demand, the quality of operations sustains demand and drives customer loyalty. It is operational excellence that creates brand equity and continued “perceived quality” from one product lifecycle to the next.
so how can we create a model that associates product quality with the profitability of innovation?
1 garvin, david .A., “Competing on the eight dimensions of Quality”, harvard Business review, november-december 1987

5
The strategic nature of Product Quality – driving Market leadership
Product Quality drives both innovation excellence and operational excellence. Metrics associated with Innovation excellence generally drive the top line, while metrics associated with operational excellence drive the bottom line. success along both dimensions are required to profit from innovation. Advancing Product Quality means simultaneous superior execution along both dimensions.
A company built to Advance Product Quality will excel in Innovation excellence and operational excellence, and will lead the competition in market share and profitability – and will ultimately have a higher valuation in the market.
That’s why leaders identify Product Quality as most strategic to the success of their organizations.
*source – AMr for laggards/leaders framework
*source – IdC Product lifecycle survey 2008• revenue growth
• new Product Introductions
• return on r&d
• Profitability
• Market share
• P/e
leaders
laggards
Manufacturing respondent’s ranking of Company’s goal
What is the most important to the success of your company? {n=76}
ProductQuality
Most Important least Important
Customerservice
Product Time to Market
ControllingCosts
strong distribution Channels
6050403020100
InnovATIon exCellenCe
oPerATIonAl exCellenCe
• operating Margin
• Time to Profitability
• Cycle Time
• Perfect order
• Total supply Chain Costs
• Cost of Quality

6
What’s the Bottom line? hypothesizing the Business Model
While we intuitively understand the strategic nature of product quality, let’s investigate the evidence that product quality indeed impacts the performance metrics of the business. stating the business case as a set of hypotheses, we can summarize our study as follows.
hypothesis 1. Increasing innovation, in the absence of a closed-loop quality process, has a negative impact on product quality.
hypothesis 2. Product quality problems increase brand risk to the company.
hypothesis 3. Product quality problems erode profit.
hypothesis 4. Product quality problems slow business growth.
In our study, we analyze a sample of 10 companies that have not invested in a closed-loop quality approach. our sample is taken from the life sciences industry, where product quality problems and new product approvals are publically reported by regulation. sources of data include fdA databases on adverse events, recalls, and new product approvals, as well as hoover’s financial data for the 10 companies in our study. The companies are taken from a variety of manufacturing segments, including cardiovascular, orthopedics, and diagnostic imaging. In our study, we use the following metrics to represent the variables in our hypotheses: level of Innovation: number of new products introduced into the market per year
Product Quality: number of product quality issues (complaints, returns, recalls) per year
Brand risk: Market Capitalization as reflected in P/e ratio
Profit: operating Profit Margin %
growth: % revenue growth
7
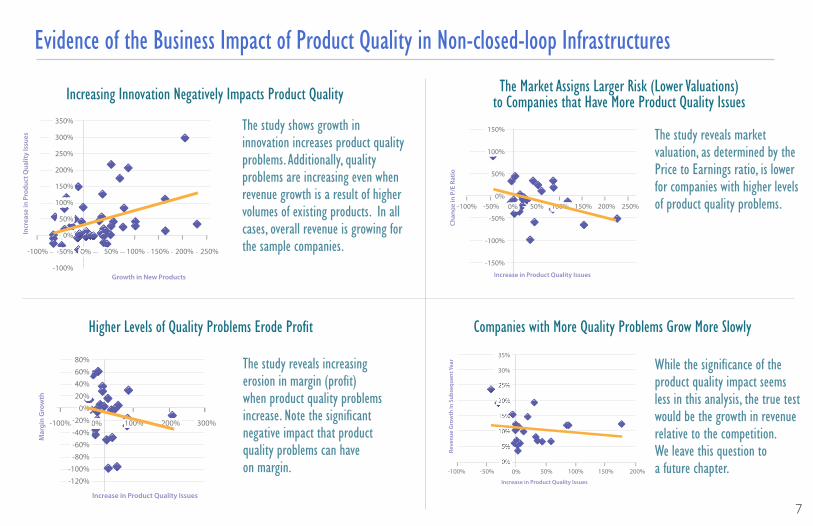
evidence of the Business Impact of Product Quality in non-closed-loop Infrastructures
The study shows growth in innovation increases product quality problems. Additionally, quality problems are increasing even when revenue growth is a result of higher volumes of existing products. In all cases, overall revenue is growing for the sample companies.
The study reveals market valuation, as determined by the Price to earnings ratio, is lower for companies with higher levels of product quality problems.
While the significance of the product quality impact seems less in this analysis, the true test would be the growth in revenue relative to the competition. We leave this question to a future chapter.
The study reveals increasing erosion in margin (profit) when product quality problems increase. note the significant negative impact that product quality problems can have on margin.
Product Quality Problems - Impact on Margin
Increase in Product Quality Issues
Mar
gin
Gro
wth
-100% 300%100% 200%0%-100% 300%100% 200%0%
80%60%40%20%
0%-20%-40%-60%-80%
-100%-120%
80%60%40%20%
0%-20%-40%-60%-80%
-100%-120%
Product Quality - Impact on Market Valuation (Risk)
Increase in Product Quality Issues
Chan
ge in
P/E
Rat
io
150%
100%
50%
0%
-50%
-100%
-150%
150%
100%
50%
0%
-50%
-100%
-150%
-100% 100% 200% 250%150%50%0%-100% 100% 200% 250%150%50%-50%-50% 0%
Product Quality Problems - Impact on Revenue Growth
Increase in Product Quality Issues
Reve
nue
Gro
wth
in S
ubse
quen
t Yea
r
35%
30%
25%
20%
10%
5%
0%
35%
30%
25%
20%
10%
5%
0%-100% 100% 200% 250%150%50%0%-100% 100% 200%150%50%-50%-50% 0%
Innovation Level vs. Product Quality Issues
Growth in New Products
Incr
ease
in P
rodu
ct Q
ualit
y Is
sues
350%
300%
250%
200%
150%
100%
50%
0%
-50%
-100%
350%
300%
250%
200%
150%
100%
50%
0%
-50%
-100%
-100% 100% 200% 250%150%50%0%-100% 100% 200% 250%150%50%0%
Increasing Innovation negatively Impacts Product Quality The Market Assigns larger risk (lower valuations) to Companies that have More Product Quality Issues
Companies with More Quality Problems grow More slowlyhigher levels of Quality Problems erode Profit

The study below shows the dramatic effect of combining good quality process with proper enabling technology.*
A 2009 Axendia study of QMs in life sciences shows the limited impact of traditional systems that focus on managing regulation rather than advancing product quality.
of those using traditional systems...
67% experienced increased or no change in CAPAs
93% reported recurrence of quality issues after a CAPA was closed
6%
3%14%
76%
greater than 50%
never recurs(% of people reporting)
recurs(% of people reporting)
21% to 50% of the time
0 to 20% of the time
Why Current Quality systems Aren’t Improving Quality
note on the previous page that in almost every case, product quality problems are increasing. When products and processes are complex or high volume, rigorous quality processes are simply not good enough when executed in manual, paper-based environments, or in siloed system infrastructures that reinforce disconnects across the product quality lifecycle and the value chain.
*source: london school of economics–McKinsey survey and analysis of top 100 companies in france, germany, uK and us
+8%
0 +2%
+20%75th percentile
and above
level of enabling Technology
% shown are productivity gains
“IT enabled Transformation”
rigor of Process
75th percentileand above
25th percentileand below
25th percentileand below
8

9
how Product Quality is Advanced – Introducing Camstar’s APQ Model
The Camstar Advancing Product Quality (APQ) Model provides a framework for unifying collaborative design, planning, supply, manufacturing and customer experience through an enterprise closed-loop quality process that accelerates continuous improvement and continuous innovation.
4. use• Track field quality issues to improve product performance and understand containment requirements
• understand service data that suggest quality problems and improvement opportunities
• gain “field Performance” traceability to track quality issues back to root causes and related products
1. desIgn• leverage past and current performance data to design for quality to avoid repeat design mistakes
• Analyze data from engineering runs to improve design
• Align product design with process to design for manufacturability and service
2. PlAn• develop process plan concurrently with product design to optimize manufacturing ramp-up
• leverage past and current process capability plus capacity performance to optimize manufacturing and supply processes
• seamless engineering change process to speed implementation and reduce errors
3. MAnufACTure• Control Man, Machine, Method, Material, Measure at each step of the manufacturing process to enforce the design
• Audit the process and collect quality characteristic data to analyze the As-Manufactured record for improvement opportunities• gain global visibility into manufacturing and quality events to uncover trends and relationships driving nonconformances
• systematically alert operations to trends that lead to nonconformances
• Monitorperformanceinrealtimeacrosstheproductqualitylifecycleforearlywarnings •Useadvancedanalysisofpastperformancetooptimizeproduct •Understandglobalimplicationsandrelationshipoflocalevents design,processesdesignandmanufacturingcontrols
leArn
• Implementaglobalprocessforcorrectiveandpreventiveactionsthatincludesrelationshipsamonglocalandglobalevents •Eliminaterootcauseofqualityissuesbydrivingcorrectiveand• gain immediate access to contextual data to uncover true root causes of failures
IMProve
preventive action plans to product and process design changes

10
The Impact of Adopting the APQ Model
In the second step of our study for this Chapter, we analyze companies that have adopted the APQ model and implemented a closed-loop quality approach throughout their product lifecycles. Across our sample of nine companies (again in life sciences due to access to public data) we see obvious improvements in product quality: By the end of two years after deployment of a closed-loop infrastructure, we see an average of over 50% reduction in product quality issues. The product quality issues included in the study are complaints, recalls (weighted for impact), and other reported adverse events.
T-3 T-2 T-1 T T+1 T+2
Years - “T” is Time of Deployment
Aver
age C
hang
e in N
umbe
r of P
rodu
ct Qu
ality
Issu
es
Reduced Quality Issues by More than Half by Year Two – on Average
100%
80%
60%
40%
20%
0%
-20%
-40%
-60%
The impact to product quality is clear. We could deduce that this improved product quality positively impacts business performance metrics. But instead of applying statistical evidence, we devote the remainder of this eBook Chapter to companies across multiple industries to show first-hand the impact of Advancing Product Quality on their businesses.

The Business Case is Proven across Industries
Innov
ation
exce
llenc
e
Product Quality
• Increases market share - Accelerate new Product Introduction - expansion of Product Portfolio - More rapid entry into new markets
• drives customer loyalty - Improve Product Quality and reliability - Increase Perfect order - Build Brand equity - decrease Complaints
• Widens profit margins - Increase yields - decrease labor Cost - decrease scrap/rework - shorter Cycle Times - reduce Cost of Quality (good and bad)
• Improves strategic Asset utilization - Increase Capacity of existing Assets - decrease Inventory (enable lean) - Improve roA and Inventory Turns
• reduces brand risk exposure - reduce Quality Issues in the field - reduce risk and scope of recalls - ensure regulatory and standards Compliance
opera
tiona
l exc
ellen
ce
11
Manufacturers committed to Advancing Product Quality get their products to market faster, at higher quality and lower cost than their competitors.
leading manufacturing companies are in various stages of Advancing Product Quality - even those in early stages of closed-loop quality adoption are realizing significant gains. The transformation that companies have experienced when they adopted an infrastructure that aligns enabling technology with people and process is revealed through the remainder of this chapter.

12
Adding a drug component to the Class III medical device magnified oversight into this company’s lot history record (lhr), and exploded the number of entries to a stunning 26,000. The paper lhr prevented the company from growing to meet demand, and threatened its ability to maintain quality and compliance.
35% more Throughput, 80% fewer nCrs, while reducing lot sizesThe self-auditing elhr streamlines data collection, enforces operator processes and procedures, and prevents data entry errors. operators focus on production and quality rather than paperwork. first pass yields are up, manufacturing is more flexible, and review time is nearly eliminated.
Prevent Issues to Increase outputBusIness CAse: MedICAl devICes
“A paper lhr owns you. With elhr, we own the information and results.”
ProgrAM MAnAger,
gloBAl MedICAl devICe MAnufACTurer
StartsTo FGIPlan
4000
3000
2000
1000
0 11-20
11-15
11-10
11-5
10-31
Curr
ent
Mon
th P
rodu
ctio
n
Day
PN CS493
13
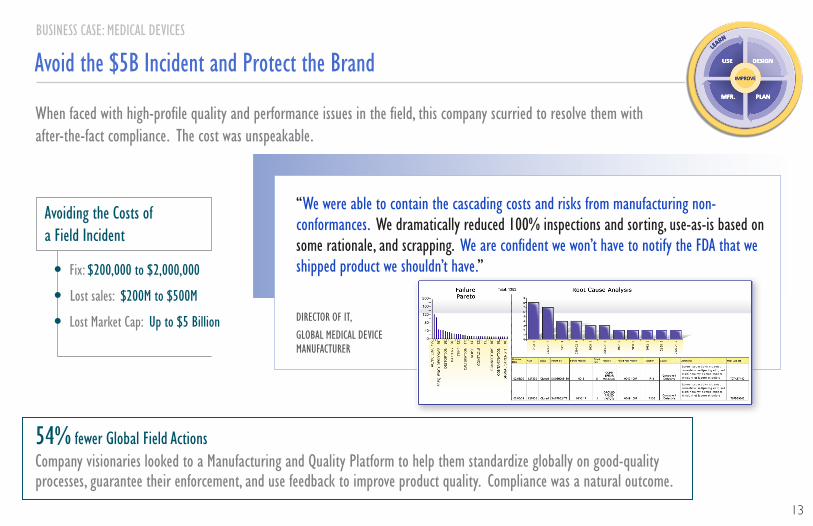
When faced with high-profile quality and performance issues in the field, this company scurried to resolve them with after-the-fact compliance. The cost was unspeakable.
54% fewer global field ActionsCompany visionaries looked to a Manufacturing and Quality Platform to help them standardize globally on good-quality processes, guarantee their enforcement, and use feedback to improve product quality. Compliance was a natural outcome.
Avoid the $5B Incident and Protect the BrandBusIness CAse: MedICAl devICes
“We were able to contain the cascading costs and risks from manufacturing non-conformances. We dramatically reduced 100% inspections and sorting, use-as-is based on some rationale, and scrapping. We are confident we won’t have to notify the fdA that we shipped product we shouldn’t have.”
dIreCTor of IT,
gloBAl MedICAl devICe MAnufACTurer
Avoiding the Costs of a field Incident
• fix: $200,000 to $2,000,000
• lost sales: $200M to $500M
• lost Market Cap: up to $5 Billion

The goal was to streamline and eliminate non-productive activities. Paperwork and manual processes inhibited quality improvements and growth, and latent visibility of quality data resulted excessive rework and long dhr review times.
eliminated: 6000 hours per year in paperwork and virtually all operator errorsWith electronic enforcement of processes and demand flow Technology, plus instant visibility of production and quality information, the company drastically reduced overhead associated with compliance while it improved quality and customer service.
“The Platform supports the plant’s lean demand flow Technology, reduces the cost of compliance, and provides manufacturing with the real-time control and quality information needed to improve yields and ramp up volume more quickly.”
dIreCTor of MAnufACTurIng, lArge MedICAl devICe MAnufACTurer
14
lean QualityBusIness CAse: MedICAl devICes
Paper Wk1 Wk2 Wk3 Wk4
6%
5%
4%
3%
2%
1%
0%
operator defects on dhr
electronic Platform deployed

15
“low Cost Per Watt” is the solar industry mantra. But r&d and Product engineering can’t design in the dark. Without access to searchable, actual results to analyze, improvements to technologies are nearly impossible. And the reality check: Is manufacturing ready to implement and enforce new process to keep variability at a minimum?
Increased solar Cell efficiency by 38% and reduced Cost Per Watt by 22%This growing solar manufacturer uses instant feedback of prototype and production results to optimize process and technology improvements. With automatic transition from r&d to production plus enforced processes, variability is low, and manufacturing delivers on time, first time.
fully Illuminated designBusIness CAse: solAr
CorrelATe PrIor ProCesses And MATerIAls WITh ACTuAl resulTs To QuICKly deTerMIne rooT CAuse
• substrate from vendor A lot 3984
• resist Process rev 2C
• Tool last Maintained 8 days Ago
“I can’t imagine working in a plant without this Platform. ours standardizes process design, and gives us immediate feedback of process results.”
dIreCTor of r&d And ProduCT engIneerIng, groWIng solAr MAnufACTurer
48
46.5
45
43.5
42
40.5
39
37.5
36
Cap Etch Monitor
08/09
08/10
08/11
08/12
08/12
08/13
08/14
08/16
08/17
08/18
08/20
08/21
08/22
08/23
08/24
08/25
% R
eflec
tan
ce

Increasing demand for customized mobile phones left this global manufacturer struggling to effectively implement frequent design and feature changes, maintain top quality, and comply with rigorous traceability requirements. Potential growth and revenue was obstructed by rigid, obsolete technology.
25% Increase in shipments and fewer returnsenabled by an enterprise Platform, errors and quality problems are prevented by controlled production workflows and specifications. Complete traceability of every phone is instantly accessible, and the number of returns has decreased dramatically.
“We have achieved dramatic year-on-year unit sales growth which resulted in market share gain – this is supported by the Platform.”
vICe PresIdenT of PlAnnIng And logIsTICs ConTrol, gloBAl MoBIle Phone MAnufACTurer
16
Customized high outputBusIness CAse: eleCTronICs
2009
2007
2006
Plus… another plant coming online this year!
relIABIlITy for MIssIon-CrITICAl,suPer hIgh-voluMe oPerATIons
• 83,000 serialized units / day
• 9,000 operators
• 100 production lines
• 24x7 on 10-hour shifts
Prod
uCTIo
n ouTPuT

17
good news: This global company has electronic storage media for everyone from businesses to consumers. result: Production volumes increased dramatically over widely dispersed global plants that struggled with local, legacy manufacturing systems. how could best practices be standardized if communication was so difficult?
Technology enables Best Practices, decreases deployment Costs 30-50% per sitefive sites throughout Asia standardized on a single Mes. They use established knowledge and a common manufacturing model that is easily transferred to each site. gone is the need for specialists in obscure technologies, in return for easy sharing of best practices among sister plants.
The right enabling Technology for growthBusIness CAse: eleCTronICs
“We can now more easily expand and grow each plant, and apply consistent global performance analysis because data and definitions are constant. And IT has lower costs of system ownership.”
CIo And vP of ProCess exCellenCe, gloBAl eleCTronIC sTorAge MAnufACTurer
Site 1 Site 2 Site 3 Site 4 Site 5
$IT Costs Decrease as Production Scales
Deployment Cost

A new global virus, and scientists in this company would have a new idea for a biological reagent that could be used to develop the vaccine. But it took nine months to move the idea to production, and either the need would diminish or the competition would step in. It was a frustrating loss of opportunity and revenue.
reduced nPI time from 9 months to 9 daysIt would not have been possible without a Platform that offers standardized, visible and reusable processes – plus instant feedback on process results. The incredibly short nPI time means many more opportunities for new business.
“We could take advantage of a contagious new thinking – discipline and standardization. Ideas that the r&d scientists thought were impossible are now possible.”
ChIef ArChITeCT, lArge BIoTeChnology CoMPAny
“here’s the standard process we can use to make this new reagent.”
18
racing the virusBusIness CAse: BIoTeChnology

Customer service goals mandated improved efficiencies, higher yields and more throughput. But with paperwork errors, lack of quality data to help solve problems, and WIP piling up - top quality, on time, every time appeared elusive.
higher margins a result of: Increased yields 90M Tonnes a year and reduced recurring costs $7.2M a yearelectronically enforced processes and data collection eliminated errors and provided instant quality feedback for fast correction. Accurate WIP feeds scheduling systems to optimize use of equipment and increase throughput.
“Because we produce a variety of products with different specifications, we needed to automatically track them through the various processes to ensure they meet our quality standards. now we do this seamlessly, with real-time visibility. We improved our manufacturing yields, and streamlined operations to create new efficiencies.”
dIreCTor of oPerATIons,gloBAl MeTAls MAnufACTurer
19
More Margins for MetalsBusIness CAse: MeTAls
ConClusIon
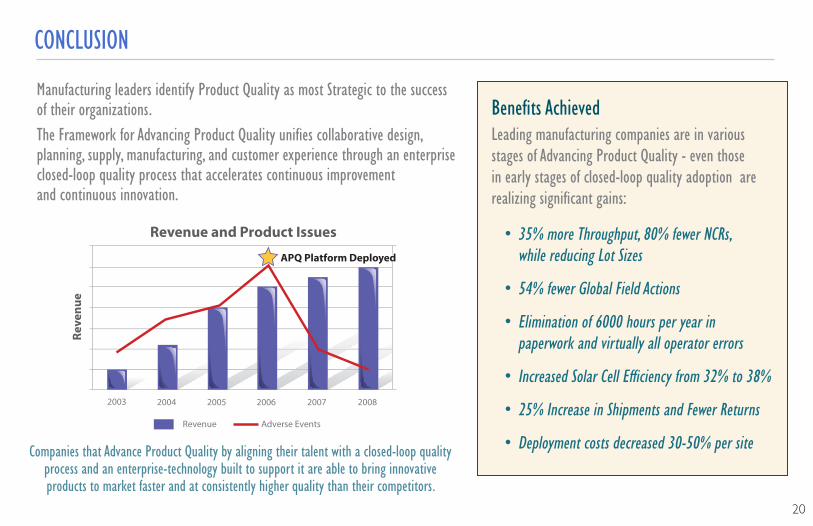
Manufacturing leaders identify Product Quality as most strategic to the success of their organizations. The framework for Advancing Product Quality unifies collaborative design, planning, supply, manufacturing, and customer experience through an enterprise closed-loop quality process that accelerates continuous improvement and continuous innovation.
Companies that Advance Product Quality by aligning their talent with a closed-loop quality process and an enterprise-technology built to support it are able to bring innovative products to market faster and at consistently higher quality than their competitors.
2003 2004 2005 2006 2007 2008
Revenue
Reve
nue
Revenue and Product Issues
Adverse Events
APQ Platform DeployedAPQ Platform Deployed
Benefits Achievedleading manufacturing companies are in various stages of Advancing Product Quality - even those in early stages of closed-loop quality adoption are realizing significant gains:
• 35% more Throughput, 80% fewer nCrs, while reducing lot sizes
• 54% fewer global field Actions
• elimination of 6000 hours per year in paperwork and virtually all operator errors
• Increased solar Cell efficiency from 32% to 38%
• 25% Increase in shipments and fewer returns
• deployment costs decreased 30-50% per site
20