wipo economics & statistics series october 2012 · 1 the authors ... researchers must be able...
TRANSCRIPT

Working Paper No. 5Getting patents and economic data to speak to each other: An “algorithmic links with probabilities” approach for joint analyses of patenting and economic activity
2012WIPO Economics & Statistics Series October
Travis J. LybbertNikolas J. Zolas

Getting Patents & Economic Data to Speak to Each Other: An ‘Algorithmic Links with Probabilities’ Approach for Joint Analyses of Patenting & Economic Activity
Travis J. Lybbert, Department Agricultural & Resource Economics, University of California, Davis
Nikolas J. Zolas, Center for Economic Studies,
United States Census Bureau
October 20121
Abstract International technological diffusion is a key determinant of cross-country differences in economic performance. While patents can be a useful proxy for innovation and technological change and diffusion, fully exploiting patent data for such economic analyses requires patents to be tied to measures of economic activity. In this paper, we describe and explore a new algorithmic approach to constructing concordances between the International Patent Classification (IPC) system that organizes patents by technical features and industry classification systems that organize economic data, such as the Standard International Trade Classification (SITC), the International Standard Industrial Classification (ISIC) and the Harmonized System (HS). This ‘Algorithmic Links with Probabilities’ (ALP) approach incorporates text analysis software and keyword extraction programs and applies them to a comprehensive patent dataset. We compare the results of several ALP concordances to existing technology concordances. Based on these comparisons, we select a preferred ALP approach and discuss advantages of this approach relative to conventional approaches. We conclude with a discussion on some of the possible applications of the concordance and provide a sample analysis that uses our preferred ALP concordance to analyze international patent flows based on trade patterns. NOTE: The ALP concordances described in this paper can be downloaded from the WIPO website at http://www.wipo.int/econ_stat/en/economics/publications.html
1 The authors would like to thank Prantik Bhattarchayya for superb research assistance. We are grateful for the assistance and guidance provided by researchers and programmers at the World Intellectual Property Organization (WIPO), including Carsten Fink, Hao Zhou, Christophe Mazenc, Sacha Wunsch-Vincent, and others. We thank seminar participants at WIPO and Morrison Foerster. We also acknowledge the financial support the project has received from the National Science Foundation. All opinions and views expressed are those of the authors and do not represent those of the NSF.

Lybbert and Zolas October 2012
1. Introduction International technological diffusion is an important driver of technological change which is a key determinant of cross-country differences in income and economic growth (Romer 1990; Aghion and Howitt 1992; Grossman and Helpman 1991; Keller 2004). International trade and foreign direct investment are often considered to be key catalysts of technology transfer (Coe and Helpman 1995; Eaton and Kortum 2002; Branstetter et al. 2006; Archaya and Keller 2009), but directly studying this process is often hampered by the fact that measuring transferred technology empirically is challenging. Thus far, data and statistics on patents have served as one of the more useful proxies for measuring technological change (Griliches 1990; Basberg 1987) and diffusion (Jaffe et al. 1993). However, in order to fully exploit patent data in economic analyses, researchers must be able to link patents to economic activity at a level of disaggregation that allows for different technological, industrial and spatial patterns. Such a detailed link between technological and economic activity would further improve our assessment of policies that aim to promote innovation, as well as assess the relationship between technological change and economic development. Patent statistics have frequently been used as both technological and economic indicators due to the widespread availability of patent data and the assumption that patents reflect direct inventive activity and innovation. In his survey reviewing the different ways patents are used as technology indicators, Basberg (1987) describes how patents have been incorporated in innovation models to measure technology diffusion and to evaluate the output of research activity. In a similar survey, Griliches (1990) documents the numerous instances patents have been used as economic indicators and finds that patents have held diverse roles from serving as proxy for R&D output to predicting stock-market activity and total factor productivity. Within this literature, however, the validity of patents as technological or economic indicators remains somewhat of an open question. Important concerns include the commercial use and value of patents, heterogeneity across countries and industries in patent institutions, legislation and enforcement, and pronounced changes over time in patenting and patent institutions. We believe that more disaggregate analyses of patent statistics – particularly when matched with equally disaggregate economic data – will help to address these concerns and enable new empirical research related to patents. In general, there are three levels at which patents can be linked to economic activity. At the coarsest macro-level, aggregate patent data taken from a specific country in a specific year can be associated with aggregate economic data, respectively. Linking patent and economic data at this aggregate level is based simply on the country-year unit of analysis and has enabled research on questions such as measuring the rate of innovation (Porter and Stern 2000), a country’s innovative capacity (Furman et al. 2002) and the effects of patent harmonization (McCalman 2001). Analyses of foreign patent flows and economic activity (Eaton and Kortum 1996; Xu and Chiang 2005; Falvey and Foster 2006; Harhoff et al. 2007) is similarly based on an aggregate association of patents to economic data through a shared space-time unit of analysis.
2.
Lybbert and Zolas October 2012
At the finest level, patents and economic activity can be linked at the firm-level. While this micro-linkage between patent and economic data enables rigorous and insightful research on patenting as part of firm-level strategies (Brouwer and Kleinknecht 1999; Austin 1993) constructing and maintaining such a firm-level database requires substantial effort, is only feasible for a fraction of the firms represented in patent databases, and may miss broader considerations regarding relevant products, competitors and industrial dynamics. Although progress will continue to be made on this frontier, these limitations constrain our ability to link patents to economic activity at the firm-level in emerging economies where firm-level data is relatively sparse. Between these macro- and micro-level linkages is a meso- or industry-level linkage that associates patents and economic data based on the domain of goods and services they represent. At this level, patents on biomedical and semiconductor inventions, for example, are linked to industry or product classes that use biomedical and semiconductor inventions, respectively. We argue that a robust industry-level linkage – perhaps in conjunction with macro- and micro-level analyses – will enable researchers to better analyze the relationship between patenting and economic activity over time, across space and technology classes. Most industry-level linkages are based on concordances. For example, the Yale Technology Concordance (YTC) (Kortum and Putnam 1997) links the International Patenting Classification code (IPC) to the Canadian Standardized Industrial Classification system. Thus, with the YTC a researcher can link patent data organized by IPC, country and year to the value of production organized by Canada SIC, country and year. Unfortunately, conventional concordance approaches like the YTC suffer from a host of flaws that limit their usefulness in empirical research. After describing these limitations, we propose new methods for constructing concordances and, thereby, industry-level linkages between patent and economic data. These methods use text analysis, data mining and probabilistic matching to build these links in ways that can be applied broadly or narrowly across time and space, can be easily updated, and can create direct linkages between patent data and a variety of industry and trade classification schemes in a way that that does not require layers of concordances. We refer to the general approach we develop in this paper as an Algorithmic Links with Probabilities (ALP) approach to constructing concordances. We propose and test two different versions of this approach. First, a data mining approach (ALP-DM) identifies patents that contain manually-assigned keywords where each word pertains to a specific industry. The patents are aggregated and reveal frequency matches between the keywords and IPC subclasses. This frequency then provides the basis for weighting each of the matches. Second, a keyword extraction and probabilistic matching approach (ALP-PM) extracts keywords from the patents themselves and then matches these keywords probabilistically to industry or trade classifications. By implementing these two approaches using the full PATSTAT database provided by the European Patent Office (EPO), we generate probability distributions of the technologies used within each industry and, conversely, distributions of the industries using certain types of technology. Since these distributions create linkages in both directions – from patents to economic data and vice versa – researchers can use these direct concordances for industry-level analyses of the relationships between patents and an array of economic activity organized by different classification schemes such as SITC, NACE, ISIC and HS. Given that these methods require minimal manual or subjective intervention, the concordances they generate are easy to update and refine.
3.

Lybbert and Zolas October 2012
After providing a brief background of related patent concordance research, we discuss the prevailing IPC concordances in some detail and describe a fundamental limitation of these conventional concordances when applied to economic data. We then describe our ALP approaches to constructing more useful concordances and generate IPC concordances for both trade (SITC) and industry (ISIC) classification schemes. To test our approach, we use our ALP-DM and ALP-PM approaches to generate concordances that can be directly compared with two prevailing concordances, including the YTC. Before concluding, we demonstrate the use of ALP concordances with a specific analysis that compares patent and trade flows. 2. Background Patents are a potentially powerful data source for technology and innovation analyses because the patents themselves contain a wealth of information, including the names of the inventee, date, prior art, technologies used, as well as a full description of the embedded technology with numerous figures and references. Recently, there has been a large push initiated by the private sector to develop novel ways of analyzing, organizing and making this patent information accessible to firms interested in exploiting or diversifying their patent portfolios and formulating R&D strategies (Moehrle et al. 2010). This form of patent analysis – called “patinformatics” – aims to reveal relationships between individual patents and broader technological fields in order to inform commercial, legal and policy decisions and includes grouping similar concepts and technologies, creating patent landscape maps, tracking the evolution of these maps over time, and analyzing and interpreting citation networks. These approaches typically use the latest developments in text analysis and text clustering software, and then use the findings from these programs to create different visualization and mapping schemes. The methods we develop are conceptually similar to these tools and could ultimately provide a valuable economic layer to patent landscapes, networks and other patinformatic analyses. The ALP concordances we construct are designed to enable more rigorous econometric analysis at the industry-level. By doing this, we continue to build on other efforts to link patent and economic data through technology-industry associations. While these industry-level linkages are facilitated by the fact that the IPC and economic classification systems share a detailed hierarchical structure, they are complicated by the fact that these classification systems are motivated by different objectives. Whereas economic classification systems are intended to disaggregate goods and services into meaningful and related sub-groups, the IPC system is intended to facilitate the patent examination process by enabling patent examiners to precisely identify the novel technical features of the disclosed invention and to define the prior art against which they can assess novelty. Since goods or services in very different economic classifications can use the same technical feature (e.g., an electronic motion control device may be used in washing machines and satellites), this difference in intended usage implies that linking patents to economic data through a concordance of their respective classification systems is never straightforward. Whereas one could manually construct a one-to-one concordance between two industrial classification schemes that share the same unit of analysis (i.e., industry), constructing a concordance between the IPC and an economic classification at any useful level of resolution is effectively a many-to-many mapping that may not be amenable to a manual approach.
4.

Lybbert and Zolas October 2012
The first attempt to link patent data with industry data was conducted by Schmookler in 1966 (Comanor and Scherer 1969) who assigned “industries-of-use” to patents organized by the US patent class (USPC). The classification scheme used in this concordance assigned patent classes to industries where at least 2/3 of patents in that class were used for that particular industry. A later concordance developed by a branch of the US Patent and Trademark Office (USPTO) used a similar methodology and assigned equal weighting to patent classes which related to multiple industries. The first comprehensive concordance, the YTC, emerged in the early 1990s (Evenson and Putnam 1994; Kortum and Putnam 1997). The YTC was constructed by leveraging a useful feature of the roughly 250,000 patents issued in Canada between 1978 and 1993. For each of these patents, the Canadian Patent office examiners were required to assign a technology field from the IPC system (standard practice worldwide) and to indicate the Industry of Manufacture (IOM) and Sector of Use (SOU) of the invention according to the Canadian Standard Industrial Classification (1980 cSIC-E Version). The patents examined in this window implicitly concord IPC to cSIC since examiners were assigning patents to both systems concurrently. The YTC tabulated these assignments to make this an explicit IPC-cSIC concordance. Because it is based on assignments made by patent examiners – presumably, experts in the field – the YTC benefits from hundreds of thousands of hours of expertise and consideration. Furthermore, this structure implies that the YTC comprehensively covers all technologies and industries included in the 250,000 patents that were cross-classified. An additional benefit is that the YTC uses probabilistic rather than subjective weights, which allows for the same technical feature to be used in multiple sectors. On the other hand, the YTC suffers from several serious limitations. First, it is only possible to directly link to one classification system, the cSIC, which is not commonly used in industry-level studies. Bridging to any other economic classification system introduces noise and can hopelessly atrophy the resulting composite concordance (as discussed below). Second, it is frozen in time and space, as it were, because it will always be based on Canadian patents examined between 1978 and 1993. This introduces potential technological, temporal and spatial biases (Schmoch et al. 2003). 3. The IPC & Prevailing IPC-Industry Concordances In this section, we describe in more detail the structure of the prevailing concordances that attempt to link the IPC to industry classification systems. First, we describe briefly the structure of the IPC system and contrast it with existing economic classification systems. We then differentiate between the prevailing concordances that build on the YTC and those that chart a different path entirely and discuss them in reverse order. The IPC was established in 1971 by the Strasbourg Agreement to provide a harmonized, language independent, hierarchical system for classifying technology embedded in patents and utility models2. Given its role in defining the scope of prior art considered in patent examination, the IPC is a central feature to the global network of national patent systems. The current version of the IPC divides technology into eight sections, which are further divided into a total of nearly 70,000 “subgroups”. To illustrate the structure of the IPC, consider the example of IPC “subgroup” B64C 11/18, which covers “Aerodynamic features of propellers used in aircraft.”
2 For a complete guide to the IPC, including useful training resources, see http://www.wipo.int/export/sites/www/classifications/ipc/en/guide/guide_ipc_2009.pdf To explore the IPC interactively with complete notes see http://www.wipo.int/ipcpub
5.

Lybbert and Zolas October 2012
This group number is composed of section B (“Performing operations; Transporting”), class B64 (“Aircraft; Aviation; Cosmonoautics”), subclass B64C (“Aeroplanes; Helicopters”), main group B64C 11/00 (“Propellers”), and subgroup B64C 11/18. We construct our concordance at the four-digit subclass level (e.g., B64C, A21B, etc.), of which a total of 639 exist (in the most recent version). In terms of how the IPC is used in practice, patent examiners around the world classify the inventions claimed by the patents they examine. Where multiple inventive features are evident in an invention, examiners often cross-list the patent in multiple IPCs.3 With this brief description of the IPC in mind, consider the structure of existing IPC-industry concordances. Two of these concordances, the “DG Concordance” (Schmoch et al. 2003) and the MERIT Concordance (Verspagen et al. 1994), chart a different path than the YTC. Both of these concordances attempt to match IPC subclasses to ISIC industry classifications using the official descriptions of these respective categories. In order to do this manually, both efforts are based on one-to-one matches, which is only feasible at a relatively coarse resolution. Specifically, the DG concordance assigns 625 IPC subclasses to one of 44 different manufacturing sectors, of which one or more ISICs are associated. The MERIT Concordance matches IPC subclasses to 22 industrial classes based on a mix of two- and three-digit ISIC codes. Both approaches are notable for their attempt to manually and directly (i.e., one-to-one) translate the IPC to the ISIC industry classification system. While the mapping to the ISIC that emerges from these efforts is undeniably coarse, it can nevertheless enable some useful empirical and policy analysis. For more rigorous analysis, higher resolution economic data can be particularly useful – but leveraging these higher resolution data requires a higher resolution concordance. To construct a higher resolution concordance, researchers have had little choice but to trod the YTC path and rely on the same narrow base of Canadian patents. Two other prevailing concordances take this approach and seek to build on the YTC. Specifically, the OECD Concordance (Johnson 2002) and PATDAT Concordance used by Silverman4 simply layer an additional concordance to translate the IPC to more commonly used industry classification systems such as ISIC (used in OECD) and the US Standard Industrial Classification (SIC) (used in PATDAT). This conventional composite concordance approach introduces additional complications, such as causing the strength of the technology-industry linkage to atrophy. To illustrate this problem, Table 1 takes a random IPC subclass, B64D “Aircraft; Aviation; Cosmonautics Equipment for Fitting In or To Aircraft”, and shows what happens during the layering process. Whereas the initial concordance is sensible, the composite concordance has clearly atrophied – even when the additional concordance layer (cSIC-ISIC in this case) is itself quite robust. Obviously, the severity of this problem intensifies with additional concordance layers.
3 In some jurisdictions, examiners must designate a primary IPC and list the remaining IPCs as secondary. The PATSTAT database compiles patent data from many jurisdictions, only some of which follow this convention, so a primary IPC designation is not always available when multiple IPCs are listed on a patent 4See http://www.rotman.utoronto.ca/~silverman/ipcsic/documentation_ipc-sic_concordance.htm for documentation and procedure
6.

Lybbert and Zolas October 2012
In summary, any effort to analyze the relationship between patents and economic activity at the industry-level faces a serious concordance dilemma. While there is rich, high resolution data for both patents and economic activity, and these data would seem to enable a host of insightful empirical analyses, jointly harnessing the high resolution on both sides requires a robust, accurate and high resolution concordance. Manual, one-to-one concordances are too crude for many research questions, but up-to-date more sophisticated concordances have little choice but to build on a relatively narrow set of Canadian patents that are effectively frozen in time, space and technology. Furthermore, since very few (if any) datasets are described with the cSIC classification system, additional concordance layers are required to construct more broadly useful concordances from this narrow patent base, which quickly atrophies the integrity of the concordance. 4. Guiding Principles and Methodology To escape the dilemma described in the previous section, an ideal concordance would replicate the human process of reviewing each patent and assigning industry codes based on the information contained within the patent, while also including a much broader set of patents from around the world, allowing for direct translation into multiple economic classification schemes, and facilitating updates to reflect technological and classification system changes. In this section, we formalize a set of guiding principles based on this ideal and then describe the methods we develop to approximate an ideal concordance according to these principles. Three principles have guided our effort to approximate an ideal concordance to link patents to economic activity:
1. Use the descriptive content of individual patents as the basis for the concordance. Since technical features classified in the IPC can pertain to several different classes of economic activity, it is important to consider each patent individually. An ideal concordance would be based on an effective evaluation of the content of each patent, including how and where the underlying invention may be used. The patent applicant is best suited to assess the potential uses of the invention and, in most jurisdictions, has an incentive to discuss this industrial usefulness in the application.
2. Eliminate the need for concordance layering by constructing direct concordances. To avoid the composite concordance problem, we aim to devise methods that can be directly applied to the most common economic classification schemes, including SITC (Rev. 2 and 3), ISIC (Rev. 2, 3, 3.1 and 4), NAICS, HS and SIC. As new versions of these concordances or the IPC are released, new direct concordances are preferable to indirect ones that update the older to the newer version via a concordance.
3. Automate the construction process as much as possible. Technology changes rapidly, and the concordance should reflect these changes. A proper concordance will therefore need continuous updating to reflect new technologies as they emerge. Automating the process implies that it should:
a. Involve minimal manual work in order to rapidly process millions of patents at a time. The process should not require, for example, manually sifting through patents or classification schemes.
b. Be relatively easy to implement and flexible enough to capture changing technologies and industries. Through the process, generating a new version of the concordance should be relatively cheap and easy to do. The process should also be flexible enough to allow for adjustments in the technological focus or years considered to tailor the concordance as needed.
7.

Lybbert and Zolas October 2012
c. Rely more on objective algorithms than subjective judgments. This helps to reduce the manual workload of constructing the concordance, but can also provides a critical objective basis on which to construct the weights in a many-to-many concordance.
The ALP methodology we describe below is guided by these principles and leverages recent advances in computing power and search techniques. Programs that perform tasks such as keyword extraction and text mining allow for specific bits of information to be extracted from individual patents, making it possible to approximate a manual assignment of industry classifications. As with any algorithmic search technique, our methods cannot perfectly replicate careful manual inspection and assignment, but because they can sift through millions of patents they may be able to converge on accurate implied linkages. Because our ALP approach statistically relies on the “Law of Large Numbers,” we expect the resulting concordances to improve as the number of patents processed increases. Patents are a natural candidate for mining and clustering techniques because of their wealth of information. We use the PATSTAT database available from the European Patent Office (EPO) as the source of these patent data. The PATSTAT database contains patent data for 86 countries since 1990 and contains details for more than 100 million patent applications, some of which relate to the same invention in different jurisdictions. Included in this database are almost 20 million unique patent abstracts and titles. In contrast, there is no comparable information-rich source of qualitative data on economic activity by industry classification. Instead, these economic classification systems typically have only one source of qualitative information: the brief descriptions used to characterize a particular category of goods or services. Standard keyword extraction from these concise industry descriptions is challenging and often produces too narrow a set of keywords. To expand these keywords, we exploited the Cross-Lingual Expansion tool embedded in WIPO’s PATENTSCOPE.5 This tool is ideal for our purposes because it generates synonyms based on the full text of patents in different languages and therefore expands our keyword lists based on terms that appear frequently in patent documents. To showcase these mining and matching methods, we focus on directly mapping four-digit IPC subclasses to four-digit SITC trade classifications (SITC Rev. 2) and vice versa. This same process can be replicated for industrial classification schemes such as ISIC and SIC. The next two sections describe our methodology in detail. 4.1. Data Mining Approach (ALP-DM) The data mining approach (ALP-DM), as the name implies, relies on data mining the patent abstracts and titles included in the PATSTAT database using keywords from the industry classification descriptions. Specifically, the approach uses search terms generated by hand for the industry descriptions and identifies all of the patents that contain these specific keywords in either the title or abstract. Based on the number of patents that match the search terms, we obtain a frequency of IPC subclasses, which are then reweighted according to how frequent the IPC subclass is used overall.
5 This tool is available here: http://www.wipo.int/PATENTSCOPE/search/clir/clir.jsp?interfaceLanguage=en
8.

Lybbert and Zolas October 2012
The key process in the ALP-DM approach is producing the search terms that represent each industry description and reweighting the number of matches. For each industry code, we generate each of the search terms by hand from the text contained in the industry description. In some cases, the search terms have been augmented by additional keywords and synonyms generated by PATENTSCOPE. The search terms are designed to be as industry-specific as possible to reduce the noise coming from patent matches. In many ways, the search terms are similar to coming up with a Google search term for a specific industry. This becomes tricky for a number of reasons. On the one hand, we would like to include as many patent matches as possible to ensure proper coverage of the industry. However, increasing the scope of possible matches tends to introduce more noise and reduced accuracy. Therefore, the process requires careful treatment and we remove all terms that have multiple meanings or are considered too general. We also incorporate the use of “not” terms, since many industry descriptions include “not elsewhere specified” or refer to a particular sub-group within an industry. The final result from the assignment of search terms is that each industry is typically assigned anywhere from one to several dozen search terms, with additional “not” terms. Table 2 provides an example of the search terms generated for a grouping of SITC industry codes. Once the search terms are generated, it is then a straightforward process to query the PATSTAT database using these terms. Specifically, we identify patents that contain the exact phrases of each search term either in their title or in the abstract. We do not limit the patents by year or country, since we want the pool of patents to be as large and as varied as possible. After identifying the patents, we obtain a frequency of all the IPC subclasses that are contained within those patents. For patents containing multiple IPCs, each IPC is equally reweighted by the total number of IPCs contained within each patent. The (unweighted) frequency share for IPC subclass j is computed as:
( , ) iji j
i
mUnweighted Frequency SITC IPC
M= (1)
where mij indicates the number of patents that list IPC subclass j among those retrieved by the keywords for SITC i and Mi is the total number of patents retrieved by the keywords for SITC i. In the next step, we reweight the frequency shares in (1) by how frequently their corresponding IPC subclasses appear in the PATSTAT database. Subclasses that appear very frequently in the PATSTAT database are more likely to generate spurious matches with the search terms, so it is important to reduce the potential for noise by reweighting the matches. We explore two separate weighting schemes. The first weighting scheme (“Specificity Weights”) reweights the matches by the total number of IPC subclasses found in the database as follows:
( , ) ij ij ji j
i i
s m NSpecificityWeighted Frequency SITC IPC
M M= = (2)
where Nj indicates the total number of patents in PATSTAT that list IPC subclass j and sij represents the share of patents listing IPC subclass j that link to SITC i. These specificity weighted frequencies are then normalized to sum to one. The goal of this weighting scheme is to effectively adjust IPC subclasses so they have equal probability of matching the SITC search terms. This reduces much of the spurious matches caused by dominant IPC subclasses. There is a downside to this weighting scheme, however: it tends to disproportionally overweigh sparsely used IPC subclasses relative to frequently used IPC subclasses in ways that may not accurately reflect the way these technologies are used in practice. We therefore formulate a second, alternative weighing scheme as a middle ground. This hybrid of unweighted and specificity weighted frequency is defined as:
9.

Lybbert and Zolas October 2012
( , ) ij iji j
ij ijj
s mHybrid Weighted Frequency SITC IPC
s m=∑
(3)
where we weight each of the IPC subclasses that match to SITC i by share sij in both the numerator and denominator. This hybrid weighting approach is less extreme than pure specificity weights and may provide a better reflection of the nature of the technologies used in the industries. Table 3 illustrates the differences between the two weighting schemes using an example. In the example, the search terms for an SITC industry yields two IPC subclasses: A and B. In the initial raw frequency, IPC subclass A has a weight of 10%, while B has a weight of 90%. However, due to the fact that IPC subclass B shows up in the dataset 10,000 times, while A shows up in the dataset only 100 times, the “true” technological nature of this industry should weigh more heavily towards A since we can be reasonably sure that all of those matches are not spurious. Applying the specificity weighting approach reverses these weights, with A having a weight of 91.74% and B having a weight of 8.26%. This may be too extreme, since A only appears in 10% of the raw estimates, while B appears in 90% of the raw estimates. It may be the case that B is a widely applicable technology, while A is a narrowly defined technology that is rarely used. Applying the hybrid weighting approach moderates the results, assigning a 55.25% weight for A and 45.75% weight for B. With the differences in our two candidate weighting schemes in mind, note that since the nature of these technology-industry linkages is likely to vary across sectors, we would not expect one weighting scheme to dominate the other universally. In the subsequent section, we test how well these ALP concordances based on these different weighting schemes match existing concordances, which is the best test we could formulate for comparing these weighting options. Once all of the IPCs have been reweighed, the final step in the process purges the low-frequency IPCs and renormalizes the results. We set an arbitrary cutoff of 2% so that all IPCs whose frequencies are less than 2% are excluded and the remaining results are reweighted. This significantly reduces the amount of noise in each SITC. It may be worthwhile experimenting with different cutoff conditions to ascertain the optimal cutoff value. Based on our own explorations, we believe 2% represents a reasonable cutoff. To better illustrate the full outcome of the process, we provide the results for SITC code 8484, which is described as “Headgear and fitting thereof”. We first queried the PATSTAT database using the search terms found in Table 1. This initial query yielded 11,660 unique patents and 379 unique IPCs. Table 3 shows the results once the matches are reweighted, expunged of the low-frequency IPCs and renormalized. The final result conforms nicely with our own expectations of the types of technology that would be embedded in this industry. We repeat these steps for every SITC description and generate weights that match all 4-digit SITCs to 4-digit IPCs. We also apply the same methodology to the product descriptions from other common industry classification systems, such as ISIC, NAICS, HS and US SIC. The benefit of such a concordance is that no layering of concordances is required and the results are based on actual concurrent data, with minimal subjectivity. Researchers will have the flexibility to use a variety of different industry classification systems and get customized technology reports for each industry. Going forward, we will continue to explore different search queries and weighting schemes that may more accurately represent the true results.
10.
Lybbert and Zolas October 2012
4.2. Indexing and Probabilistic Matching Approach (ALP-PM) Our second approach uses a similar methodology as the ALP-DM approach, but incorporates a separate matching process. In this case, we first extract keywords from the patents and then match them to the industry descriptions using probability weights. While the data mining approach would typically be used to translate industries into technologies, this approach might better be used in the opposite direction and match technologies to industries. This approach may also ultimately enable patent-specific matching to economic classifications, although this would require further refining. In the initial step of this approach, we order the patents by IPC cluster. We then run each of the patents through a keyword extraction program. For our initial approach, we utilize an open- source Python-based keyword extraction program called “Topia Term Extract 1.10.”6 This extraction program is a generalized text extraction program that identifies the important terms within written content. The benefit of this program is that it also uses language patterns and statistical analysis to determine the strength of each keyword, so that it is possible to rank the keywords by order of importance. There are many other keyword extraction programs in existence, each with their own niche and specialty. While the results from each program will differ slightly, the programs generate very similar results on the whole. Because of the large quantity of words contained in both the patent abstracts and titles (especially when compared to the quantity of words found in the industry descriptions), it makes sense to weigh the keywords extracted from each patent according to relative importance. In this case, we weigh the keywords from the title to be twice the weight of the extracted keywords from the abstract. This is due to our belief that a single word from the title will provide a better clue as to the real nature of the invention rather than a single word from the abstract. We also limit the number of keywords extracted from each patent to be 10 total words from both the title and abstract. Patent titles and abstracts vary greatly in length, so in order for all patents to receive equal weighting, it is important to limit the matching process to the ten strongest keywords so that certain patents are not more influential. Another more nuanced step in the keyword extraction process is the use of a “blacklist.” Early in our analysis, we found that certain words kept appearing on the keyword extractions that were too general to be used in the matching process, such as “system”, “device”, “model”, “invention” and more. To construct this blacklist of keywords, we ran the keyword extraction program over 500,000 random patents and tabulated the keywords. We looked at the top 100 keywords and ran the PATENTSCOPE cross-lingual expander on certain keywords, which left us with a blacklist of roughly 250-300 keywords. We remove all of the blacklisted words from the extraction results. Once all of the keywords have been extracted and tabulated for the IPC cluster, we are left with a list of keywords and weights, which were obtained by summing the number of times each keyword appeared in all of the analyzed patents. Each of the keywords and weights are then matched against the industry classification descriptions generated in the ALP-DM approach with additional augmentations. For our initial runs, we used “exact string” matching, although it is possible to do “like” matching and set the tolerance level. For the “exact string” matching portion, we used an expanded word list based on the ALP-DM search terms, full industry 6 The program package and description can be found at http://pypi.python.org/pypi/topia.termextract/
11.

Lybbert and Zolas October 2012
descriptions, PATENTSCOPE synonyms and additional plurals, root words and alternative spellings. The reason for this augmentation of the industry terms is that the pool of possible industry matches is much smaller than the pool of patent matches (a couple hundred versus almost 20 million), so we wanted to maximize the quantity of matches and utilize a filtering system and reweighting process to reduce the false positives and thereby improve quality. For each match, we weighed the importance of the match by the weight of each keyword. The industries that matched with the keywords that have the highest weight after the extraction process were weighed the most. Once the industry and weights have been tabulated, we are left with our raw results. Next, to reduce the number of spurious matches, we employed a filtering process to the raw results. The first filtering process involved assigning allowable IPC-SITC correspondences. To implement this filter, we assigned lower level IPC’s (3-digit) with lower-level SITCs (2-digit). If the correspondence did not make sense, i.e. agricultural production with steel technology, then we disregarded the weights for that specific match. We did this for all 3-digit IPC’s and 2-digit SITCs. The next filter involved the 2% cutoff condition, which was similarly employed in the ALP-DM approach. All weights that represented less than 2% of the total weights between IPC and SITC were disregarded and the remaining weights were retabulated and normalized. We then implemented the same “Specificity” and “Hybrid” weighting schemes to these results To better illustrate the results, we run the full approach for IPC subclass A42B which is described as being “Headwear/Hats; Head Coverings”. These results can be found in Table 5 below. Overall, there are 20,988 patents that contain this particular IPC subclass. After running the keyword extraction program through these patents, we find that the five most common keywords are “utility model” (which is excluded from subsequent matching as a blacklisted term), “cap”, “hat” and “helmet” and “head”. We then used exact string matching to match all the (non-blacklisted) extracted keywords to corresponding SITCs. Once again, the end result matches closely with our own preconceptions of the industries that use headwear technology or whose industries might be used to make headwear technology. The next section compares how our software-based methodology stacks up against the existing concordances. 5. Comparison with Existing Concordances In this section, we use the ALP-DM and ALP-PM approaches with hybrid and specificity weights to generate concordances that are structurally comparable to two existing concordances and the devise tests for how well the ALP concordances fit the familiar concordances. Given that the two comparison concordances – the YTC and the DG concordance – are structurally very different, we view these tests as complementary. Specifically, we consider the YTC test to be the best high resolution test of how well the ALP approach can match careful human classification since it is based on patent examiners’ classification of patent applications into high resolution industrial categories and provides probabilistic weights that are directly comparable to ALP concordances. The DG concordance provides a test of how well the ALP concordance can match more aggregate, one-to-one matches. 5.1. YTC Comparison Unfortunately, we cannot identify the exact patents used in the YTC, but we can limit our ALP methodology to only the Canadian patents issued in the same time period between 1978 and 1993. This provides us coverage of more than 350,000 Canadian patents and abstracts (30%
12.

Lybbert and Zolas October 2012
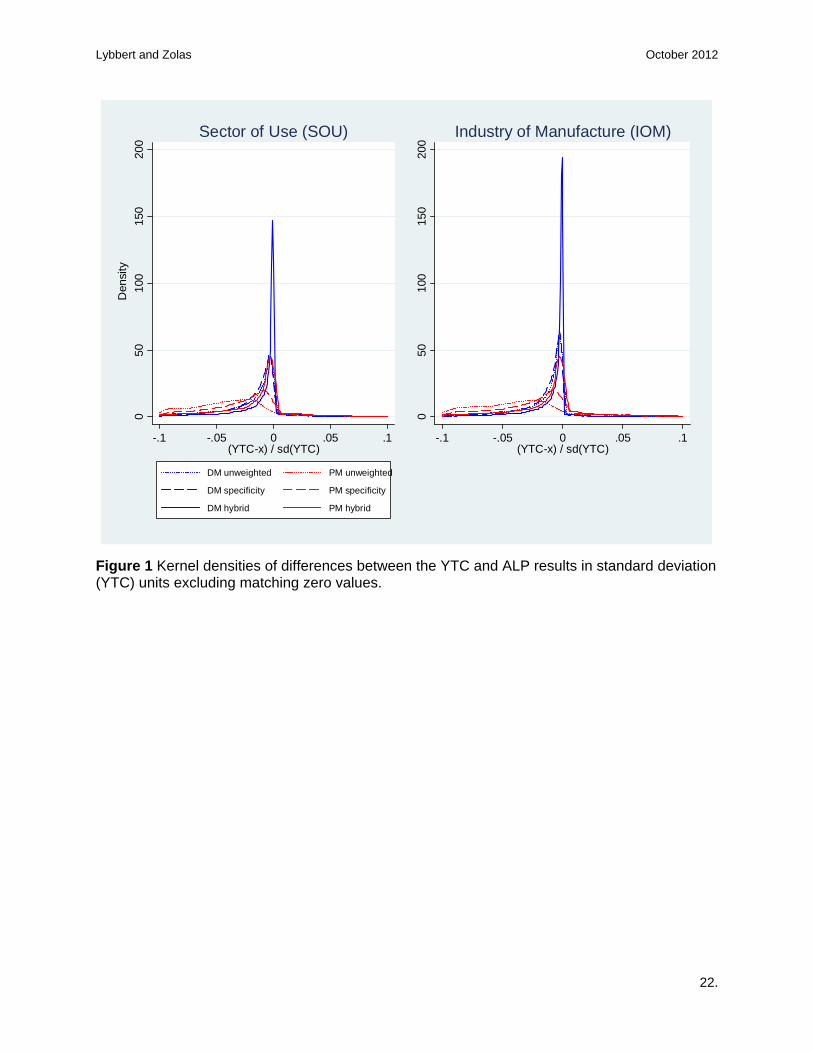
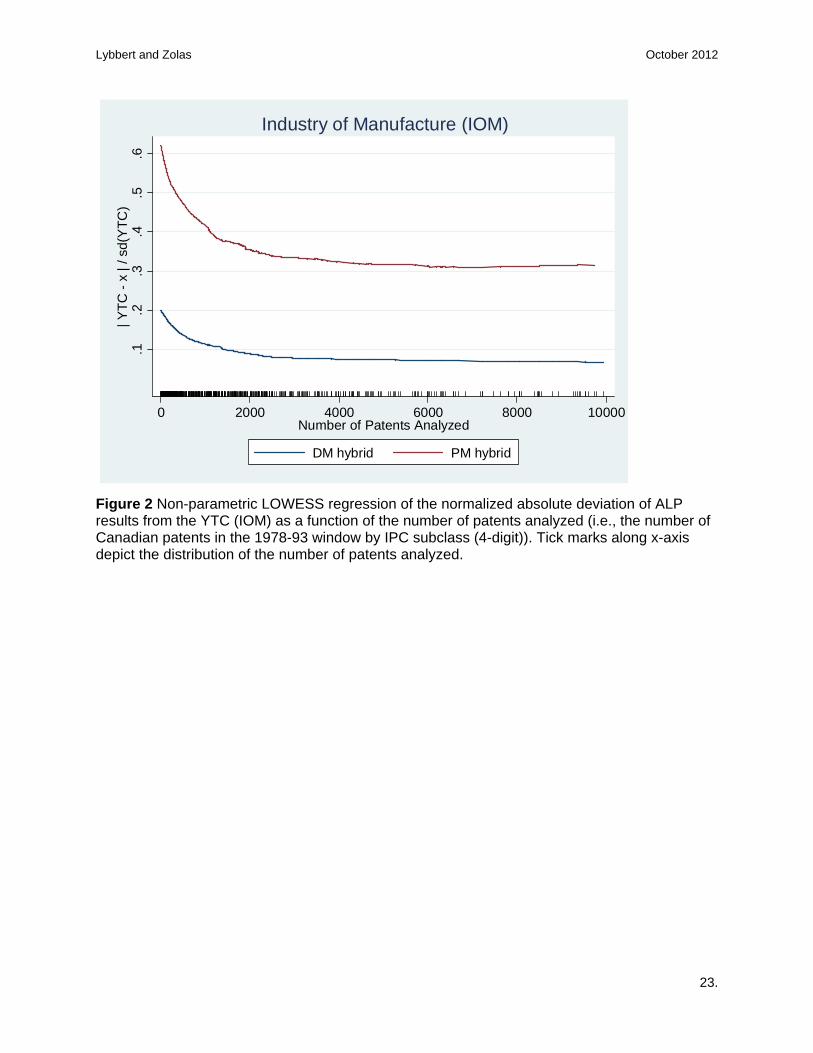
more than was used in the YTC). We then convert the IPC’s from those patents into the Canadian SICs using both the ALP-DM and ALP-PM algorithm. Note that our algorithm is more heavily weighted towards tradeable goods, since the specific purpose behind our approach is to convert technology data into specific product-types. The Canadian SICs are comprised of both tradeable and non-tradeable goods (e.g. services), so we expect there to be some inherent differences between the two approaches. We compare the YTC concordance against the concordances based on each of the three weighting options (unweighted, specificity weight and hybrid weight) for both the ALP-DM and ALP-PM. We do this first for the 4-digit cSIC-E for both the Sector of Use (SOU) and Industry of Manufacture (IOM). Since the YTC is constructed as a mix of 3- and 4-digit cSIC concordances with 4-digit IPC, we aggregate both the YTC and ALP concordances to the 3-digit cSIC. Therefore, in all of the comparisons that follow, our ALP results and the YTC results all concord 3-digit cSIC to 4-digit IPC. The first ALP-YTC comparison we conduct is provided in Table 6, a simple cross-tabulation of zero and positive values of the respective results where the off-diagonal elements provide a crude measure of errors. The ALP-DM approach generates matching zero values roughly 75% of the time and matching positive values 2.4-4.1% of the time. Conditional on YTC=0, the probability that ALP-DM correctly generates a zero weight is 78-79%. When YTC>0, the probability that this approach correctly generates a positive weight is 62-65%. In the case of the ALP-PM results, 90-94% of the results are matching zero values. The conditional probabilities of a matched zero and matched positive weight, respectively, are 96-98% and 28-38%. Table 6 captures a key tradeoff between the type I and type II errors associated with the ALP-DM and PM approaches: relative to the ALP-PM approach, the ALP-DM approach produces fewer false positives at the expense of more false negatives. Next, we compute the difference between the YTC and our ALP results. Given that the majority of these differences are zero due to matching zero values (see Table 6), we compare these differences across all possible combinations of 3-digit cSIC and 4-digit IPC excluding matching zero values. This provides a strong test of our results with the YTC. Figure 1 shows the distribution of these differences in standard deviation (of the YTC) units. Several things are noteworthy in this figure. First, these differences are extremely small relative to the standard deviation of the YTC. Even after excluding matching zero values, the vast majority of these differences are less than 10% of the standard deviation of the YTC. Second, the ALP approach and weighting noticeably affects the fit of the ALP results to the YTC results. The ALP-DM approach produces the smallest errors, which seems consistent with Table 6 results since this figure excludes zero values. In both approaches, the hybrid weights generate the best fit to the YTC results. In the case of the ALP-DM approach with hybrid weights, the bulk of the results are within 2% of the standard deviation of the YTC. Finally, although it is not clear the differences are significant, the weighted ALP-DM approach appears to better fit IOM than SOU results. As a final comparison of our ALP results and the YTC, we assess how the fit between the two changes with the number of patents available to process, which is determined by the number of Canadian patents in each IPC subclass (4-digit) from 1978 to 1993. Since the ALP approach is a statistical approach that relies on the law of large numbers, we hypothesize that it will more closely approximate the human classification-based YTC as the number of patents processed increases. For future use of ALP approaches, it is important to demonstrate this pattern and to characterize how the number of patents processed affects the quality of the results. The YTC comparison offers a convenient test of this hypothesis since the number of patents in different IPC subclasses varies widely in these Canadian patents (see x-axis in Figure 2). To exploit this
13.

Lybbert and Zolas October 2012
variation, we non-parametrically regress the absolute deviation of the YTC with our ALP results – normalized again by the standard deviation of the YTC – on the number of patents processed. This regression (Figure 2) confirms that the fit improves as the number of patents processed increases. When the number of patents processed is less 2000, the rate of improvement is very apparent. Beyond this threshold, doubling or tripling the number of patents analyzed does nothing to improve the fit. This result provides a useful benchmark for future applications of the ALP approach, which, incidentally, will almost always include many more patents than are contained in this subset of Canadian patents. Overall, the comparison of the ALP concordances with the YTC shows some systematic biases that are mainly attributed to the methodological construction of the concordance. Our concordance matches to tradeable classes better than non-tradeable classes.7 While these differences can be seen occasionally at high resolution (e.g., 4-digit), the differences quickly fade with aggregation. There may be more that could be done to refine the matches on the margin, but we expect these improvements to be modest at best and will instead focus our attention on applying the ALM methodology to other trade and industry classifications. 5.2. DG Concordance Comparison As a second check, we compare the results of our concordance with the DG Concordance constructed by Schmoch et al. (2003). The DG Concordance linked IPCs to both the NACE and ISIC (Rev. 3) classification system using a one-to-one mapping of 4-digit IPC groups into 44 different manufacturing fields, which are then assigned to one or more ISICs. The assignment of IPCs to manufacturing fields was based on the industry of operation of firms filing patent applications. The DG Concordance used more than 3,000 applicant firms that accounted for more than 150,000 patents from 1997 to 1999. Once they identified the industry of the firm, they summed up the IPC counts of the patents filed by the firm and assigned the largest IPC weight a one-to-one match with the manufacturing field. We generated ALP concordances for IPC-ISIC (Rev. 3), then aggregated the 4-digit ISICs to match the 44 industry fields used in the DG approach. The overall correlation between our ALP weights and the DG weights – which are binary indicators for whether a given IPC subclass is included in an industrial field (1) or not (0) – ranges from 0.36 to 0.53 depending on the methodology used. Given the structural differences between these approaches (i.e., one-to-one matching versus probabilities), these correlations seem quite encouraging. Beyond this overall correlation, we find that the ALP approach matches the DG concordance better in some fields than in others. The ALP concordances matched better with well-defined industrial fields such as "Tobacco", "Wood Products" and "Accumulators", but matched less well with more broadly defined industry types such as "Non-specific Machinery", "Agricultural Machinery" and "Electrical Components". As a more quantitative comparison of these differences across industrial fields, we take the average weight for each field across all of the IPCs within that field. For instance, Field 1 has 19 different IPCs associated with that specific field. The DG Concordance assigns a 100% weight for each those 19 IPCs into ISIC (Rev. 3). We compute a similar average for the ALP concordances by taking the average weight of these same 19 IPCs (and similarly for each field). 7 As we pushed further into the comparison with the YTC, we ran some basic fixed-effect regressions on the 4-digit weights to identify any specific differences between certain class levels. We found that our algorithmic approach tends to under-weigh most of the non-tradeable cSIC-E (these are cSIC1 greater than 5). This is unsurprising since our algorithm relies most frequently on identifying specific products and goods, and it is much more difficult to match specific services.
14.

Lybbert and Zolas October 2012
Table 7 summarizes these average weights for each field using the different weighting schemes. As another comparison, we compare the mean ALP weight for all IPC subclass-field pairs that are not matched by the DG concordance (i.e., DG=0) with the mean ALP weight for those that are matched by the concordance (i.e., DG=1). As shown in Table 8, the differences between these mean weights are statistically significant for all ALP approaches and particularly stark for the ALP-DM approach with hybrid weights. For a final comparison, we rank order the weights within each IPC subclass across fields and compare these ranked weights to the binary DG weights for these subclasses. The final two columns of Table 8 show how frequently the three largest ALP weights for a given IPC subclass include the IPC-field linkage implied by the DG (i.e., DG=1). Roughly 50% of the time the ALP-DM with hybrid weights captures the DG match in the top three. Taken together, these comparisons seem to indicate that ALP concordances – especially from the ALP-DM approach – provide a reasonably strong match to the DG concordance. With this comparison in mind, it is worth noting that there are added benefits to the ALP approach relative to the DG approach. If one is interested primarily in the 44 fields contained in the DG concordance, the ALP approach generates a probability structure that in many contexts is preferable to the one-to-one binary matches of the DG concordance. Potentially even more important, the ALP approach provides much more disaggregated linkages that enable economic data to speak to patent data at a much higher industrial resolution if necessary. 6. Sample Analysis of Disaggregated Patent & Trade Flows ALP concordances offer a promising way to jointly analyze patents and economic data at an unprecedented level of resolution. To demonstrate one potential use of this concordance, we analyze how bilateral patent flows are related to bilateral trade flows. We expect patent flows between two countries to be highly correlated with trade because the fixed costs and benefits of both activities are similar and the two are closely linked with technology transfer (Coe and Helpman 1995; Eaton and Kortum 1996). Previous analyses of international patent flows have relied heavily on a “gravity” model of trade, where bilateral patent flows are determined by the economic size of the countries (i.e. GDP), distance and other country-specific factors. These studies have all looked at the aggregate flows (Harhoff et al. 2007; Bosworth 1983; Eaton et al. 2004; Slama 1981) with no breakdown of industry-level or sectoral differences. A more detailed analysis of the same topic at the industry level can yield additional insights into international patenting strategies across the different industries and technologies.8 To make this comparison, we use bilateral trade flows from the UN-Comtrade database organized by 4-digit SITC (Rev. 2) and bilateral patent flows from the PATSTAT database organized by 4-digit IPC. To use these disaggregated patent and trade data jointly, we concord the patents to the 4-digit SITC (Rev. 2) using the ALP-DM approach with hybrid weights. Thus, the bilateral patent flows associated with a given 4-digit SITC are computed as weighted bilateral patent flows of the 4-digit IPCs that concord to the SITC in the ALM-DM concordance, which provides the weights on each of these IPCs. In addition to trade flows, our gravity model specification includes country-specific variables such as the origin and destination country GDP
8 In a survey of the literature regarding patents as measures of technological change, Basberg (1987) notes that patents applied for abroad are most likely to be highest quality patents due to time and costs involved with the application process. Similar statements acknowledging the value of foreign patents were made in Putnam (1996).
15.

Lybbert and Zolas October 2012
(obtained from World Bank Indicators) as well as some industry-specific measures.9 As an extension of our basic specification, we bifurcate our sample using the Broad Economic Classification (BEC) system10 to see how patent flows differ across different industry types. After applying the concordance and organizing all the variables, we are left with 634 different 4-digit SITC industries that filed for patents in at least one of 68 possible destination countries between 2001 and 2005 (14,442,520 possible observations). Table 9 provides a summary of the variables used. At the disaggregated level, there is a much higher proportion of zero patents than zero trade. In the cases where both trade and patent flows were zero between the two countries, these observations were dropped. Otherwise, we retained the observation and treat the zeros as informative. Since we are regressing count data (patents), we run a pseudo (Poisson) maximum likelihood (PPML) regression as recommended in Santos Silva and Tenreyro (2006).11 We first estimate a gravity equation of aggregate country-level bilateral patent flows based on GDP and country-level trade barriers, such as distance and border effects. We provide this as comparison with the previous studies looking at international patenting flows. The GDP measures are intended to capture market supply, demand and absorption capabilities for new technologies of the origin and destination countries, while the gravity terms capture the transaction costs of doing business abroad. We then estimate the same equation and include bilateral trade. We expect countries which are more economically integrated to more readily file patent applications with each other (after controlling for trade barriers and market sizes) since firms’ incentives to protect innovations in foreign markets are increasing in export revenues earned in those markets. The aggregate results in Table 10, which are based on total bilateral patent and trade flows (i.e., not disaggregated using the ALP-DM concordance), provide a benchmark for the (shaded) disaggregated specifications that use the concordance. Column (1) provides the PPML estimates for the simple gravity model of patent flows. The overall fit of the gravity model is quite high, with market size playing the largest role in determining patent flows. The regression also shows that besides distance, none of the other gravity variables are significant and distance is only significant at the 5% level. These findings are similar to the Eaton et al. (2004) study that also found a low elasticity of patent flows with respect to distance. Columns (2) and (3) include bilateral trade and the same country-specific variables. We can see that trade is positively related to patent flows with an estimated trade elasticity of 0.41-0.56 at the aggregate level. When similar regressions are estimated at the disaggregate 4-digit SITC level (Columns 3 through 7), we see some noticeable differences in the values of the coefficients. Across all industries, the trade elasticity decreases to 0.24-0.28 and 0.15-0.17 without and with industry fixed effects, respectively. The decline in the elasticity at the disaggregate level seems to imply that while trade flows continue to shape patent application decisions, other industry-specific factors enter importantly into these patenting decisions once we can model the relationship at higher resolution. Specifically, GDP and other gravity variables (e.g., distance, common
9 We use the elasticity of substitution measures obtained from Broda and Weinstein (2006) which are organized by 4-digit SITC 10 Provided by the United Nations (2002 Version). Note that several SITC’s qualify under multiple BEC classifications, in which case we still counted that SITC among each bifurcated group. Hence, the total number of observations from the bifurcation will exceed the total number for all industries. 11 In addition to the Poisson regression, we also experimented with OLS using ln (Patents + a) where a is a relatively small constant. We also ran similar regressions using the Zero-Inflated Poisson (ZIP) regressions. The results from these estimations are qualitatively similar to our current estimates and are available upon request.
16.

Lybbert and Zolas October 2012
language, colonial relationship) play a larger and statistically clearer role at the disaggregate level. As an additional exercise, we further leveraged the ALP-DM concordance to estimate the full disaggregated model in column (7) by subsamples as defined by selected Broad Economic Categories.12 This allows us to investigate whether there are any noticeable differences in patenting behavior across broad industries. Specifically, we break our sample into three BEC classes across which we expect there to be differences in how firms use patents: Industrial Supplies (BEC-2), Capital Goods (BEC-4), and Consumer Goods (BEC-6). Since Industrial Supplies encompass primarily intermediate goods and Consumer Goods encompass primarily final goods, we expect bilateral exports to shape bilateral patent flows more in the former than the latter. This pattern is evident in our results (Table 11). The trade elasticities for capital and consumer goods are nearly twice as large as the elasticity for Industrial Supplies. Once we can match patent flows to SITC and subsequently to BEC, we also see that the destination country’s market size plays a larger role in patent flows for capital and consumer goods and that capital goods are more sensitive to geographic barriers such as distance and border effects. There is obviously much more that could be done to push this analysis further, which is the focus of ongoing research. Our objective here is simply to illustrate how an ALP concordance might be used to better understand determinants of international patenting strategies. In addition to enabling joint analysis of disaggregated patent and trade flows, such a concordance opens other modeling possibilities because many other data sources are structured using economic classifications such as SITC and ISIC. Finally, note that while this sample analysis involves model estimation, there are many descriptive analyses that are enabled by ALP concordances that are potentially just as insightful and policy relevant. For example, these concordances make it possible to add layers of economic and industrial activity to standard patent landscapes, making it easier to detect key innovation trends and patterns in specific fields. 7. Conclusion There is a long and important literature that uses patents to understand the innovation and diffusion of technology. While economists have made important contributions to this field of inquiry, economic analyses of patents have often been constrained by the mismatch between patent and economic data. The ALP methods we develop in this paper enable patents and economic data to speak to each other at an unprecedented level of disaggregation. There are many policy-relevant questions that could be addressed by joint, high resolution analyses of patent and economic data, including both descriptive exercises (e.g., enhanced patent landscapes) and more rigorous model estimation (e.g., dynamics models of the economic impacts associated with innovation, international technology transfer and patenting strategies, etc.). By making the ALP concordances we have constructed available to researchers and continuing to refine these methods as yet more powerful algorithmic tools are developed, we hope to enable these kinds of industry-level analyses in order to complement the insightful but relatively limited firm-level analyses that exist. With ongoing efforts to make such firm-level data more readily available, the complementarities between micro-analyses of firms and meso-analyses of industries will enable a richer understanding of relationships between
12 These are provided by the UN and are constructed based on SITC categories. For more details, see http://unstats.un.org/unsd/pubs/gesgrid.asp?id=331 .
17.

Lybbert and Zolas October 2012
patenting and economic activity in different sectors, countries, or regions – including particularly important insights into the dynamics of these relationships over time and in response to policy and institutional changes. In this paper, we have developed and tested two ALP approaches to constructing concordances along with various weighting options. Based on testing these approaches against existing concordances, the data mining approach (ALP-DM) with hybrid weights outperforms the probability matching approach (ALP-PM). For near term research, concordances based on the ALP-DM approach with hybrid weights will provide the most reliable means of linking patents to economic data. With continued advances in text and semantic analysis tools and richer databases, however, new possibilities will emerge for building these linkages at yet greater levels of disaggregation. For example, an enhanced ALP-PM approach may soon be able to match individual patents to economic classifications – or even to actual products or processes that use the invention. Although effectively leveraging high resolution linkages like this will demand real research creativity, we believe the potential gains associated with a flurry of creative work on this frontier are extraordinary.
18.
Lybbert and Zolas October 2012
REFERENCES Aghion, Phillipe and Peter Howitt, “A Model of Growth Through Creative Destruction,” Econometrica, Vol. 60, No. 2, March 1992. Andrews, Nicholas and Edward Fox, “Recent Developments in Document Clustering,” Working Paper, October 2007. Acharya, Ram and Wolfgang Keller, “Technology Transfer Through Imports,” Canadian Journal of Economics, Vol. 42, No. 4, November 2009. Barro, Robert and Jong-Wha Lee, “A New Data Set of Educational Attainment in the World: 1950-2010,” NBER Working Paper No. 15902, April 2010. Basberg, Bjorn, “Patents and the Measurement of Technological Change: A Survey of the Literature,” Research Policy, Vol. 16, No. 2-4, August 1987. Bosworth, Derek, “Foreign Patent Flows To and From the United Kingdom,” Research Policy, Vol. 13, No. 2, 1984. Branstetter, Lee and Raymond Fisman and C. Fritz Foley, “Do Stronger Intellectual Property Rights Increase International Technology Transfer? Evidence from U.S. Firm-Level Panel Data,” Quarterly Journal of Economics, Vol. 121, No. 1, February 2006. Broda, Christian and David Weinstein, “Globalization and the Gains from Variety,” Quarterly Journal of Economics, Vol. 1212, No. 2, 2006. Coe, David and Elhanan Helpman, “International R&D Spillovers,” European Economic Review, Vol. 35, No. 5, May 1995. Comanor, William and F. M. Scherer, “Patent Statistics as a Measure of Technical Change,” Journal of Political Economy, Vol. 77, No. 3, May-June 1969. Eaton, Jonathan and Samuel Kortum, “Trade in Ideas: Patenting and Productivity in the OECD,” Journal of International Economics, Vol. 40, No. 3-4, May 1996. Eaton, Jonathan and Samuel Kortum, “International Patenting and Technology Diffusion: Theory and Measurement,” International Economic Review, Vol. 40, No. 3, August 1999. Eaton, Jonathan and Samuel Kortum, “Technology, Geography and Trade,” Econometrica, Vol. 70, No. 5, September 2002. Eaton, Jonathan and Samuel Kortum, Josh Lerner, “International Patenting and the European Patent Office: A Quantitative Assessment,” Patents, Innovation and Economic Performance: OECD Conference Proceedings, 2004. Evenson, Robert and Jonathan Putnam, “Inter-Sectoral Technology Flows: Estimates from a Patent Concordance with an Application to Italy,” Yale University Mimeo, 1994. Falvey, Rod and Neil Foster, “The Role of Intellectual Property Rights in Technology Transfer and Economic Growth: Theory and Evidence,” UNIDO Working Paper, 2006.
19.
Lybbert and Zolas October 2012
Griliches, Zvi, “Patent Statistics as Economic Indicators: A Suvery,” Journal of Economic Literature, Vol. 28, December 1990. Grossman, Gene and Elhanan Helpman, “Innovation and Growth in the Global Economy,” MIT Press, 1991. Harhoff, Dietmar and Karin Hoisl, Bettina Reichl, Bruno Van Pottelsberghe De La Potterie, “Patent Validation at the Country Level: The Role of Fees and Translation Costs,” Research Policy, Vol. 38, No. 9, 2009. Jaffe, Adam and Manuel Trajtenberg and Rebecca Henderson, “Geographic Localization of Knowledge Spillovers as Evidenced by Patent Citations,” Quarterly Journal of Economics, Vol. 108, No. 3, August 1993. Johnson, Daniel, “The OECD Technology Concordance (OTC): Patents by Industry of Manufacture and Sector of Use,” OECD Science, Technology and Industry Working Papers, March 2002. Keller, Wolfgang, “International Technology Diffusion,” NBER Working Paper #8573. October 2001. Kortum, Samuel and Jonathan Putnam, “Assigning Patents to Industries: Tests of the Yale Technology Concordance,” Economic Systems Research, Vol. 9, No. 2, 1997. Moehrle, Martin and Lother Walter, Isumo Bergmann, Sebastian Bobe and Svenja Skrzipale, “Patinformatics as a Business Process: A Guideline Through Patent Research Tasks and Tools,” World Patent Information, Vol. 32, 2010. Park, Walter, “International Patent Protection: 1960-2005,” Research Policy, Vol. 37, No.4, May 2008. Putnam, Jonathan, “The Value of International Patent Protection”, Yale University Dissertation, 1996. Porter, Michael E. and Scott Stern, “Measuring the “Ideas” Production Function: Evidence from International Patent Output”, NBER Working Paper 7891, 2000. Romer, Paul, “Endogenous Technological Change”, Journal of Political Economy, Vol. 98, No. 5, October 1990. Santos Silva, J.M.C and Silvana Tenreyro, “The Log of Gravity,” The Review of Economics and Statistics, Vol. 88, No. 4, November 2006. Schmoch, Ulrich, Francoise LaVille, Pari Patel, and Rainer Frietsch, “Linking Technology Areas to Industrial Sectors: Final Reports to the European Commission,” DG Research, November 2003. Slama, Jiri, “Analysis by Means of a Gravitation Model of International Flows of Patent Applications in the Period 1967 – 1978,” World patent Information, Vol. 3, No. 1, 1981.
20.

Lybbert and Zolas October 2012
Verspagen, Bart, Ton van Moergastel, and Maureen Slabbers, “MERIT Concordance Tables: IPC-ISIC (Rev. 2),” MERIT Research Memorandum, February 1994. Xu, Bin and Eric Chiang, “Trade, Patents and International Technology Diffusion,” Journal of International Trade and Economic Development, Vol. 14, No. 1, 2005.
21.
Lybbert and Zolas October 2012
050
100
150
200
Den
sity
-.1 -.05 0 .05 .1(YTC-x) / sd(YTC)
DM unweighted
DM specificity
DM hybrid
PM unweighted
PM specificity
PM hybrid
Sector of Use (SOU)
050
100
150
200
-.1 -.05 0 .05 .1(YTC-x) / sd(YTC)
Industry of Manufacture (IOM)
Figure 1 Kernel densities of differences between the YTC and ALP results in standard deviation (YTC) units excluding matching zero values.
22.
Lybbert and Zolas October 2012
.1.2
.3.4
.5.6
| YTC
- x
| / s
d(Y
TC)
0 2000 4000 6000 8000 10000Number of Patents Analyzed
DM hybrid PM hybrid
Industry of Manufacture (IOM)
Figure 2 Non-parametric LOWESS regression of the normalized absolute deviation of ALP results from the YTC (IOM) as a function of the number of patents analyzed (i.e., the number of Canadian patents in the 1978-93 window by IPC subclass (4-digit)). Tick marks along x-axis depict the distribution of the number of patents analyzed.
23.

Lybbert and Zolas October 2012
Table 1 Concordance for IPC subclass B64D which is “Aircraft; Aviation; Cosmonautics / Equipment for Fitting in or to Aircraft”
Initial Concordance: IPC-cSIC Composite Concordance: IPC-cSIC- ISIC
Description Weight Description Weight
Aircraft and Aircraft Parts Industry 43.2% Manufacture of other fabricated metal products; metal working service activities
10.8%
Other Communication and Electronic Equipment Industries 9.4% Manufacture of motor vehicles 10.8%
Other Machinery and Equipment Industries 6.3%
Manufacture of bodies (coachwork) for motor vehicles; manufacture of trailers and semi-trailers
10.8%
Indicating, Recording and Controlling Instruments Industry 5.8% Steam and air conditioning supply 10.8%
Other Textile Products Industries 5.0% Freshwater fishing 1.4% Electrical Switchgear and Protective Equipment Industry 2.9% Marine aquaculture 1.4%
Table 2 Example search terms used for SITC Industry Descriptions SITC Code SITC Full Description Search Terms
“Not” Search Terms
8484 Headgear and fitting thereof, nes “Headgear”, “Head Gear”, "Helmet”
8510 Footwear “Footwear”
8710 Optical instruments and apparatus “Optical Instruments”, “Eyeglasses”
8720 Medical instruments and appliances, nes
“Medical Instrument”, “Medical Appliance”
8731 Gas, liquid and electricity supply or production meters; etc
“Gas Meter”, “Liquid Meter”, “Electric Meter” “Part”
8732 Counting devices non-electrical; stroboscopes
“Counting Device”, “Stroboscope”
“Part”, “Electric”
8741
Surveying, navigational, compasses, etc, instruments, nonelectrical
“Surveying Equipment”, “Surveying Instrument”
Table 3 Illustration of Weighting Schemes
SITC IPC Match IPC Total Absolute
Frequency Specificity Weights
Hybrid Weights
1 A 100 100 10% 91.74% 55.25%
1 B 900 10,000 90% 8.26% 44.75%
24.

Lybbert and Zolas October 2012
Table 4 IPC Frequency for Industry Group, “Headgear and Fitting Thereof” (SITC 8484)
IPC Raw Specificity Hybrid IPC Description A42B 43.1% 53.5% 97.8% Hats; Head Coverings A42C 1.5% 23.4% - Manufacturing or Trimming Hats A62B 5.2% 9.9% 2.2% Devices For Life-Saving B68B 0.1% 5.1% - Harness; Whips Or The Like F41H 1.7% 5.1% - Armour; Camouflage B63C 1.6% 3.0% - Life-Saving In Water; Table 5 ALP-PM Approach Example for IPC Class A42B IPC Number A42B IPC Description Headwear – Hats; Head Coverings Top Keywords “Helmet”, “Utility Model”, “Cap”, “Hat”, “Head” # of Patents Analyzed 20,988 SITC Description
Raw Weight
Specificity Weight
Hybrid Weight
8484 - Headgear and fitting thereof, nes 65.0% 13.8% 72.3% 6576 - Hat shapes, hat-forms, hat-bodies and hoods 19.0% 7.4% 11.4% 6571 - Articles of felt, nes 8.1% - - 8421 - Overcoats 7.9% - - 6579 - Special products of textile material - 20.6% - 6517 - Yarn of regenerated fibres - 20.1% 6.7% 6577 - Wadding, wicks - 14.5% 4.6% 6543 - Woven fabric of wool or fine hair, nes - 12.8% 5.0% 6581 - Textile material used for packing of goods - 7.9% - 6121 - Articles of leather used in mechanical appliances - 3.0% -
25.

Lybbert and Zolas October 2012
Table 6 Cross-tabs of zero and positive values of YTC and ALP results (both DM and PM results are based on hybrid weights)
Sector of Use (N=232,498) Industry of Manufacture
(N=232,361) ALP=0 ALP>0 ALP=0 ALP>0 Data Mining
(ALP-DM) YTC=0 73.9% 19.7% 93.5% YTC=0 75.0% 21.3% 96.3% YTC>0 2.5% 4.1% 6.5% YTC>0 1.3% 2.4% 3.7% 76.3% 23.7% 100% 76.4% 23.7% 100%
ALP=0 ALP>0 ALP=0 ALP>0 YTC=0 89.5% 4.0% 93.5% YTC=0 93.9% 2.4% 96.3%
Probability Matching (ALP-PM) YTC>0 4.7% 1.8% 6.5% YTC>0 2.3% 1.4% 3.7% 94.2% 5.8% 100% 96.2% 3.8% 100%
26.

Lybbert and Zolas October 2012
Table 7 Comparison of the DG and ALP Concordances across industrial field ALP-DM Approach ALP-PM Approach DG Raw Specificity Hybrid Raw Specificit
y Hybrid
Field Description (1) (2) (3) (4) (5) (6) (7) 1 Food 100% 43% 42% 65% 33% 17% 35% 2 Tobacco 100% 31% 36% 75% 87% 44% 98% 3 Textiles 100% 29% 30% 57% 11% 8% 5% 4 Wearing 100% 21% 2% 18% 2% 1% 0% 5 Leather 100% 7% 23% 22% 21% 28% 25% 6 Wood Products 100% 25% 63% 67% 8% 1% 8% 7 Paper 100% 23% 20% 53% 14% 15% 12% 9 Petroleum 100% 5% 5% 8% 7% 18% 4% 10 Basic Chemicals 100% 23% 10% 31% 9% 1% 11% 11 Pesticides 100% 10% 28% 78% 5% 0% 0% 12 Paint 100% 0% 0% 0% 0% 0% 0% 13 Pharmaceuticals 100% 10% 3% 22% 0% 0% 0% 14 Soaps 100% 12% 24% 34% 5% 0% 2% 15 Other Chemicals 100% 11% 0% 8% 1% 0% 1% 16 Man-made Fibres 100% 0% 36% 21% 0% 0% 0% 17 Plastic Products 100% 3% 17% 21% 5% 4% 6% 18 Mineral Products 100% 25% 29% 38% 16% 2% 20% 19 Basic Metals 100% 24% 16% 26% 32% 36% 31% 20 Metal Products 100% 11% 9% 12% 5% 3% 4% 21 Energy Machinery 100% 27% 22% 40% 0% 0% 0% 22 Non-specific Machinery 100% 4% 2% 8% 0% 0% 0% 23 Agricultural Machinery 100% 7% 3% 4% 2% 0% 2% 24 Machine Tools 100% 2% 4% 4% 6% 5% 9% 25 Special Machinery 100% 3% 5% 4% 2% 0% 2% 26 Weapons 100% 17% 56% 71% 1% 0% 1% 27 Domestic Appliances 100% 13% 9% 25% 5% 1% 6% 28 Computers 100% 16% 1% 11% 1% 2% 2% 29 Electric Motors 100% 9% 16% 12% 0% 1% 1% 30 Electrical Distribution 100% 8% 9% 10% 12% 1% 6% 31 Accumulators 100% 23% 69% 74% 0% 0% 0% 32 Lightening 100% 8% 13% 28% 2% 0% 0% 33 Other Electrical 100% 6% 1% 4% 11% 10% 12% 34 Electronic Components 100% 0% 0% 0% 1% 2% 0% 35 Telecommunications 100% 2% 2% 4% 7% 8% 8% 36 Television 100% 14% 9% 20% 11% 12% 9% 37 Medical Equipment 100% 1% 4% 4% 2% 0% 1% 38 Measuring Instruments 100% 2% 1% 4% 8% 10% 13% 39 Industrial Control 100% 0% 0% 3% 7% 9% 9% 40 Optics 100% 5% 7% 11% 4% 2% 5% 41 Watches 100% 39% 22% 89% 1% 0% 0% 42 Motor Vehicles 100% 18% 1% 11% 0% 0% 0% 43 Other Transport 100% 17% 11% 26% 0% 0% 0% 44 Consumer Goods 100% 19% 22% 30% 9% 7% 9%
27.

Lybbert and Zolas October 2012
Table 8 Summary of comparison of ALP concordance with the DG concordances (Schmoch et al. 2003) where DG=1 indicates that the DG assigns a particular IPC subclass to an industrial field
Mean Weight % ranked in top 3 by IPC
subclass DG=0 DG=1 t-statistic DG=0 DG=1 Data Mining (ALP-DM) Raw 0.02 0.07 24.2 5.9% 42.5% w/ 2% cutoff 0.02 0.13 37.6 5.8% 44.5% Specificity 0.02 0.07 14.2 5.9% 40.3% w/ 2% cutoff 0.02 0.11 19.9 5.0% 38.5% Hybrid 0.02 0.17 41.9 5.7% 52.6% w/ 2% cutoff 0.02 0.20 45.0 5.1% 47.5%Probability Matching (ALP-PM) Raw 0.02 0.06 14.5 6.1% 20.5% w/ 2% cutoff 0.02 0.06 14.9 6.0% 20.1% Specificity 0.02 0.04 8.5 6.0% 12.2% w/ 2% cutoff 0.02 0.04 8.0 6.1% 12.2% Hybrid 0.02 0.07 13.7 6.0% 20.2% w/ 2% cutoff 0.02 0.07 13.3 5.6% 19.7%
28.

Lybbert and Zolas October 2012
Table 9 Summary statistics for variables used in sample analysis of bilateral trade and patent application flows.
Variable Source Mean Min. Max. Percent
Zero # of Obs.
Bilateral Patent Flows PATSTAT 2.798
(26.520) 0 4572 95.8 14,442,520
Bilateral Trade Flows UN-Comtrade
7010.57 (121965)
0 3.65e7 70.5 14,442,520
Origin & Destination GDP
WB Indicator
5.35e11 (1.50e12)
8.15e8 1.26e13 - 14,442,520
Elasticity of Substitution Broda &
Weinstein (2006)
5.85 (13.642)
1.1 131.5 - 9,197,184
Distance CEPII 7080.58
(4952.76) 60 19,772 - 14,442,520
Border CEPII 0.035
(0.185) 0 1 - 14,442,520
Common Language CEPII 0.114
(0.318) 0 1 - 14,442,520
Colony CEPII 0.027
(0.163) 0 1 - 14,442,520
Note: Standard Deviations are in parenthesis. The Means and Standard Deviations for bilateral patent flows and trade flows are for the nonzero observations.
29.
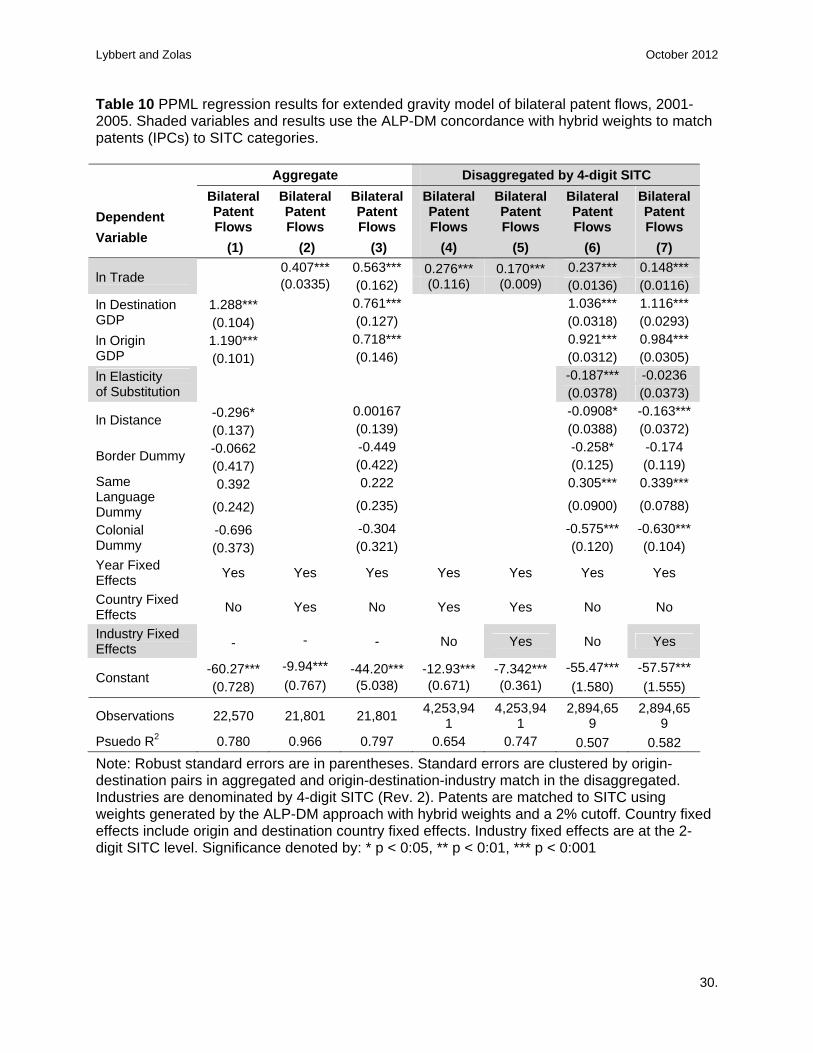
Lybbert and Zolas October 2012
Table 10 PPML regression results for extended gravity model of bilateral patent flows, 2001-2005. Shaded variables and results use the ALP-DM concordance with hybrid weights to match patents (IPCs) to SITC categories. Aggregate Disaggregated by 4-digit SITC Dependent Variable
Bilateral Patent Flows
(1)
Bilateral Patent Flows
(2)
Bilateral Patent Flows
(3)
Bilateral Patent Flows
(4)
Bilateral Patent Flows
(5)
Bilateral Patent Flows
(6)
Bilateral Patent Flows
(7) 0.407*** 0.563*** 0.276*** 0.170*** 0.237*** 0.148***
ln Trade (0.0335) (0.162) (0.116) (0.009) (0.0136) (0.0116) 1.288*** 0.761*** 1.036*** 1.116*** ln Destination
GDP (0.104) (0.127) (0.0318) (0.0293) 1.190*** 0.718*** 0.921*** 0.984*** ln Origin
GDP (0.101) (0.146) (0.0312) (0.0305) -0.187*** -0.0236 ln Elasticity
of Substitution (0.0378) (0.0373) -0.296* 0.00167 -0.0908* -0.163***
ln Distance (0.137) (0.139) (0.0388) (0.0372) -0.0662 -0.449 -0.258* -0.174
Border Dummy (0.417) (0.422) (0.125) (0.119) 0.392 0.222 0.305*** 0.339*** Same
Language Dummy (0.242) (0.235) (0.0900) (0.0788)
-0.696 -0.304 -0.575*** -0.630*** Colonial Dummy (0.373) (0.321) (0.120) (0.104) Year Fixed Effects Yes Yes Yes Yes Yes Yes Yes
Country Fixed Effects No Yes No Yes Yes No No
Industry Fixed Effects - - - No Yes No Yes
-60.27*** -9.94*** -44.20*** -12.93*** -7.342*** -55.47*** -57.57*** Constant
(0.728) (0.767) (5.038) (0.671) (0.361) (1.580) (1.555)
Observations 22,570 21,801 21,801 4,253,941
4,253,941
2,894,659
2,894,659
Psuedo R2 0.780 0.966 0.797 0.654 0.747 0.507 0.582 Note: Robust standard errors are in parentheses. Standard errors are clustered by origin-destination pairs in aggregated and origin-destination-industry match in the disaggregated. Industries are denominated by 4-digit SITC (Rev. 2). Patents are matched to SITC using weights generated by the ALP-DM approach with hybrid weights and a 2% cutoff. Country fixed effects include origin and destination country fixed effects. Industry fixed effects are at the 2-digit SITC level. Significance denoted by: * p < 0:05, ** p < 0:01, *** p < 0:001
30.

Lybbert and Zolas October 2012
Table 11 PPML regression results for extended gravity model of bilateral patent flows, 2001-2005, by selected Broad Economic Categories (BEC). Shaded variables and results use the ALP-DM concordance with hybrid weights to match patents (IPCs) to SITC categories. Dependent Variable
All Industries Bilateral
Patent Flows (1)
Industrial Supplies Bilateral
Patent Flows (2)
Capital Goods Bilateral
Patent Flows (3)
Consumer Goods Bilateral Patent
Flows (4)
ln Trade 0.148*** 0.133*** 0.200*** 0.209*** (0.0116) (0.0141) (0.0271) (0.0241) ln Destination 1.116*** 1.031*** 1.239*** 1.133*** GDP (0.0293) (0.0329) (0.0549) (0.0383) ln Origin 0.984*** 0.968*** 0.986*** 0.985*** GDP (0.0305) (0.0372) (0.0575) (0.0437) ln Elasticity -0.0236 0.0360 -0.0492 -0.0413 of Substitution (0.0373) (0.0355) (0.0752) (0.0930) ln Distance -0.163*** -0.123** -0.232*** -0.140* (0.0372) (0.0447) (0.0588) (0.0557) Border Dummy -0.174 0.00741 -0.515* -0.360* (0.119) (0.135) (0.205) (0.167) Same Language 0.339*** 0.326*** 0.334* 0.411***
Dummy (0.0788) (0.0899) (0.140) (0.0922) Colonial -0.630*** -0.546*** -0.777*** -0.660*** Dummy (0.104) (0.134) (0.172) (0.131) Year Fixed Effects Yes Yes Yes Yes
Country Fixed Effects No No No No
Industry Fixed Effects Yes Yes Yes Yes
Constant -57.57*** -62.69*** -62.28*** -58.05*** (1.555) (1.826) (2.822) (2.080) Observations 2,894,659 1,488,977 774,233 753,960 Psuedo R2 0.582 0.575 0.639 0.614 Note: Robust standard errors are in parentheses. Standard errors are clustered by origin-destination pairs in aggregated and origin-destination-industry match in the disaggregated. Industries are denominated by 4-digit SITC (Rev. 2). Patents are matched to SITC using weights generated by the ALP-DM approach with hybrid weights and a 2% cutoff. Country fixed effects include origin and destination country fixed effects. Industry fixed effects are at the 2-digit SITC level. Significance denoted by: * p < 0:05, ** p < 0:01, *** p < 0:001
31.