wipo ip facts and figures (2014 edition) · pdf filethe world intellectual property...
TRANSCRIPT

2014
WIPO IP Facts and Figures
Eco
nom
ics
& S
tatis
tics
Ser
ies


2014
WIPO IP Facts and Figures
Eco
nom
ics
& S
tatis
tics
Ser
ies

2
The World Intellectual Property Organization’s (WIPO) IP Facts and
Figures, 2014 provides an overview of intellectual property (IP) activ-
ity using the latest available year of complete statistics. The figures
presented are based on a selection of those reported in WIPO’s more
compressive World Intellectual Property Indicators, 2014. This publica-
tion covers four types of industrial property—patents, utility models,
trademarks and industrial designs—while serving as a quick reference
guide. To this end, it primarily focuses on application data, which is the
most often used measure of IP activity. Trademark application data refer
to class counts—the number of classes specified in applications—in
order to better compare international trademark filing activity across
offices. Similarly, industrial design data refer to design counts—the
number of designs contained in applications. The charts, graphs and
tables enable a comparison of IP activity across offices and through
the use of the WIPO-administered Patent Cooperation Treaty (PCT),
and the Madrid and Hague Systems in 2013.
To assist in understanding IP-related terms, a short glossary is
provided toward the back of this publication.
Readers are welcome to use the information provided in this publica-
tion, but are requested to cite WIPO as the source. By using WIPO’s
statistical data, users agree not to republish or commercially re-sell
WIPO’s statistical datasets. In addition, when employing WIPO’s
statistics data in any written work, users shall cite “WIPO statistics
database” as the source of the data.
Please note that due to the continual updating of statistics, data pro-
vided in this publication may differ from previously published figures
and from data available on WIPO’s web pages. For more in-depth
analysis of WIPO and/or national office IP statistics, please visit the
following links:
IP Statistics
www.wipo.int/ipstats
World Intellectual Property Indicators
www.wipo.int/ipstats/en/wipi/index.html
Contact Information
Economics and Statistics Division
e-mail: [email protected]
Introduction

Table of contents
GLOBAL INTELLECTUAL PROPERTY
APPLICATIONS AND ACTIVE IP RIGHTS 4
A1 Total applications, 2013 4
A2 Resident and non-resident shares, 2013 5
A3 Shares by income group, 2013 6
A4 Shares by region, 2013 8
A5 IP rights in force, 2013 10
PATENTS AND UTILITY MODELS 11
B1 Total patent applications, 2013 12
B2 Patent applications by office, 2013 12
B3 Resident patent applications per GDP for the top origins, 2013 14
B4 Top technology fields by office, 2010-12 15
B5 PCT international applications and top applicants 16
B6 Patent applications by filing route: Direct and PCT System, 2013 17
B7 Utility model applications by office, 2013 18
TRADEMARKS 21
C1 Total trademark application class counts, 2013 22
C2 Application class counts by office, 2013 22
C3 Resident trademark application class count per GDP for selected origins, 2013 24
C4 Top industry sectors by office, 2013 25
C5 Madrid System international applications and top applicants 26
C6 Application class counts by filing route: Direct and Madrid System, 2013 28
INDUSTRIAL DESIGNS 29
D1 Total application design counts, 2013 30
D2 Application design counts by office, 2013 30
D3 Resident application design count per GDP for the top origins, 2013 32
D4 Top industry sectors by office, 2013 33
D5 Hague System international applications and top applicants 34
D6 Application design counts by filing route: Direct and Hague System, 2013 36
ADDITIONAL INFORMATION 37
Statistical tables 37
Glossary 44
Statistical resources 49
PATE
NTS
TRAD
EMAR
KSIN
DUST
RIAL
DES
IGNS
ADDI
TION
AL IN
FORM
ATIO
N

4
SECTION A IP FACTS AND FIGURES
Global intellectual property applications and active IP rights
A1 Total applications, 2013
Note: * refers to class counts, i.e., the number of goods and services classes specified in trademark applications.** refers to design counts, i.e., the number of designs contained in industrial design applications.
Source: WIPO statistics database, October 2014.
Global filing activity for patents and trademarks grew in 2013, repre-
senting the fourth consecutive year that applications have increased
for these two IP rights. For utility models and industrial designs, growth
in filing activity has been uninterrupted for over a decade.
The estimated 2.6 million patent applications filed worldwide in 2013
represents growth of 9 percent on 2012. Rising much faster, utility
model (UM) applications increased by about 18 percent due to sharp
growth in China. Trademark filing activity rose by around 6 percent—
similar to the level witnessed in the previous year. And industrial design
filing activity grew by only 2.5 percent in 2013, considerably less than
the 16 percent recorded in 2012. This lower growth mainly resulted
from a slowdown in the number of industrial design applications filed
in China.
1.2 million: (+2.5%)
7.0 million: (+6.4%)
978,000: (+18.2%)
2.6 million: (+9.0%)
Applications worldwide
Industrial design**
Trademark*
Utility model
Patent

5
SECTION A IP FACTS AND FIGURES
A2 Resident and non-resident shares, 2013
Source: WIPO statistics database, October 2014.
At IP offices worldwide, applications consist of those filed by applicants
domiciled in the jurisdiction represented by the office (residents) and
by applicants whose domicile is located outside that jurisdiction (non-
residents).
The shares of applications filed by residents vary across different
forms of IP. Globally, residents file the majority of applications with their
respective home IP offices, which reflects a preference for seeking
protection within their domestic jurisdiction. However, the resident and
non-resident shares of the totals differ significantly from one office
to another. This is demonstrated in our World Intellectual Property
Indicators: www.wipo.int/ipstats/en/wipi/.
In 2013, an estimated two-thirds of all patent applications were filed
by residents with their domestic office. For the other forms of IP, the
resident shares were about three-quarters for trademark applica-
tions—based on class counts—and over four-fifths for industrial design
applications—based on design counts. At 98%, almost all utility model
applications were filed domestically.
Resident
Non-resident
Resident
Non-resident
Resident
Non-resident
Resident
Non-resident
0
25
50
75
100
Shar
e of
tota
l app
licat
ions
(%)
Patent Trademark Industrial design Utility model

6
SECTION A IP FACTS AND FIGURES
A3 Shares by income group, 2013
High-income: 60.3% Upper middle-income: 36.4%Lower middle-income: 2.9% Low-income: 0.4%
Patent
High-income: 6.3% Upper middle-income: 92.4%Lower middle-income: 1.3% Low-income: 0.02%
Utility model
High-income: 46.4% Upper middle-income: 42.9%Lower middle-income: 9.5% Low-income: 1.1%
Trademark

7
SECTION A IP FACTS AND FIGURES
Source: WIPO statistics database, October 2014.
These pie charts show the distribution of filing activity for each IP right
across four income groups in 2013. IP offices of high-income countries
received the largest proportion of all patent applications (60.3%) and
trademark filing activity (46.4%) worldwide.
Offices of upper middle-income countries accounted for the vast
majority of all utility model applications (92.4%) and over half of all
industrial design filing activity (60.8%), with China alone accounting
for 91% and 53%, respectively.
Lower middle-income countries exhibited low shares of filing activity
for patents (2.9%), utility models (1.3%) and industrial designs (3.6%),
but accounted for a higher share of global trademark application
class counts (9.5%).
High-income: 35.3% Upper middle-income: 60.8%Lower middle-income: 3.6% Low-income: 0.3%
Industrial design

8
SECTION A IP FACTS AND FIGURES
A4 Shares by region, 2013
Africa: 0.6% Asia: 58.4%Europe: 13.5% Latin America and the Caribbean: 2.5%North America: 23.6% Oceania: 1.4%
Patent
Africa: 0.02% Asia: 93.9%Europe: 5.4% Latin America and the Caribbean: 0.5%North America: 0.0% Oceania: 0.2%
Utility model
Africa: 2.4% Asia: 48.2%Europe: 29.3% Latin America and the Caribbean: 8.9%North America: 8.9% Oceania: 2.2%
Trademark

9
SECTION A IP FACTS AND FIGURES
Source: WIPO statistics database, October 2014.
These pie charts present, for each IP right, the distribution of IP filing
activity across the world’s six geographical regions. With shares rang-
ing from almost half of all trademark filing activity to over nine-tenths
of all utility model applications, IP offices in Asia received the highest
numbers of applications for patents, utility models, trademarks and
industrial designs. Specifically, Asian offices received a combined share
of more than half (58.4%) of all patent applications worldwide. This is
in contrast to the lower shares received by offices in North America
(23.6%) and in Europe (13.5%).
Following Asia, Europe shows relatively high shares of filing activity
for both trademarks and industrial designs. This region accounted
for close to a third of all trademark filing activity worldwide and about
one-quarter for industrial designs.
For Africa and the Latin American and Caribbean region, their respec-
tive shares of global trademark filing activity were higher than those
for patents, utility models and industrial designs.
North American offices did not account for any utility model applica-
tions, as they do not offer this IP right.
Africa: 1.2% Asia: 69.4%Europe: 24.0% Latin America and the Caribbean: 1.3%North America: 3.3% Oceania: 0.8%
Industrial design

10
SECTION A IP FACTS AND FIGURES
A5 IP rights in force, 2013
Source: WIPO statistics database, October 2014.
Of the estimated 9.45 million patents in force, 26 percent were in the
United States of America (US), followed by 19 percent in Japan. For
the first time, 2013 saw more than a million patents in force in China.
China accounted for 85 percent of all utility models in force.
In 2013, a total of 26.3 million trademarks were active in about 90
offices worldwide. China accounted for the most trademarks in force,
with 7.2 million. The US (1.8 million) and Japan (1.7 million) had similar
numbers. India, with almost 980,000, also ranks high.
Almost 3 million industrial design registrations were in force, of which
1.2 million were in China alone.
2.98 million: (+5.1%)
26.30 million: (+8.5%)
2.29 million: (+22.9%)
9.45 million: (+8.4%)
IP rights in force
Industrial design
Trademark
Utility model
Patent

Patents and utility models

12
SECTION B IP FACTS AND FIGURES
PATE
NTS B1 Total patent applications, 2013
2.6 million patent applications filed in 2013
Source: WIPO statistics database, October 2014.
B2 Patent applications by office, 2013
Patent applications for the top 10 offices, 2013
Source: WIPO statistics database, October 2014.
In 2013, China accounted for the largest number of patent applica-
tions received by any single IP office—a position it has held since 2011.
Among the top 10 IP offices, China’s IP office (+26.4%) saw the fastest
annual growth in filings received, followed by those of the Republic of
Korea (+8.3%) and the US (+5.3%). Along with China, middle-income
countries Brazil and India are included in the top 10 list.
30,884: (+1.5%)
34,741: (-1.4%)
43,031: (-2.1%)
44,914: (+1.6%)
63,167: (+3.0%)
147,987: (-0.4%)
204,589: (+8.3%)
328,436: (-4.2%)
571,612: (+5.3%)
825,136: (+26.4%)
Applications
Brazil
Canada
India
Russian Federation
Germany
European Patent Office
Republic of Korea
Japan
United States of America
China
China
United States of America
Japan
Republic of Korea
European Patent Office

13
SECTION B IP FACTS AND FIGURES
PATE
NTSPatent applications for selected offices of low- and middle-
income countries, 2013
Source: WIPO statistics database, October 2014.
This chart shows the numbers of patent applications filed at IP offices
of selected low- and middle-income countries in 2013. Where available,
statistics for all offices are reported in the statistical table on page 37.
Half of these offices received more patent applications in 2013 than
in 2012, among which, Morocco (+10%), the Philippines (+9.7%) and
Ukraine (+9.2%) saw the highest growth.
1,144: (+10.0%)
1,266: (+6.4%)
2,032: (-1.4%)
2,057: (-7.0%)
3,285: (+9.7%)
4,661: (-0.1%)
4,772: (-0.9%)
5,412: (+9.2%)
7,205: (+3.8%)
7,295: (-2.0%)
Applications
Morocco
Peru
Colombia
Egypt
Philippines
Turkey
Argentina
Ukraine
Malaysia
South Africa

14
SECTION B IP FACTS AND FIGURES
PATE
NTS B3 Resident patent applications per
GDP for the top origins, 2013
Source: WIPO statistics database and World Bank, October 2014.
Differences in patent activity reflect both the size of the economy and
the level of development. This chart shows the number of resident
patent applications relative to GDP. Worldwide, resident applications
per GDP rose from an average of 1,437 in 2003 to 1,828 in 2013.
China, which ranks first in resident patent applications, comes in third
when its resident applications are adjusted by GDP, below the Republic
of Korea and Japan. The resident applications-to-GDP ratio of the
Republic of Korea is more than twice that of China and exceeds five
times that of the US. Finland, despite having considerably fewer resi-
dent applications than the US, had a similar applications-to-GDP ratio.
1,155
1,405
1,484
1,719
1,770
1,958
2,181
4,506
6,014
9,739
Resident patent applications per 100 billion USD GDP
Netherlands
Denmark
Sweden
Finland
United States of America
Switzerland
Germany
China
Japan
Republic of Korea

15
SECTION B IP FACTS AND FIGURES
PATE
NTSB4 Top technology fields by office, 2010-12
Distribution of published patent applications in the top three technology fields for the top five offices, 2010-12 (% of total)
Source: WIPO statistics database and EPO PATSTAT database, October 2014.
Patent applications span a wide range of technologies. Every patent
application is assigned one or more International Patent Classification
(IPC) symbols. WIPO has developed a concordance table to link these
symbols to their corresponding field(s) of technology, available at:
www.wipo.int/ipstats/en.
At the top five offices covering the 2010–12 period, the technology
field of electrical machinery, apparatus and energy was among the
top three associated with published patent applications. The same is
true for computer technology, except at the European Patent Office.
Where offices differ in terms of top technology fields, Japan showed
higher shares of published applications in the field of optics, whereas
it was semiconductors in the Republic of Korea, and medical technol-
ogy at the European Patent Office and in the US.
0
10
20
30
Shar
e of
pub
licat
ions
(%)
China
Europ
ean P
atent
Office
Japan
Repu
blic o
f Kore
a
United
State
s of A
merica
Office
Electrical machinery, apparatus, energy Digital communicationComputer technology SemiconductorsOptics Medical technology

16
SECTION B IP FACTS AND FIGURES
PATE
NTS B5 PCT international applications and top applicants
The Patent Cooperation Treaty (PCT) System simplifies the process
of multiple national patent filings by reducing the requirement to file a
separate application in each jurisdiction where protection is sought.
Trend in PCT international applications
Source: WIPO statistics database, October 2014.
Around 205,300 PCT applications were filed worldwide in 2013, up
5.1% from 2012. Thanks to the fourth consecutive year of growth, this
was the first time that more than 200,000 PCT applications were filed
in a single year. Two origins contributed most to this growth: the US
with 56 percent of total growth and China accounting for 29 percent.
PCT top applicants, 2013
Source: WIPO statistics database, October 2014.
6.4 11.5 9.4 6.9 2.1
-4.8
5.8 11.0 7.1 5.10
40,000
80,000
120,000
160,000
200,000
PCT
appl
icat
ions
2004 2005 2006 2007 2008 2009 2010 2011 2012 2013
Application year
PCT applications Growth rate (%)
1,423
1,468
1,698
1,809
1,839
1,871
2,050
2,110
2,309
2,839
PCT applications published in 2013
PHILIPS ELECTRONICS(Netherlands)
TELEFONAKTIEBOLAGETERICSSON (Sweden)
TOYOTA JIDOSHA (Japan)
ROBERT BOSCH (Germany)
SHARP (Japan)
INTEL (US)
QUALCOMM (US)
HUAWEI TECHNOLOGIES (China)
ZTE (China)
PANASONIC (Japan)
17
SECTION B IP FACTS AND FIGURES
PATE
NTSIn 2013, Panasonic Corporation of Japan became the top PCT ap-
plicant, with 2,839 applications published. ZTE Corporation of China,
which specializes in telecommunications equipment and network
solutions, moved to second position with 2,309. Both remained in the
top positions despite recording one-year declines in the number of
published applications (-197 for Panasonic and -1,611 for ZTE). Also,
they have shared the top position since 2009, with Panasonic at the
top in 2009, 2010 and 2013, and ZTE in 2011 and 2012.
The list of top 10 PCT applicants includes companies operating in,
among other fields of technology, communications, electronics and
automobiles. Of these applicants, three are based in Japan. China and
the US are home to two companies each, and the remaining three are
located either in Germany, the Netherlands or Sweden.
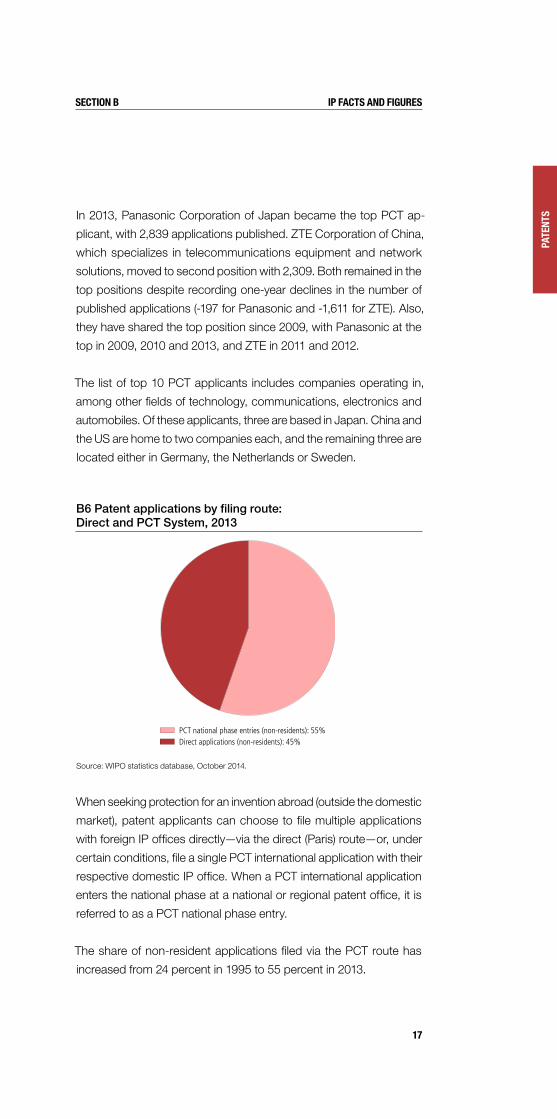
B6 Patent applications by filing route: Direct and PCT System, 2013
Source: WIPO statistics database, October 2014.
When seeking protection for an invention abroad (outside the domestic
market), patent applicants can choose to file multiple applications
with foreign IP offices directly—via the direct (Paris) route—or, under
certain conditions, file a single PCT international application with their
respective domestic IP office. When a PCT international application
enters the national phase at a national or regional patent office, it is
referred to as a PCT national phase entry.
The share of non-resident applications filed via the PCT route has
increased from 24 percent in 1995 to 55 percent in 2013.
PCT national phase entries (non-residents): 55%Direct applications (non-residents): 45%

18
SECTION B IP FACTS AND FIGURES
PATE
NTS B7 Utility model applications by office, 2013
Utility model applications for the top 10 offices, 2013
Source: WIPO statistics database, October 2014.
The IP office of China received by far the largest number of utility
model applications in 2013, accounting for nearly nine-tenths of the
world total. Germany, the Russian Federation, the Republic of Korea
and Ukraine each received between 10,000 and 15,500 applications.
Among the top offices, China’s (+20.5%) continued to witness the
largest annual increase in utility model applications received. This
is in contrast to the double-digit decrease in applications filed in the
Republic of Korea (-11.7%).
2,648: (+4.3%)
2,678: (-2.9%)
3,032: (+1.2%)
3,553: (-6.2%)
7,622: (-6.0%)
10,181: (-0.4%)
10,968: (-11.7%)
14,358: (+2.1%)
15,470: (-0.2%)
892,362: (+20.5%)
Applications
Spain
Italy
Brazil
Turkey
Japan
Ukraine
Republic of Korea
Russian Federation
Germany
China

19
SECTION B IP FACTS AND FIGURES
PATE
NTSUtility model applications for selected offices of low- and
middle-income countries, 2013
145: (+66.7%)
184: (+5.7%)
253: (-3.1%)
261: (-5.8%)
273: (+11.4%)
372: (+77.1%)
714: (+20.4%)
775: (+8.4%)
1,146: (-3.5%)
1,609: (+8.3%)
Applications
Malaysia
Argentina
Hungary
Colombia
Viet Nam
Bulgaria
Mexico
Philippines
Belarus
Thailand
Source: WIPO statistics database, October 2014.
This chart shows the numbers of utility model applications received
by IP offices of selected low- and middle-income countries in 2013.
Where available, utility model applications for all offices are reported
in the statistical table on page 37.


Trademarks

22
SECTION C IP FACTS AND FIGURES
TRAD
EMAR
KS
C1 Total trademark application class counts, 2013
Filing activity in 2013 measured in application class counts
Note: OHIM is the European Union’s Office for Harmonization in the Internal Market.
Source: WIPO statistics database, October 2014.
C2 Application class counts by office, 2013
Application class counts for the top 10 offices, 2013
Note: OHIM is the European Union’s Office for Harmonization in the Internal Market.
Source: WIPO statistics database, October 2014.
In 2013, 60 percent of all trademark filing activity worldwide occurred
at the top 10 IP offices combined. Accounting for over a quarter of all
trademark filing activity worldwide, China’s 1.88 million class count
was followed by around 486,000 in the US—the countries with the
top two offices since the early 2000s. But since 2004, China’s class
count has grown from nearly twice that of the US to almost four times
in 2013. These two offices were followed by the European Union’s
Office for Harmonization in the Internal Market (OHIM) and those of
France and the Russian Federation.
193,867: (+0.6%)
202,444: (+6.1%)
203,916: (+10.2%)
207,065: (-5.3%)
223,816: (-2.5%)
237,055: (+4.9%)
299,973: (+10.3%)
324,749: (+3.6%)
486,128: (+13.4%)
1,880,000: (+13.8%)
Application class count
Germany
India
Republic of Korea
Japan
Turkey
Russian Federation
France
OHIM
United States of America
China
China
United States of AmericaOHIMFranceRussian Federation

23
SECTION C IP FACTS AND FIGURES
TRAD
EMAR
KS
Among the top 10 IP offices, China (+13.8%) and the US (+13.4%)
reported the highest annual growth. In contrast, the offices of Japan
(-5.3%) and Turkey (-2.5%) had lower application class counts in 2013
than in 2012.
Application class counts for selected offices of low- and middle-income countries, 2013
Source: WIPO statistics database, October 2014.
Many offices in low- and middle-income countries receive consider-
ably higher numbers of trademark applications compared to other
forms of IP, showing the emphasis placed on trademark rights in the
jurisdictions they represent.
This chart shows the total number of classes specified in trademark
applications received by IP offices of selected low- and middle-income
countries in 2013. Where available, trademark application class counts
for all offices are reported in the statistical table on page 37.
6,510: (-3.6%)
7,608: (+9.7%)
8,825: (-3.2%)
11,581: (+1.3%)
13,581: (-0.8%)
19,332: (+12.5%)
26,296: (+4.8%)
29,484: (+7.7%)
36,070: (+4.2%)
46,097: (+2.5%)
Application class count
Jordan
Honduras
Sri Lanka
Bangladesh
Republic of Moldova
Nigeria
Kazakhstan
Romania
South Africa
Thailand

24
SECTION C IP FACTS AND FIGURES
TRAD
EMAR
KS
C3 Resident trademark application class count per GDP for selected origins, 2013
Source: WIPO statistics database and World Bank, October 2014.
When resident trademark applications are viewed as class counts and
adjusted by GDP, countries with a lower number of classes specified
in resident applications (such as Finland and New Zealand) may rank
higher than some countries that otherwise show higher class counts
(Spain and the United Kingdom). China (11,081), followed by New
Zealand (9,852) and the Republic of Korea (9,622) exhibited among
the highest resident application class count-to-GDP ratios in 2013.
Australia and Finland each had a ratio of about 7,000 despite the fact
that Australian resident filing activity was close to seven times that of
Finnish residents.
5,257
5,477
6,022
6,902
6,995
7,058
8,341
9,622
9,852
11,081
Resident trademark application class count per 100 billion USD GDP
Poland
United Kingdom
Spain
Finland
Australia
Germany
Switzerland
Republic of Korea
New Zealand
China

25
SECTION C IP FACTS AND FIGURES
TRAD
EMAR
KS
C4 Top industry sectors by office, 2013
Distribution of application class counts in the top three sectors for the top five offices, 2013
Note: OHIM is the European Union’s Office for Harmonization in the Internal Market.
Source: WIPO statistics database, October 2014.
Using the Nice Classification, trademark applications can be attributed
to ten industry sectors. This chart shows the top three industry sectors
in which applicants filed for trademark protection at the five offices
reporting the highest trademark filing activity in 2013. For all of these
offices, research & technology is among the top three sectors that
attracted the highest volumes of trademark applications.
In 2013, the top industry sectors in France and the US included busi-
ness, and leisure & education. This differs from China and the Russian
Federation where more focus was on agriculture and clothing.
Three of the ten industry sectors alone accounted for about half of
all trademark filing activity at the offices of China, France and the US.
0
10
20
30
40
50
Shar
e of
app
licat
ion
class
cou
nt (%
)
China
Franc
eOHIM
Russi
an Fe
derat
ion
United
State
s of A
merica
Office
Agriculture Business ClothingLeisure & Education Research & Technology

26
SECTION C IP FACTS AND FIGURES
TRAD
EMAR
KS
C5 Madrid System international applications and top applicants
The Madrid System makes it possible for an applicant to register a
trademark in a large number of countries by filing a single application
at their national or regional IP office that is a member of the System.
The Madrid System simplifies the process of multinational trademark
registration by reducing the requirement to file separate applications
at each office.
Trend in Madrid international applications
Source: WIPO statistics database, October 2014.
After witnessing a decrease in 2009, Madrid System applications
resumed their upward trend in 2010, and in 2013 completed a fourth
year of continued growth when they reached a new record of 46,829.
In fact, over the last decade, their numbers have increased for all but
one year that coincided with the economic downturn in 2009. This
prevailing growth is partly due to factors such as increased usage of
the Madrid System and its expanded membership, coupled with a
general upward trend in trademark application volumes worldwide.
23.4 14.0 8.7 9.5 5.3
-16.4
12.8 6.5 4.1 6.4
0
9,000
18,000
27,000
36,000
45,000
Mad
rid a
pplic
atio
ns
2004 2005 2006 2007 2008 2009 2010 2011 2012 2013
Application year
Madrid applications Growth rate (%)

27
SECTION C IP FACTS AND FIGURES
TRAD
EMAR
KS
Madrid System top applicants, 2013
Source: WIPO statistics database, October 2014.
For the third year in row, Novartis of Switzerland, with 228 international
applications, was the largest user of the Madrid System. Another
pharmaceutical company, Zentiva Group of the Czech Republic, with
114 international applications, ranked second, moving up from 11th
position in 2012. Food company Boquoi Handels of Germany, which
filed 98 international applications, appeared for the first time among
the top-ranked applicants, rising to sixth position.
79
86
90
91
98
107
109
111
114
228
Madrid international applications
HENKEL (Germany)
PHILIPS (Netherlands)
ACTAVIS GROUP (Iceland)
NESTLÉ (Switzerland)
BOQUOI HANDELS (Germany)
BOEHRINGER INGELHEIM (Germany)
L'ORÉAL (France)
EGIS GYÓGYSZERGYÁR (Hungary)
ZENTIVA GROUP (Czech Republic)
NOVARTIS (Switzerland)

28
SECTION C IP FACTS AND FIGURES
TRAD
EMAR
KS
C6 Application class counts by filing route: Direct and Madrid System, 2013
Source: WIPO statistics database, October 2014.
When seeking protection for a trademark abroad (outside the domestic
market), applicants can choose to file separate applications directly
with each individual foreign office—via the direct (Paris) route—or,
under certain conditions, file a single Madrid international application
with their respective domestic office via the Madrid System. Once
a Madrid international registration is issued, holders can use this to
designate any of the current 92 members of the System simultaneously
to seek protection for their trademarks. These designations have the
same effect as an application filed directly with an office of a Madrid
member country.
In 2013, IP offices of all Madrid System member countries combined
received 59 percent of their trademark filing activity from abroad in
the form of Madrid designations as opposed to 41 percent attributed
to the direct filing route.
Madrid non-resident: 59%Direct non-resident: 41%

Industrial designs

30
SECTION D IP FACTS AND FIGURES
INDU
STRI
AL D
ESIG
NS
D1 Total application design counts, 2013
Filing activity in 2013 measured in application design counts
Note: OHIM is the European Union’s Office for Harmonization in the Internal Market.
Source: WIPO statistics database, October 2014.
D2 Application design counts by office, 2013
Application design counts for the top 10 offices, 2013
Note: OHIM is the European Union’s Office for Harmonization in the Internal Market.
Source: WIPO statistics database, October 2014.
In 2013, about 86 percent of all industrial design filing activity world-
wide occurred at the top 10 offices combined. The IP office of China
accounted for over half (53%) of the total, followed by the European
Union’s Office for Harmonization in the Internal Market (8%) and the
Republic of Korea (6%).
Except for France (-9.1%) and Japan (-3.9%), the remainder of these
top offices saw increases in filing activity in 2013 compared to 2012.
14,417: (-9.1%)
18,445: (+3.2%)
31,125: (-3.9%)
31,545: (+2.0%)
36,034: (+9.9%)
51,097: (+10.3%)
57,251: (+3.0%)
70,054: (+7.0%)
97,013: (+5.3%)
659,563: (+0.3%)
Application design count
France
Spain
Japan
Italy
United States of America
Turkey
Germany
Republic of Korea
OHIM
China
China
OHIMRepublic of KoreaGermanyTurkey

31
SECTION D IP FACTS AND FIGURES
INDU
STRI
AL D
ESIG
NS
Application design counts for selected offices of low- and middle-income countries, 2013
Source: WIPO statistics database, October 2014.
This chart shows the total numbers of designs contained in applica-
tions filed at IP offices of selected low- and middle-income countries
in 2013. Where available, application design counts are reported for
all offices in the statistical table on page 37.
2,053: (-1.4%)
2,237: (-5.3%)
2,429: (+15.3%)
2,565: (+17.0%)
3,802: (+9.2%)
4,011: (-3.0%)
4,842: (+28.8%)
5,061: (+10.1%)
6,847: (+4.3%)
8,497: (-0.6%)
Application design count
Malaysia
South Africa
Viet Nam
Republic of Moldova
Thailand
Mexico
Iran (Islamic Republic of)
Morocco
Brazil
India

32
SECTION D IP FACTS AND FIGURES
INDU
STRI
AL D
ESIG
NS
D3 Resident application design count per GDP for the top origins, 2013
Source: WIPO statistics database and World Bank, October 2014.
China had the highest resident design count per GDP, followed by
the Republic of Korea. They were the only East Asian countries that
ranked among the top origins. Most of the remaining were in Europe,
such as Italy, Germany and Ukraine. Neither Japan nor the US was
among the top origins.
1,280
1,490
1,497
1,636
1,964
1,999
2,090
3,123
3,987
4,119
Resident application design count per 100 billion USD GDP
Morocco
Spain
Bulgaria
Luxembourg
Germany
Italy
Ukraine
Turkey
Republic of Korea
China

33
SECTION D IP FACTS AND FIGURES
INDU
STRI
AL D
ESIG
NS
D4 Top industry sectors by office, 2013
Distribution of application design counts in the top three sectors for selected offices, 2013
Note: OHIM is the European Union’s Office for Harmonization in the Internal Market.
Source: WIPO statistics database, October 2014.
Grouping the 32 Locarno classes into 12 industry sectors shows
that designs in applications filed at several of the top offices are
concentrated in a few sectors. For all of these offices, the textiles and
accessories sector is among the top three that attracted the highest
volumes of industrial design filing activity.
In Germany and Turkey, applications for design protection were
concentrated among the advertising, furniture and household goods,
and textiles and accessories sectors. The combined shares of these
three sectors accounted for over half of all design filing activity in both
countries. Applications related to tools and machines accounted for
higher shares of the totals filed at the offices of Australia and India
than at the other three offices.
0
20
40
60
80
Shar
e of
app
licat
ion
desig
n co
unt (
%)
Austral
ia
German
yInd
iaOHIM
Turkey
Office
Advertising Furniture and household goodsICT and audiovisual Textiles and accessoriesTools and machines Transport

34
SECTION D IP FACTS AND FIGURES
INDU
STRI
AL D
ESIG
NS
D5 Hague System international applications and top applicants
The Hague system makes it possible for an applicant to register up to
100 industrial designs in multiple jurisdictions by filing a single applica-
tion with the International Bureau of WIPO. It simplifies multinational
registration by reducing the requirement to file separate applications
with each IP office of a Hague member country.
Trend in Hague international applications
Source: WIPO statistics database, October 2014.
International industrial design applications filed under the Hague
System (Hague international applications) increased to 2,990 in 2013,
representing growth of 14.8% on 2012. This marks the seventh straight
year of growth in international applications. Also, the 2013 growth rate
is considerably higher than the growth rates of the preceding two years.
-34.9 -13.6 -6.8
5.2 46.5 4.8 32.6 5.7 3.3 14.80
500
1,000
1,500
2,000
2,500
3,000
Hag
ue a
pplic
atio
ns
2004 2005 2006 2007 2008 2009 2010 2011 2012 2013
Application year
Hague applications Growth rate (%)

35
SECTION D IP FACTS AND FIGURES
INDU
STRI
AL D
ESIG
NS
Hague System top applicants, 2013
Source: WIPO statistics database, October 2014.
For the second consecutive year, Swatch of Switzerland (113 applica-
tions) filed the largest number of Hague international applications; it
was followed by Philips Electronics of the Netherlands (82), the Procter
& Gamble Company of the US (76), and Germany’s Daimler (52) and
Volkswagen (51).
The list of top Hague applicants ranges from companies that produce,
among other things, household and personal hygiene products to those
that manufacture watches or vehicles, or that produce or distribute
foodstuffs. Four of these top ten applicants are based in Germany.
Two of the top 10 applicants are from the US, which is not a member
of the Hague System. It is possible for companies from non-member
countries to make use of the Hague System if they have an industrial
or commercial establishment in a Hague member country/region.
27
29
30
38
38
51
52
76
82
113
Hague international applications
OMEGA (Switzerland)
LIDL (Germany)
NESTLÉ (Switzerland)
KÄRCHER (Germany)
GILLETTE (US)
VOLKSWAGEN (Germany)
DAIMLER (Germany)
PROCTER & GAMBLE (US)
PHILIPS (Netherlands)
SWATCH (Switzerland)

36
SECTION D IP FACTS AND FIGURES
INDU
STRI
AL D
ESIG
NS
D6 Application design counts by filing route: Direct and Hague System, 2013
Source: WIPO statistics database, October 2014.
When seeking protection for an industrial design abroad (outside the
domestic market), applicants can choose to file individual applications
directly with foreign IP offices—via the direct (Paris) route—or, under
certain conditions, file a single application via the Hague System. Once
a Hague international registration is issued, holders can use this to
designate any of the current 62 members of the System simultane-
ously to seek protection for their designs. These designations have
the same effect as applications filed directly with an office of a Hague
member country.
In 2013, offices of Hague System member countries combined re-
ceived 57 percent of their industrial design filing activity from abroad in
the form of Hague designations as opposed to 43 percent attributed
to the direct filing route.
Hague non-resident: 57%Direct non-resident: 43%

37
IP FACTS AND FIGURES
ADDI
TION
AL IN
FORM
ATIO
N
Applications by office, 2013
IP Office (a)
Applications
Patent Utility modelTrademark
class countIndustrial
design count
Afghanistan .. .. .. ..
African Intellectual Property Organization (c) 552 8 7,743 899
African Regional Intellectual Property Organization 692 7 593 217
Albania 4 .. 9,381 1,069
Algeria (d,f) 840 .. 12,122 1,067
Andorra .. .. .. ..
Angola .. .. .. ..
Antigua and Barbuda (e,f) 7 2,029 1
Argentina 4,772 184 87,921 1,465
Armenia 131 41 10,698 977
Aruba .. .. .. ..
Australia 29,717 1,676 115,413 6,912
Austria 2,406 763 27,670 2,886
Azerbaijan 156 11 14,822 1,058
Bahamas .. .. .. ..
Bahrain 170 .. 14,577 58
Bangladesh 303 .. 11,581 1,232
Barbados 42 .. 1,180 5
Belarus 1,634 1,146 35,195 617
Belgium (h) 876 .. .. ..
Belize (g) 32 6 .. 650
Benelux Office for Intellectual Property .. .. 70,360 1,526
Benin (g) .. .. .. 16
Bermuda .. .. .. ..
Bhutan 7 .. 2,256 2
Bolivia (Plurinational State of) .. .. .. ..
Bonaire, Sint Eustatius and Saba (e) .. .. 1,496 ..
Bosnia and Herzegovina 29 .. 11,891 1,441
Botswana (c,e) 9 3 2,429 148
Brazil 30,884 3,032 163,422 6,847
Brunei Darussalam (d) 11 .. 85 11
Bulgaria 297 372 18,251 1,082
Burkina Faso .. .. .. ..
Burundi .. .. .. ..
Cabo Verde .. .. .. ..
Cambodia 75 6 5,854 30
Cameroon .. .. .. ..
Canada 34,741 .. 142,960 5,346
Central African Republic .. .. .. ..
Chad .. .. .. ..
Chile 3,072 104 42,961 762
China 825,136 892,362 1,880,000 659,563
China, Hong Kong SAR 13,916 552 69,139 4,584
China, Macao SAR 60 21 10,084 141
Colombia 2,032 261 36,562 766
Comoros .. .. .. ..
Congo .. .. .. ..
Cook Islands .. .. .. ..
Costa Rica (d) 603 10 14,155 82
Côte d'Ivoire (b,g) 27 .. .. 91
Croatia 253 81 17,862 2,507
Cuba 170 3 5,460 9
Curaçao .. .. 2,690 ..
Cyprus 3 .. 3,289 43
Czech Republic 1,081 1,731 37,705 1,309
Statistical tables

38
IP FACTS AND FIGURES
ADDI
TION
AL IN
FORM
ATIO
N
IP Office (a)
Applications
Patent Utility modelTrademark
class countIndustrial
design count
Democratic People's Republic of Korea (b,e,g) 8,381 .. 2,755 190
Democratic Republic of the Congo .. .. .. ..
Denmark 1,534 197 12,640 434
Djibouti 3 .. 358 5
Dominica .. .. .. ..
Dominican Republic 267 8 9,413 43
Ecuador .. .. .. ..
Egypt (e,g) 2,057 .. 10,906 931
El Salvador .. .. .. ..
Equatorial Guinea .. .. .. ..
Eritrea .. .. .. ..
Estonia 42 101 6,261 182
Ethiopia .. .. .. ..
Eurasian Patent Organization 3,435 .. .. ..
European Patent Office 147,987 .. .. ..
Fiji .. .. .. ..
Finland 1,737 480 14,704 507
France 16,886 480 299,973 14,417
Gabon (g) .. .. .. 11
Gambia .. 3 406 ..
Georgia 333 64 11,089 1,170
Germany 63,167 15,470 193,867 57,251
Ghana (e,g) .. .. 3,607 94
Greece (e) 717 27 3,642 1,623
Grenada .. .. .. ..
Guatemala 323 26 .. 335
Guinea .. .. .. ..
Guinea-Bissau .. .. 19 9
Guyana .. .. .. ..
Haiti .. .. .. ..
Holy See .. .. .. ..
Honduras 217 10 7,608 37
Hungary 708 253 13,741 1,324
Iceland 46 .. 8,920 358
India 43,031 .. 202,444 8,497
Indonesia 7,450 349 67,210 4,259
Iran (Islamic Republic of) (e) 11,643 .. 7,230 4,842
Iraq .. .. .. ..
Ireland 390 .. 7,548 ..
Israel 6,185 .. 19,225 ..
Italy 9,212 2,678 92,781 31,545
Jamaica 119 .. 4,245 175
Japan 328,436 7,622 207,065 31,125
Jordan 392 .. 6,510 70
Kazakhstan 2,202 212 26,296 357
Kenya (e) 241 78 4,706 86
Kiribati 18 .. .. 10
Kuwait .. .. .. ..
Kyrgyzstan 114 9 8,552 885
Lao People's Democratic Republic .. .. .. ..
Latvia 233 .. 7,144 260
Lebanon (g) .. .. .. 108
Lesotho (e) .. .. 1,876 ..
Liberia (e) .. .. 2,253 ..
Libya .. .. .. ..
Liechtenstein (g) .. .. 8,154 1,706

39
IP FACTS AND FIGURES
ADDI
TION
AL IN
FORM
ATIO
N
IP Office (a)
Applications
Patent Utility modelTrademark
class countIndustrial
design count
Lithuania 137 .. 8,327 488
Luxembourg (h) 169 .. .. ..
Madagascar 51 .. 4,991 169
Malawi .. .. .. ..
Malaysia 7,205 145 32,225 2,053
Maldives .. .. .. ..
Mali (b,g) .. .. .. 2
Malta 17 .. 948 7
Marshall Islands .. .. .. ..
Mauritania .. .. .. ..
Mauritius 20 .. 1,758 15
Mexico 15,444 714 109,806 4,011
Micronesia (Federated States of) .. .. .. ..
Monaco 5 .. 9,709 1,791
Mongolia (e,g) .. .. 4,716 884
Montenegro (e) 23 .. 9,545 1,420
Morocco 1,144 .. 26,968 5,061
Mozambique (e) .. .. 3,121 ..
Myanmar (d) .. .. 8,490 ..
Namibia (e,g) .. .. 2,686 169
Nauru .. .. .. ..
Nepal 30 .. 3,832 56
Netherlands (h) 2,764 .. .. ..
New Zealand 6,781 .. 36,397 2,912
Nicaragua 127 2 7,946 15
Niger (g) .. .. .. 5
Nigeria 919 .. 19,332 953
Norway (g) 1,749 .. 39,522 3,152
Office for Harmonization in the Internal Market .. .. 324,749 97,013
Oman (e,g) .. .. 5,995 1,139
Pakistan 934 .. 20,822 457
Palau .. .. .. ..
Panama 87 9 12,304 108
Papua New Guinea 79 .. 1,019 35
Paraguay .. .. .. ..
Patent Office of the Cooperation Council for the Arab States of the Gulf 2,991 .. .. ..
Peru (d) 1,266 140 29,553 499
Philippines 3,285 775 35,622 1,376
Poland (g) 4,411 1,053 46,276 63
Portugal 669 120 28,009 1,939
Qatar 332 .. 7,979 ..
Republic of Korea 204,589 10,968 203,916 70,054
Republic of Moldova 96 213 13,581 2,565
Romania 1,046 67 29,484 1,735
Russian Federation 44,914 14,358 237,055 6,935
Rwanda (b,c,d,f) 70 12 517 78
Saint Kitts and Nevis .. .. .. ..
Saint Lucia .. .. .. ..
Saint Vincent and the Grenadines 8 .. 501 1
Samoa (d,f) .. .. 228 3
San Marino (e) .. .. 3,199 ..
Sao Tome and Principe (f) 8 .. 1,628 74
Saudi Arabia 931 .. .. 692
Senegal (g) .. .. .. 37
Serbia 221 77 18,981 1,439
Seychelles .. .. 106 ..

40
IP FACTS AND FIGURES
ADDI
TION
AL IN
FORM
ATIO
N
IP Office (a)
Applications
Patent Utility modelTrademark
class countIndustrial
design count
Sierra Leone (e) .. .. 2,096 ..
Singapore 9,722 .. 40,906 4,320
Sint Maarten (Dutch Part) .. .. 2,294 ..
Slovakia 210 429 16,345 492
Slovenia (e,g) .. .. 3,980 670
Solomon Islands .. .. .. ..
Somalia .. .. .. ..
South Africa 7,295 .. 36,070 2,237
South Sudan .. .. .. ..
Spain 3,244 2,648 71,987 18,445
Sri Lanka 516 .. 8,825 359
Sudan (b,d,f) 157 .. 4,478 98
Suriname (g) .. .. 1,476 39
Swaziland (b) 3 .. 2,590 ..
Sweden 2,495 .. 21,336 724
Switzerland 2,156 .. 83,019 12,558
Syrian Arab Republic (e,g) .. .. 4,269 133
T F Y R of Macedonia (e) 46 .. 9,476 1,728
Tajikistan 4 69 7,427 803
Thailand 7,404 1,609 46,097 3,802
Timor-Leste .. .. .. ..
Togo .. .. .. ..
Tonga .. .. .. ..
Trinidad and Tobago .. .. .. ..
Tunisia (e) 549 .. 390 1,455
Turkey 4,661 3,553 223,816 51,097
Turkmenistan (e) .. .. 6,237 ..
Tuvalu .. .. .. ..
Uganda 14 .. 2,079 ..
Ukraine 5,412 10,181 67,053 11,960
United Arab Emirates 1,426 .. 18,747 540
United Kingdom 22,938 .. 104,701 ..
United Republic of Tanzania .. .. .. ..
United States of America 571,612 .. 486,128 36,034
700 55 10,792 93
Uzbekistan 557 173 13,246 311
Vanuatu .. .. .. ..
Venezuela (Bolivarian Republic of) .. .. .. ..
Viet Nam 3,995 273 59,518 2,429
Yemen 80 .. 3,797 22
Zambia (b,d,f) 38 .. 4,090 12
Zimbabwe .. .. .. ..
Others/Unknown 7,898 210 167,048 14,670
Total 2,567,900 978,300 7,045,140 1,242,701
a. Not all listed countries/territories/intergovernmental organizations have an IP office. Also, some offices do not receive applications for some IP rights. b. 2012 data are for patent applications. c. 2012 data are for utility model applications. d. 2012 data are for trademark application class count. e. Only Madrid designation data are available; therefore, total application class count may be incomplete. f. 2012 data are for application design count. g. Only Hague designation data are available; therefore, total application design count may be incomplete.h. This country does not have a national trademark or industrial design office. All applications for trademark and design protection are filed at the Benelux Office for Intellectual Property or the Office for Harmonization in the Internal Market of the European Union.
.. indicates either zero, not available or not applicable. Source: WIPO statistics database, October 2014.

41
IP FACTS AND FIGURES
ADDI
TION
AL IN
FORM
ATIO
N
International applications by origin via the PCT, Madrid and Hague Systems, 2013
Origin (a)
International applications
PCT Madrid Hague
Albania 1 3 1
Algeria 8 4 ..
Andorra 4 .. ..
Angola 3 .. ..
Argentina 26 2 ..
Armenia 8 40 ..
Australia 1,604 1,263 2
Austria 1,262 1,120 38
Azerbaijan 6 7 ..
Bahamas 10 3 ..
Bahrain 2 .. ..
Bangladesh 3 .. ..
Barbados 149 4 ..
Belarus 18 323 ..
Belgium 1,103 760 39
Belize 3 4 ..
Benin .. .. 2
Bolivia (Plurinational State of) 1 .. ..
Bosnia and Herzegovina 6 13 1
Brazil 657 .. ..
Bulgaria 58 355 22
Burundi 1 .. ..
Cameroon 1 .. ..
Canada 2,845 62 ..
Chile 142 1 ..
China 21,514 2,359 18
China, Macao SAR .. 1 ..
Colombia 82 23 ..
Costa Rica 11 .. ..
Côte d’Ivoire 2 .. ..
Croatia 44 180 17
Cuba 9 2 ..
Curaçao .. 3 ..
Cyprus 34 143 2
Czech Republic 197 479 7
Democratic People’s Republic of Korea 1 .. ..
Denmark 1,264 586 18
Dominica .. 4 ..
Dominican Republic 7 1 ..
Ecuador 17 .. ..
Egypt 50 27 ..
Eritrea 1 .. ..
Estonia 21 82 1
Fiji .. 2 ..
Finland 2,095 431 30
France 7,905 4,239 293
Georgia 10 60 ..
Germany 17,913 6,822 643
Ghana 2 .. ..
Greece 111 107 4
Guatemala 2 .. ..
Hungary 163 283 10
Iceland 43 116 6
India 1,320 41 1
Indonesia 15 3 2

42
IP FACTS AND FIGURES
ADDI
TION
AL IN
FORM
ATIO
N
Origin (a)
International applications
PCT Madrid Hague
Iran (Islamic Republic of) 4 39 ..
Ireland 432 172 3
Israel 1,607 177 2
Italy 2,868 2,786 419
Japan 43,771 1,921 ..
Jordan 1 .. ..
Kazakhstan 18 77 ..
Kenya 7 2 1
Kuwait .. 2 ..
Kyrgyzstan .. 4 ..
Lao People’s Democratic Republic 2 .. ..
Latvia 25 124 4
Lebanon 5 6 ..
Liechtenstein 190 96 22
Lithuania 40 108 5
Luxembourg 372 355 35
Madagascar 1 4 ..
Malaysia 308 7 ..
Malta 73 60 1
Mauritius 6 2 ..
Mexico 233 46 ..
Monaco 17 41 3
Mongolia .. 2 ..
Montenegro 2 6 2
Morocco 54 44 2
Namibia 4 .. ..
Netherlands 4,188 1,461 144
New Zealand 320 320 ..
Nicaragua 2 .. ..
Nigeria 7 2 ..
Norway 708 318 70
Oman 3 .. ..
Pakistan 1 .. ..
Panama 12 13 ..
Peru 13 1 ..
Philippines 32 43 ..
Poland 332 371 26
Portugal 144 267 9
Qatar 28 2 ..
Republic of Korea 12,381 510 1
Republic of Moldova 1 49 ..
Romania 25 103 4
Russian Federation 1,191 1,126 7
Rwanda 1 .. ..
Saint Kitts and Nevis 2 1 ..
Saint Vincent and the Grenadines 2 2 ..
Samoa 3 .. ..
San Marino 4 10 ..
Saudi Arabia 187 .. ..
Senegal 1 .. 1
Serbia 26 151 11
Seychelles 10 1 ..
Singapore 838 221 10
Slovakia 41 146 5
Slovenia 125 170 17
South Africa 351 .. ..
South Sudan .. 1 ..
Spain 1,705 1,247 29

43
IP FACTS AND FIGURES
ADDI
TION
AL IN
FORM
ATIO
N
Origin (a)
International applications
PCT Madrid Hague
Sri Lanka 14 1 ..
Suriname .. 1 ..
Sweden 3,945 699 49
Switzerland 4,371 3,070 662
Syrian Arab Republic 1 .. ..
T F Y R of Macedonia 1 30 1
Thailand 69 8 ..
Tonga 1 .. ..
Tunisia 2 .. ..
Turkey 805 1,213 70
Uganda 3 .. ..
Ukraine 152 490 6
United Arab Emirates 57 10 ..
United Kingdom 4,847 2,462 40
United States of America 57,434 6,043 147
Uruguay 4 1 ..
Uzbekistan 2 4 ..
Venezuela (Bolivarian Republic of) 1 .. ..
Viet Nam 18 76 1
Yemen 1 .. ..
Zimbabwe 3 .. ..
Others/Unknown 59 146 24
Total 205,268 46,829 2,990
a. Origin is defined as the country/territory of the stated address of the applicant. Only origins with at least one international application filed in 2013 are presented.
.. indicates zero or not applicable.
Source: WIPO statistics database, October 2014.

44
IP FACTS AND FIGURES
ADDI
TION
AL IN
FORM
ATIO
N
Class count: The number of classes specified in a trademark ap-
plication or registration. In the international trademark system and
at certain offices, an applicant can file a trademark application that
specifies one or more of the 45 goods and services classes of the
Nice Classification. Offices use a single- or multi-class filing system.
For example, the offices of Japan, the Republic of Korea and the
United States of America (US) as well as many European IP offices
have multi-class filing systems. The offices of Brazil, China and Mexico
follow a single-class filing system, requiring a separate application for
each class in which applicants seek trademark protection. To capture
the differences in application numbers across offices, it is useful to
compare their respective application and registration class counts.
Design count: The number of designs contained in an industrial design
application or registration. Under the Hague System for International
Registration of Industrial Designs, it is possible for an applicant to obtain
protection for up to 100 industrial designs for products belonging to one
and the same class by filing a single application. Some IP offices allow
applications to contain more than one design for the same product or
within the same class, while other offices allow only one design per
application. In order to capture the differences in application numbers
across offices, it is useful to compare their respective application and
registration design counts.
Direct route: Applications for IP protection filed directly with the
national office of, or acting for, the relevant state or jurisdiction. Direct
route is also called the national route or Paris route.
Hague international application: An application for the international
registration of an industrial design filed under the WIPO-administered
Hague System.
Hague System: The abbreviated form of the Hague System for the
International Registration of Industrial Designs. The Hague System
makes it possible for an applicant to register up to 100 industrial designs
in multiple jurisdictions by filing a single application with the International
Bureau of WIPO. It simplifies the process of multinational registration
by reducing the requirement to file separate applications with each IP
office. The System also simplifies the subsequent management of the
industrial design, since it is possible to record changes or to renew
the registration through a single procedural step.
Glossary

45
IP FACTS AND FIGURES
ADDI
TION
AL IN
FORM
ATIO
N
Industrial design: Industrial designs are applied to a wide variety of
industrial products and handicrafts. They refer to the ornamental or
aesthetic aspects of a useful article, including compositions of lines or
colors or any three-dimensional forms that give a special appearance
to a product or handicraft. The holder of a registered industrial design
has exclusive rights against unauthorized copying or imitation of the
design by third parties. Industrial design registrations are valid for a
limited period. The term of protection is usually 15 years for most juris-
dictions. However, differences in legislation do exist, notably in China
(which provides for a 10-year term from the application date) and the
US (which provides for a 14-year term from the date of registration).
In force: Refers to IP rights that are currently valid. To remain in force,
IP protection must be maintained, primarily by paying the required fee
to the IP office of the state or jurisdiction providing protection.
Intellectual property (IP): Creations of the mind: inventions, literary
and artistic works, symbols, names, images and designs used in com-
merce. IP is divided into two categories: industrial property—which
includes patents, utility models, trademarks, industrial designs and
geographical indications of source—and copyright—which includes
literary and artistic works such as novels, poems, plays, films, musi-
cal works, artistic works (such as drawings, paintings, photographs
and sculptures) and architectural designs. Rights related to copyright
include those of performing artists in their performances, those of
producers of phonograms in their recordings and those of broadcast-
ers in their radio and television programs.
International Patent Classification: Provides for a hierarchical system
of language-independent symbols for the classification of patents and
utility models according to the different areas of technology to which
they pertain. The symbols contain information relating to sections,
classes, subclasses and groups.
Locarno Classification (LOC): The abbreviated form of the
International Classification for Industrial Designs under the Locarno
Agreement used for registering industrial designs. The LOC comprises
a list of 32 classes and their respective subclasses, with explanatory
notes and an alphabetical list of goods in which industrial designs
are incorporated and an indication of the classes and subclasses
into which they fall.
46
IP FACTS AND FIGURES
ADDI
TION
AL IN
FORM
ATIO
N
Madrid international application: An application for international
registration under the Madrid System, which is a request for protec-
tion of a trademark in one or more of the Madrid members. Such
international applications must be based on a basic mark.
Madrid System: The abbreviated form of the Madrid System for the
International Registration of Marks, which is established under the
Madrid Agreement and the Madrid Protocol and is administered by
WIPO. The Madrid System makes it possible for an applicant to register
a trademark in a large number of countries by filing a single applica-
tion at their national or regional IP office that is party to the System.
The Madrid System simplifies the process of multinational trademark
registration by reducing the requirement to file multiple applications
at each office. It also simplifies the subsequent management of the
mark, since it is possible to record changes or to renew the registra-
tion through a single procedural step. Registration through the Madrid
System does not create an international trademark, and the decision
to register or refuse the trademark remains in the hands of the national
and/or regional offices. Trademark rights are limited to the jurisdiction
of the trademark registration offices.
Nice Classification (NCL): The abbreviated form of the International
Classification of Goods and Services for the Purposes of Registering
Marks, an international classification established under the Nice
Agreement. The Nice Classification consists of 45 classes, which are
divided into 34 classes for goods and 11 for services.
Non-resident: For statistical purposes, a “non-resident” application
refers to an application filed with the IP office of or acting for a state
or jurisdiction in which the first-named applicant in the application is
not domiciled. For example, an application filed with the Japan Patent
Office (JPO) by an applicant residing in France is considered a non-
resident application from the perspective of this office. Non-resident
applications are sometimes referred to as foreign applications. A
non-resident grant or registration is an IP right issued on the basis of
a non-resident application.
Patent: A set of exclusive rights granted by law to applicants for inven-
tions that are new, non-obvious and commercially applicable. Patents
are valid for a limited period of time (generally 20 years) during which
patent holders can commercially exploit their inventions on an exclusive
basis. In return, applicants are obliged to disclose their inventions to
the public in a manner that enables others, skilled in the art, to replicate

47
IP FACTS AND FIGURES
ADDI
TION
AL IN
FORM
ATIO
N
the invention. The patent system is designed to encourage innovation
by providing innovators with time-limited exclusive legal rights, thus
enabling innovators to appropriate a return on their innovative activity.
PCT international application: A patent application filed through
the WIPO-administered Patent Cooperation Treaty (also referred to
as a PCT application).
PCT System: The Patent Cooperation Treaty (PCT), an international
treaty administered by WIPO, facilitates the acquisition of patent rights
in a large number of jurisdictions. The PCT System simplifies the
process of multiple national patent filings by reducing the requirement
to file a separate application in each jurisdiction. However, the deci-
sion on whether or not to grant patent rights remains in the hands of
national and regional patent offices, and patent rights remain limited
to the jurisdiction of the patent-granting authority. The PCT interna-
tional application process starts with the international phase, during
which an international search and possibly a preliminary examination
are performed, and concludes with the national phase, during which
national and regional patent offices decide on the patentability of an
invention according to national law.
Resident: For statistical purposes, a resident application refers
to an application filed with the IP office of or acting for the state or
jurisdiction in which the first-named applicant in the application has
residence. For example, an application filed with the Japan Patent
Office (JPO) by a resident of Japan is considered a resident applica-
tion for the JPO. Resident applications are sometimes referred to as
domestic applications.
Trademark: A sign used by the owner of certain products to distinguish
them from the products of other companies. A trademark can consist of
words and combinations of words (for instance, slogans), names, logos,
figures and images, letters, numbers, sounds and moving images, or
a combination thereof. The procedures for registering trademarks are
governed by the legislation and procedures of national and regional IP
offices. Trademark rights are limited to the jurisdiction of the IP office
that registers the trademark. Trademarks can be registered by filing
an application at the relevant national or regional offices or by filing an
international application through the Madrid System.
48
IP FACTS AND FIGURES
ADDI
TION
AL IN
FORM
ATIO
N
Utility model: A special form of patent right granted by a state or ju-
risdiction to an inventor or the inventor’s assignee for a fixed period of
time. The terms and conditions for granting a utility model are slightly
different from those for normal patents (including a shorter term of
protection and less stringent patentability requirements). The term can
also describe what are known in certain countries as petty patents,
short-term patents or innovation patents.

49
IP FACTS AND FIGURES
ADDI
TION
AL IN
FORM
ATIO
N
IP statistics data center
The WIPO IP statistics data center is a free on-line service for access-
ing WIPO’s statistics on patents, utility models, trademarks, industrial
designs and the use of the PCT, Madrid and Hague Systems. Users can
select from a wide range of indicators to view or download data. This
tool is intended for IP professionals, researchers and policymakers and
can be accessed via the IP statistics webpage www.wipo.int/ipstats.
Statistical resources

50
IP FACTS AND FIGURES
ADDI
TION
AL IN
FORM
ATIO
N
IP statistical country profiles
Please visit WIPO’s statistical country profile webpages for more sta-
tistics and longer time series for patent, utility model, trademark and
industrial design data. Like WIPO’s IP data center, this service can
also be accessed via our IP statistics webpage www.wipo.int/ipstats.
The IP statistical country profiles are also available in French and
Spanish language versions.


WIPO Publication No. 943E/14
ISBN 978-92-805-2582-3
For more information
contact WIPO at www.wipo.int
World Intellectual Property Organization
34, chemin des Colombettes
P.O. Box 18
CH-1211 Geneva 20
Switzerland
Tel: + 4122 338 91 11
Fax: + 4122 733 54 28