wirral development model and... · 2.3 interface with east wirral saturn model ... detailed...
TRANSCRIPT

Wirral Development Model
Assessment of Wirral Core Strategy Transport Impacts
August 2012
Wirral Council


305374 ITD ITN 001 00D
305374\Wirral Development_Assessment of Core Strategy_Final Issue.doc
29 August 2012
Wirral Development Model
Assessment of Wirral Core Strategy Transport Impacts
August 2012
Wirral Council
Mott MacDonald, 4th floor Royal Liver Building, Pier Head, Liverpool L3 1JH, United Kingdom
T +44(0) 151 236 4343 F +44(0) 151 236 1144, W www.mottmac.com
Wirral Council Technical Services DepartmentCheshire LinesCanning StreetBirkenheadWirral, CH41 1ND


Wirral Development Model Assessment of Wirral Core Strategy Transport Impacts
Mott MacDonald, 4th floor Royal Liver Building, Pier Head, Liverpool L3 1JH, United Kingdom
T +44(0) 151 236 4343 F +44(0) 151 236 1144, W www.mottmac.com
Revision Date Originator Checker Approver Description
001 00A 13 June 2012 IC NG 1st Draft
001 00B 20 June 2012 IC NG HF Submission
001 00C 25 July 2012 IC NG HG Updated for Clients Comments
001 00D 29 August 2012 IC NG EM Updated for final client comments
Issue and revision record
This document is issued for the party which commissioned it
and for specific purposes connected with the above-captioned
project only. It should not be relied upon by any other party or
used for any other purpose.
We accept no responsibility for the consequences of this
document being relied upon by any other party, or being used
for any other purpose, or containing any error or omission which
is due to an error or omission in data supplied to us by other
parties
This document contains confidential information and proprietary
intellectual property. It should not be shown to other parties
without consent from us and from the party which
commissioned it.


305374/ITD/ITN/001/00D 29 August 2012 305374\Wirral Development_Assessment of Core Strategy_Final Issue.doc
Wirral Development Model Assessment of Wirral Core Strategy Transport Impacts
Chapter Title Page
Executive Summary i
1. Introduction 1
1.1 Outline ___________________________________________________________________________ 1
1.2 Report Structure ____________________________________________________________________ 1
2. Modelling Components 2
2.1 Liverpool City Region Transport Model___________________________________________________ 2
2.2 Forecasting Travel Demand ___________________________________________________________ 9
2.3 Interface with East Wirral Saturn Model _________________________________________________ 11
3. Developments 12
3.1 Introduction _______________________________________________________________________ 12
3.2 Scenarios ________________________________________________________________________ 12
3.3 Development Data _________________________________________________________________ 12
3.4 Non-Wirral Zones __________________________________________________________________ 13
3.5 Aggregation of Development Data to LCRTM zone ________________________________________ 14
3.6 Seeding of Development Trips/Distribution_______________________________________________ 14
3.7 Forecast Networks _________________________________________________________________ 14
4. Assessment 16
4.1 Introduction _______________________________________________________________________ 16
4.2 Mode Share ______________________________________________________________________ 16
4.3 Highway Demand __________________________________________________________________ 17
4.4 Vehicle Kilometres _________________________________________________________________ 18
4.5 Average Trip Length ________________________________________________________________ 19
4.6 Journey Times ____________________________________________________________________ 20
4.7 Assignment Analysis________________________________________________________________ 23
4.8 Analysis of the Do Minimum __________________________________________________________ 23
4.9 Flow plots ________________________________________________________________________ 23
4.10 Volume over Capacity Ratios _________________________________________________________ 24
4.11 Change in Link Travel Times _________________________________________________________ 24
5. Conclusions 25
Appendices 27
Appendix A. Housing Data _____________________________________________________________________ 28
Appendix B. Employment Forecast _______________________________________________________________ 34
Appendix C. Development Maps_________________________________________________________________ 40
Appendix D. Key to Figures_____________________________________________________________________ 47
Appendix E. Do Minimum Analysis _______________________________________________________________ 50
Appendix F. Flow Changes_____________________________________________________________________ 53
Appendix G. Volume over Capacity Ratio __________________________________________________________ 58
Appendix H. Link Travel Time ___________________________________________________________________ 63
Content

305374/ITD/ITN/001/00D 29 August 2012 305374\Wirral Development_Assessment of Core Strategy_Final Issue.doc
Wirral Development Model Assessment of Wirral Core Strategy Transport Impacts
Appendix I. Detailed LCRTM Assignment Outputs __________________________________________________ 68

305374/ITD/ITN/001/00D 29 August 2012 305374\Wirral Development_Assessment of Core Strategy_Final Issue.doc
i
Wirral Development Model Assessment of Wirral Core Strategy Transport Impacts
The impact of Wirral’s Core Strategy on the highway network in the district has been
assessed using the Liverpool City Region Transport Model (LCRTM). The analysis has
focused on providing an indication on where the pressures on the local road network are
likely to be the greatest and to judge the extent of this impact on the wider road network
across the District.
Development scenarios representing Wirral Council’s projected Do Minimum and Core
Strategy have been compared at 2014 and 2024. The impact of the Core Strategy over
and above the impact of the Do Minimum has been analysed.
Based on journeys that have at least one end of their trip within the Wirral, the main
findings from analyses of the model outputs are as follows:
� The modal share of all journeys by car and public transport is not predicted to be
affected.
� In the AM (PM) peak, the Core Strategy leads to around a 1.6% (1.6%) increase in all
highway trips by 2014 and 4.4% (3.9%) growth by 2024. The main contributor to this
growth is trips to work.
� Small increases in total vehicle-kilometres travelled are predicted, arising from the
increased level of traffic in the Core Strategy. At 2024, LCRTM predicts a reduction of
approximately 2% in the morning peak and less than 1% in the evening peak in total
vehicle kilometres.
� LCRTM predicts a small decrease in the average trip lengths. At 2024, LCRTM shows
a decrease of approximately 2% in average trip lengths in the AM peak, and 3% in the
PM peak. This suggests that the Core Strategy, whilst adding trips to the road network
in Wirral, is not creating longer trips.
In terms of the impact on the highway network:
� The Do Minimum scenario leads to many roads having a volume over capacity in
excess of 85% by 2024, suggesting that even without the Core Strategy there will be
areas of the network, particularly focused around the East and West Float dock, which
are likely to require measures to improve the performance of the highway.
� The additional impact on the performance of the highway network with the Core
Strategy developments is barely noticeable in 2014.
� By 2024, the impact of the Core Strategy is more pronounced and is highest in the
area around the East and West Float, and on sections of the main routes into and out
of this area. The impact is not shown to be District-wide and the model indicates that
traffic growth in either of the Mersey tunnels is unlikely to be significant.
� Relatively few of the roads identified as “hot-spots” in terms of impact will see a
significant deterioration in their available capacity by 2024, compared to the Do
Minimum. However it is likely that improvements to junctions on these roads will need
Executive Summary

305374/ITD/ITN/001/00D 29 August 2012 305374\Wirral Development_Assessment of Core Strategy_Final Issue.doc
ii
Wirral Development Model Assessment of Wirral Core Strategy Transport Impacts
to be considered so that they continue providing a satisfactory level of service. A more
detailed modelling exercise will be required to establish the effect of the improvement
measures at junctions.
From the modelling work undertaken, it can be concluded that the impact of the Core
Strategy on the performance of the road network will be, to a large extent, spatially
limited within the area around the East and West Floats. These impacts can however be
mitigated with targeted junction improvements – these would be in addition to those
required to mitigate against some of the impacts of the Do Minimum scenario – and
combined with demand management measures such as enhancements to public
transport services.
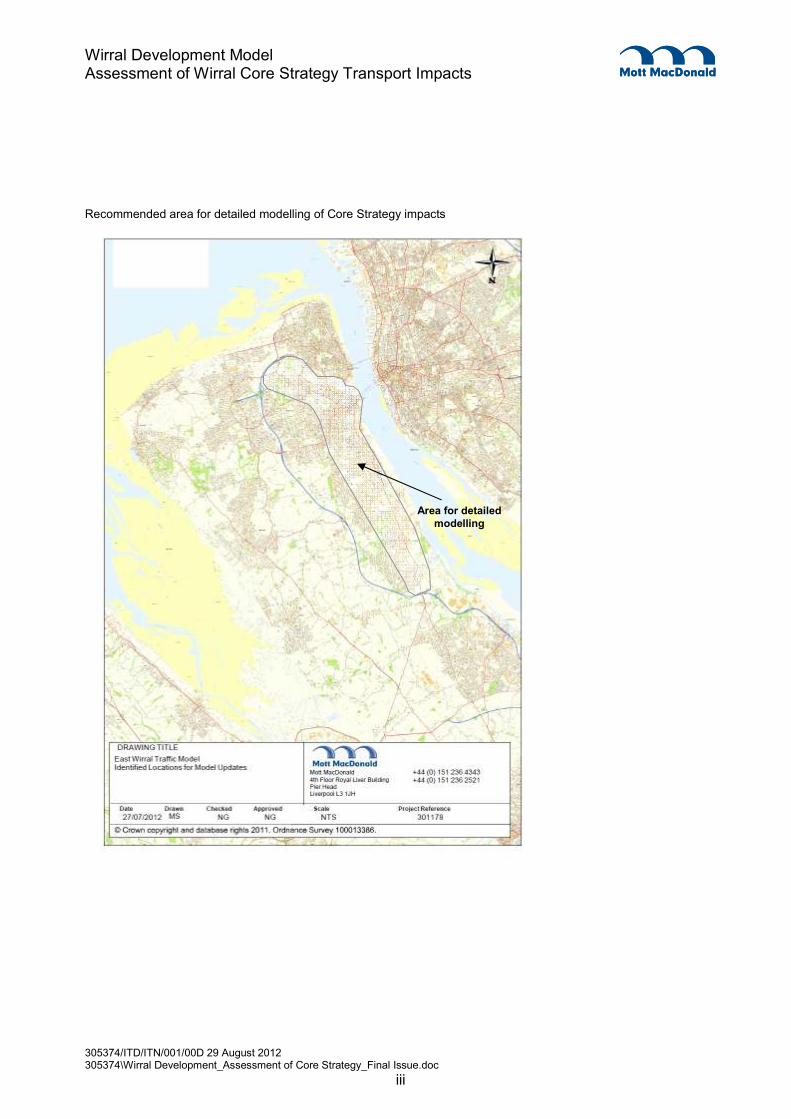
In the context of the incremental impact of the Core Strategy over the Do Minimum, the
evidence from the modelling suggests that the Core Strategy is deliverable. More
detailed work, using the East Wirral SATURN model is recommended to establish the
level and nature of the highway improvements required in the area shown in the figure
below, whilst enhancements to the public transport network could be modelled in
LCRTM. It is expected that developers would contribute toward the cost of such
mitigation measures as part of their development proposals in this area.
305374/ITD/ITN/001/00D 29 August 2012 305374\Wirral Development_Assessment of Core Strategy_Final Issue.doc
iii
Wirral Development Model Assessment of Wirral Core Strategy Transport Impacts
Recommended area for detailed modelling of Core Strategy impacts
Area for detailed
modelling
305374/ITD/ITN/001/00D 29 August 2012 305374\Wirral Development_Assessment of Core Strategy_Final Issue.doc
Wirral Development Model Assessment of Wirral Core Strategy Transport Impacts
1
1.1 Outline
Mott MacDonald has been commissioned by Wirral Council to assess the transport impacts of development
proposals within their Core Strategy. In undertaking this work, Mott MacDonald has utilised the Liverpool
City Region Transport Model (LCRTM), which has been set up to run and compare two distinct
development scenarios:
i) A Do Minimum comprising historic trends rolled forward plus consented development, or development
that is fairly certain to go ahead, and
ii) A Do Something comprising the development scenario currently set out in the Core Strategy plus key
development schemes (including those that are fairly certain to go ahead) and other potential schemes that
the Council wishes to see come forward during the Core Strategy Plan period.
LCRTM has been used to provide an indication of where congestion and delay on the highway network is
likely to occur (referred to as hot spots as a result of implementing the Core Strategy developments.
1.2 Report Structure
Following this introduction, the report is split into four further chapters:
� Chapter 2 provides information on the structure of LCRTM, what it was designed to do and its
component parts. The forecasting process is also described in terms of how future year travel demand
is estimated and the inputs that are required for this. The interface between LCRTM to a more detailed
SATURN model of Wirral is also described;
� Chapter 3 summaries the forecast development scenarios and how these have been accounted for in
the model set up;
� Chapter 4 contains a summary and explanation of the model results; and
� Chapter 5 concludes the report and sets out the next steps.
1. Introduction

305374/ITD/ITN/001/00D 29 August 2012 305374\Wirral Development_Assessment of Core Strategy_Final Issue.doc
Wirral Development Model Assessment of Wirral Core Strategy Transport Impacts
2
2.1 Liverpool City Region Transport Model
The Liverpool City Region Transport Model (LCRTM) is a multi-modal transport model, comprising a link-
based highway model, a public transport model and a variable demand model, and is the primary
assessment tool for testing various transport intervention measures in the City Region.
The geographical scope for the model includes the Liverpool City Region as the main study area - which
covers areas of West Cheshire, West Lancashire and Warrington, and a buffer area beyond this extending
further into Lancashire and areas of Greater Manchester and North Wales, as shown in Figure 2.1.
Figure 2.1: Geographical scope of LCRTM
Source: LCRTM Highway Model Local Model Validation Report – December 2009
2. Modelling Components

305374/ITD/ITN/001/00D 29 August 2012 305374\Wirral Development_Assessment of Core Strategy_Final Issue.doc
Wirral Development Model Assessment of Wirral Core Strategy Transport Impacts
3
LCRTM has a base year of 2008 – i.e. it is representative of travel demand and conditions in 2008. The
model has been used for appraising measures within Merseyside’s Third Local Transport Plan (LTP3),
which became active in April 2011. Further work was completed in August 2011 to incorporate new traffic
data into the highway model, although the model retained its 2008 base year. Since then, prominent
applications of the model have included supporting Merseyside’s Local Sustainable Transport Fund (LSTF)
bid and more recently associated bidding for the Better Bus Area Fund (BBAF), which secured funding of
£20M and £4M from Department for Transport (DfT) for the region respectively.
2.1.1 Objectives
LCRTM has been designed to address the following objectives:
� Produce a long term forecast of growth in demand for travel in the region, which will reflect changes
to land use, demographics, employment and the economy;
� Forecast the impacts of growth and changes in demand for travel on the existing highways and public
transport networks.
� Forecast the impacts of specific major regeneration projects and major land use developments
on the transport system in the Liverpool City Region;
� Forecast the impacts of increased congestion on the local economy and quality of life;
� Examine an array of measures and interventions that could be deployed to mitigate traffic/travel
growth impacts.
2.1.2 Structure
LCRTM follows the Department for Transport (DfT) guidance WebTAG in respect of its components and
structure. The model system operates within CUBE software, using VOYAGER applications and bespoke
scripting of processes such as the assignment methodology and the variable demand model.
The general structure of LCRTM is explained in Figure 2.2, illustrating the hierarchy of travel choices that
fall between trip generation and assignment. At each level in the hierarchy the travel choice is dependent
upon the change in cost of travel from the base year to the forecast year. The highway and public transport
models, which are the final stage in the model are concerned with the routing of vehicles and passengers
throughout the transport system, whilst the demand model deals with the traveller choices in terms mode
choice (how to travel), time period choice (when to travel) and distribution (where to travel).

305374/ITD/ITN/001/00D 29 August 2012 305374\Wirral Development_Assessment of Core Strategy_Final Issue.doc
Wirral Development Model Assessment of Wirral Core Strategy Transport Impacts
4
Figure 2.2: Overall LCRTM 5-Stage Model Structure
Source: LCRTM Demand Modelling Report – August 2010
2.1.3 Stage 1: Trip Generation
This is the first stage in the model structure and is a measure of the total demand for travel across all
destinations, time periods and modes. Trip generation is split by journey purpose, for example journeys to
work (commuting), journeys in the course of work (employers business) and other (such as shopping,
education and leisure related trips). A further discussion on the mechanism used to forecast the total
demand for travel is provided in Section 2.2.
2.1.4 Stage 2: Mode Choice
Subsequent to trip generation the total travel demand is then split across three travel modes: public
transport (comprising of bus and rail), car and slow modes (comprising walk and cycle).

305374/ITD/ITN/001/00D 29 August 2012 305374\Wirral Development_Assessment of Core Strategy_Final Issue.doc
Wirral Development Model Assessment of Wirral Core Strategy Transport Impacts
5
2.1.5 Stage 3: Time Period Choice (Macro)
The model has four discrete time periods: the morning peak period (07:00:10:00); interpeak (10:00-16:00),
evening peak period (16:00-19:00) and the off peak (19:00-07:00).
2.1.6 Stage 4: Distribution
Trips by purpose, mode and time period are then distributed to destinations within the model.
2.1.7 Stage 5: Departure Time Choice
Within the morning peak period, a further division of the travel demand occurs, with the model splitting the
number of trips into a pre-peak, peak, and post-peak hour.
2.1.8 Assignment
This concerns the routing of passengers on the public transport network, i.e. which bus and rail services
they use to connect their trip origin and destination. For car users, it is the choice of roads that connect
each end of their journey. In both cases, route choice is based on travellers using the cheapest cost route,
based on factors such as fares, waiting times, travel times and fuel costs.
In terms of the highway model, three vehicle classes are assigned: cars, light goods vehicles (LGV) and
other goods vehicles (OGV). The car vehicle class is further sub-divided into three journey purposes:
commuting, employers business and other. Only the peak hours (08:00-09:00 and 17:00-18:00) and the
average interpeak (between 10:00-16:00) are subject to assignment.
2.1.9 Base year Travel Demand
As stated LCRTM currently has a base year of 2008. The total demand for travel in 2008, and the
respective origin and destination of trips in the City Region has been developed using a number of sources,
including:
� From historical roadside interview data collected across the region, including Wirral;
� From information derived from Merseyside Travel Survey (HTS) on household trip rates; and
� Land use indicators, such as statistics on total employment, retail employment and educational places.
An update to the LCRTM highway model was undertaken in 2011 during which the roadside interview (RSI)
data collected in 2009 in Wirral (for locations refer to Figure 2.3) and Liverpool cordons (Figure 2.4) were
incorporated into the model, thus improving the representation of trips in these areas of the model. The
base year of the model was left unchanged.
During this update, roadside interview data from surveys collected on the western side of Ellesmere Port
town centre were also included to improve the representation of highway trips from this area of the model
into Wirral.

305374/ITD/ITN/001/00D 29 August 2012 305374\Wirral Development_Assessment of Core Strategy_Final Issue.doc
Wirral Development Model Assessment of Wirral Core Strategy Transport Impacts
6
Figure 2.3: Wirral RSI Cordons - 2009
Source: 294188-R01-LCR-LMVR_Addendum_Report_RevB_NGUpdated.doc

305374/ITD/ITN/001/00D 29 August 2012 305374\Wirral Development_Assessment of Core Strategy_Final Issue.doc
Wirral Development Model Assessment of Wirral Core Strategy Transport Impacts
7
Figure 2.4: Liverpool RSI cordons - 2009
Source: 294188-R01-LCR-LMVR_Addendum_Report_RevB_NGUpdated.doc
2.1.10 LCRTM Highway Network and zoning Wirral
LCRTM comprises of 459 model zones, 46 of which are located within Wirral’s administrative boundary as
shown in Figure 2.5. The zoning system has been developed based on Census Output Area boundaries,
which have then been aggregated.
.

305374/ITD/ITN/001/00D 29 August 2012 305374\Wirral Development_Assessment of Core Strategy_Final Issue.doc
Wirral Development Model Assessment of Wirral Core Strategy Transport Impacts
8
Figure 2.5: LCRTM zones in Wirral
Source: LCRTM_Zone_System-Wirral_District.pdf
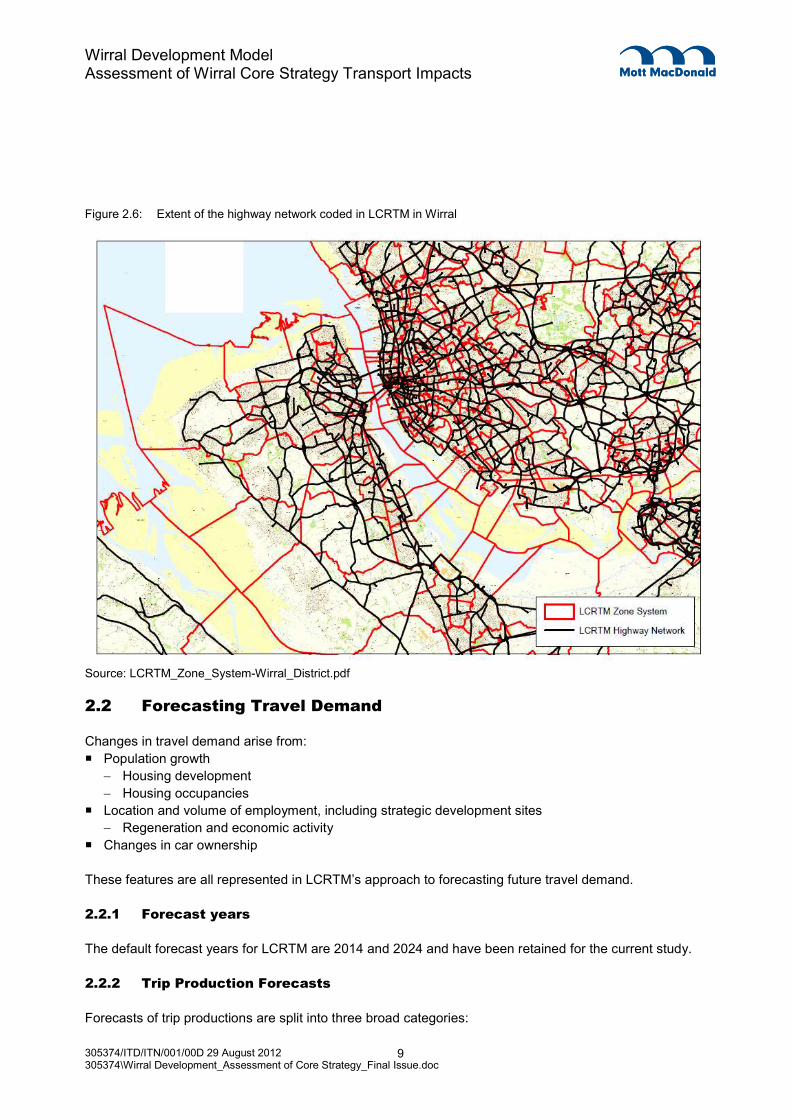
The coverage of the highway network in Wirral and adjacent areas is shown in Figure 2.6 (where the black
lines show the links included in the model). All motorways, A-roads, B-roads and significant C-roads are
included, thus providing a good coverage of the major routes between trip origins and destinations in the
district.
The LCRTM highway network is link based and the representation of delay to highway vehicles is
undertaken by the use of speed flow curves. There is no explicit junction modelling in the current version of
LCRTM, hence the analysis of impacts on junctions cannot be assessed. More detailed modelling will be
available via LCRTM’s interface with the East Wirral Traffic Model (discussed further in Section 2.3)
305374/ITD/ITN/001/00D 29 August 2012 305374\Wirral Development_Assessment of Core Strategy_Final Issue.doc
Wirral Development Model Assessment of Wirral Core Strategy Transport Impacts
9
Figure 2.6: Extent of the highway network coded in LCRTM in Wirral
Source: LCRTM_Zone_System-Wirral_District.pdf
2.2 Forecasting Travel Demand
Changes in travel demand arise from:
� Population growth
− Housing development
− Housing occupancies
� Location and volume of employment, including strategic development sites
− Regeneration and economic activity
� Changes in car ownership
These features are all represented in LCRTM’s approach to forecasting future travel demand.
2.2.1 Forecast years
The default forecast years for LCRTM are 2014 and 2024 and have been retained for the current study.
2.2.2 Trip Production Forecasts
Forecasts of trip productions are split into three broad categories:

305374/ITD/ITN/001/00D 29 August 2012 305374\Wirral Development_Assessment of Core Strategy_Final Issue.doc
Wirral Development Model Assessment of Wirral Core Strategy Transport Impacts
10
� The number of home based trips: The quantum of home based trips are based on the changes in the
number of households taking into account Government forecasts in terms of compositions of
households and car ownership, which are then combined with the trip generation rates derived from the
Merseyside Household Travel Survey (HTS).
� Non-home based trips: Non home based trips, for example a trip made from a place of work on
business, are estimated based on information in the HTS on the propensity for making a non-home
based trip, which is then applied to the non-home end of a home based trip.
� Freight: the growth in freight is based on the growth in total employment.
2.2.3 Trip Attraction Forecasts
Within LCRTM, attraction forecasts are based on future year estimates of:
� Total employment;
� Retail employment;
� Pupils; and
� Population.
These estimates are undertaken at zonal level and then used to distribute the trip productions prior to the
demand model being run. For example, home based commuting trips are distributed according to the
location and scale of total employment, whilst trips associated with education and shopping are distributed
according to Government forecasts on pupil numbers and retail employment respectively.
2.2.4 Constraint to Trip Productions
It is important to note that forecasting within LCRTM is primarily a home-based forecast, recognising the
fundamental building block of trip generation is the household unit. Whilst databases such as TRICS are
often used to develop estimates of the trips into and out of development sites, the default approach taken in
LCRTM is to estimate the total number of trips generated by the household unit, and then distribute
these across the various trip attractions. Hence, the number of journeys to work in the model, for
example, is governed not by the number of employment places, but by the number of journey to work trips
created by all the households. The number of employment places is only used as a weight to distribute the
commuting trips across the modelled zones. For certain development sites, however, the default
mechanism has been overwritten to better represent the level of trip making presented in current transport
assessments.
2.2.5 Outputs
The forecasting of trips is undertaken in a separate LCRTM module, contained within an Access Database:
the External Forecasting Model (EFM). The outputs from EFM are future year trip matrices that are based
on travel costs remaining unchanged from those in the base year – these are termed reference case
matrices.
When assigned to the transport network the reference case matrices result in changes in travel costs
(through increased congestion from increased traffic levels) compared to the base year model, and the
response to these cost changes in terms of the mode, destination and time period choices, are determined
within the demand model. Hence, the output from the demand model are a new set assignment matrices
that reflect the changes in cost of travel as a result of future increases in travel demand and can be used to
estimate the impact on the transport network of the developments.

305374/ITD/ITN/001/00D 29 August 2012 305374\Wirral Development_Assessment of Core Strategy_Final Issue.doc
Wirral Development Model Assessment of Wirral Core Strategy Transport Impacts
11
2.3 Interface with East Wirral Saturn Model
A SATURN model has also been developed for East Wirral (the East Wirral Traffic Model – EWTM), which
facilitates a more detailed analysis of highway impacts in Wirral and includes junction simulation modelling.
The zone system of this model has been developed to sit inside the LCRTM zones, with between four and
six EWTM zones to a single LCRTM zone. A mechanism has been developed that allows traffic growth
forecasts from LCRTM to be applied to EWTM.
Whilst the current study has concentrated on looking at the higher level impacts (i.e. within LCRTM),
EWTM will be used to develop infrastructure planning work necessary to support the Core Strategy. As
outlined in the next chapter, development assumptions for both the Do Minimum and Core Strategy
scenarios have been collated using the EWTM zone boundaries as identified in Figure 2.7 and then
converted to the LCRTM zoning system.
Figure 2.7: East Wirral Transport Model zone boundaries
Source: LCRTM_&_EWTM_Mapinfo_Layers_for_issue_010312\LCRTM_Network&Zones_Wirral_Coverage.pdf

305374/ITD/ITN/001/00D 29 August 2012 305374\Wirral Development_Assessment of Core Strategy_Final Issue.doc
Wirral Development Model Assessment of Wirral Core Strategy Transport Impacts
12
3.1 Introduction
In this chapter the development scenarios that have been tested in LCRTM are described.
3.2 Scenarios
Two development scenarios have been modelled in LCRTM, namely:
1. The Do Minimum (i.e. historic trends rolled forward, which includes consented key development
schemes); and
2. The Do Something (i.e. the Core Strategy, which includes both consented and potential key
development schemes).
Within the Do Something the following key schemes, as described by Wirral Council, are included:
Key Scheme
Asda Birkenhead
Woodside
Hind Street
Wirral Waters
Cammell Lairds
International Trade Centre
Bidston Dock
New Brighton regeneration
Golf Resort
Eastham Dock Estate
Wirral International Business Park
Levers
3.3 Development Data
In view of the forecasting mechanism utilised in LCRTM, Wirral Council provided bespoke projections in
terms of the predicted growth in housing, total employment and retail employment within Wirral. The
information was provided at East Wirral Transport Model zone level and is summarised in Tables 3.1 and
3.2 below.
In terms of the development projections for the Core Strategy, some of the growth can be attributed to the
key schemes highlighted above, whilst some will relate to a number of smaller or medium schemes, or
simply an accumulation of available land that is expected to come forward in the plan period.
A copy of the actual data provided by Wirral is included in Appendix A and Appendix B. Mapping showing
the size and location of the new development is provided in Appendix C.
Table 3.3 shows that by 2024, the Core Strategy provides for an additional 13,090 housing units, over and
above the base 2008 case, with nearly 35,000 new employment opportunities.
3. Developments

305374/ITD/ITN/001/00D 29 August 2012 305374\Wirral Development_Assessment of Core Strategy_Final Issue.doc
Wirral Development Model Assessment of Wirral Core Strategy Transport Impacts
13
Table 3.1: Forecasting Inputs: growth 2008-2014
Scenario Housing Employment (all) Employment (Retail
Do Minimum 2,400 6,497 886
Do Something 4,491 8,911 949
Source: 2012 03 30 Transport model info FOR SENDING.xls [provided by Wirral Council]
Table 3.2: Forecasting Inputs: growth 2014-2024
Scenario Housing Employment (all) Employment (Retail
Do Minimum 4,000 9,712 609
Do Something 8,599 25,978 1,292
Source: 2012 03 30 Transport model info FOR SENDING.xls [provided by Wirral Council]
Table 3.3: Forecasting Inputs: growth 2008-2024
Scenario Housing Employment (all) Employment (Retail
Do Minimum 6,600 16,209 1,495
Do Something 13,090 34,889 2,212
Source: 2012 03 30 Transport model info FOR SENDING.xls [provided by Wirral Council]
3.4 Non-Wirral Zones
With the exception of Cheshire West and Chester, the household and employment growth used in the
remainder of the City Region is consistent to that adopted in the version of LCRTM used to appraise LTP3.
Hence, for employment, projections and major employment site are consistent with the “Aspirational”
forecast for the City Region made by Cambridge Econometrics/PION in 2009 (on behalf of the Merseyside
Partnership)1.
The LTP3 forecast included the addition of major employment sites such as Liverpool Waters (Liverpool),
Parkside (St Helens) and Daresbury (Warrington).These have all been included within the Core Scenario.
The housing projections outside of Wirral are those agreed during consultations with each Merseyside
district in 2011 and are thus representative of the best forecasts available at that time.
3.4.1 Cheshire West and Chester
Given their close proximity to the Wirral boundary, several developments in Cheshire West and Chester
were explicitly included in the Core Strategy forecasts. These developments are described within Table 3.4
along with their projected employment and housing totals.
_________________________ 1 Economic Forecasts for the Liverpool City Region: Recession and Recovery. Technical Report. PION Economics and Cambridge Econometrics, December 2010
305374/ITD/ITN/001/00D 29 August 2012 305374\Wirral Development_Assessment of Core Strategy_Final Issue.doc
Wirral Development Model Assessment of Wirral Core Strategy Transport Impacts
14
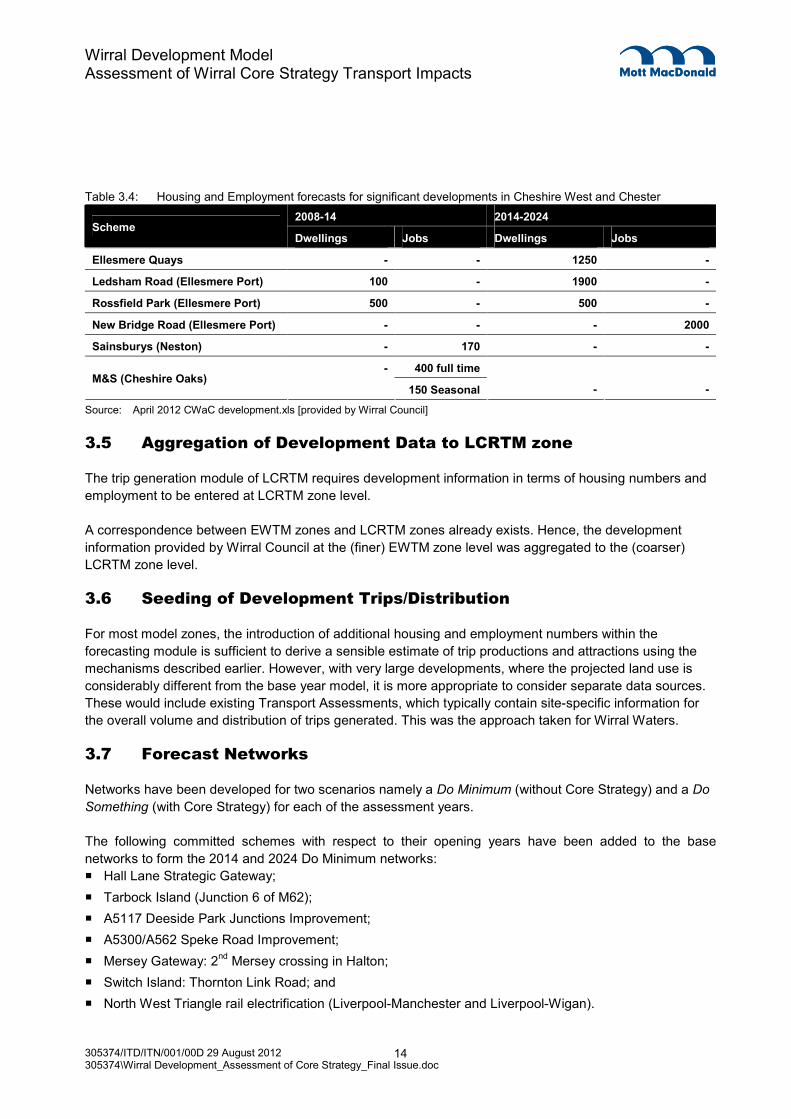
Table 3.4: Housing and Employment forecasts for significant developments in Cheshire West and Chester
2008-14 2014-2024 Scheme
Dwellings Jobs Dwellings Jobs
Ellesmere Quays - - 1250 -
Ledsham Road (Ellesmere Port) 100 - 1900 -
Rossfield Park (Ellesmere Port) 500 - 500 -
New Bridge Road (Ellesmere Port) - - - 2000
Sainsburys (Neston) - 170 - -
400 full time M&S (Cheshire Oaks)
-
150 Seasonal - -
Source: April 2012 CWaC development.xls [provided by Wirral Council]
3.5 Aggregation of Development Data to LCRTM zone
The trip generation module of LCRTM requires development information in terms of housing numbers and
employment to be entered at LCRTM zone level.
A correspondence between EWTM zones and LCRTM zones already exists. Hence, the development
information provided by Wirral Council at the (finer) EWTM zone level was aggregated to the (coarser)
LCRTM zone level.
3.6 Seeding of Development Trips/Distribution
For most model zones, the introduction of additional housing and employment numbers within the
forecasting module is sufficient to derive a sensible estimate of trip productions and attractions using the
mechanisms described earlier. However, with very large developments, where the projected land use is
considerably different from the base year model, it is more appropriate to consider separate data sources.
These would include existing Transport Assessments, which typically contain site-specific information for
the overall volume and distribution of trips generated. This was the approach taken for Wirral Waters.
3.7 Forecast Networks
Networks have been developed for two scenarios namely a Do Minimum (without Core Strategy) and a Do
Something (with Core Strategy) for each of the assessment years.
The following committed schemes with respect to their opening years have been added to the base
networks to form the 2014 and 2024 Do Minimum networks:
� Hall Lane Strategic Gateway;
� Tarbock Island (Junction 6 of M62);
� A5117 Deeside Park Junctions Improvement;
� A5300/A562 Speke Road Improvement;
� Mersey Gateway: 2nd Mersey crossing in Halton;
� Switch Island: Thornton Link Road; and
� North West Triangle rail electrification (Liverpool-Manchester and Liverpool-Wigan).

305374/ITD/ITN/001/00D 29 August 2012 305374\Wirral Development_Assessment of Core Strategy_Final Issue.doc
Wirral Development Model Assessment of Wirral Core Strategy Transport Impacts
15
For the Do Something network, the electrification of the Borderlands Rail service between North Wales and
Liverpool has been included.

305374/ITD/ITN/001/00D 29 August 2012 305374\Wirral Development_Assessment of Core Strategy_Final Issue.doc
Wirral Development Model Assessment of Wirral Core Strategy Transport Impacts
16
4.1 Introduction
In this chapter the results from running LCRTM for the Do Minimum and Do Something (Core Strategy)
scenarios are presented.
In the first instance, the impact of the Do-Something assumptions on mode share is considered, followed
by statistics on the total vehicle kilometres and average trip distances. Following this, the impact of journey
times to/from Wirral to/from surrounding districts and the wider City Region are presented.
The final stage of the LCRTM is the assignment of the travel demand on the highway (and public transport
networks) after all the travel choices within the demand model have been taken into account. For the
purpose of the current study the morning peak (08:00-09:00) and evening peak (17:00-18:00) have been
considered at 2014 and 2024.
Using the model outputs, the “hot spots” in terms of the location of significant increases in traffic volumes
and volume over capacity (V/C) ratios as well as travel times can be identified. Since LCRTM is a link
based model, it is not currently possible to capture the impact of the developments on the operation of
junctions. However, by determining where the level of traffic growth is at its greatest, the areas where
impacts on junctions are likely can be identified.
4.2 Mode Share
Tables 4.1 and 4.2 show the mode share for travel for all trips with at least one end of their journey in
Wirral (i.e. a journey that starts, ends or is completely within Wirral).
It can be seen that there is little difference in the mode share between the Do Minimum and Do Something,
with around 73% of all trips being by car, and 17% by public transport. This is to be expected given that the
Core Strategy development lies within established urban and sub-urban areas.
Table 4.1: AM Mode Share
AM Car Freight Public Transport
2008 (Base) 73.3% 8.5% 18.2%
2014 Do-Minimum 71.3% 9.5% 19.2%
2014 Do-Something 71.4% 9.4% 19.2%
2024 Do-Minimum 71.8% 11.0% 17.2%
2024 Do-Something 72.3% 10.5% 17.1%
Table 4.2: PM Mode Share
PM Car Freight Public Transport
2008 (Base) 75.4% 7.7% 16.9%
2014 Do-Minimum 72.3% 9.6% 18.1%
2014 Do-Something 72.5% 9.5% 18.0%
2024 Do-Minimum 72.5% 10.9% 16.6%
2024 Do-Something 73.0% 10.6% 16.5%
4. Assessment
305374/ITD/ITN/001/00D 29 August 2012 305374\Wirral Development_Assessment of Core Strategy_Final Issue.doc
Wirral Development Model Assessment of Wirral Core Strategy Transport Impacts
17
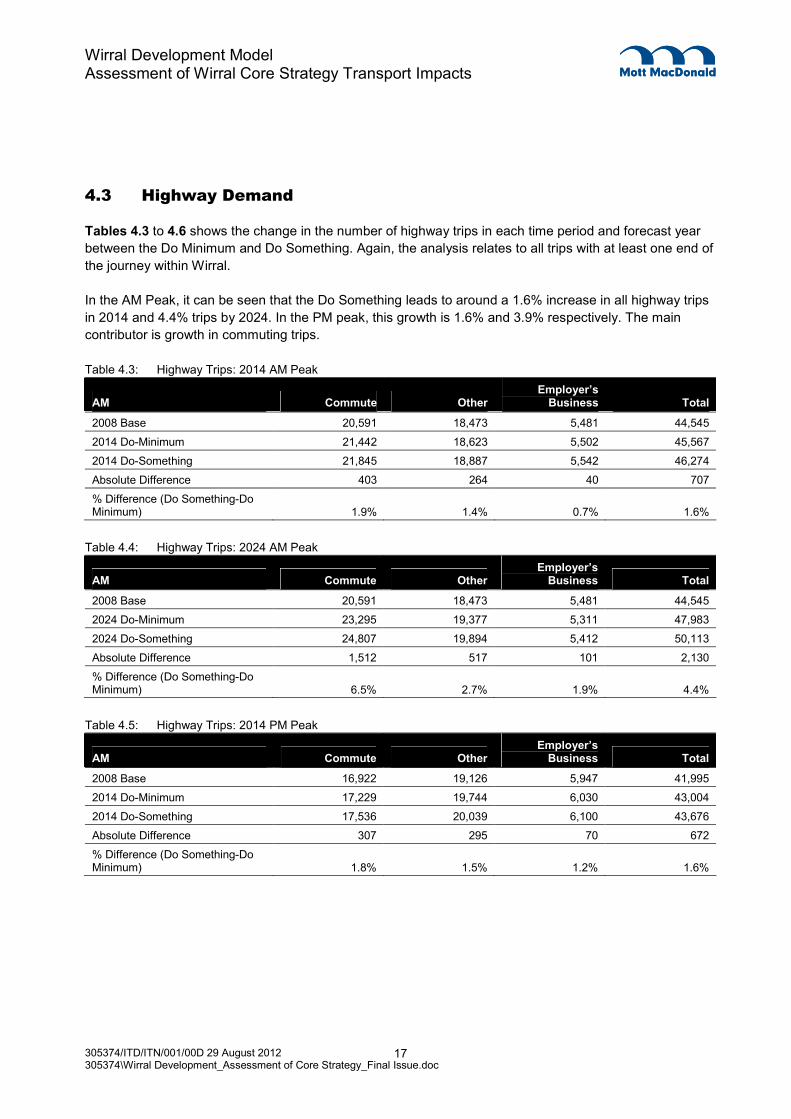
4.3 Highway Demand
Tables 4.3 to 4.6 shows the change in the number of highway trips in each time period and forecast year
between the Do Minimum and Do Something. Again, the analysis relates to all trips with at least one end of
the journey within Wirral.
In the AM Peak, it can be seen that the Do Something leads to around a 1.6% increase in all highway trips
in 2014 and 4.4% trips by 2024. In the PM peak, this growth is 1.6% and 3.9% respectively. The main
contributor is growth in commuting trips.
Table 4.3: Highway Trips: 2014 AM Peak
AM Commute Other Employer’s Business Total
2008 Base 20,591 18,473 5,481 44,545
2014 Do-Minimum 21,442 18,623 5,502 45,567
2014 Do-Something 21,845 18,887 5,542 46,274
Absolute Difference 403 264 40 707
% Difference (Do Something-Do Minimum) 1.9% 1.4% 0.7% 1.6%
Table 4.4: Highway Trips: 2024 AM Peak
AM Commute Other Employer’s Business Total
2008 Base 20,591 18,473 5,481 44,545
2024 Do-Minimum 23,295 19,377 5,311 47,983
2024 Do-Something 24,807 19,894 5,412 50,113
Absolute Difference 1,512 517 101 2,130
% Difference (Do Something-Do Minimum) 6.5% 2.7% 1.9% 4.4%
Table 4.5: Highway Trips: 2014 PM Peak
AM Commute Other Employer’s Business Total
2008 Base 16,922 19,126 5,947 41,995
2014 Do-Minimum 17,229 19,744 6,030 43,004
2014 Do-Something 17,536 20,039 6,100 43,676
Absolute Difference 307 295 70 672
% Difference (Do Something-Do Minimum) 1.8% 1.5% 1.2% 1.6%

305374/ITD/ITN/001/00D 29 August 2012 305374\Wirral Development_Assessment of Core Strategy_Final Issue.doc
Wirral Development Model Assessment of Wirral Core Strategy Transport Impacts
18
Table 4.6: Highway Trips: 2024 PM Peak
AM Commute Other Employer’s Business Total
2008 Base 16,922 19,126 5,947 41,995
2024 Do-Minimum 18,056 21,285 6,348 45,689
2024 Do-Something 18,936 22,024 6,516 47,476
Absolute Difference 880 738 169 1,787
Difference (Do Something-Do Minimum) 4.9% 3.5% 2.7% 3.9%
4.4 Vehicle Kilometres
Tables 4.7 to 4.10 shows the impact of the Core Strategy on total vehicle kilometres travelled for trips with
at least one end of their journey in Wirral. The largest impact is reported at 2024 in the AM peak where it
can be seen that overall, there is a 1.9% increase in vehicle-kilometres for all highway trip purposes. The
increase in car commuting trip kilometres is the main contributor to the growth in trips. The change in the
PM peak reported is much more modest, at less than 1%.
Table 4.7: 2014 AM Vehicle Kilometres
AM Car -
Commute Car- Other
Car -Employer’s Business
Light Goods
Vehicles
Other Goods
Vehicles Total
2008 Base 440,364,382 169,494,096 94,773,823 56,859,753 19,044,799 780,536,853
2014 Do-Minimum 463,176,044 158,176,734 92,501,354 66,656,715 19,973,882 800,484,729
2014 Do-Something 469,731,651 159,716,931 92,752,483 66,612,479 19,960,100 808,773,644
Absolute Difference 6,555,607 1,540,197 251,129 -44,237 -13,783 8,288,914
Difference (Do Something-Do Minimum) 1.4% 1.0% 0.3% -0.1% -0.1% 1.0%
Table 4.8: 2024 AM Vehicle Kilometres
AM Car -
Commute Car- Other
Car -Employer’s Business
Light Goods
Vehicles
Other Goods
Vehicles Total
2008 Base 440,364,382 169,494,096 94,773,823 56,859,753 19,044,799 340,172,471
2024 Do-Minimum 505,077,562 173,123,677 90,851,672 84,683,207 21,635,053 875,371,171
2024 Do-Something 517,776,448 175,740,575 90,974,174 85,244,670 21,853,355 891,589,222
Absolute Difference 12,698,886 2,616,898 122,502 561,463 218,301 16,218,051
Difference (Do Something-Do Minimum) 2.5% 1.5% 0.1% 0.7% 1.0% 1.9%

305374/ITD/ITN/001/00D 29 August 2012 305374\Wirral Development_Assessment of Core Strategy_Final Issue.doc
Wirral Development Model Assessment of Wirral Core Strategy Transport Impacts
19
Table 4.9: 2014 PM Vehicle Kilometres
PM Car -
Commute Car- Other
Car -Employer’s Business
Light Goods
Vehicles
Other Goods
Vehicles Total
2008 Base 409,540,577 259,953,293 116,591,254 56,472,340 10,282,005 852,839,469
2024 Do-Minimum 419,702,055 271,061,726 116,298,150 66,083,338 10,745,974 883,891,243
2024 Do-Something 422,787,950 273,623,627 117,227,227 66,100,330 10,740,832 890,479,967
Absolute Difference 3,085,896 2,561,901 929,077 16,992 -5,141 6,588,724
Difference (Do Something-Do Minimum) 0.7% 0.9% 0.8% 0.0% 0.0% 0.7%
Table 4.10: 2024 PM Vehicle Kilometres
PM Car -
Commute Car- Other
Car -Employer’s Business
Light Goods
Vehicles
Other Goods
Vehicles Total
2008 Base 409,540,577 259,953,293 116,591,254 56,472,340 10,282,005 852,839,469
2024 Do-Minimum 442,345,015 308,463,271 123,157,092 84,052,816 11,582,861 969,601,056
2024 Do-Something 441,994,408 311,492,559 122,979,317 83,935,374 11,568,441 971,970,099
Absolute Difference -350,607 3,029,287 -177,775 -117,442 -14,420 2,369,044
Difference (Do Something-Do Minimum) -0.1% 1.0% -0.1% -0.1% -0.1% 0.2%
4.5 Average Trip Length
Tables 4.11 and 4.12 show the average length of a trip in the AM and PM peak hours. It can be seen that
the Core Strategy is predicted to result in a slight reduction in the average trip length. This also suggests
that whilst there is an increase in the demand for travel as a result of implementing the Core Strategy, the
locations of the planned developments do not lead to longer journeys.
Table 4.11: AM
AM 2008 Average Trip
Distance (km) 2014 Average Trip
Distance (km) 2024 Average Trip
Distance (km)
Do Minimum 11.8 11.6 11.9
Do Something 11.8 11.6 11.7
% Change NA 0 -1.7
Table 4.12: PM
PM 2008 Average Trip
Distance (km) 2014 Average Trip
Distance (km) 2024 Average Trip
Distance (km)
Do Minimum 12.7 13.7 14.0
Do Something 12.7 13.6 13.6
% Change NA -0.7 -2.9

305374/ITD/ITN/001/00D 29 August 2012 305374\Wirral Development_Assessment of Core Strategy_Final Issue.doc
Wirral Development Model Assessment of Wirral Core Strategy Transport Impacts
20
4.6 Journey Times
Tables 4.13 to 4.16 show the impact of the Core Strategy on average journey times between Wirral and
surrounding districts as well as the wider city region. In general, the results show small changes between
the Do Minimum and Do Something.
Positive values in the tables indicate that the journey times are greater under the Core Strategy and are
generally observed in the AM peak (albeit in small numbers) coming into Wirral from outside, or trips wholly
within Wirral, with decreases reported for trips in the opposite direction (i.e. leaving Wirral). The converse is
true of the PM peak – where we see increased journey times for vehicles leaving Wirral.
The results point towards Wirral being more attractive as a destination (for employment and other
purposes) in the Core Strategy thus increasing traffic on the main routes into the district, and on routes
within the district.

305374/ITD/ITN/001/00D 29 August 2012 305374\Wirral Development_Assessment of Core Strategy_Final Issue.doc
Wirral Development Model Assessment of Wirral Core Strategy Transport Impacts
21
Table 4.13: 2014 AM Do-Minimum compared to 2014 Do Something: Absolute Difference (mins)
Liverpool
Wirral
Knowsley
Sefton
St Helens
Halton
West
Lancashire
Ellesmere
Port and
Neston
Rest of the
Study Area
Externals
Liverpool 0.17
Wirral -0.08 0.04 -0.14 -0.03 -0.26 0.24 -0.08 0.09 0.15 -0.22
Knowsley 0.06
Sefton 0.01
St Helens 0.01
Halton 0.42
West Lancashire -0.02
Ellesmere Port and Neston 0.02
Rest of the Study Area 0.65
Externals 0.04
Table 4.14: 2024 AM Do-Minimum compared to 2014 Do Something: Absolute Difference (mins)
Liverpool
Wirral Knowsley
Sefton
St Helens
Halton
West
Lancashire
Ellesmere
Port and
Neston
Rest of the
Study Area
Externals
Liverpool 0.44
Wirral -0.37 0.23 -0.46 -0.19 -0.6 1.09 -0.55 0.55 0.43 -1.5
Knowsley 0.27
Sefton 0.41
St Helens 0.68
Halton 1.41
West Lancashire 0.41
Ellesmere Port and Neston 0.35
Rest of the Study Area 1.22
Externals 0.46
To
To
From
From

305374/ITD/ITN/001/00D 29 August 2012 305374\Wirral Development_Assessment of Core Strategy_Final Issue.doc
Wirral Development Model Assessment of Wirral Core Strategy Transport Impacts
22
Table 4.15: 2014 PM Do-Minimum compared to 2014 Do Something: Absolute Difference (mins)
Liverpool
Wirral
Knowsley
Sefton
St Helens
Halton
West
Lancashire
Ellesmere
Port and
Neston
Rest of the
Study Area
Externals
Liverpool -0.12
Wirral 0.06 0.05 0.11 0.45 -0.12 -0.02 0.03 0.05 0.38 -1.02
Knowsley -0.1
Sefton -0.06
St Helens -0.21
Halton 0.03
West Lancashire -0.19
Ellesmere Port and Neston 0.02
Rest of the Study Area 0.1
Externals 0.05
Table 4.16: 2024 PM Do-Minimum compared to 2014 Do Something: Absolute Difference (mins)
Liverpool
Wirral Knowsley
Sefton
St Helens
Halton
West
Lancashire
Ellesmere
Port and
Neston
Rest of the
Study Area
Externals
Liverpool -0.37
Wirral -0.11 0.12 0.13 0.34 0.18 1.08 -0.11 0.26 0.57 -3.27
Knowsley -0.29
Sefton -0.19
St Helens -0.28
Halton 0.45
West Lancashire -0.22
Ellesmere Port and Neston 0.4
Rest of the Study Area 0.23
Externals -0.48
To
To
From
From

305374/ITD/ITN/001/00D 29 August 2012 305374\Wirral Development_Assessment of Core Strategy_Final Issue.doc
Wirral Development Model Assessment of Wirral Core Strategy Transport Impacts
23
4.7 Assignment Analysis
The assignment of the 2024 Do Minimum and Do Something highway matrices have been compared to
identify the likely hot-spots in terms of the impact on network performance in Wirral as a result of
implementing the Core Strategy. In the first instance, an analysis has been undertaken of the performance
of the Do Minimum scenario – i.e. what is the impact of forecast developments that do not include the
components of the Core Strategy.
Following the analysis of the Do Minimum, three different measures have been used to show where as a
result of increases in traffic over the Do Minimum there may be additional performance issues in terms of
the delay experienced by road users.
The following analyses have been undertaken:
� Identifying where absolute flow changes could be considered to be materially significant. This has
been based on identifying those links where the increase in flow under the Core Strategy is greater than
5% with a corresponding change in flow of more than 50 vehicles per hour.
� Identifying where the volume over capacity ratio in the Do Something scenario exceeds 85% on a link
that in the Do Minimum was less than 85%; i.e. this identifies where capacity is close to being exceeded
and likely to cause congestion with implementing the Core Strategy developments.
� Identifying where the link travel time in the Do Something scenario is 5% greater than the travel time in
the Do Minimum, and the absolute change in travel time is greater than one minute.
A series of outputs from the model are presented in Appendices E to I. The output is shown at two
geographical levels: firstly for the area around the east of Wirral, centred on the Dock area, and secondly
showing Wirral as a whole, including adjacent areas of West Cheshire. A plot is provided in Appendix D to
illustrate key road names to aid in the interpretation of the figures.
4.8 Analysis of the Do Minimum
The impact of the Do Minimum developments is shown in Appendix E. It can be seen from the network
plots that by 2014 there are already several links in Wirral that have a volume over capacity ratio (V/C)
exceeding 85%. Whilst a V/C ratio of 100% indicates a road at capacity, anything above 85% is indicative
of a road approaching capacity, where congestion and negative impacts on journey times can be expected.
Comparing the 2014 and 2024 results it is evident that significantly more links pass the 85% threshold at
the later year.
The main point to take from this analysis is that even without the Core Strategy developments there are
areas in Wirral where the road network is forecast to be reaching capacity, with many of these roads
focussed around the Dock area and parts of Birkenhead.
4.9 Flow plots
Output network plots can be found in Appendix F which shows the locations where the traffic flow exceeds
the Do Minimum by 5% and by more than 50 vehicles. Appendix I provides the traffic flow levels for the
2024 forecast year.
There is little impact of the Core Strategy at 2014. By 2024, however it can be seen that in both the AM and
PM peaks, the main focus on traffic growth is the area bounded by the Dock Road to the north, Wallasey

305374/ITD/ITN/001/00D 29 August 2012 305374\Wirral Development_Assessment of Core Strategy_Final Issue.doc
Wirral Development Model Assessment of Wirral Core Strategy Transport Impacts
24
Bridge Road to the west, Hoylake Road, Park Road North, Conway Street to the South and Chester Street
to the east, i.e. immediately surrounding the East and West Float.
There are also material increases in traffic along the radial routes into/out of this area – i.e. the A5027
(Upton Road) and A552 (Borough Road), Mount Road, Church Road, Argyle Street, Old Chester Road,
New Chester Road and the A41 (Rock Ferry Bypass).
There are also sections of the M53 (notably between Junction 10 and Junction 4) that have a greater than
5% increase in traffic growth, although this is reported in the AM peak only.
There is not a material increase in traffic using either of the two Mersey tunnels.
4.10 Volume over Capacity Ratios
Output network plots can be found in Appendix G which shows the links where the volume over capacity
(V/C) in the Core Strategy is greater than 85% where it was less than 85% in the Do Minimum. Appendix I
provides the V/C value for the 2024 forecast year.
At 2014 there are only a handful of locations where this criterion is satisfied.
By 2024 noticeably more locations are identified. In the AM peak, sections of Borough Road (V/C 86%),
Church Road (85%), Old Chester Road (87%) and New Chester Road in Birkenhead (93%). Port Sunlight
(99%) and Eastham (87%) are affected.
Around the East and West Float there are a few locations identified, including, Park Road South (V/C 90%),
Duke Street (88%), Tower Road (97%) and Cleveland Street (85%).
The M53 is not predicted to perform materially worse with the additional traffic, nor are the road tunnels.
In the PM peak, the main impacts are seen around the dock areas, including: Corporation Road (V/C
105%), Wallasey Bridge Road (109%), Dock Road (91%), Duke Street (94%), Park Road North (87%) and
Birkenhead Road (85%).
Hence, in comparison to the Do-Minimum, there are relatively few additional locations where the volume
over capacity ratio is greater than 85% (100% being operating at capacity) with the Core Strategy. This
indicates that the Core Strategy is unlikely to have wide-ranging impacts on the performance of the
highway network over and above what would be expected in the Do Minimum.
4.11 Change in Link Travel Times
Output network plots can be found in Appendix H which shows the links where journey times are expected
to increase by over 5% and one minute in the Core Strategy compared to the Do Minimum. The increment
in journey time is shown in Appendix I for 2024.
At 2014 it can seen that there are virtually no links meeting this criterion; with only a small increase in
number by 2024. The locations affected are broadly consistent those where the link flow increases are at
their greatest – as would be expected.

305374/ITD/ITN/001/00D 29 August 2012 305374\Wirral Development_Assessment of Core Strategy_Final Issue.doc
Wirral Development Model Assessment of Wirral Core Strategy Transport Impacts
25
A development scenario comprising Wirral’s Core Strategy (i.e. Do Something) has been modelled using
the Liverpool City Region Model (LCRTM) and compared to a Do Minimum scenario (i.e. without the Core
Strategy). The assessment has been undertaken at 2014 and 2024 and has focussed on understanding the
additional impact of the Core Strategy over and above that expected from the Do Minimum.
In the first instance it has been shown that in the Do Minimum scenario many roads in the East Wirral area
having a volume over capacity ratio in excess of 85%. This means there are likely to be highway issues to
address even without additional traffic from the Core Strategy developments. The modelling has not taken
into account the highway improvements that might be implemented to mitigate the Do Minimum impacts.
At 2014 the additional impact from the Core Strategy is barely detectable, whilst at 2024 there are areas of
the network that are likely to exhibit noticeable increases in traffic and available capacity compared to the
Do Minimum.
The impact of the Core Strategy is seen most notably in the area immediately surrounding the East and
West Floats and on some of the routes leading into and out of this area. Here, there is the greatest
concentration of roads where the increase in link flow is likely to be in excess of 5% (and 50 vehicles), and
where link travel times are likely to increase by more than 5%.
Where flows are greater than 5%, there is, in general, little additional impact, over the Do Minimum on the
capacity remaining on these roads; however this is not to say that junction delays will be insignificant. A
more detailed modelling approach would be required to examine the operation of junctions in these areas.
However, the model outputs suggest that the “hot-spots” in terms of the additional impact of the Core
Strategy on the highway network performance are likely to be limited to a relatively small area of the
Borough and unlikely to have notable impact on wider road network, including the M53 motorway and both
the Mersey tunnels.
From the modelling work undertaken, it can be concluded that the Core Strategy is likely to impact upon the
performance of the road network mostly within the area around the East and West Floats. It is, however, it
is expected that targeted junction improvements combined with demand management measures such as
enhancements to public transport services would provide mitigation against these impacts. It is anticipated
that the developers wishing to develop the area would contribute to the cost of the improvement measures,
it is anticipated that these measures would be in addition to any improvements that are put in place to
address the impacts of the Do Minimum scenario.
More detailed work, using the East Wirral SATURN model is recommended to establish the level of
highway improvements required, whilst enhancements to the Public Transport Network could be modelled
in LCRTM. The focus of the further modelling work should broadly be focused on the area shown in Figure
5.1.
5. Conclusions

305374/ITD/ITN/001/00D 29 August 2012 305374\Wirral Development_Assessment of Core Strategy_Final Issue.doc
Wirral Development Model Assessment of Wirral Core Strategy Transport Impacts
26
Figure 5.1: Recommended area for detailed modelling of Core Strategy impacts
Area for detailed
modelling

305374/ITD/ITN/001/00D 29 August 2012 305374\Wirral Development_Assessment of Core Strategy_Final Issue.doc
27
Wirral Development Model Assessment of Wirral Core Strategy Transport Impacts
Appendix A. Housing Data _____________________________________________________________________ 28
Appendix B. Employment Forecast _______________________________________________________________ 34
Appendix C. Development Maps_________________________________________________________________ 40
Appendix D. Key to Figures_____________________________________________________________________ 47
Appendix E. Do Minimum Analysis _______________________________________________________________ 50
Appendix F. Flow Changes_____________________________________________________________________ 53
Appendix G. Volume over Capacity Ratio __________________________________________________________ 58
Appendix H. Link Travel Time ___________________________________________________________________ 63
Appendix I. Detailed LCRTM Assignment Outputs __________________________________________________ 68
Appendices

305374/ITD/ITN/001/00D 29 August 2012 305374\Wirral Development_Assessment of Core Strategy_Final Issue.doc
28
Wirral Development Model Assessment of Wirral Core Strategy Transport Impacts
Table A.1: Housing Data – Do Minimum
Zone No. of units 2008-2014 No. of units 2014- 2024 Total: 2008-2024
1 2 4 6
2 1 2 3
4 5 8 13
5 18 30 48
9 4 6 10
10 3 4 7
11 8 14 22
12 0 0 1
13 4 6 10
14 1 1 2
16 38 63 102
17 27 45 71
18 3 5 8
19 1 2 3
20 5 9 14
22 4 7 11
23 283 471 754
24 17 29 47
25 151 252 404
26 183 306 489
27 2 4 6
28 0 1 1
29 26 44 70
30 1 2 3
31 2 3 4
32 8 13 22
33 23 39 62
34 11 18 28
35 7 12 19
36 14 23 36
37 6 10 16
38 3 6 9
39 1 1 1
40 2 3 4
41 6 10 16
42 3 5 8
43 1 1 2
50 146 243 389
51 9 16 25
52 21 35 55
54 64 107 172
57 1 1 2
Appendix A. Housing Data

305374/ITD/ITN/001/00D 29 August 2012 305374\Wirral Development_Assessment of Core Strategy_Final Issue.doc
29
Wirral Development Model Assessment of Wirral Core Strategy Transport Impacts
Zone No. of units 2008-2014 No. of units 2014- 2024 Total: 2008-2024
58 17 29 46
59 4 7 12
60 14 23 37
61 27 44 71
62 11 19 30
63 3 4 7
64 1 2 3
65 8 13 20
66 11 18 28
67 7 12 20
68 6 10 16
69 1 2 4
70 46 76 122
71 16 26 42
72 10 17 27
73 0 1 1
74 3 5 8
75 4 6 9
76 3 5 8
77 6 10 15
78 7 12 20
79 0 0 0
82 33 55 88
85 2 4 6
86 2 3 5
88 22 36 58
89 80 134 214
90 51 86 137
91 13 21 34
92 112 187 299
93 7 12 19
94 10 16 26
95 24 39 63
97 38 63 101
98 11 18 29
100 6 10 15
101 1 1 2
102 13 22 35
103 43 71 114
104 95 159 254
105 51 85 136
106 13 22 35
108 2 4 6
113 1 1 2

305374/ITD/ITN/001/00D 29 August 2012 305374\Wirral Development_Assessment of Core Strategy_Final Issue.doc
30
Wirral Development Model Assessment of Wirral Core Strategy Transport Impacts
Zone No. of units 2008-2014 No. of units 2014- 2024 Total: 2008-2024
114 2 3 5
115 1 2 3
116 10 17 28
117 1 1 2
118 9 14 23
119 3 5 9
120 65 109 174
121 7 12 19
122 21 35 56
123 5 9 14
125 18 30 49
126 1 2 4
127 8 13 21
128 49 81 130
129 3 6 9
131 6 10 16
132 4 6 10
133 5 9 14
134 0 0 0
135 5 8 12
136 14 23 37
137 19 32 51
138 20 33 53
139 33 54 87
140 30 50 80
141 2 4 6
145 3 5 8
147 2 3 5
148 8 14 22
149 10 16 26
150 3 5 8
151 61 101 162
152 2 3 5
154 20 34 54
Grand Total 2400 4000 6400

305374/ITD/ITN/001/00D 29 August 2012 305374\Wirral Development_Assessment of Core Strategy_Final Issue.doc
31
Wirral Development Model Assessment of Wirral Core Strategy Transport Impacts
Table A.2: Housing Data – Do Something
Zone No. of units 2008-2014 No. of units 2014- 2024 Total: 2008-2024
1 0 9 9
2 2 4 6
4 33 29 62
5 10 302 312
9 7 22 29
10 3 9 12
11 38 12 50
12 0 2 2
13 33 9 42
14 6 1 7
16 175 49 224
17 131 37 168
18 2 11 13
19 4 4 8
20 6 19 25
22 39 11 49
23 510 3318 3828
24 0 133 133
25 273 1773 2046
26 131 629 760
27 5 7 12
28 1 1 2
29 61 19 80
30 1 5 6
31 13 7 20
32 23 17 39
33 104 16 120
34 52 36 88
35 51 13 64
36 111 27 139
37 8 10 18
38 8 15 23
39 0 4 4
40 11 3 14
41 21 5 26
42 10 8 18
43 2 1 3
50 0 696 696
51 0 44 44
52 30 8 38
54 131 88 219
57 2 2 4
58 30 6 36

305374/ITD/ITN/001/00D 29 August 2012 305374\Wirral Development_Assessment of Core Strategy_Final Issue.doc
32
Wirral Development Model Assessment of Wirral Core Strategy Transport Impacts
Zone No. of units 2008-2014 No. of units 2014- 2024 Total: 2008-2024
59 19 4 23
60 11 3 14
61 13 3 16
62 19 15 34
63 6 4 10
64 1 0 1
65 27 28 55
66 49 20 69
67 25 23 48
68 13 3 17
69 1 0 1
70 62 14 76
71 22 8 30
72 14 6 21
73 1 1 2
74 12 3 15
75 8 2 10
76 21 5 26
77 65 16 81
78 44 16 60
79 3 0 3
82 153 67 220
84 7 0 7
85 2 7 9
86 6 2 8
88 77 2 79
89 30 8 38
90 41 15 56
91 39 8 47
92 95 21 116
93 13 12 25
94 16 14 30
95 2 1 3
97 186 46 232
98 28 7 35
100 9 2 11
101 1 0 1
102 27 29 56
103 35 17 52
104 20 46 66
105 44 67 111
106 25 7 32
108 1 4 5
112 1 0 1

305374/ITD/ITN/001/00D 29 August 2012 305374\Wirral Development_Assessment of Core Strategy_Final Issue.doc
33
Wirral Development Model Assessment of Wirral Core Strategy Transport Impacts
Zone No. of units 2008-2014 No. of units 2014- 2024 Total: 2008-2024
113 2 0 2
114 1 0 1
115 1 0 1
116 7 7 14
117 2 0 2
118 6 1 7
119 6 1 7
120 29 114 144
121 0 20 20
122 44 16 60
123 14 3 17
125 69 17 86
126 2 1 3
127 27 3 30
128 112 15 127
129 2 1 3
131 52 10 62
132 5 3 8
133 17 3 20
134 7 0 7
135 16 10 26
136 82 49 131
137 14 66 80
138 56 14 70
139 0 101 101
140 160 71 231
141 8 3 11
144 1 0 1
145 15 4 19
147 8 1 9
148 58 10 68
149 26 10 36
150 21 6 27
151 240 50 290
152 0 7 7
154 10 3 13
Grand 4491 8599 13090

305374/ITD/ITN/001/00D 29 August 2012 305374\Wirral Development_Assessment of Core Strategy_Final Issue.doc
34
Wirral Development Model Assessment of Wirral Core Strategy Transport Impacts
Table B.1: Do Minimum: Total Employment Forecast
Model Zone 2008-2014 2014-2024 Total: 2008-2024
1 119 67 187
2 6 20 26
3 36 102 138
4 23 38 60
5 39 65 104
6 73 123 196
8 6 10 16
9 70 118 188
10 32 52 84
12 115 0 115
14 138 311 449
15 282 471 752
16 41 0 41
23 221 369 590
24 36 59 95
25 107 179 286
26 136 226 363
27 1 2 3
28 24 40 63
29 7 11 18
30 70 117 187
36 5 0 5
39 25 176 201
40 0 1 1
43 82 138 220
44 151 253 404
45 6 11 17
46 40 66 106
47 216 360 575
50 356 593 949
52 26 43 68
54 58 97 155
55 58 97 155
59 19 31 49
65 1 1 2
68 18 3 21
69 17 0 17
71 3 0 3
72 0 16 16
75 0 8 8
79 0 36 36
83 524 0 524
Appendix B. Employment Forecast

305374/ITD/ITN/001/00D 29 August 2012 305374\Wirral Development_Assessment of Core Strategy_Final Issue.doc
35
Wirral Development Model Assessment of Wirral Core Strategy Transport Impacts
Model Zone 2008-2014 2014-2024 Total: 2008-2024
84 3 5 8
85 37 60 97
88 38 63 101
89 192 319 511
90 7 1 8
91 67 0 67
94 1 1 2
96 118 196 313
100 0 1 1
102 9 16 25
103 7 143 150
105 75 0 75
106 15 0 15
108 18 31 48
109 94 156 250
112 30 50 79
121 447 745 1192
122 0 1 1
124 635 1059 1693
125 42 55 97
128 436 726 1162
129 76 128 204
134 0 39 39
136 3 1 4
138 725 1205 1930
153 243 405 648
Total 6497 9712 16209

305374/ITD/ITN/001/00D 29 August 2012 305374\Wirral Development_Assessment of Core Strategy_Final Issue.doc
36
Wirral Development Model Assessment of Wirral Core Strategy Transport Impacts
Table B.2: Do Minimum: Retail Employment Forecast
Model Zone 2008-2014 2014-2024 Total: 2008-2024
1 115 60 174
2 10 10
3 43 43
12 115 115
14 82 82
16 41 41
36 5 5
39 25 176 201
68 16 16
69 17 17
71 3 3
72 16 16
75 7 7
79 35 35
83 368 368
90 6 6
91 67 67
103 7 142 149
105 75 75
106 15 15
125 9 9
134 39 39
136 3 3
138 2 2
Total 886 609 1495

305374/ITD/ITN/001/00D 29 August 2012 305374\Wirral Development_Assessment of Core Strategy_Final Issue.doc
37
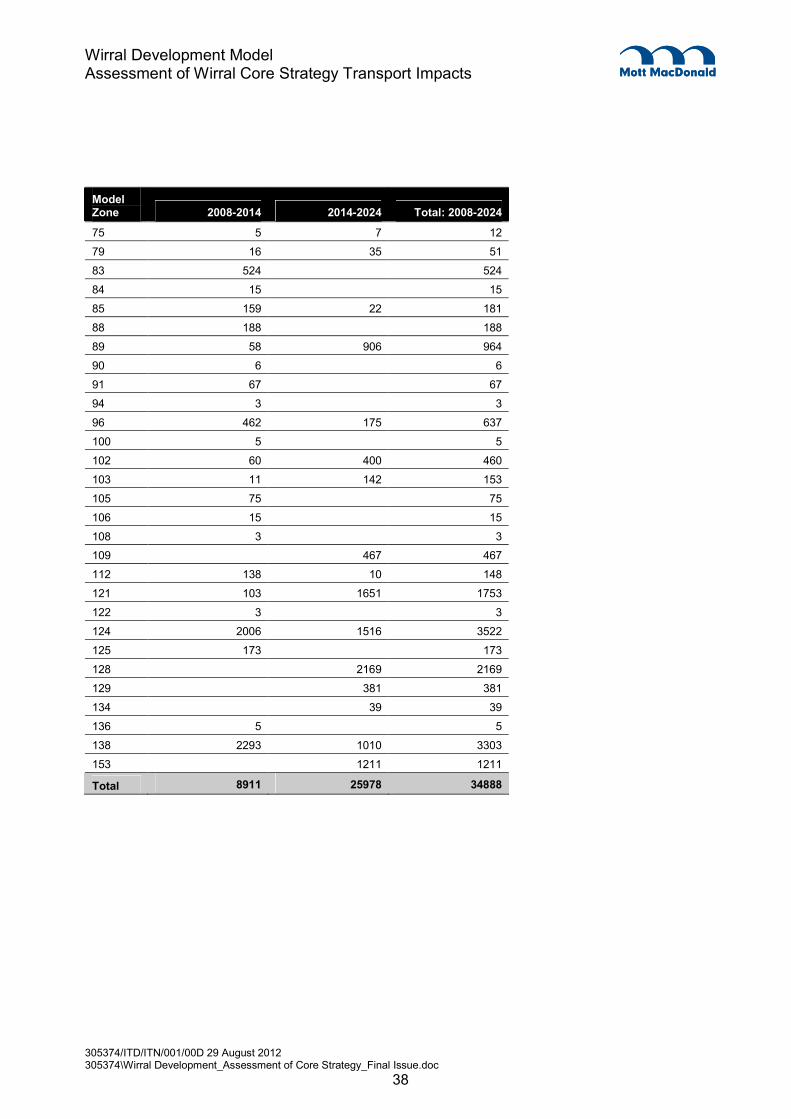
Wirral Development Model Assessment of Wirral Core Strategy Transport Impacts
Table B.3: Do Something: Total Employment Forecast
Model Zone 2008-2014 2014-2024 Total: 2008-2024
1 138 60 198
2 28 40 68
3 57 216 273
4 18 62 81
5 1513 1513
6 365 365
7 1319 1319
8 19 19
9 266 2 268
10 40 103 143
12 115 115
14 15 309 324
15 193 1211 1404
16 41 41
23 116 1178 1294
24 116 1178 1294
25 116 1178 1294
26 116 1178 1294
27 10 10
28 22 97 119
29 0 0
30 120 227 347
36 5 5
39 25 176 201
40 7 7
43 23 397 420
44 77 678 755
45 32 32
46 198 198
47 644 644
49 1666 1666
50 1772 1772
52 126 126
54 290 290
55 290 290
59 92 92
65 5 5
68 43 43
69 17 17
71 3 3
72 16 16
305374/ITD/ITN/001/00D 29 August 2012 305374\Wirral Development_Assessment of Core Strategy_Final Issue.doc
38
Wirral Development Model Assessment of Wirral Core Strategy Transport Impacts
Model Zone 2008-2014 2014-2024 Total: 2008-2024
75 5 7 12
79 16 35 51
83 524 524
84 15 15
85 159 22 181
88 188 188
89 58 906 964
90 6 6
91 67 67
94 3 3
96 462 175 637
100 5 5
102 60 400 460
103 11 142 153
105 75 75
106 15 15
108 3 3
109 467 467
112 138 10 148
121 103 1651 1753
122 3 3
124 2006 1516 3522
125 173 173
128 2169 2169
129 381 381
134 39 39
136 5 5
138 2293 1010 3303
153 1211 1211
Total 8911 25978 34888

305374/ITD/ITN/001/00D 29 August 2012 305374\Wirral Development_Assessment of Core Strategy_Final Issue.doc
39
Wirral Development Model Assessment of Wirral Core Strategy Transport Impacts
Table B.4: Do Something: Retail Employment Forecast
Model Zone 2008-2014 2014-2024 Total: 2008-2024
1 115 60 174
2 10 10
3 43 43
5 118 118
7 118 118
12 115 115
14 82 82
16 41 41
23 16 105 120
24 16 105 120
25 16 105 120
26 16 105 120
36 5 5
39 25 176 201
68 16 16
69 17 17
71 3 3
72 16 16
75 7 7
79 35 35
83 368 368
90 6 6
91 67 67
103 7 142 149
105 75 75
106 15 15
125 9 9
134 39 39
136 3 3
138 2 2
Total 949 1263 2212

305374/ITD/ITN/001/00D 29 August 2012 305374\Wirral Development_Assessment of Core Strategy_Final Issue.doc
40
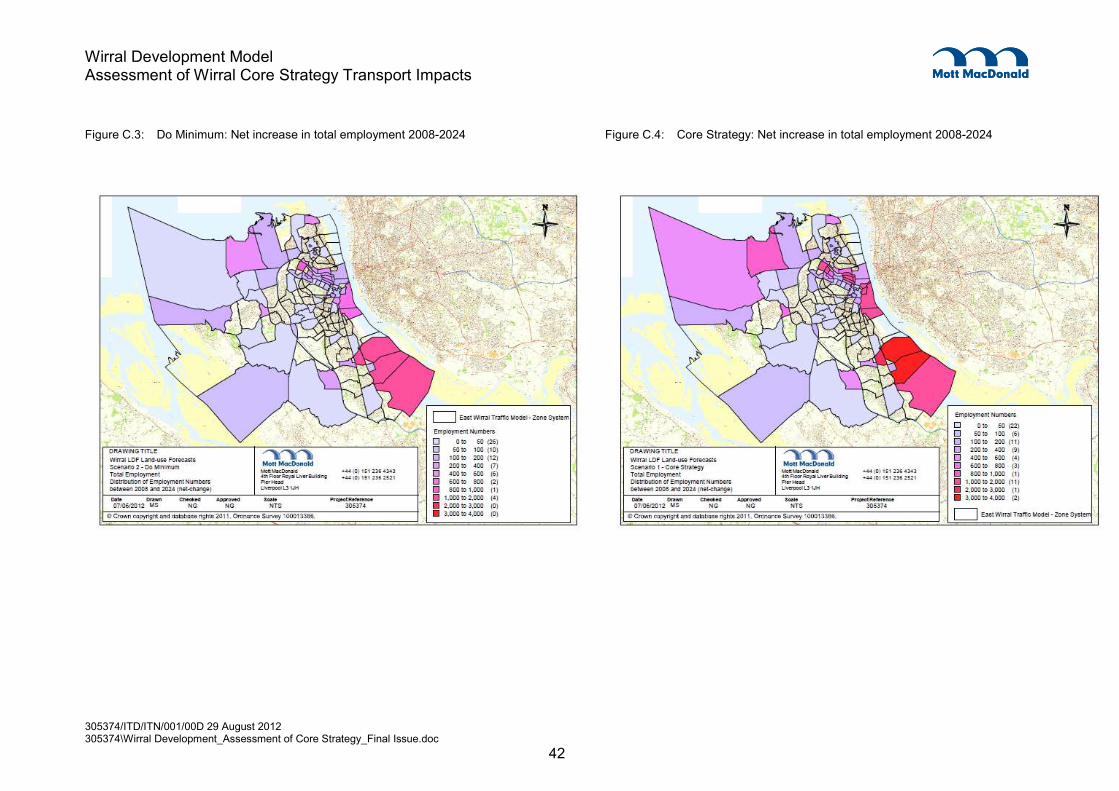
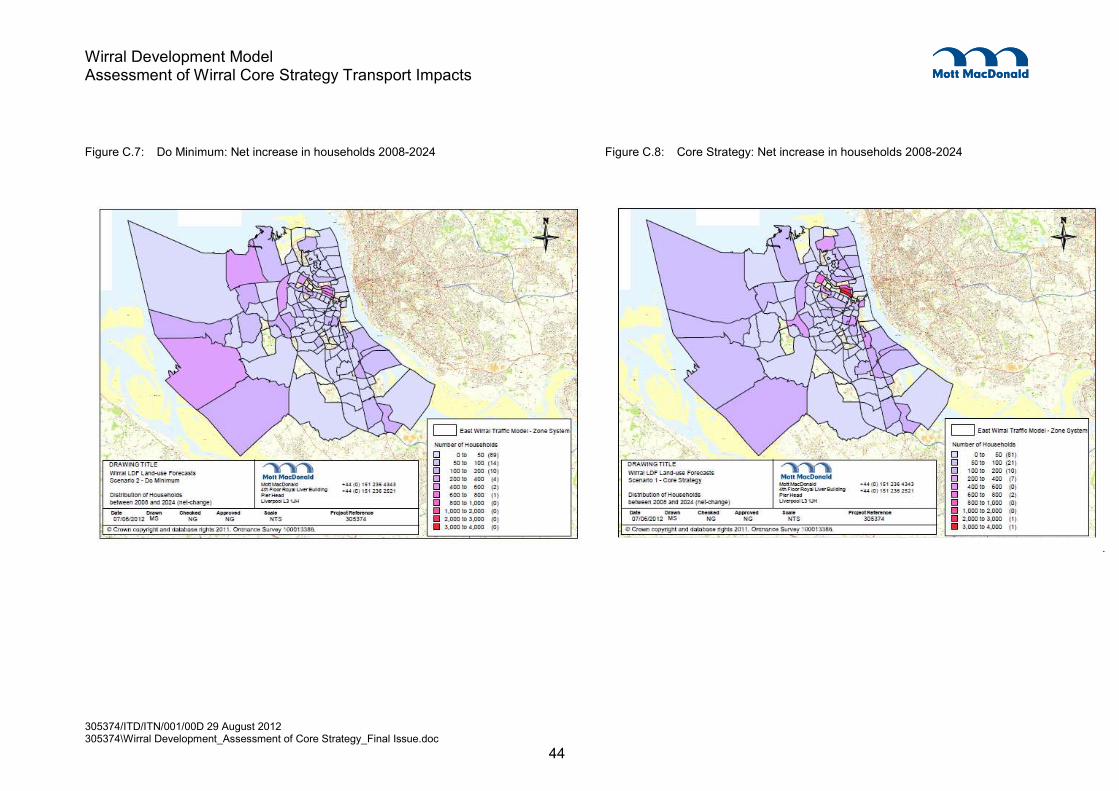
Wirral Development Model Assessment of Wirral Core Strategy Transport Impacts
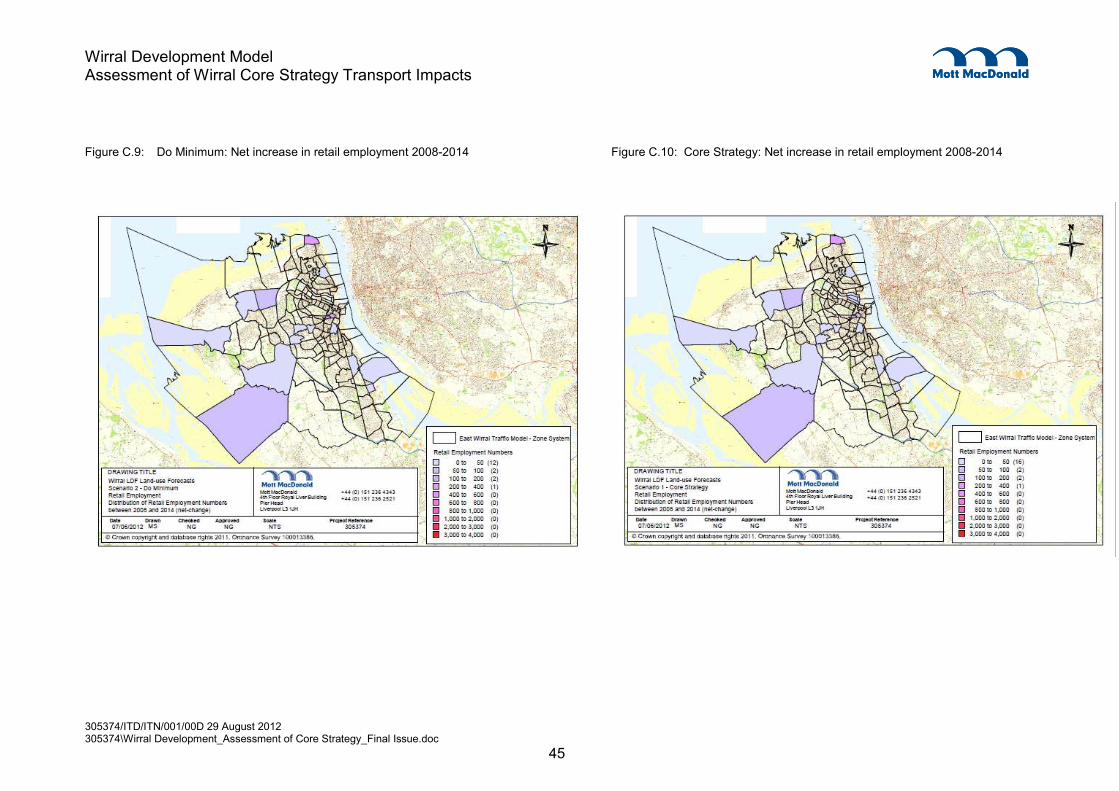
In this appendix plots are provided showing the location and size of the developments tested under the
Core Strategy and Do Minimum scenarios.
The developments are plotted in their respective East Wirral Traffic Model zone and the size (in terms of
number of households or employment numbers) is represented by means of a graded colour scale.
Appendix C. Development Maps

305374/ITD/ITN/001/00D 29 August 2012 305374\Wirral Development_Assessment of Core Strategy_Final Issue.doc
41
Wirral Development Model Assessment of Wirral Core Strategy Transport Impacts
Figure C.1: Do Minimum: Net increase in total employment 2008-2014 Figure C.2: Core Strategy: Net increase in total employment 2008-2014
305374/ITD/ITN/001/00D 29 August 2012 305374\Wirral Development_Assessment of Core Strategy_Final Issue.doc
42
Wirral Development Model Assessment of Wirral Core Strategy Transport Impacts
Figure C.3: Do Minimum: Net increase in total employment 2008-2024 Figure C.4: Core Strategy: Net increase in total employment 2008-2024

305374/ITD/ITN/001/00D 29 August 2012 305374\Wirral Development_Assessment of Core Strategy_Final Issue.doc
43
Wirral Development Model Assessment of Wirral Core Strategy Transport Impacts
Figure C.5: Do Minimum: Net increase in households 2008-2014 Figure C.6: Core Strategy: Net increase in households 2008-2014
305374/ITD/ITN/001/00D 29 August 2012 305374\Wirral Development_Assessment of Core Strategy_Final Issue.doc
44
Wirral Development Model Assessment of Wirral Core Strategy Transport Impacts
Figure C.7: Do Minimum: Net increase in households 2008-2024 Figure C.8: Core Strategy: Net increase in households 2008-2024
305374/ITD/ITN/001/00D 29 August 2012 305374\Wirral Development_Assessment of Core Strategy_Final Issue.doc
45
Wirral Development Model Assessment of Wirral Core Strategy Transport Impacts
Figure C.9: Do Minimum: Net increase in retail employment 2008-2014 Figure C.10: Core Strategy: Net increase in retail employment 2008-2014

305374/ITD/ITN/001/00D 29 August 2012 305374\Wirral Development_Assessment of Core Strategy_Final Issue.doc
46
Wirral Development Model Assessment of Wirral Core Strategy Transport Impacts
Figure C.11: Do Minimum: Net increase in retail employment 2008-2024 Figure C.12: Core Strategy: Net increase in retail employment 2008-2024

305374/ITD/ITN/001/00D 29 August 2012 305374\Wirral Development_Assessment of Core Strategy_Final Issue.doc
47
Wirral Development Model Assessment of Wirral Core Strategy Transport Impacts
Figures D.1 and D.2 show a selection of key road names in Wirral in relation to LCRTM’s representation of
the road network. These images are provided to aid readers in the interpretation of subsequent illustrations.
Appendix D. Key to Figures

305374/ITD/ITN/001/00D 29 August 2012 305374\Wirral Development_Assessment of Core Strategy_Final Issue.doc
48
Wirral Development Model
Figure D.1: Key Road Names – Dock Area
A554 King's Parade
A554 Seabank Road
A551 Leasowe Road
Rock Ferry Bypass
A554 Tower RoadM53
A5027 Upton
A552 Woodchurch
M53
M53
Lever
Causeway
Argyle Street
New Chester Road
Conway Street
Mount Road
Wallasey Bridge Road
Dock Road
Park Road North
Chester Street
A553 Hoylake RoadCoorporation Street
Duke Street
Laird Street
Church Road
Old Chester Road
Exmouth Street
Cleveland Street
Park Road South
Hoylake Road
Borough Road
A551 Liscard Road
M53
Birkenhead Road

305374/ITD/ITN/001/00D 29 August 2012 305374\Wirral Development_Assessment of Core Strategy_Final Issue.doc
49
Wirral Development Model
Figure D.2: Key Road Names - Wirral

305374/ITD/ITN/001/00D 29 August 2012 305374\Wirral Development_Assessment of Core Strategy_Final Issue.doc
50
Wirral Development Model Assessment of Wirral Core Strategy Transport Impacts
The following plots show where the link volume over capacity (V/C) ratio in the Do Minimum scenario
exceeds 85%.
Links meeting this criterion are highlighted by thick red lines.
Figures E.1 and E.2 refer to the AM peak at 2014 and 2024 respectively
Figures E.3 and E.4 refer to the PM peak at 2014 and 2024 respectively.
Appendix E. Do Minimum Analysis

305374/ITD/ITN/001/00D 29 August 2012 305374\Wirral Development_Assessment of Core Strategy_Final Issue.doc
51
Wirral Development Model
Figure E.1: 2014 AM Do Minimum. Links where V/C >85% Figure E.2: 2024 AM Do Minimum. Links where V/C >85%

305374/ITD/ITN/001/00D 29 August 2012 305374\Wirral Development_Assessment of Core Strategy_Final Issue.doc
52
Wirral Development Model
Figure E.3: 2014 PM Do Minimum. Links where V/C >85% Figure E.4: 2024 PM Do Minimum. Links where V/C >85%

305374/ITD/ITN/001/00D 29 August 2012 305374\Wirral Development_Assessment of Core Strategy_Final Issue.doc
53
Wirral Development Model Assessment of Wirral Core Strategy Transport Impacts
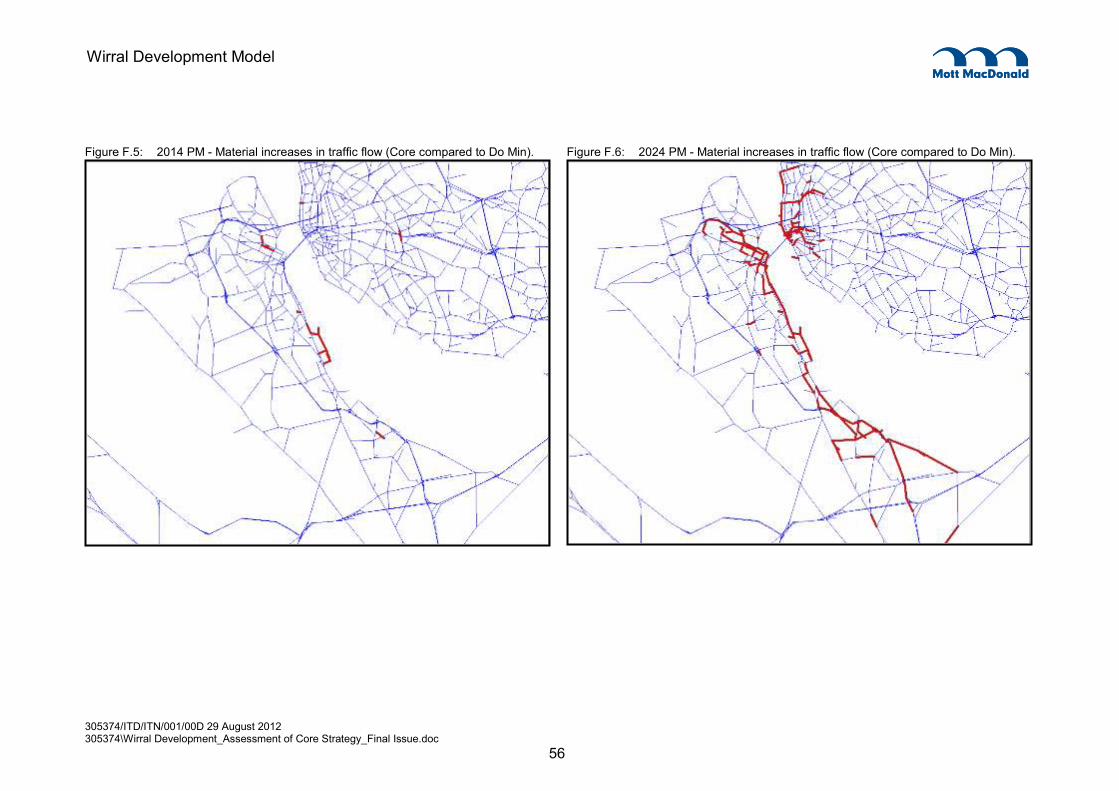
The following plots show where the absolute change in traffic flow as a result of the Core Strategy could be
considered materially significant. This has been based on identifying those links where the increase in
traffic is greater than 5% with a corresponding change in flow of more than 50 vehicles per hour.
Links meeting this criterion are highlighted by thick red lines.
The illustrations are arranged to show the 2014 and 2024 forecasts side by side, for east Wirral and also
centred on the Dock area.
Figures F.1 to F4 refer to the AM peak; Figures F.5 to F.8 refer to the PM peak.
Appendix F. Flow Changes

305374/ITD/ITN/001/00D 29 August 2012 305374\Wirral Development_Assessment of Core Strategy_Final Issue.doc
54
Wirral Development Model
Figure F.1: 2014 AM - Material increases in traffic flow (Core compared to Do Min). Figure F.2: 2024 AM - Material increases in traffic flow (Core compared to Do Min).

305374/ITD/ITN/001/00D 29 August 2012 305374\Wirral Development_Assessment of Core Strategy_Final Issue.doc
55
Wirral Development Model
Figure F.3: 2014 AM - Material increases in traffic flow (Core compared to Do Min). Figure F.4: 2024 AM - Material increases in traffic flow (Core compared to Do Min).
305374/ITD/ITN/001/00D 29 August 2012 305374\Wirral Development_Assessment of Core Strategy_Final Issue.doc
56
Wirral Development Model
Figure F.5: 2014 PM - Material increases in traffic flow (Core compared to Do Min). Figure F.6: 2024 PM - Material increases in traffic flow (Core compared to Do Min).
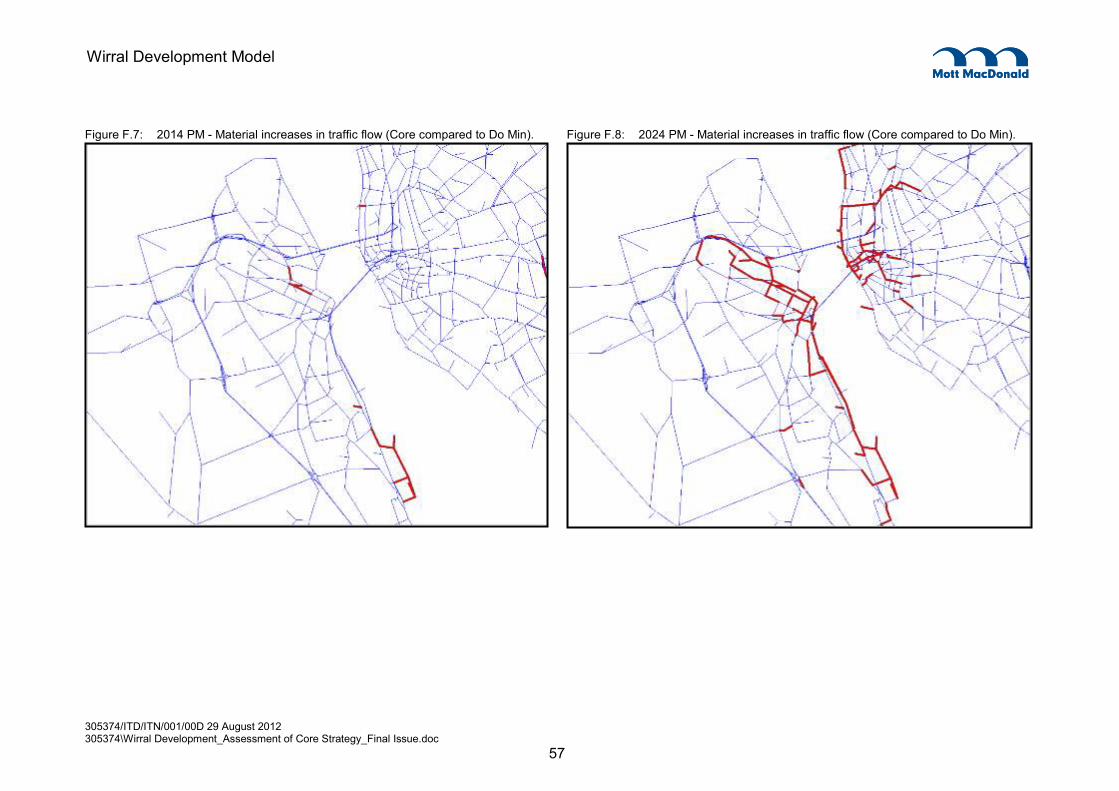
305374/ITD/ITN/001/00D 29 August 2012 305374\Wirral Development_Assessment of Core Strategy_Final Issue.doc
57
Wirral Development Model
Figure F.7: 2014 PM - Material increases in traffic flow (Core compared to Do Min). Figure F.8: 2024 PM - Material increases in traffic flow (Core compared to Do Min).

305374/ITD/ITN/001/00D 29 August 2012 305374\Wirral Development_Assessment of Core Strategy_Final Issue.doc
58
Wirral Development Model Assessment of Wirral Core Strategy Transport Impacts
The following plots show where the volume over capacity (V/C) in the Core Strategy is greater than 85%
when in the Do Minimum it was less than 85%. I.e. the analysis identifies where the implementation of the
Core Strategy is likely to cause a link to become close to capacity.
Links meeting this criterion are highlighted by thick red lines.
The illustrations are arranged to show the 2014 and 2024 forecasts side by side, for east Wirral and also
centred on the Dock area.
Figures G.1 to G4 refer to the AM peak; Figures G.5 to G.8 refer to the PM peak.
Appendix G. Volume over Capacity Ratio

305374/ITD/ITN/001/00D 29 August 2012 305374\Wirral Development_Assessment of Core Strategy_Final Issue.doc
59
Wirral Development Model
Figure G.1: 2014 AM – V/C Core >85% where V/C Do Min <85% Figure G.2: 2024 AM - – V/C Core >85% where V/C Do Min <85%

305374/ITD/ITN/001/00D 29 August 2012 305374\Wirral Development_Assessment of Core Strategy_Final Issue.doc
60
Wirral Development Model
Figure G.3: 2014 AM – V/C Core >85% where V/C Do Min <85% Figure G.4: 2024 AM - – V/C Core >85% where V/C Do Min <85%

305374/ITD/ITN/001/00D 29 August 2012 305374\Wirral Development_Assessment of Core Strategy_Final Issue.doc
61
Wirral Development Model
Figure G.5: 2014 PM – V/C Core >85% where V/C Do Min <85% Figure G.6: 2024 PM – V/C Core >85% where V/C Do Min <85%

305374/ITD/ITN/001/00D 29 August 2012 305374\Wirral Development_Assessment of Core Strategy_Final Issue.doc
62
Wirral Development Model
Figure G.7: 2014 PM – V/C Core >85% where V/C Do Min <85% Figure G.8: 2024 PM – V/C Core >85% where V/C Do Min <85%

305374/ITD/ITN/001/00D 29 August 2012 305374\Wirral Development_Assessment of Core Strategy_Final Issue.doc
63
Wirral Development Model Assessment of Wirral Core Strategy Transport Impacts
The following plots show where the link travel time in the Core Strategy exceeds the Do Minimum travel
time by 5% and the absolute difference is greater than one minute.
Links meeting this criterion are highlighted by thick red lines.
The illustrations are arranged to show the 2014 and 2024 forecasts side by side, for east Wirral and also
centred on the Dock area.
Figures H.1 to H.4 refer to the AM peak; Figures H.5 to H.8 refer to the PM peak.
Appendix H. Link Travel Time

305374/ITD/ITN/001/00D 29 August 2012 305374\Wirral Development_Assessment of Core Strategy_Final Issue.doc
64
Wirral Development Model
Figure H.1: 2014 AM – Increase in link travel time > 5% and 1 Minute Figure H.2: 2024 AM – Increase in link travel time > 5% and 1 Minute

305374/ITD/ITN/001/00D 29 August 2012 305374\Wirral Development_Assessment of Core Strategy_Final Issue.doc
65
Wirral Development Model
Figure H.3: 2014 AM – Increase in link travel time > 5% and 1 Minute Figure H.4: 2024 AM – Increase in link travel time > 5% and 1 Minute

305374/ITD/ITN/001/00D 29 August 2012 305374\Wirral Development_Assessment of Core Strategy_Final Issue.doc
66
Wirral Development Model
Figure H.5: 2014 PM - Increase in link travel time > 5% and 1 Minute Figure H.6: 2024 PM – Increase in link travel time > 5% and 1 Minute

305374/ITD/ITN/001/00D 29 August 2012 305374\Wirral Development_Assessment of Core Strategy_Final Issue.doc
67
Wirral Development Model
Figure H.7: 2014 PM – Increase in link travel time > 5% and 1 Minute Figure H.8: 2024 PM – Increase in link travel time > 5% and 1 Minute

305374/ITD/ITN/001/00D 29 August 2012 305374\Wirral Development_Assessment of Core Strategy_Final Issue.doc
68
Wirral Development Model Assessment of Wirral Core Strategy Transport Impacts
The following plots provide further detail on the comparison of the Do Minimum and Do Something at 2024.
Figures I.1 and I.2 show the traffic flow on those links where the increase in flow is greater than 5% and
the actual increase is greater than 50 vehicles.
Figures I.3 and I.4 show the V/C values on those links where in the Core Strategy the V/C exceeds 85%
but in the Do Minimum was less than 85%.
Figures I.5 and I.6 show the actual change in the link travel time (in minutes) on those links where the
increase in travel time is greater than 5%.
In each case, the links meeting the criteria are highlighted in red.
Appendix I. Detailed LCRTM Assignment Outputs

305374/ITD/ITN/001/00D 29 August 2012 305374\Wirral Development_Assessment of Core Strategy_Final Issue.doc
69
Wirral Development Model Assessment of Wirral Core Strategy Transport Impacts
Figure I.1: Flow Difference 2024 AM

305374/ITD/ITN/001/00D 29 August 2012 305374\Wirral Development_Assessment of Core Strategy_Final Issue.doc
70
Wirral Development Model Assessment of Wirral Core Strategy Transport Impacts
Figure I.2: Flow Difference 2024 PM

305374/ITD/ITN/001/00D 29 August 2012 305374\Wirral Development_Assessment of Core Strategy_Final Issue.doc
71
Wirral Development Model Assessment of Wirral Core Strategy Transport Impacts
Figure I.3: Volume over Capacity: AM 2024

305374/ITD/ITN/001/00D 29 August 2012 305374\Wirral Development_Assessment of Core Strategy_Final Issue.doc
72
Wirral Development Model Assessment of Wirral Core Strategy Transport Impacts
Figure I.4: Volume over Capacity: PM 2024

305374/ITD/ITN/001/00D 29 August 2012 305374\Wirral Development_Assessment of Core Strategy_Final Issue.doc
73
Wirral Development Model Assessment of Wirral Core Strategy Transport Impacts
Figure I.5: Link Travel Time: AM 2024

305374/ITD/ITN/001/00D 29 August 2012 305374\Wirral Development_Assessment of Core Strategy_Final Issue.doc
74
Wirral Development Model Assessment of Wirral Core Strategy Transport Impacts
Figure I.6: Link Travel Time: PM 2024

305374/ITD/ITN/001/00D 29 August 2012 305374\Wirral Development_Assessment of Core Strategy_Final Issue.doc
75
Wirral Development Model Assessment of Wirral Core Strategy Transport Impacts
Page intentionally blank