wisconsin budget policy and poverty in education...about the adequacy of education in the mpcp...
TRANSCRIPT

Forward Institute
2013
Wisconsin Budget Policy
and Poverty in Education A study of the impact of school funding on
educational opportunity
2
Forward Institute Board of Directors
Scott Wittkopf
Meg Turville-Heitz
Julie Wells
Nathaniel Haack
Dylan Brogan
Sara Schulz
Study Author – Scott Wittkopf ([email protected])
Data Analysis and Editor – Kirstie K. Danielson, Ph.D., University of Illinois at
Chicago
Co-Editor – Amy Janczy
Forward Institute thanks Molly A. Hunter, Esq., Director of Education Justice at
the Education Law Center for comments and review of this study.
This study has been funded by a grant from the Andrew T. Wallen Memorial
Education Foundation, Inc.
www.ForwardInstituteWi.org

3
Table of Contents
Executive Summary ....................................................................................................................................... 6
1. Study Overview and Introduction ............................................................................................................. 8
2. Constitutional Background ........................................................................................................................ 8
3. Economic and Budgetary Background ...................................................................................................... 9
4. Education Budget Impact ........................................................................................................................ 13
5. Economically Disadvantaged Enrollment Increases................................................................................ 19
6. Wisconsin School Report Cards .............................................................................................................. 22
7. Test Scores .............................................................................................................................................. 31
8. Private Voucher Schools – “Milwaukee Parental Choice Program” ....................................................... 38
9. Discussion ................................................................................................................................................ 48
10. Current Walker Budget Proposal .......................................................................................................... 51
11. Conclusion ............................................................................................................................................. 55
12. Policy Recommendations ...................................................................................................................... 56
Table of Figures
Figure 1. Employment Levels from 1/08 – 11/12 from Local Area Unemployment Statistics Data ............................ 10
Figure 2. Labor Force Decline from 1/08 – 11/12 ........................................................................................................ 11
Figure 3. Wisconsin Employment Recovery Lagged Behind the National Recovery in 2007-2012 ............................. 12
Figure 4. Shift in School Revenue Share from State Revenue to Local Property Taxes 1999-2011 ............................. 12
Figure 5. Decrease in Total State School Funding and Increase in Economically Disadvantaged Enrollment 1996-
2012 .................................................................................................................................................................... 14
Figure 6. Greater Revenue Reduction Seen in High Poverty Districts than in Low Poverty Districts from 2010-2011
to 2011-2012 School Years ................................................................................................................................. 15
Figure 7. Wisconsin Teacher Position Changes 2008-2009 ......................................................................................... 16
Figure 8. Wisconsin Teacher Position Changes 2009-2010 ......................................................................................... 17
Figure 9. Wisconsin Teacher Position Changes 2010-2011 ......................................................................................... 18
Figure 10. Wisconsin Teacher Position Changes 2011-2012 ....................................................................................... 19
Figure 11. Increase in Economically Disadvantaged Enrollment and Decline in Non-Economically Disadvantaged
Enrollment 2001-2012 ....................................................................................................................................... 20
Figure 12. Fold-Increase in Economically Disadvantaged Enrollment Compared to Fold-Decrease in Non-
Economically Disadvantaged Enrollment (Both Log Scale) ................................................................................. 21
Figure 13. Lower Report Card Scores Associated with Higher Percentage of Economically Disadvantaged
Enrollment, Stratified by Public and Charter Schools ......................................................................................... 23
Figure 14. Low Income Charter Schools Score Significantly Worse than Low Income Public Schools ........................ 24

4
Figure 15. Economically Disadvantaged Enrollment is the Largest Known Factor in Report Card Score Differences
from District to District ....................................................................................................................................... 26
Figure 16. Milwaukee Schools’ Lower Report Card Scores Associated with Higher Percentage Economically
Disadvantaged Enrollment, Stratified by Public and Charter Schools ................................................................ 28
Figure 17. Milwaukee Charter Schools Score Worse on Report Cards than Milwaukee Public Schools in
Economically Disadvantaged Groups .................................................................................................................. 29
Figure 18. Milwaukee Schools Report Card Score Distribution, Stratified by Public and Charter Schools, Expressed
as a Percentage ................................................................................................................................................... 30
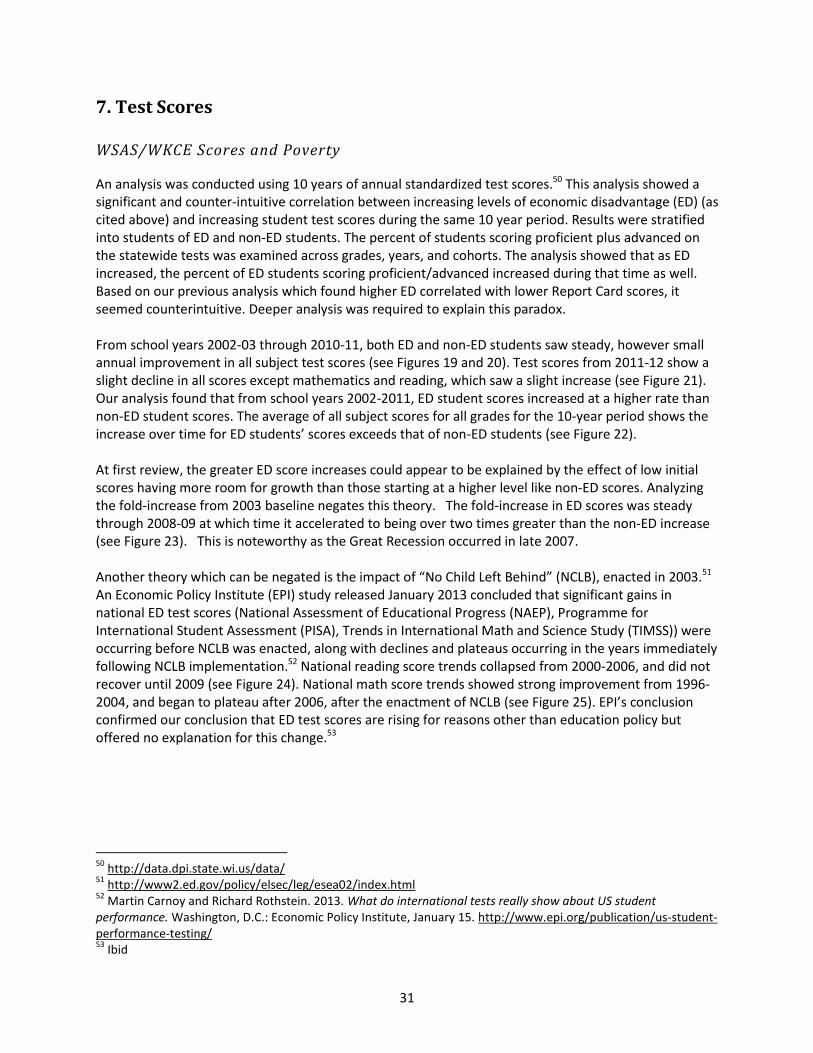
Figure 19. Percent of Economically Disadvantaged (ED) and Non-Economically Disadvantaged Students Scoring
Proficient and Advanced in all Subjects 2002-03 ................................................................................................ 32
Figure 20. Percent of Economically Disadvantaged (ED) and Non-Economically Disadvantaged Students Scoring
Proficient and Advanced in all Subjects 2010-11 ................................................................................................ 32
Figure 21. Percent of Economically Disadvantaged (ED) and Non-Economically Disadvantaged Students Scoring
Proficient and Advanced in all Subjects 2011-12 ................................................................................................ 32
Figure 22. Percent of Students Scoring Proficient and Advanced, Average of all Subjects 2002-03 through 2011-12,
Comparing State Total, Economically and Non-Economically Disadvantaged Scores ........................................ 33
Figure 23. Fold-Change from 2003 Baseline, Students Scoring Proficient and Advanced, Average of All Subjects .... 33
Figure 24. Cumulative Gains in Main NAEP, Long-Term Trend NAEP, and PISA Reading Scores, 1999/2000–2011 ... 34
Figure 25. Cumulative Gains in Main NAEP, Long-Term Trend NAEP, and TIMSS Mathematics Scores, 1995/1996–
2011 .................................................................................................................................................................... 34
Figure 26. Cohorts Advancing Through School Years 2002-2011: Percent of ED Students Scoring Proficient +
Advanced in Mathematics Increases as ED Enrollment Percent Increases......................................................... 35
Figure 27. Cohorts Advancing Through School Years 2002-2011: Percent of ED Students Scoring Proficient +
Advanced in Reading Increases as ED Enrollment Percent Increases ................................................................. 36
Figure 28. Cohorts Advancing Through School Years 2002-2011: Percent of ED Students Scoring Proficient +
Advanced in Science Increases as ED Enrollment Percent Increases .................................................................. 37
Figure 29. Comparison of Annual Income Limits for MPCP Voucher, Reduced, and Free Lunch Programs 2012-2013
............................................................................................................................................................................ 39
Figure 30. MPCP (Voucher School) Revenue per Member Compared With Statewide Public School Revenue per
Member, 1999-00 to 2012-13, in Actual Dollars................................................................................................. 41
Figure 31. MPCP (Voucher School) Revenue per Member Compared With Statewide Public School Revenue per
Member, 1999-00 to 2012-13, Inflation Adjusted Dollars .................................................................................. 42
Figure 32. 2011-12 Percentage of Students Scoring Proficient and Advanced in State Mathematics Standardized
Tests .................................................................................................................................................................... 43
Figure 33. 2011-12 Percentage of Students Scoring Proficient and Advanced in State Reading Standardized Tests . 44
Figure 34. Mean Percentage of Economically Disadvantaged Students Enrolled 2011-2012 by School Type ............ 45
Figure 35. Real Cost Per Pupil to Achieve a Score of Proficient or Advanced on State Math and Reading Tests, All
Grades Tested ..................................................................................................................................................... 46
Figure 36. Two Year Median 10th
Grade Reading and Math Proficiency Rates Compared to On-Time Graduation
Rates, 2010-2012 ................................................................................................................................................ 47
Figure 37. MPCP (Voucher School) Revenue per Member Compared with Statewide Public School Revenue per
Member 1999-2000 to 2013-14 Projected in Actual Dollars Based on Walker Budget Proposal ....................... 53
Figure 38. MPCP (Voucher School) Revenue per Member Compared with Statewide Public School Revenue per
Member 1999-2000 to 2013-2014 Projected in Inflation-Adjusted Dollars Based on Walker Budget Proposal 54

5
Tables
Table 1. Highest Employment Levels from 2011-2012 (green highlight) are 100,000 Jobs Short of Pre-Recession
Employment Levels (yellow highlight) ................................................................................................................ 10
Table 2. Labor Force Decline from Peak in 4/09 to 11/12 is Over 70,000 ................................................................... 11
Table 3. Mean (Standard Deviation) Report Card Scores for Public and Charter Schools, stratified by Tertiles of
Income (Percent of ED Enrollment) .................................................................................................................... 24
Table 4. Real Cost per Pupil to Achieve a Score of Proficient or Advanced on State Math and Reading Tests ........... 46

6
Executive Summary Wisconsin has always been a leader in K-12 public education. We have long valued the right of every child to receive a quality public education. The fundamental nature of our values is reflected in the State Constitution, which guarantees all children equal access to educational opportunity in our public schools. The research presented in this report shows that current fiscal policy and education funding are depriving our poorest students access to a sound public education. Public schools are not failing our children, Wisconsin legislators and policymakers are failing the public schools that serve our children. The public education budget has been subjected to austerity measures over the past two biennial budgets (2009 – 2013) under Governors Doyle and Walker. Unprecedented cuts in state funding and revenue caps have placed many public school districts in fiscal crisis. Inflation-adjusted state funding of public education is at its lowest level in over 17 years. Schools with higher Economically Disadvantaged (ED) enrollment levels have experienced greater cuts in per-pupil funding than the most affluent districts. ED enrollment is on the rise, a result of the deep economic recession from which Wisconsin has been very slow to recover. Nearly half of the children enrolled in public schools are now considered ED, with the largest increases occurring after the Great Recession of 2007. The new School Report Cards released by the Department of Public Instruction (DPI) in late 2012 have a strong correlation to the level of poverty in any given school. Nearly half of the school-to-school difference in Report Card Scores can be explained by the difference in poverty level from school to school. This fact makes any use of the DPI School Report Cards to make significant funding or incentive decisions poor public policy. Analyzing a decade of Wisconsin Student Assessment System (WSAS) and Wisconsin Knowledge and Concepts Examination (WKCE) data revealed a paradox within ED students scoring proficient or advanced. As ED enrollment increased, the percentage of ED students scoring proficient or advanced increased. This was a counter-intuitive result, based on previous research on the impact of poverty on educational outcome. The explanation is found in the large increase in poverty levels during the past decade. Our analysis discovered that as more children dropped into ED due to economic circumstances, they brought their typically higher test scores into the ED group. This has resulted in the false perception that poorer students’ test scores have been rising. Our analysis found a striking connection between economic policy and the effect on educational outcome. It also serves as a warning that as ED enrollment approaches 50%, we are seeing a plateau and beginning of a downward trend in ED scores. A student who begins in poverty does not have previously higher scores to bring into a cohort, as we observed over the past decade. Therefore, we can expect to see the achievement gap between ED and non-ED scores increase in the coming decade unless policy addresses the effects of poverty outlined in this report. Test scores for the Milwaukee Parental Choice Program (MPCP) voucher schools raise serious questions about the adequacy of education in the MPCP schools, and the overall educational value to the state of Wisconsin. MPCP school students underperform Milwaukee Public Schools (MPS) students on the WSAS/WKCE tests, with a lower percentage of students scoring proficient or advanced. In spite of much lower rates of students scoring proficient and advanced, voucher schools have higher graduation rates based on the most recent two years’ raw data from all voucher and MPS schools.
7
Our “graduation:proficiency ratio” measures the number of students graduating compared to the number who are proficient in a tested subject. The statewide reading graduation:proficency ratio is about 1:1. The MPS ratio is about 2:1. The voucher school ratio is over 20:1. That means over 20 children graduate for every child proficient in 10th grade reading. It is widely accepted that if a student does not test proficient in reading by grade 10, they will not likely be proficient by graduation.1 This raises great concern surrounding the adequacy of education provided in private voucher schools, and hidden higher costs to taxpayers for poorer student outcomes. Based on the current education budget proposal submitted by Governor Walker, this study addresses the following concerns: 1. School Funding – The proposed budget would freeze the local tax levy in public school districts for the 2013-15 biennium. In what Governor Walker has called “a step closer to funding parity,” public and charter schools will see a 1% increase per pupil in state funding. Voucher schools will receive an increase of 9.4% (K-8 schools), and an increase of 22% (high schools) per pupil in state funding. 2. Voucher School Expansion – Governor Walker proposes to expand voucher schools into districts where School Report Card scores “fail to meet expectations.” This proposal will assure that schools and districts of high ED will lose resources. School Report Card scores are directly correlated to level of ED. The districts with underperforming schools are therefore districts with schools of higher ED. Funding to operate the voucher school expansion will come directly out of those public schools of highest ED, and be put into schools which do not serve as large a proportion of high poverty students. 3. K-12 Performance Incentive Program –
Reward High-Performing Schools: $24 million will be awarded to schools with grades of “significantly exceeds expectations” or “exceeds expectations.” A total of $30 million will be awarded to schools that improve Report Card scores by at least three points over the prior year.
Help Under-Performing Schools: $10 million will be available as competitive grant funding for school districts that present innovative plans to turn around failing schools.
School Report Card scores are so strongly correlated to level of ED enrollment that this proposal stands to exacerbate a distinct dichotomy of schools; those of poverty and those of non-poverty. Schools of ED would be faced with further challenges to educating children of poverty, if not becoming threatened outright with closure.
This report documents in detail that the resources being afforded schools and students of poverty are insufficient, and indeed are facing further reduction. Moreover, the resources being diverted from schools of poverty into non-traditional alternative education programs are producing questionable results with little to no accountability for the funding they receive. Any process or method which would serve to evaluate teachers, schools, and students must take into account the impact of poverty on students and education, as a matter of equal opportunity to a sound, basic education. The failure of Wisconsin policy - makers to acknowledge and address these issues is creating a generation of ED students that will lag far behind their more fortunate peers. In short, public schools are not failing Wisconsin’s children, Wisconsin legislators and policymakers are failing the public schools that serve Wisconsin’s children.
1 http://www.ednewscolorado.org/wp-content/uploads/2012/06/ReichardtReport60712.pdf

8
1. Study Overview and Introduction This study will examine the effects of recent biennial budgets passed in 2009-2011, 2011-2013, and projected 2013-15 on K-12 education in Wisconsin. The report will specifically focus on the question, “Does current fiscal policy and education funding provide equal educational opportunity and adequate educational access to children of poverty?” This study will also examine the question, “Do recent funding proposals linking school funding to student performance single out schools in areas of poverty, creating two separate classes of schools – those impacted by poverty and those not impacted by poverty?”
2. Constitutional Background Article X (2), Section 3 of the Wisconsin Constitution states, “The legislature shall provide by law for the establishment of district schools, which shall be as nearly uniform as practicable.”2 In addition, Wisconsin State Statute 121.01 declares “…that in order to provide reasonable equality of educational opportunity for all the children of this state, the state must guarantee that a basic educational opportunity be available to each pupil.”3 (Emphasis added) The necessity of equality and access to a quality public education under the Fourteenth Amendment to the United States Constitution was recognized in Chief Justice Earl Warren’s landmark opinion in Brown v. Board of Education (1954):
“Today, education is perhaps the most important function of state and local governments. Compulsory school attendance laws and the great expenditures for public education both demonstrate our recognition of the importance of education to our democratic society…It is the very foundation of good citizenship. Today, it is a principal instrument in awakening the child to cultural values, in preparing (them) for later professional training, and in helping (them) to adjust normally to (their) environment. In these days, it is doubtful that any child may be reasonably expected to succeed in life if (they) are denied the opportunity of an education. Such an opportunity, where the state has undertaken to provide it, is a right which must be made available to all on equal terms.”4 (Emphasis added)
Two recent cases heard in the Wisconsin State Supreme Court have challenged the constitutionality of the state’s school finance system on uniformity and equal protection grounds. In Kukor v. Grover (1989) and Vincent v. Voight (2000), the High Court found that the school funding system in Wisconsin is constitutional on similar grounds.5 In Kukor v. Grover, the Court acknowledged “educational overburden” in certain areas of poverty, but that the state’s system of aid equalization was sufficient under the constitutional mandate for schools to be "as nearly uniform as practicable." The Court did, however, recognize equal opportunity for a sound basic education as a fundamental right, and that plaintiffs failed to prove that students of poverty are denied their right to a “sound basic education” by the current school finance system.6
2 http://legis.wisconsin.gov/rsb/unannotated_wisconst.pdf
3 http://docs.legis.wisconsin.gov/statutes/statutes/121/II/01
4 http://www.nationalcenter.org/brown.html
5 http://www.educationjustice.org/states/wisconsin.html
6 Ibid

9
In Vincent v. Voight, the Court again recognized the constitutional right to “an equal opportunity for a sound basic education,” but that plaintiffs failed to present evidence that "any children lack a basic education in any school district," that is, an "adequacy" claim.7 The Court further defined what is meant by the term “sound basic education,” clarifying the standard to be applied: "An equal opportunity for a sound basic education is one that will equip students for their roles as citizens and enable them to succeed economically and personally. The legislature has articulated a standard for equal opportunity for a sound basic education in Wis. Stat. §§ 118.30(1g)(a) and 121.02(L) (1997-98) as the opportunity for students to be proficient in mathematics, science, reading and writing, geography, and history, and for them to receive instruction in the arts and music, vocational training, social sciences, health, physical education and foreign language, in accordance with their age and aptitude. An equal opportunity for a sound basic education acknowledges that students and districts are not fungible and takes into account districts with disproportionate numbers of disabled students, economically disadvantaged students, and students with limited English language skills. So long as the legislature is providing sufficient resources so that school districts offer students the equal opportunity for a sound basic education as required by the constitution, the state school finance system will pass constitutional muster."8 (Emphasis added) Since the 2000 Vincent v. Voight decision, a great deal has changed in Wisconsin state budgeting, public school financing, student poverty, and student performance. The importance of the right to a “sound basic education” is as important today as it was when the state constitution was adopted. Education is undoubtedly one of the key elements to build upward socio-economic mobility for children of poverty.9 In the current economic and educational climate, are children attending school districts in areas of poverty being provided “sufficient resources” for a “sound basic education?” More importantly, is the current system capable of passing the “sound basic education” standard set forth in Vincent v. Voight?
3. Economic and Budgetary Background
Statewide Economics
According to the administration of Governor Scott Walker, Wisconsin entered the 2011-2013 biennium with a projected budget deficit of $3.6 billion.10 While this figure was in dispute during the budget process,11 it was the assumption used in creating the biennial budget, so will be accepted for the purposes of this study. The 2011-2013 budget placed a significant tax burden on lower-middle class and poorer families to offset the $93.3 million in tax credits for large corporations and reductions in capital gains. Earned
7 http://www.educationjustice.org/states/wisconsin.html
8 http://www.wicourts.gov/html/sc/97/97-3174.htm
9http://www.pewtrusts.org/uploadedFiles/wwwpewtrustsorg/Reports/Economic_Mobility/EMP_Intragenerational
%20Mobility_Full%20Report.pdf 10
http://www.doa.state.wi.us/debf/pdf_files/bib1113.pdf, page 2 11
http://www.politifact.com/truth-o-meter/article/2011/mar/03/your-guide-wisconsin-budget-debate/

10
Income Credit and Homestead Tax Credit changes amounted to tax increases of almost $70 million for families of poverty and the lower-middle class working families.12 Wisconsin employment levels failed to recover through 2011 and 2012. In January 2011, at the start of the biennium, Wisconsin needed to gain 100,000 jobs to return to pre-recession levels (not accounting for population growth). As of the end of 2012, halfway through the biennium, only 20,000 jobs had been gained. This represents an 80% deficit in employment levels to return to pre-recession levels (see Table 1 and Figure 1).
Table 1. Highest Employment Levels from 2011-2012 (green highlight) are 100,000 Jobs Short of Pre-Recession Employment Levels (yellow highlight)13
Figure 1. Employment Levels from 1/08 – 11/12 from Local Area Unemployment Statistics Data14
Wisconsin continues to experience a slow, jobless recovery by any measure. Persistent issues plaguing Wisconsin’s economy and workers are recessed wages, low employment, and increased levels of
12
Lang, Robert; Legislative Fiscal Bureau memo to Wisconsin State Legislators, June 13, 2011. Accessed at http://bdgrdemocracy.files.wordpress.com/2011/06/lfb-tax-and-fee-changes.pdf 13
Local Area Unemployment Statistics data accessed at www.bls.gov/data 14
Ibid

11
poverty.15 Even the labor force in Wisconsin has declined by 70,000 since January 2011 (see Table 2 and Figure 2). Table 2. Labor Force Decline from Peak in 4/09 to 11/12 is Over 70,00016
Figure 2. Labor Force Decline from 1/08 – 11/1217
While it is stipulated that employment is largely a component of the broader national economy, Wisconsin has lagged behind the national and regional employment recovery by a significant margin (see red line before and after the Walker Budget in Figure 3).18
15
http://www.cows.org/_data/documents/ex_1280.pdf 16
Local Area Unemployment Statistics data accessed at www.bls.gov/data 17
Ibid 18
http://www.cows.org/wisconsin-job-watch_1

12
Figure 3. Wisconsin Employment Recovery Lagged Behind the National Recovery in 2007-201219
Another significant economic impact in Wisconsin has been the shift in school revenue burden from state general aid to local property tax payers (see Figure 4). In 1999, state revenue accounted for 52.5% while local property taxes accounted for 36.6% of total school funding. In 2011, state revenue accounted for 45.8% and local property taxes accounted for 41.4% of total school funding. The largest shift toward increased property tax levies has taken place since 2008.20 The spike in Federal Revenue 2008-2009 represents the one-time Emergency Stimulus Payment.
Figure 4. Shift in School Revenue Share from State Revenue to Local Property Taxes 1999-2011
19
http://www.cows.org/wisconsin-job-watch_1, used with permission of the author 20
http://data.dpi.state.wi.us/data/MoneyPage.aspx?GraphFile=BlankPageUrl&SCounty=47&SAthleticConf=45&SCESA=05&OrgLevel=st&Qquad=offerings.aspx
0
10
20
30
40
50
60
1999 2000 2001 2002 2003 2004 2005 2006 2007 2008 2009 2010 2011
Rev
enu
e Sh
are
as P
erce
nt
State Revenue Local Property Tax Revenue Federal Revenue
Walker Budget
13
School funding sources have shifted significantly since 2008. The public education financing burden is no longer primarily a state function. The largest portion of education funding is now a function of local property tax and federal aid combined, a significant change from 10 years ago. This recent trend raises the question of compliance under Wisconsin Statute 121.01 on School Financing: “It is declared to be the policy of this state that education is a state function and that some relief should be afforded from the local general property tax as a source of public school revenue where such tax is excessive, and that other sources of revenue should contribute a larger percentage of the total funds needed.” 21
4. Education Budget Impact The two recent state biennial budgets of 2009-2011 (Governor Jim Doyle) and 2011-2013 (Governor Scott Walker) have enacted significant cuts in public education during a time of significant economic recession. Combined with the aforementioned economic factors, unprecedented pressure has been placed on local school districts and families that rely on public education. The Doyle budget (2009-2011) reduced state support of public education by $284 million. This was followed by a reduction of $792 million in the Walker budget (2011-2013). The four year total in cuts to public education in Wisconsin exceeds $1 billion. In addition to the cuts in state aid, the 2011-2013 budget prevented local school districts from making up the difference by raising property taxes. The Walker budget was the first in Wisconsin history to lower the annual property tax revenue limit for local school districts. The 5.5% reduction in the local property tax revenue limit resulted in a $1.6 billion loss in revenue authority to Wisconsin school districts.22 The long-term trend in school funding shows a steady increase in actual spending from $3.57 billion in 1996 to $5.5 billion in 2008. Since 2008, state funding has declined to $4.96 billion in 2012. When adjusted for inflation, state funding in 1996 was $5.24 billion (in 2012 dollars),23 and peaked in 2005 at $6.11 billion. Adjusted state funding declined to $5.5 billion in 2008, and has declined to the 2012 level of $4.96 billion. When adjusted for inflation, Wisconsin is spending less on public education than it has in over 17 years.24 One-time federal stimulus package funds helped offset some of the state funding cuts the first year of the 2011-2013 budget, however, those funds are no longer available.25 The combined cuts in state funding, revenue limit reductions, and expiration of federal stimulus funds have caused fiscal hardship in many local school districts.26 27 28
21
http://docs.legis.wisconsin.gov/statutes/statutes/121/II/01 22
“Making Matters Worse: School Funding, Achievement Gaps and Poverty Under Wisconsin Act 32,” James J. Shaw and Carolyn Kelley, May 4 2012, UW-Madison Educational Leadership and Policy Analysis http://elpa.education.wisc.edu/docs/elpa-documents/shawandkelleypolicybrief.pdf?sfvrsn=2 23
http://www.bls.gov/data/inflation_calculator.htm 24
http://pb.dpi.wi.gov/ 25
Ibid 26
http://www.wsaw.com/home/headlines/Governor_Walkers_Budget_Cuts_Cause_School_Districts_to_Scrimp_140046773.html
14
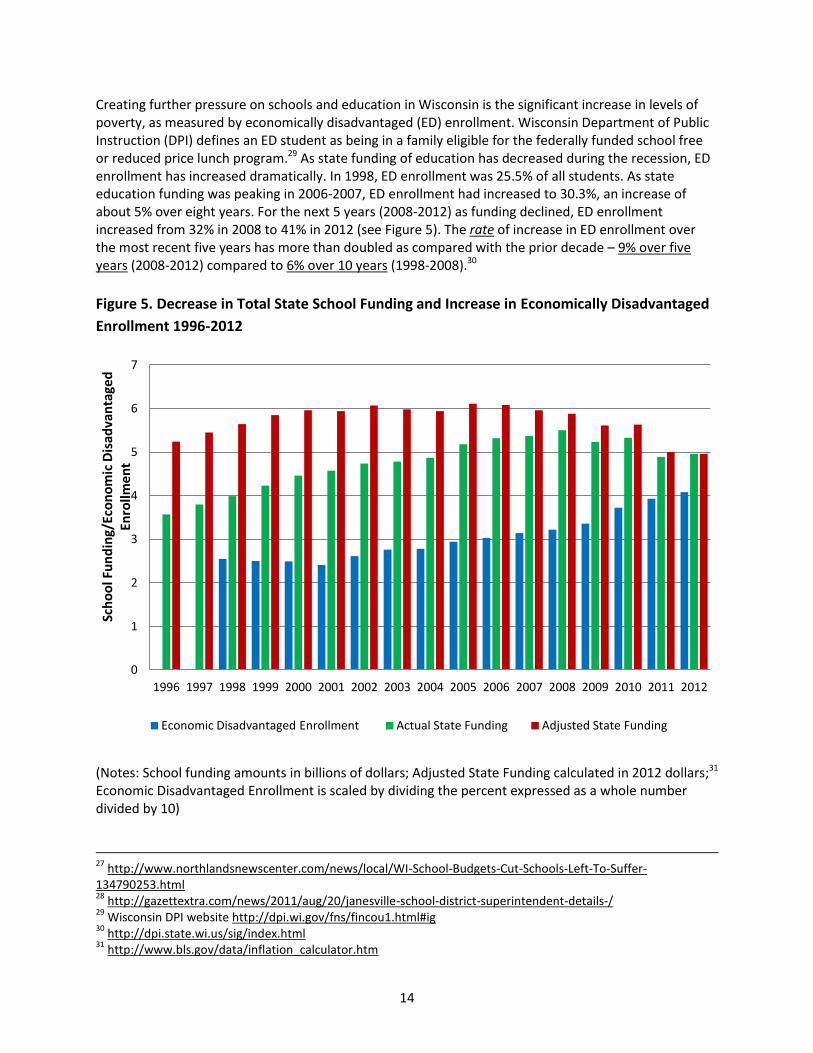
Creating further pressure on schools and education in Wisconsin is the significant increase in levels of poverty, as measured by economically disadvantaged (ED) enrollment. Wisconsin Department of Public Instruction (DPI) defines an ED student as being in a family eligible for the federally funded school free or reduced price lunch program.29 As state funding of education has decreased during the recession, ED enrollment has increased dramatically. In 1998, ED enrollment was 25.5% of all students. As state education funding was peaking in 2006-2007, ED enrollment had increased to 30.3%, an increase of about 5% over eight years. For the next 5 years (2008-2012) as funding declined, ED enrollment increased from 32% in 2008 to 41% in 2012 (see Figure 5). The rate of increase in ED enrollment over the most recent five years has more than doubled as compared with the prior decade – 9% over five years (2008-2012) compared to 6% over 10 years (1998-2008).30
Figure 5. Decrease in Total State School Funding and Increase in Economically Disadvantaged
Enrollment 1996-2012
(Notes: School funding amounts in billions of dollars; Adjusted State Funding calculated in 2012 dollars;31 Economic Disadvantaged Enrollment is scaled by dividing the percent expressed as a whole number divided by 10)
27
http://www.northlandsnewscenter.com/news/local/WI-School-Budgets-Cut-Schools-Left-To-Suffer-134790253.html 28
http://gazettextra.com/news/2011/aug/20/janesville-school-district-superintendent-details-/ 29
Wisconsin DPI website http://dpi.wi.gov/fns/fincou1.html#ig 30
http://dpi.state.wi.us/sig/index.html 31
http://www.bls.gov/data/inflation_calculator.htm
0
1
2
3
4
5
6
7
1996 1997 1998 1999 2000 2001 2002 2003 2004 2005 2006 2007 2008 2009 2010 2011 2012
Sch
oo
l Fu
nd
ing/
Eco
no
mic
Dis
adva
nta
ged
En
rollm
en
t
Economic Disadvantaged Enrollment Actual State Funding Adjusted State Funding
15
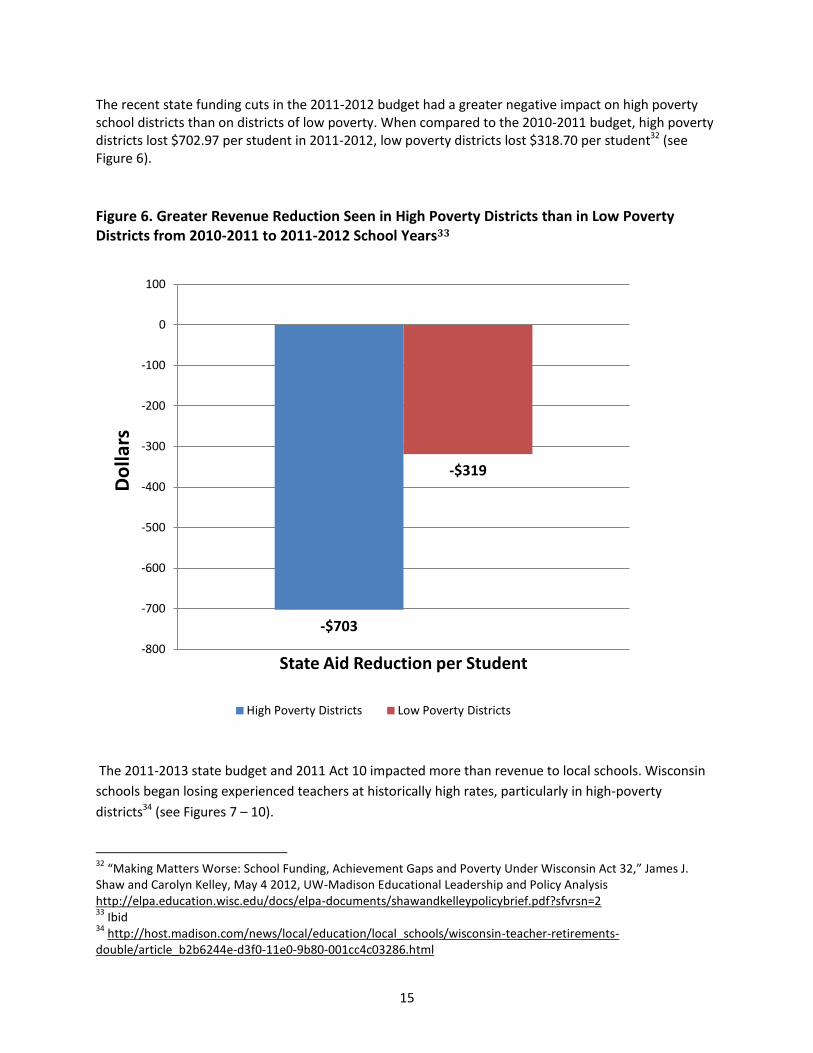
The recent state funding cuts in the 2011-2012 budget had a greater negative impact on high poverty school districts than on districts of low poverty. When compared to the 2010-2011 budget, high poverty districts lost $702.97 per student in 2011-2012, low poverty districts lost $318.70 per student32 (see Figure 6). Figure 6. Greater Revenue Reduction Seen in High Poverty Districts than in Low Poverty Districts from 2010-2011 to 2011-2012 School Years33
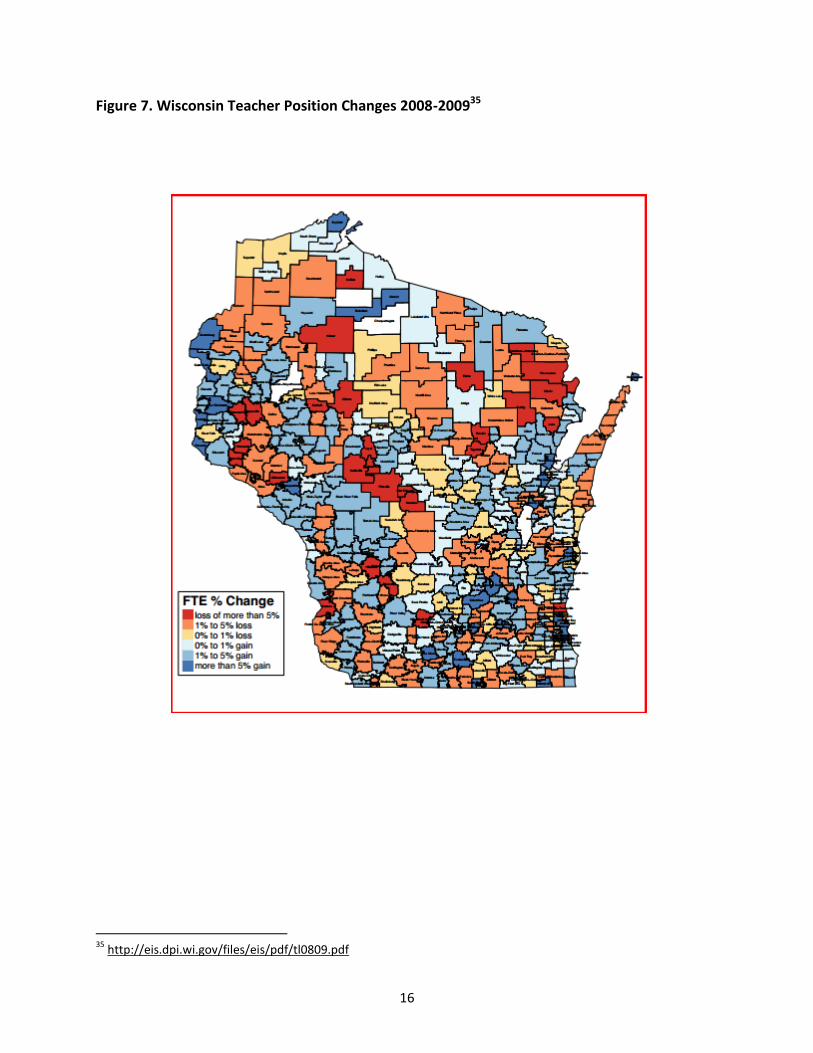
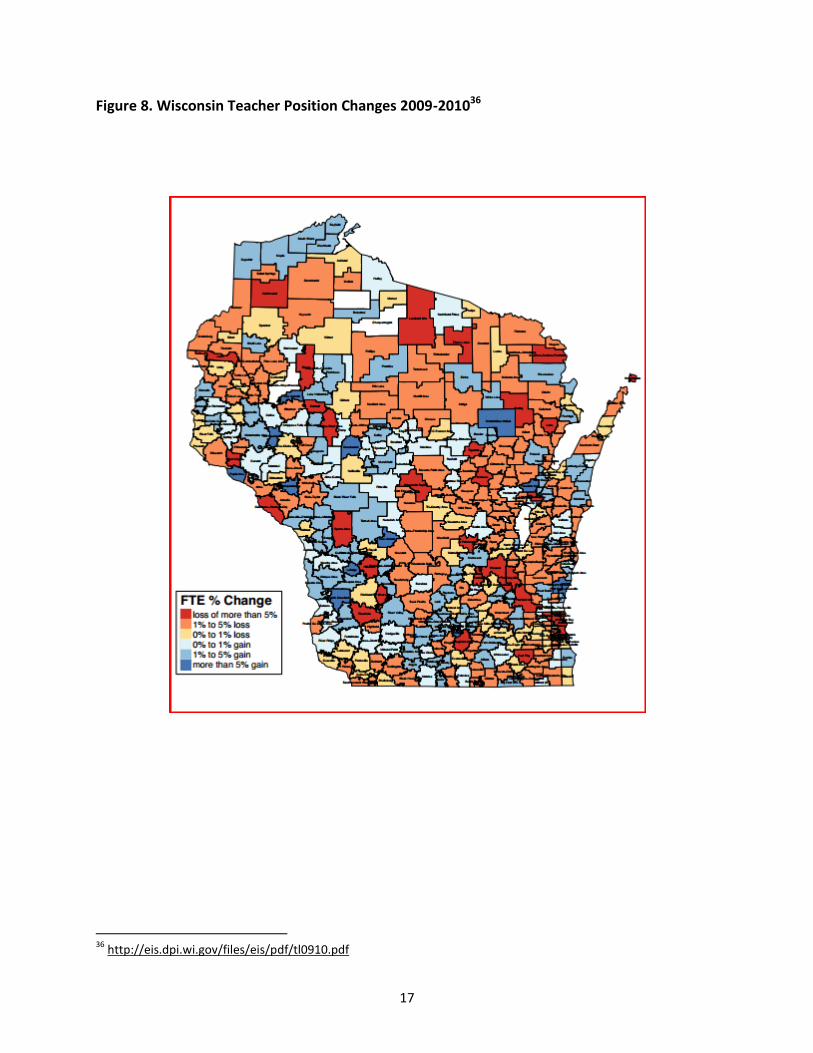
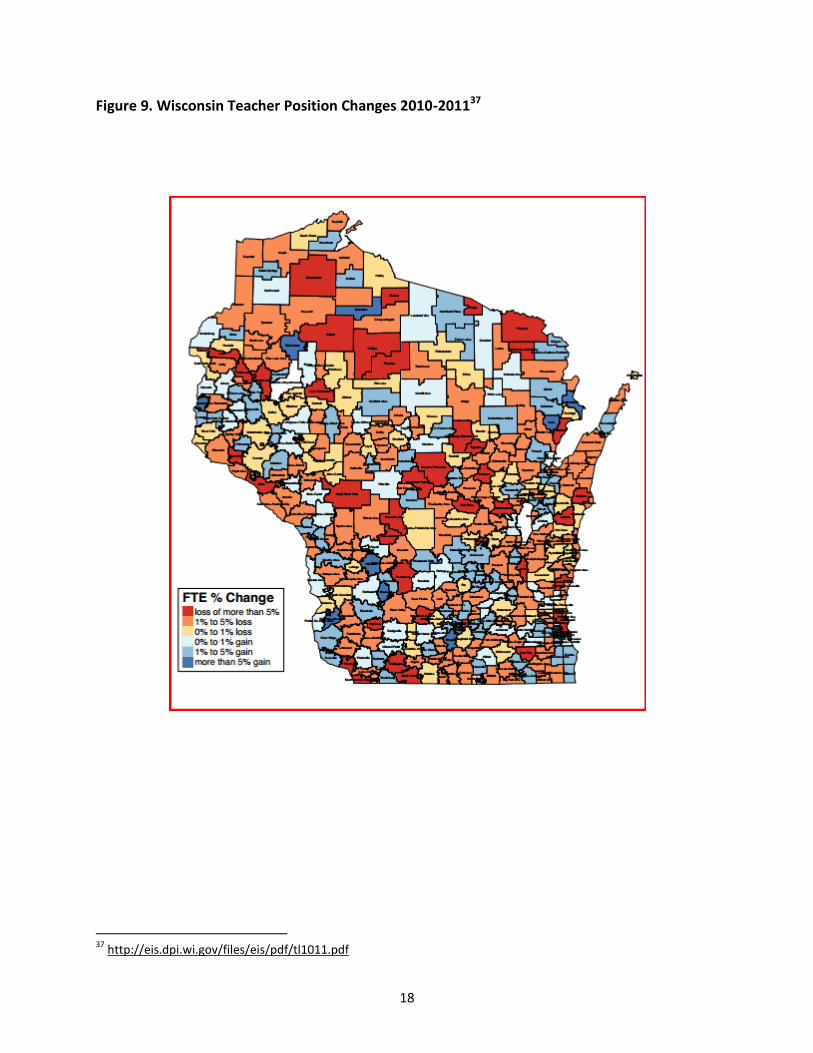
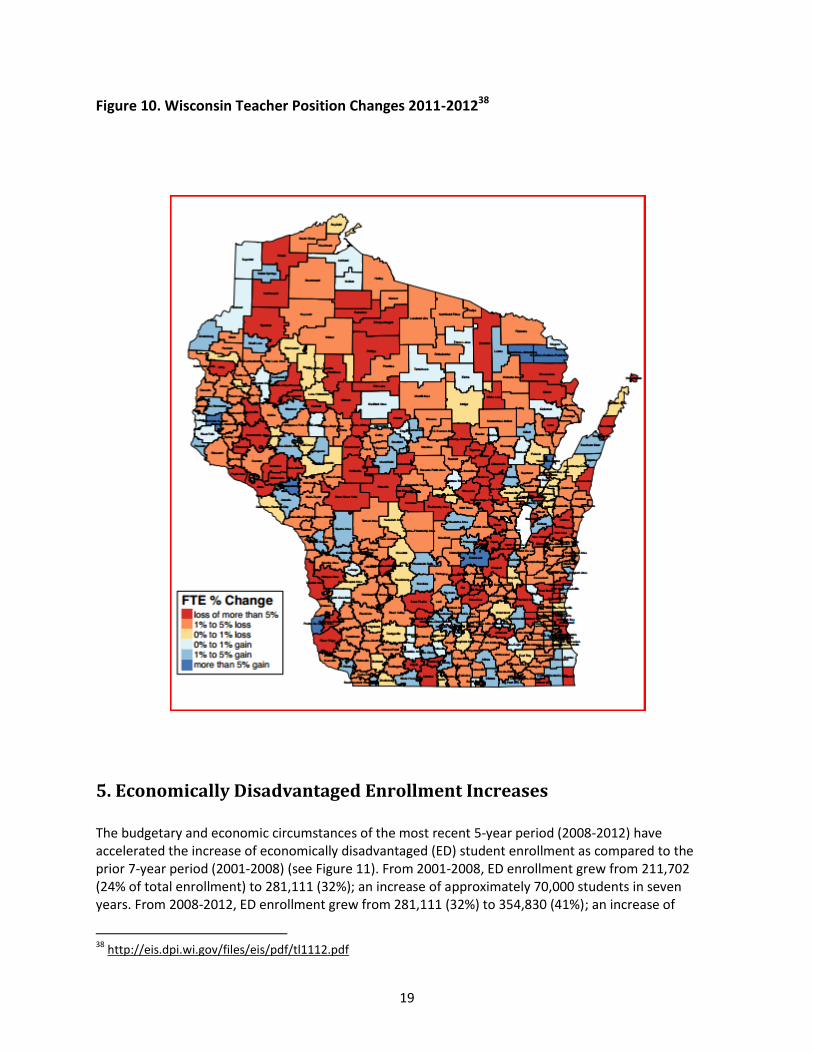
The 2011-2013 state budget and 2011 Act 10 impacted more than revenue to local schools. Wisconsin
schools began losing experienced teachers at historically high rates, particularly in high-poverty
districts34 (see Figures 7 – 10).
32
“Making Matters Worse: School Funding, Achievement Gaps and Poverty Under Wisconsin Act 32,” James J. Shaw and Carolyn Kelley, May 4 2012, UW-Madison Educational Leadership and Policy Analysis http://elpa.education.wisc.edu/docs/elpa-documents/shawandkelleypolicybrief.pdf?sfvrsn=2 33
Ibid 34
http://host.madison.com/news/local/education/local_schools/wisconsin-teacher-retirements-double/article_b2b6244e-d3f0-11e0-9b80-001cc4c03286.html
-$703
-$319
-800
-700
-600
-500
-400
-300
-200
-100
0
100
Do
llars
State Aid Reduction per Student
High Poverty Districts Low Poverty Districts
16
Figure 7. Wisconsin Teacher Position Changes 2008-200935
35
http://eis.dpi.wi.gov/files/eis/pdf/tl0809.pdf
17
Figure 8. Wisconsin Teacher Position Changes 2009-201036
36
http://eis.dpi.wi.gov/files/eis/pdf/tl0910.pdf
18
Figure 9. Wisconsin Teacher Position Changes 2010-201137
37
http://eis.dpi.wi.gov/files/eis/pdf/tl1011.pdf
19
Figure 10. Wisconsin Teacher Position Changes 2011-201238
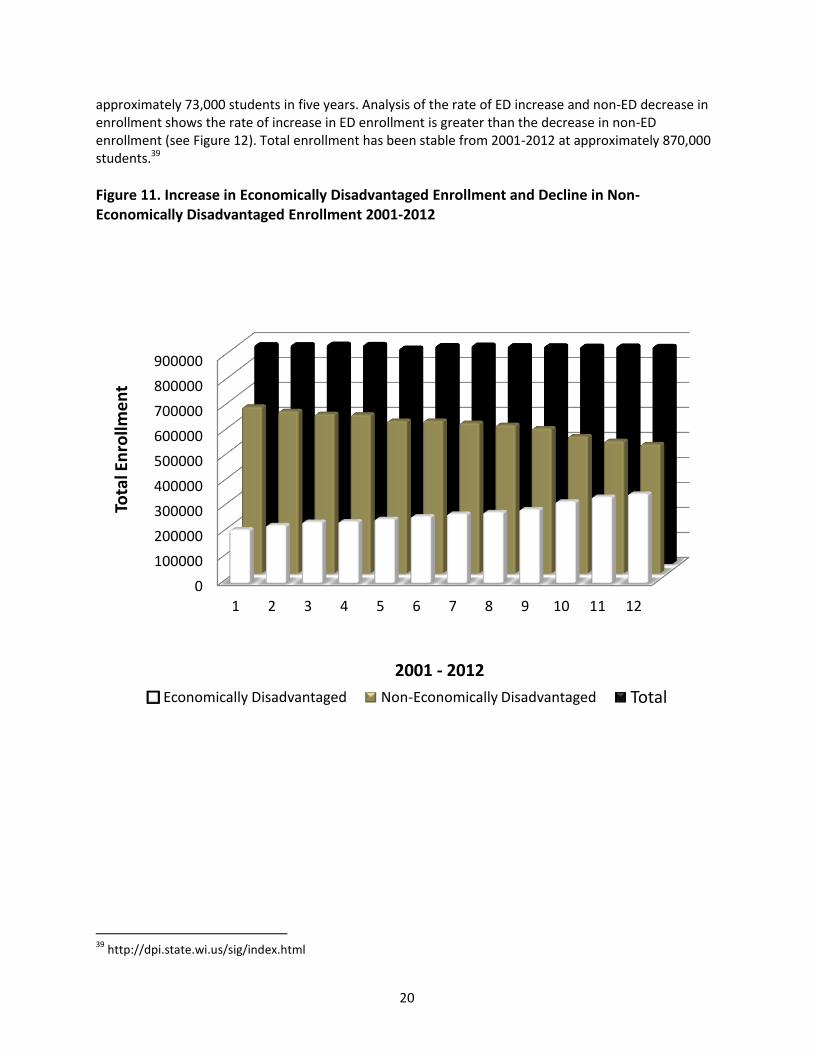
5. Economically Disadvantaged Enrollment Increases The budgetary and economic circumstances of the most recent 5-year period (2008-2012) have accelerated the increase of economically disadvantaged (ED) student enrollment as compared to the prior 7-year period (2001-2008) (see Figure 11). From 2001-2008, ED enrollment grew from 211,702 (24% of total enrollment) to 281,111 (32%); an increase of approximately 70,000 students in seven years. From 2008-2012, ED enrollment grew from 281,111 (32%) to 354,830 (41%); an increase of
38
http://eis.dpi.wi.gov/files/eis/pdf/tl1112.pdf
20
approximately 73,000 students in five years. Analysis of the rate of ED increase and non-ED decrease in enrollment shows the rate of increase in ED enrollment is greater than the decrease in non-ED enrollment (see Figure 12). Total enrollment has been stable from 2001-2012 at approximately 870,000 students.39
Figure 11. Increase in Economically Disadvantaged Enrollment and Decline in Non-Economically Disadvantaged Enrollment 2001-2012
39
http://dpi.state.wi.us/sig/index.html
0
100000
200000
300000
400000
500000
600000
700000
800000
900000
1 2 3 4 5 6 7 8 9 10 11 12
Tota
l En
rollm
en
t
2001 - 2012
Economically Disadvantaged Non-Economically Disadvantaged Total

21
Figure 12. Fold-Increase in Economically Disadvantaged Enrollment Compared to Fold-Decrease in Non-Economically Disadvantaged Enrollment (Both Log Scale)40
40
http://forwardinstitutewi.org/wisconsin-report-card-study-2012/
-0.2
-0.1
0
0.1
0.2
0.3
0.4
0.5
2001 2002 2003 2004 2005 2006 2007 2008 2009 2010 2011 2012
Fold
Incr
eas
e o
r D
ecr
eas
e F
rom
20
01
Bas
elin
e (
Log
Scal
e)
Disadvantaged Non-Disadvantaged
Linear (Disadvantaged) Linear (Non-Disadvantaged)

22
6. Wisconsin School Report Cards
Background
The first Wisconsin School Report Cards were released in final form by the State of Wisconsin Department of Public Instruction (DPI) in November 2012. The Report Cards are the product of an extensive effort to assign a numerical rating on a scale of 0-100 based on three years of data. This effort was led by a “Design Team” appointed by Governor Scott Walker and State School Superintendent Tony Evers. The “Design Team” consisted of diverse membership, with representatives from school administrators, school boards, corporate boards, government, private school advocates, and charter school advocates. Noteworthy is the absence of any public school teacher representation on the Report Card Design Team.41 The Report Cards are a technically complex assessment system designed to rate schools based on current performance and performance over time. They have been designed to afford state education accountability officials and the public a consistent and equal measure of school performance.42 Forward Institute released an initial analysis of the School Report Cards in December 2012.43 The analysis determined that while economically disadvantaged (ED) student enrollment goes up, Report Card score goes down, and that the negative effect is stronger for charter schools than public schools (see Figure 13). For each 10% increase in ED enrollment, charter school Report Card score decreases by 3.7 points, where public school score decreases by 2.5 points.44 This could be interpreted as the effects of poverty are lessened in public schools compared to charter schools. Mean Report Card scores between public and charter schools were compared within high, middle, and low income tertiles. Analysis showed no significant difference between public and charter school Report Card scores in high and middle income tertiles. There is, however, a significant difference in the low income tertile (see Table 3). Low-income charter schools had significantly lower Report Card scores than low-income public schools. A graph of the results can also be found in Figure 14.45
41
http://acct.dpi.wi.gov/files/oea/pdf/designtm.pdf 42
http://acct.dpi.wi.gov/files/oea/pdf/indextchguide.pdf 43
http://forwardinstitutewi.org/wisconsin-report-card-study-2012/ 44
Ibid, pages 9-10; negative slope of association between score and ED enrollment for charter schools = -0.37, while the public school slope = -0.25; analysis showed this is a statistically significant (p<0.0001) difference in slope between public and charter schools. 45
Ibid

23
Figure 13. Lower Report Card Scores Associated with Higher Percentage of Economically Disadvantaged Enrollment, Stratified by Public and Charter Schools
y = -0.25x + 81.0
y = -0.37x + 85.5
0
10
20
30
40
50
60
70
80
90
100
0 20 40 60 80 100
Re
po
rt C
ard
Sco
res
Economically Disadvantaged Enrollment Percentage
Public Schools Charter Schools
Linear (Public Schools) Linear (Charter Schools)

24
Table 3. Mean (Standard Deviation) Report Card Scores for Public and Charter Schools, stratified by Tertiles of Income (Percent of ED Enrollment)
High Income Middle Income Low Income
Percent of ED Enrollment 0 - <30.4% 30.4 - <48.9% >48.9%
Public Score Mean 75.3 (5.2) 71.1 (5.2) 64.8 (8.5) Charter Score Mean 77.6 (12.0) 72.9 (6.9) 55.1 (15.1) Is difference significant? no no yes
Figure 14. Low Income Charter Schools Score Significantly Worse than Low Income Public Schools
0
20
40
60
80
100
High Income Middle Income Low Income
Re
po
rt C
ard
Sco
re
p = 0.29 (not significant) p = 0.22 (not significant) p < 0.0001 (significant)
Public Schools Charter Schools

25
Additional Report Card Score Analysis
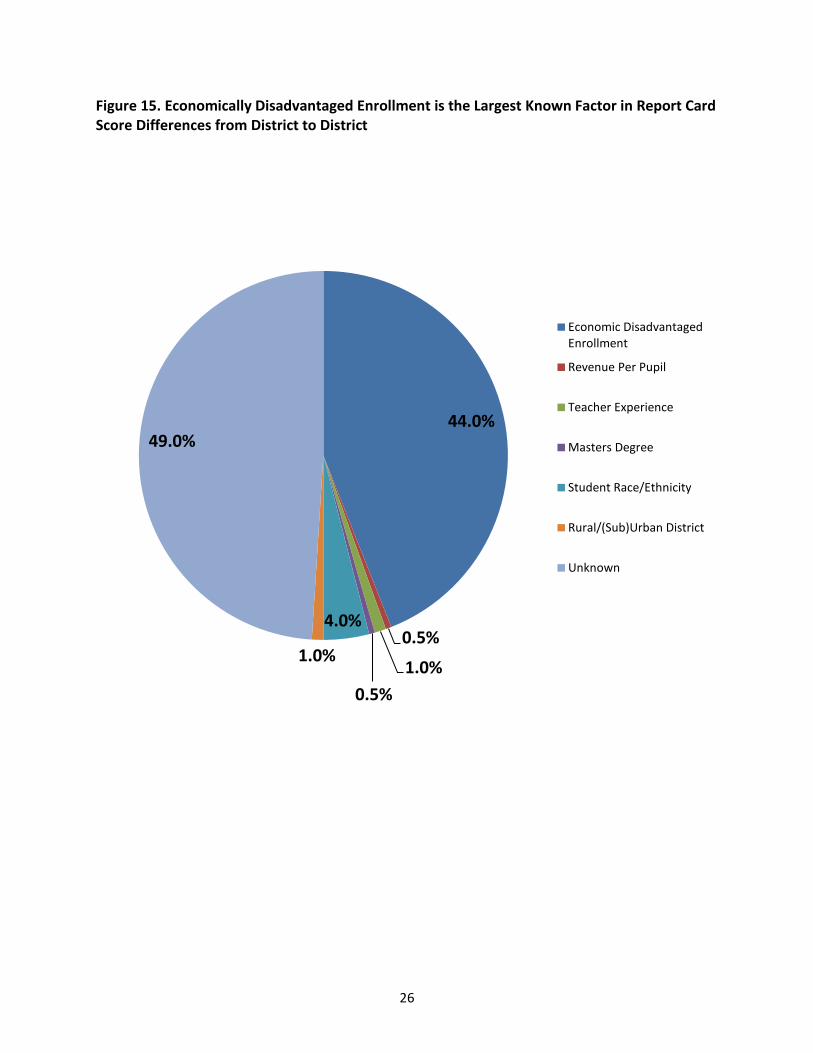
Forward Institute conducted an additional study of Report Card scores, this time for the average Report Card score of school districts, and the correlation between the school district’s Report Card score and multiple school district variables.46 The most important determining factor in the school district’s average Report Card score is the percent of children in poverty, defined as ED, in that school district. Wisconsin DPI defines an ED student as being in a family eligible for the federally funded school free or reduced price lunch program.47 The variables significantly associated with Reports Card scores are detailed below.
1. Higher ED is statistically the most significant factor in lower Report Card scores, and it accounted for nearly half (44%) of the score difference from district to district (see Figure 15).
2. Rural school districts had worse scores (4.1 points lower) on Report Cards than
urban/suburban school districts, even when controlling for the level of poverty. However, the effect of higher ED on lower school district Report Card score was less for rural school districts than urban/suburban districts. For each 10% increase in ED enrollment, urban/suburban school district average Report Card score decreased by 2.6 points, whereas rural school district average score decreased by 1.5 points. The effects of poverty are lessened in rural districts compared to urban/suburban districts. The type of school, rural or urban/suburban, accounted for only 1% of the district to district difference in Report Card score.
3. Average years of teacher experience in a school district had a small, but significant positive
impact on Report Card scores. Combined with the additional positive impact of the proportion of teachers with Master’s degrees or greater in a district on Report Card scores, teacher experience/Master’s degrees accounted for 1.5% of Report Card score differences from district to district.
4. State revenue caps per pupil per district accounted for 0.5% of Report Card score difference
from district to district. Districts with higher revenue caps had slightly higher scores on Report Cards. 5. With regard to racial/ethnic demographics, school districts with a higher Native American
population had significantly lower scores. This effect offset any teacher factors, including experience. Pacific Islander populations also had an effect on Report Card scores. In contrast to the Native American population, an increase in Pacific Islander population saw an increase in Report Card scores. Overall, racial demographics accounted for 4% of the district to district difference in Report Card scores. The proportion of African American, Hispanic, Asian, or White students in a district was not associated with Report Card score.
Summary: In the face of high ED enrollment, there is no known teacher characteristic that can completely offset the detrimental effects of poverty. ED enrollment has a greater impact on the Report Card scores than any other known factor, and public policy advocating for use of this assessment to “reward” teachers or schools is counter to existing data. Simply put, teachers and schools in affluent areas would be rewarded, and schools in high poverty areas would be punished financially; thereby furthering the already existing dichotomy.
46
Full data and analysis available at www.forwardinstitutewi.org/research 47
Wisconsin DPI website http://dpi.wi.gov/fns/fincou1.html#ig
26
Figure 15. Economically Disadvantaged Enrollment is the Largest Known Factor in Report Card Score Differences from District to District
44.0%
0.5%
1.0%
0.5%
4.0%
1.0%
49.0%
Economic Disadvantaged Enrollment
Revenue Per Pupil
Teacher Experience
Masters Degree
Student Race/Ethnicity
Rural/(Sub)Urban District
Unknown
27
Milwaukee School Report Card Scores
Analysis of city of Milwaukee School Report Cards48 showed the same trend in effects of poverty on Report Card scores as the statewide data. The higher the level of ED, the lower the corresponding Report Card scores; and the negative effect of ED on School Report Card scores is worse in charter than public schools (see Figure 16). Milwaukee charter schools at the lowest income levels also have lower scores than their public school counterparts, consistent with the statewide data (see Figure 17).49 Income tertiles used for analysis are consistent with those defined in Table 3, above. Note that there are no “high income” schools in Milwaukee based on the defined tertiles, and there are not enough “middle income” schools to conduct an analysis. Unlike the statewide data, Milwaukee public schools have a substantially higher ED enrollment than non-traditional charters. In the statewide data, charter schools have a higher percentage of low-income enrollment than public schools (43.6% Charters, 32.7% Public). In Milwaukee, public schools have a greater percentage of low-income enrollment than charter schools (88.5% Charters, 95.0% Public). Figure18 shows the Report Card score distribution for Milwaukee public and charter schools. The distribution is expressed as a percentage of the total to compensate for a larger number of public schools. This graph clearly illustrates that a greater percentage of charter schools had lower Report Card scores than public schools in Milwaukee. Based on the observation that Milwaukee charter schools had less ED, we would have expected Milwaukee charter schools to perform better on the Report Cards. In fact, despite facing greater levels of ED, public schools in Milwaukee achieved higher Report Card scores than their non-traditional charter counterparts.
48
http://forwardinstitutewi.org/2012/12/19/milwaukee-and-racine-dpi-report-card-scores-and-poverty-and-about-those-growth-scores/ 49
Public “Low Income” n=107; Charter “Low Income” n=23. Using unequal variances p=0.046

28
Figure 16. Milwaukee Schools’ Lower Report Card Scores Associated with Higher Percentage Economically Disadvantaged Enrollment, Stratified by Public and Charter Schools
y = -0.41x + 90.3
y = -0.58x + 95.0
0
10
20
30
40
50
60
70
80
90
100
0 10 20 30 40 50 60 70 80 90 100
Re
po
rt C
ard
Sco
re
Percent Economic Disadvantage Enrollment
Milwaukee Public Milwaukee Charters
Linear (Milwaukee Public) Linear (Milwaukee Charters)

29
Figure 17. Milwaukee Charter Schools Score Worse on Report Cards than Milwaukee Public Schools in Economically Disadvantaged Groups
Low Income difference in score is significant p=0.046
75.1
54.4
69.0
47.0
0
20
40
60
80
100
Middle Income Low Income
Re
po
rt C
ard
Sco
res
Public
Charters

30
Figure 18. Milwaukee Schools Report Card Score Distribution, Stratified by Public and Charter Schools, Expressed as a Percentage
0
5
10
15
20
25
0 5 10 15 20 25 30 35 40 45 50 55 60 65 70 75 80 85 90 95 100
Sco
re D
istr
ibu
tio
n
Report Card Score
Charter
Public
31
7. Test Scores
WSAS/WKCE Scores and Poverty
An analysis was conducted using 10 years of annual standardized test scores.50 This analysis showed a significant and counter-intuitive correlation between increasing levels of economic disadvantage (ED) (as cited above) and increasing student test scores during the same 10 year period. Results were stratified into students of ED and non-ED students. The percent of students scoring proficient plus advanced on the statewide tests was examined across grades, years, and cohorts. The analysis showed that as ED increased, the percent of ED students scoring proficient/advanced increased during that time as well. Based on our previous analysis which found higher ED correlated with lower Report Card scores, it seemed counterintuitive. Deeper analysis was required to explain this paradox. From school years 2002-03 through 2010-11, both ED and non-ED students saw steady, however small annual improvement in all subject test scores (see Figures 19 and 20). Test scores from 2011-12 show a slight decline in all scores except mathematics and reading, which saw a slight increase (see Figure 21). Our analysis found that from school years 2002-2011, ED student scores increased at a higher rate than non-ED student scores. The average of all subject scores for all grades for the 10-year period shows the increase over time for ED students’ scores exceeds that of non-ED students (see Figure 22). At first review, the greater ED score increases could appear to be explained by the effect of low initial scores having more room for growth than those starting at a higher level like non-ED scores. Analyzing the fold-increase from 2003 baseline negates this theory. The fold-increase in ED scores was steady through 2008-09 at which time it accelerated to being over two times greater than the non-ED increase (see Figure 23). This is noteworthy as the Great Recession occurred in late 2007. Another theory which can be negated is the impact of “No Child Left Behind” (NCLB), enacted in 2003.51 An Economic Policy Institute (EPI) study released January 2013 concluded that significant gains in national ED test scores (National Assessment of Educational Progress (NAEP), Programme for International Student Assessment (PISA), Trends in International Math and Science Study (TIMSS)) were occurring before NCLB was enacted, along with declines and plateaus occurring in the years immediately following NCLB implementation.52 National reading score trends collapsed from 2000-2006, and did not recover until 2009 (see Figure 24). National math score trends showed strong improvement from 1996-2004, and began to plateau after 2006, after the enactment of NCLB (see Figure 25). EPI’s conclusion confirmed our conclusion that ED test scores are rising for reasons other than education policy but offered no explanation for this change.53
50
http://data.dpi.state.wi.us/data/ 51
http://www2.ed.gov/policy/elsec/leg/esea02/index.html 52
Martin Carnoy and Richard Rothstein. 2013. What do international tests really show about US student performance. Washington, D.C.: Economic Policy Institute, January 15. http://www.epi.org/publication/us-student-performance-testing/ 53
Ibid
32
Figure 19. Percent of Economically Disadvantaged (ED) and Non-Economically Disadvantaged Students Scoring Proficient and Advanced in all Subjects 2002-03
Figure 20. Percent of Economically Disadvantaged (ED) and Non-Economically Disadvantaged Students Scoring Proficient and Advanced in all Subjects 2010-11
Figure 21. Percent of Economically Disadvantaged (ED) and Non-Economically Disadvantaged Students Scoring Proficient and Advanced in all Subjects 2011-12
50
76
46
76
43
74
44
75
47
77
0
20
40
60
80
100
Pe
rce
nt
57.5
83.6
53
81.3
50.9
81.3
55.8
83.6
63.6
87.2
0
20
40
60
80
100
Pe
rce
nt
62.5
86.6
51.5
80
52
81.5
54
82.5
58.4
84.4
0
20
40
60
80
100
Pe
rce
nt

33
Figure 22. Percent of Students Scoring Proficient and Advanced, Average of all Subjects 2002-
03 through 2011-12, Comparing State Total, Economically and Non-Economically
Disadvantaged Scores
Figure 23. Fold-Change from 2003 Baseline, Students Scoring Proficient and Advanced,
Average of All Subjects
0
10
20
30
40
50
60
70
80
90
100
2003 2004 2005 2006 2007 2008 2009 2010 2011 2012
Pe
rce
nt
Statewide Total Economically Disadvantaged Non Economically Disadvantaged
1.00
1.05
1.10
1.15
1.20
1.25
2003 2004 2005 2006 2007 2008 2009 2010 2011 2012
Ch
ange
in S
cori
ng
fro
m B
ase
line
Statewide Total Economically Disadvantaged Non Economically Disadvantaged

34
Figure 24. Cumulative Gains in Main NAEP, Long-Term Trend NAEP, and PISA Reading Scores, 1999/2000–201154
Figure 25. Cumulative Gains in Main NAEP, Long-Term Trend NAEP, and TIMSS Mathematics
Scores, 1995/1996–201155
54
Martin Carnoy and Richard Rothstein. 2013. What do international tests really show about US student performance. Washington, D.C.: Economic Policy Institute, January 15. http://www.epi.org/publication/us-student-performance-testing/, used with permission of the author 55
Ibid

35
Test Score Analysis
We conducted further analyses of statewide test scores to examine the increase in ED scores from 2002-11, followed by a subsequent plateau in 2011-12 as illustrated in Figures 19-23. In conducting the analysis, data were extracted from the DPI’s Wisconsin Information Network for Successful Schools (WINSS) website.56 The association between the percent of ED student enrollment and the percent of ED students scoring proficient plus advanced in mathematics, reading, and science were compared three ways: 1) within each school year’s grade levels tested (i.e., grades 3 through 8, and 10 in 2003 school year); 2) within each grade over a number of school years (i.e., grade 3 classes from 2002-11 school years); and 3) within each cohort (i.e., following a cohort of students through 2002-11 school years). In each, the analysis confirmed the positive correlation between percent of ED enrollment and test scores. Mathematics
Using each of the three methods of analysis, there was a highly significant association between higher percent of enrolled ED and higher percent of ED students scoring proficient plus advanced. In each case, every 1 point of increase in percent of ED enrollment corresponds with a 1 point increase in percent of ED students scoring proficient plus advanced in mathematics. Figure 26 illustrates the cohort analysis.
Figure 26. Cohorts Advancing Through School Years 2002-2011: Percent of ED Students Scoring Proficient + Advanced in Mathematics Increases as ED Enrollment Percent Increases
A 1 percent increase in ED enrollment results in a 1 percent increase in ED students scoring proficient + advanced on statewide mathematics tests,
p<0.0001
56
http://data.dpi.state.wi.us/data/
0%
5%
10%
15%
20%
25%
30%
35%
40%
45%
50%
30 40 50 60 70 80
Pe
rce
nt
of
Eco
no
mic
ally
Dis
adva
nta
ged
En
rolle
d
Percent of Economically Disadvantaged Cohorts Scoring Proficient + Advanced

36
Reading
Using each of the three methods of analysis, there was also a highly significant association between higher percent of enrolled ED and higher percent of ED students scoring proficient plus advanced. In each case, every 1 point of increase in percent of ED enrollment corresponds with a 0.5 point increase in percent of ED students scoring proficient plus advanced in reading. Figure 27 illustrates the cohort analysis.
Figure 27. Cohorts Advancing Through School Years 2002-2011: Percent of ED Students Scoring Proficient + Advanced in Reading Increases as ED Enrollment Percent Increases
A 1 percent increase in ED enrollment results in a 0 .5 percent increase in ED students scoring proficient + advanced on statewide reading tests,
p=0.003
0%
5%
10%
15%
20%
25%
30%
35%
40%
45%
50%
30 40 50 60 70 80
Pe
rce
nt
of
Eco
no
mic
ally
Dis
adva
nta
ged
En
rolle
d
Percent of Economically Disadvantaged Cohorts Scoring Proficient + Advanced

37
Science
Using each of the three methods of analysis, there was again a highly significant association between higher percent of enrolled ED and higher percent of ED students scoring proficient plus advanced. In each case, every 1 point of increase in percent of ED enrollment corresponds with a 1 point increase in percent of ED students scoring proficient plus advanced in science. Figure 28 illustrates the cohort analysis.
Figure 28. Cohorts Advancing Through School Years 2002-2011: Percent of ED Students
Scoring Proficient + Advanced in Science Increases as ED Enrollment Percent Increases
A 1 percent increase in ED enrollment results in a
1 percent increase in ED students scoring proficient + advanced on statewide science tests, p<0 .0001
0%
5%
10%
15%
20%
25%
30%
35%
40%
45%
50%
30 40 50 60 70 80
Pe
rce
nt
of
Eco
no
mic
ally
Dis
adva
nta
ged
En
rolle
d
Percent of Economically Disadvtaged Cohorts Scoring Proficient + Advanced

38
Explaining the Paradox
In each subject (Math, Reading, and Science) analyzed, ED enrollment is seen as a significant factor in ED student test scores. The 1 percent increase in ED enrollment resulting in a 1 percent increase in ED test scores, as stated above, is counterintuitive. To extrapolate this correlation, we could postulate that should ED enrollment increase to 100% over time, ED test scores would accordingly increase to 100% scoring proficient plus advanced. This is obviously an absurd presumption, based on previously cited relationships between poverty and educational outcome. At some point, we would reach the top of the curve, and scores would plateau and start to decline. With ED enrollment approaching 50% statewide, it appears that Wisconsin has reached that plateau. See prior Figures 22 and 23 showing recent test scores reaching a plateau and beginning to decline. The 1:1 increase in ED enrollment with ED test scores is consistent with the aforementioned EPI study results showing this unexplained result nationwide. We compared this data with student enrollment data for the same time period (see above Figures 11 and 12). Student population data clearly shows flat statewide enrollment with ED enrollment increasing at a twofold greater rate than non-ED enrollment decline. Subsequently the reason for the paradox became clear. The resulting broader statewide economic circumstances and budgetary consequences cited above have caused a large proportion of students to transition from formerly non-ED families to ED families as their economic circumstances have worsened. This has resulted in those students, formerly non-ED, bringing their generally higher test scores (as is the case with non-ED students) into the ED student group. The result is a perception of outsized test score gains in the ED group as the wide achievement gap remains between ED and non-ED students (see Figure 22). This is a sound hypothesis based on the progression of the student cohorts in Figures 26-28 above. Our analysis demonstrates a direct link between state economics, education funding policy and student outcome in the form of test scores and School Report Card scores. These factors are having an outsized effect on ED students when compared to non-ED students.
8. Private Voucher Schools – “Milwaukee Parental Choice Program” As demonstrated above, recent state budgets have largely cut state aid for public education. These cuts have had an outsized impact on high poverty districts when compared to low poverty districts. Exacerbating the impact on poorer districts has been the allocation of state aid out of existing public schools (largely in high poverty areas) and into private voucher programs. No better example exists than the State’s largest and oldest voucher program, known as the “Milwaukee Parental Choice Program” (MPCP). The evidence we present in this section will demonstrate that MPCP schools are largely underperforming their public school counterparts, while taking away state funding from schools with higher ED enrollment. Further, that the lower student proficiencies in MPCP schools have a higher cost to taxpayers. The taxpayer money paid to MPCP amounts to no more than a public subsidy to private schools with no fiscal or academic accountability to those same taxpayers.

39
Evaluating Economic Disadvantage Level and Cost per Student in MPCP
MPCP families must, in most cases, meet income limits to qualify for a state voucher to attend the MPCP private school. In contrast to MPS (Milwaukee Public Schools), where a majority of public schools have a much higher than state-wide average level of ED enrollment,57 the MPCP income limits58 are much higher than what currently defines ED59 (see Figure 29). In some cases, the income limits for MPCP schools are even waived. For example, if a student is continuing in the program or was on a waiting list at the choice school in the prior year, he or she is no longer required to meet the income limits. Because of these income limits of MPCP schools, families of higher income have access to private school vouchers, and therefore inherently MPCP schools have a lower rate of ED enrollment than MPS.
Figure 29. Comparison of Annual Income Limits for MPCP Voucher, Reduced, and Free Lunch
Programs 2012-2013
57
http://data.dpi.state.wi.us/Data/GroupEnroll.aspx?OrgLevel=di&GraphFile=GROUPS&S4orALL=1&SRegion=1&SCounty=47&SAthleticConf=45&SCESA=05&Qquad=demographics.aspx&Group=EconDisadv&FULLKEY=01361903````&DN=Milwaukee&SN=None+Chosen 58
MPCP Income Limits for New Students accessed at http://winss.dpi.wi.gov/winss_dm-demographics 59
Wisconsin DPI website http://dpi.wi.gov/fns/fincou1.html#ig
34,380
46,569
58,758
70,947
83,136
95,325
12,189 20,665
27,991
35,317
42,643
49,969
57,285
7,326 14,521
19,669 24,817
29,965 35,113
40,261
5,148
0
10,000
20,000
30,000
40,000
50,000
60,000
70,000
80,000
90,000
100,000
1 2 3 4 5 6 Each additional
Inco
me
in D
olla
rs
Number of Family Members
MPCP Reduced Lunch Free Lunch

40
Additional evidence supporting our conclusion that MPS has higher ED enrollment than MPCP is found in the actual data reported as part of the Free and Reduced Lunch Program (FRL), which defines ED (see above). MPCP schools report ED enrollment at 79%, and MPS reports ED enrollment at 83.4%. It is noteworthy that of the 99 MPCP schools, ED enrollment data were only available for 68 schools through the FRL Program data supplied by DPI.60 The other 31 schools do not participate in the program, and do not report this data to DPI. The result is that the overall ED level is being over-reported for MPCP schools, as nearly 33% of schools in the program have no reporting requirement and have no children enrolled in a free or reduced price lunch program. Based on the best available data, we must conclude that MPS schools have higher ED enrollment than MPCP schools. For analysis purposes, it was necessary to adopt a consistent measure of cost per student. We chose to use the state aid per student amount based on the following facts. 1. Just as MPS receives revenue in addition to state aid in the form of local property taxes and federal aid, voucher schools also receive revenue support in addition to state aid. For the 2009-13 school years, the maximum state aid per student to schools participating in the MPCP program was $6,442. By contrast, MPS per student state aid in 2010-11 was $8,322. For the 2011-12 school year, the MPS state aid per student amount was reduced to $6,442. Over 38% of the funding for the MPCP came out of a direct cut in state aid to MPS, resulting in a direct loss of over $59 million in state aid for MPS. A provision exists to allow MPS to make up the revenue through an increase in property tax levy.61 This provision was confounded by the 5.5% cut in available tax levy to local districts cited previously as a result of 2011 Act 32.62 While MPCP schools receive a maximum of $6,442 per student in state aid, most exceeded that amount in per student expenditure in the 2010-11 school year (the most recent MPCP data available on per pupil total costs).63 For the average MPCP school, reported total cost per pupil was $7,626, exceeding the voucher allowance by an average of $1,035,64 with this difference most likely paid for through private funds (see below). In addition to state aid and private funds, local property taxpayers in Milwaukee directly support transportation costs, special education services, and some Federal Title 1 funding for MPCP voucher school students.65 2. MPCP schools have unknown and unreported private funding sources. It is nearly impossible to quantify unreported private and foundational money committed to offsetting capital expenditures and educational costs at private MPCP schools.66 None of these costs paid for by private foundations are reflected in the private MPCP schools’ reported “per pupil” cost, and therefore the total cost per pupil likely exceeds the average $7,626 cited above. The last Legislative Audit Bureau (LAB) evaluation of the voucher program and per student costs was released in February 2000.67 The report found that in 1999-2000, while the state paid $5,106 per student to the private MPCP schools, the median reported per student cost was actually less than the state aid received, at $4,904. This is in contrast to the 2010-11 data, where cost per pupil exceeded state aid. Of note, the median amount of tuition paid to the MPCP school by families not receiving a voucher was only $1,800 per student in 1999-2000 and therefore
60
http://fns.dpi.wi.gov/fns_progstat 61
“MPCP Facts and Figures for 2012-13” accessed at http://sms.dpi.wi.gov/sms_geninfo 62
“Making Matters Worse: School Funding, Achievement Gaps and Poverty Under Wisconsin Act 32,” James J. Shaw and Carolyn Kelley, May 4 2012, UW-Madison Educational Leadership and Policy Analysis 63
http://sms.dpi.wi.gov/sms_choice 64
http://sms.dpi.wi.gov/sms_geninfo 65
http://pb.dpi.wi.gov/ 66
http://legis.wisconsin.gov/lab/reports/00-2full.pdf, Appendix I 67
Ibid

41
private funds would have been used to make up the difference for these students. There has never been an explanation as to why the voucher amount was set at nearly 3 times the cost of tuition for these schools. Since the 2000 LAB report, this information is no longer public, making the real per student cost in voucher schools very difficult to quantify. 3. For over one decade, state aid per pupil going to MPCP has exceeded the average state-wide public school aid per pupil (see Figure 30). Further, while MPCP aid has remained stable at $6,442 per member for the last four years, public school aid per student has seen significant cuts.68 When adjusted for inflation, state aid for education has been in decline since 2002. Public school students have seen greater decreases in state aid than MPCP students (see Figure 31). Therefore, we must use the state aid amount to have a consistent and accurate measure of direct per pupil state cost across different schools systems, public and private.
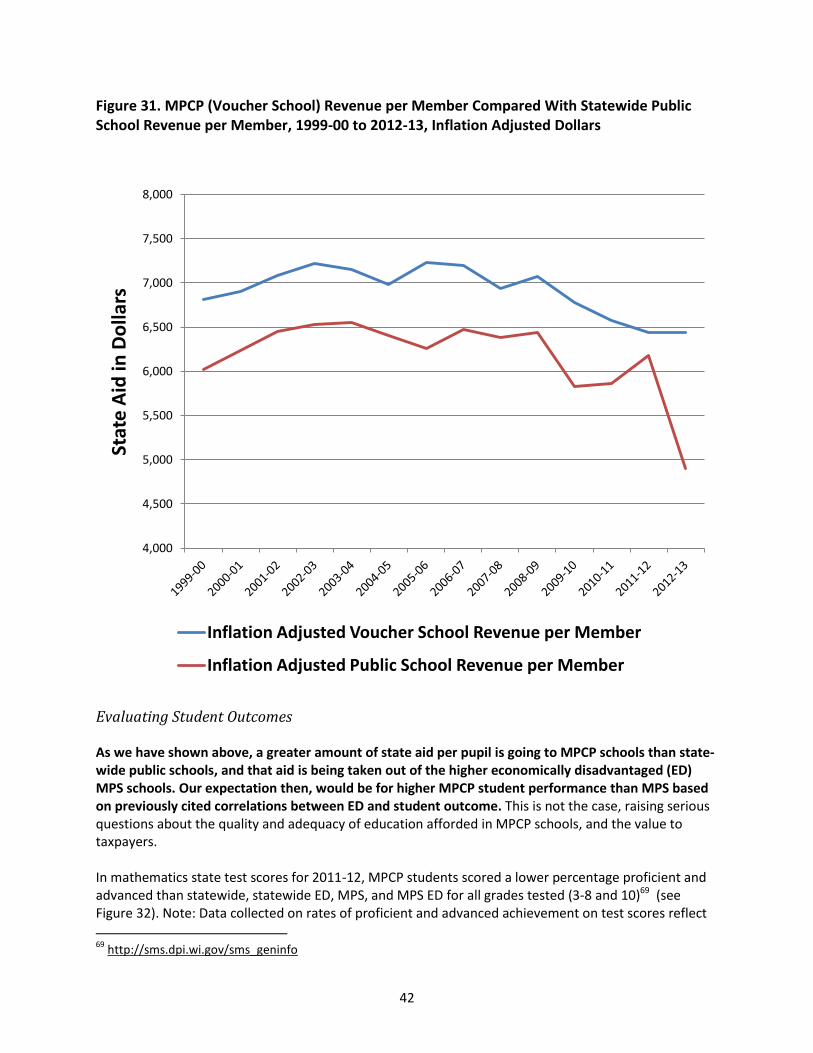
Figure 30. MPCP (Voucher School) Revenue per Member Compared With Statewide Public School Revenue per Member, 1999-00 to 2012-13, in Actual Dollars
68
http://sfs.dpi.wi.gov/
4,000
4,500
5,000
5,500
6,000
6,500
7,000
7,500
8,000
Stat
e A
id in
Do
llars
Voucher School Revenue per Member
Public School Revenue per Member
42
Figure 31. MPCP (Voucher School) Revenue per Member Compared With Statewide Public School Revenue per Member, 1999-00 to 2012-13, Inflation Adjusted Dollars
Evaluating Student Outcomes As we have shown above, a greater amount of state aid per pupil is going to MPCP schools than state-wide public schools, and that aid is being taken out of the higher economically disadvantaged (ED) MPS schools. Our expectation then, would be for higher MPCP student performance than MPS based on previously cited correlations between ED and student outcome. This is not the case, raising serious questions about the quality and adequacy of education afforded in MPCP schools, and the value to taxpayers. In mathematics state test scores for 2011-12, MPCP students scored a lower percentage proficient and advanced than statewide, statewide ED, MPS, and MPS ED for all grades tested (3-8 and 10)69 (see Figure 32). Note: Data collected on rates of proficient and advanced achievement on test scores reflect
69
http://sms.dpi.wi.gov/sms_geninfo
4,000
4,500
5,000
5,500
6,000
6,500
7,000
7,500
8,000
Stat
e A
id in
Do
llars
Inflation Adjusted Voucher School Revenue per Member
Inflation Adjusted Public School Revenue per Member

43
results prior to DPI rescaling of achievement levels in 2013. Comparison with the new scale would be inappropriate.
Figure 32. 2011-12 Percentage of Students Scoring Proficient and Advanced in State Mathematics Standardized Tests
Note: Statewide reports 1% students “opt out” of testing, MPCP reports 2.4% of students “opt out”
In 2011-12 reading testing proficient and advanced, MPCP schools were exceeded by statewide, statewide ED, and MPS schools in all grades tested (3-8 and 10). MPCP scoring proficient and advanced exceeded MPS ED schools only in grades 6, 7 and 870 (see Figure 33). In both reading and mathematics
70
http://sms.dpi.wi.gov/sms_geninfo
0
10
20
30
40
50
60
70
80
90
100
Grade 3 Grade 4 Grade 5 Grade 6 Grade 7 Grade 8 Grade 10
Pe
rce
nt
Sco
rin
g P
rofi
cie
nt
and
Ad
van
ced
State Total
State Economically Disadvantaged
Milwaukee Public Schools Economically Disadvantaged
Milwaukee Choice Schools
Milwaukee Public Schools Total

44
testing, MPCP schools reported a 2.4% “parental opt out” of the testing. This is more than double the statewide 1% “opt out” number.71 The percent of students scoring proficient plus advanced reported by MPCP schools may therefore not be an accurate representation, with over 100 students not participating in the testing. However, even if we assume all 2.4% of these students would have scored proficient/advanced, MPS ED schools still performed better on math scores in all grades than MPCP.
Figure 33. 2011-12 Percentage of Students Scoring Proficient and Advanced in State Reading
Standardized Tests
Note: Statewide reports 1% students “opt out” of testing, MPCP reports 2.4% of students “opt out”
71
http://oea.dpi.wi.gov/files/oea/pdf/MPCP-school-results-fall-2011.pdf
0
10
20
30
40
50
60
70
80
90
100
Grade 3 Grade 4 Grade 5 Grade 6 Grade 7 Grade 8 Grade 10
Pe
rce
nt
Sco
rin
g P
rofi
cie
nt
and
Ad
van
ced
State Total
State Economically Disadvantaged
Milwaukee Public Schools Economically Disadvantaged
Milwaukee Choice Schools
Milwaukee Public Schools Total
45
Drawing Comparisons in Student Outcome
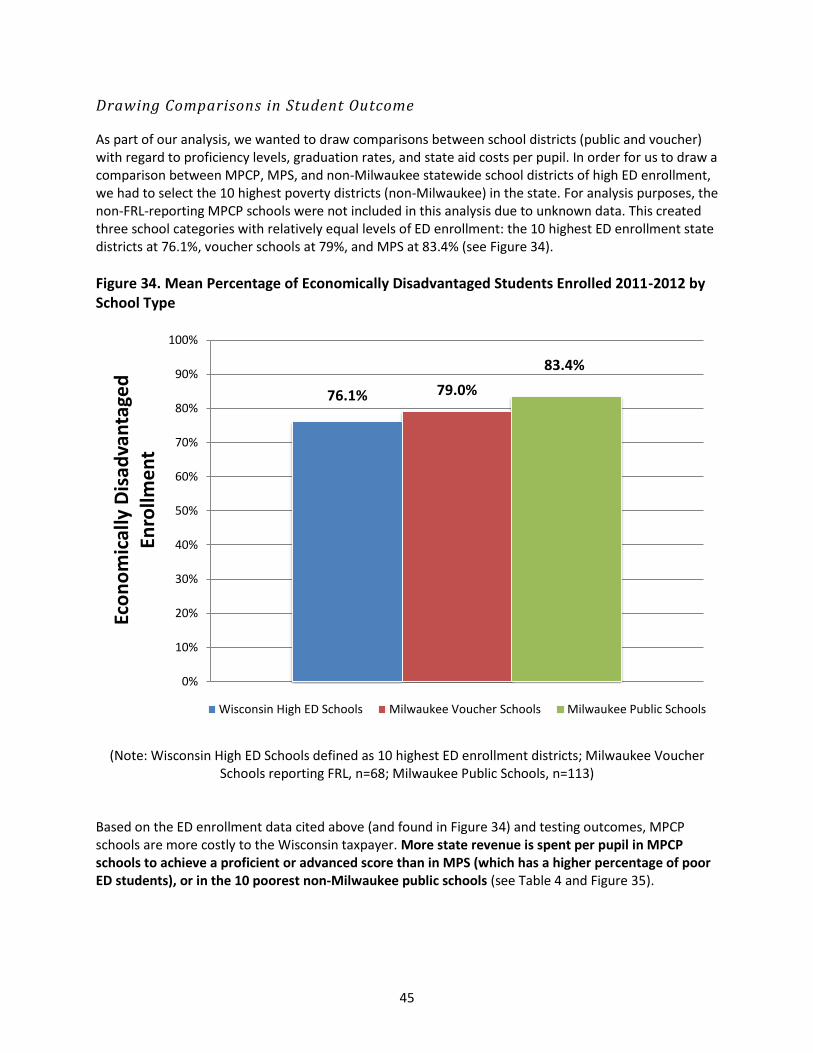
As part of our analysis, we wanted to draw comparisons between school districts (public and voucher) with regard to proficiency levels, graduation rates, and state aid costs per pupil. In order for us to draw a comparison between MPCP, MPS, and non-Milwaukee statewide school districts of high ED enrollment, we had to select the 10 highest poverty districts (non-Milwaukee) in the state. For analysis purposes, the non-FRL-reporting MPCP schools were not included in this analysis due to unknown data. This created three school categories with relatively equal levels of ED enrollment: the 10 highest ED enrollment state districts at 76.1%, voucher schools at 79%, and MPS at 83.4% (see Figure 34).
Figure 34. Mean Percentage of Economically Disadvantaged Students Enrolled 2011-2012 by School Type
(Note: Wisconsin High ED Schools defined as 10 highest ED enrollment districts; Milwaukee Voucher Schools reporting FRL, n=68; Milwaukee Public Schools, n=113)
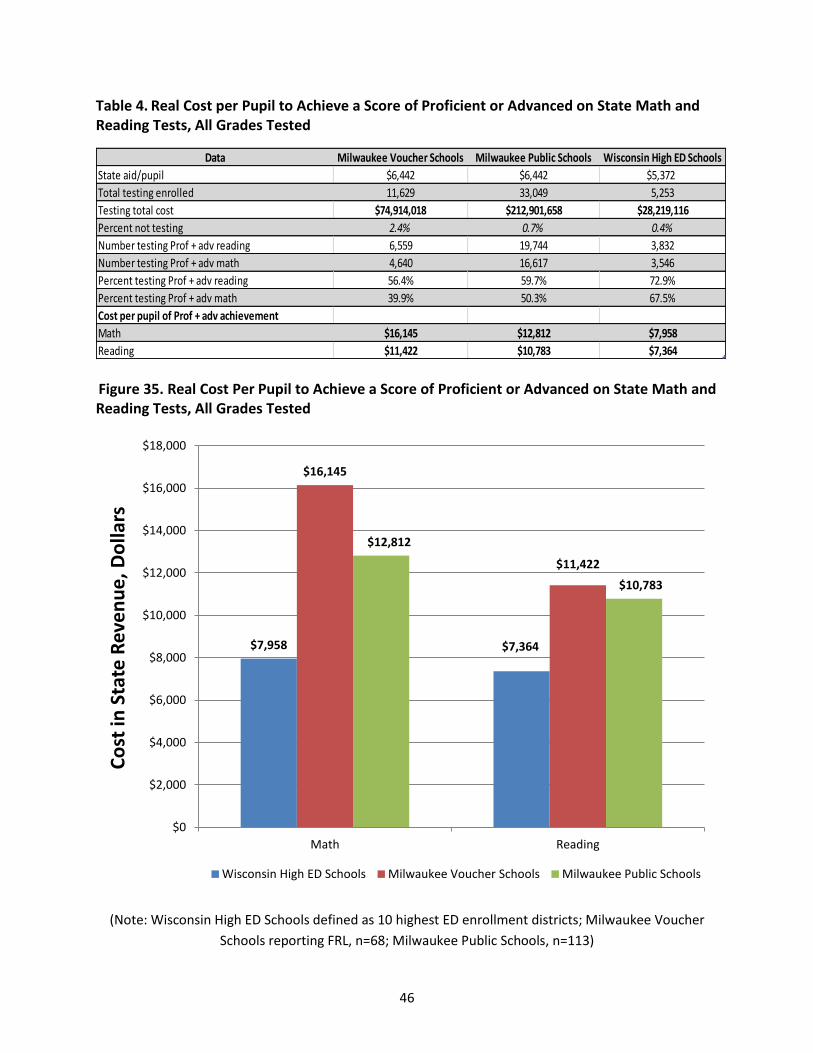
Based on the ED enrollment data cited above (and found in Figure 34) and testing outcomes, MPCP schools are more costly to the Wisconsin taxpayer. More state revenue is spent per pupil in MPCP schools to achieve a proficient or advanced score than in MPS (which has a higher percentage of poor ED students), or in the 10 poorest non-Milwaukee public schools (see Table 4 and Figure 35).
76.1% 79.0%
83.4%
0%
10%
20%
30%
40%
50%
60%
70%
80%
90%
100%
Eco
no
mic
ally
Dis
adva
nta
ged
En
rollm
en
t
Wisconsin High ED Schools Milwaukee Voucher Schools Milwaukee Public Schools
46
Table 4. Real Cost per Pupil to Achieve a Score of Proficient or Advanced on State Math and Reading Tests, All Grades Tested
Data Milwaukee Voucher Schools Milwaukee Public Schools Wisconsin High ED Schools
State aid/pupil $6,442 $6,442 $5,372
Total testing enrolled 11,629 33,049 5,253
Testing total cost $74,914,018 $212,901,658 $28,219,116
Percent not testing 2.4% 0.7% 0.4%
Number testing Prof + adv reading 6,559 19,744 3,832
Number testing Prof + adv math 4,640 16,617 3,546
Percent testing Prof + adv reading 56.4% 59.7% 72.9%
Percent testing Prof + adv math 39.9% 50.3% 67.5%
Cost per pupil of Prof + adv achievement
Math $16,145 $12,812 $7,958
Reading $11,422 $10,783 $7,364
Figure 35. Real Cost Per Pupil to Achieve a Score of Proficient or Advanced on State Math and Reading Tests, All Grades Tested
(Note: Wisconsin High ED Schools defined as 10 highest ED enrollment districts; Milwaukee Voucher
Schools reporting FRL, n=68; Milwaukee Public Schools, n=113)
$7,958 $7,364
$16,145
$11,422
$12,812
$10,783
$0
$2,000
$4,000
$6,000
$8,000
$10,000
$12,000
$14,000
$16,000
$18,000
Math Reading
Co
st in
Sta
te R
eve
nu
e, D
olla
rs
Wisconsin High ED Schools Milwaukee Voucher Schools Milwaukee Public Schools

47
In spite of much lower rates of students scoring proficient and advanced, MPCP voucher schools report higher graduation rates based on the most recent two years’ raw data from all voucher and MPS schools.72 We developed a “graduation:proficiency ratio” to determine the number of students graduating compared to the total number of students testing who are proficient in 10th grade math and reading in statewide public schools, enrolled in the voucher program, and in MPS. The statewide public school student graduation:proficency ratio for reading is about 1:1. The MPS student ratio is about 2:1. The voucher program student graduation:proficiency ratio for reading is over 20:1. In mathematics, the statewide student ratio is about 1:1, MPS student ratio is about 3:1, and the voucher program student ratio is over 50:1 (see Figure 36). That means over 20 children graduate for every child proficient in 10th grade reading, and over 50 children graduate for every child proficient in 10th grade mathematics in the voucher program. It is widely accepted that if a student does not test proficient by grade 10, they will not likely be proficient by graduation.73 This raises a significant question of adequacy for voucher schools, as the expectation is for a high school graduate to be proficient in reading and math.
Figure 36. Two Year Median 10th Grade Reading and Math Proficiency Rates Compared to On-Time Graduation Rates, 2010-2012
The results of these analyses question the policy of further reducing MPS school funding (which supports schools of higher ED enrollment) when student outcomes for MPCP schools are worse than high ED schools in MPS and statewide, based on the available data. Further, the data bring into question the educational adequacy in MPCP schools with no accountability to state taxpayers.
72
http://oea.dpi.wi.gov/files/oea/pdf/MPCP-school-results-fall-2011.pdf 73
http://www.ednewscolorado.org/wp-content/uploads/2012/06/ReichardtReport60712.pdf
76.5%
71.0%
87.3%
35.8%
24.1%
70.6%
3.7% 1.6%
90.1%
0%
10%
20%
30%
40%
50%
60%
70%
80%
90%
100%
Reading Math Graduation
Pe
rce
nt
of
Stu
de
nts
Te
stin
g P
rofi
cie
nt/
Gra
du
atin
g
Wisconsin Public Schools Milwaukee Public Schools Milwaukee Voucher Schools

48
9. Discussion
The state budget process for the 2011-13 biennial budget was one of the most partisan and controversial in recent history. Setting politics aside, there were many economists and academics sounding warnings to politicians on both sides of the aisle regarding the broader economic consequences of 2011 Act 32 (Biennial Budget). While it is acknowledged that the national economy can usually have a greater impact on recession recovery, by any reasonable economic measure Act 32 contained provisions that exacerbated the recession for many lower income and working middle class Wisconsinites. In March 2011, UW-Madison Applied Economics Professor Steven Deller predicted the statewide impact of the Scott Walker 2011-2013 budget on the economy. His analysis predicted the following negative impacts before the budget was passed:74 Employment losses – 21,843 Business Sales losses - $1,882,686,783 State/Local Tax Revenue losses – $89,619,848 Professor Deller’s analysis and prediction has been reported in statewide media and confirmed by non-partisan economic analysis.75 The combination of larger recessionary pressures and budgetary impacts clearly continue to have a greater effect on low- to moderate-income families, and is likely to push more students into the ranks of the economically disadvantaged (ED). Disadvantaged students are also suffering from the cuts made to school districts as part of the 2011-2013 budget. As ED enrollment continued to increase, the resources for schools were being cut. The impact on school districts statewide was also predicted by non-partisan economists. On March 10, 2011, UW-Madison Professor Andrew Reschovsky at the LaFollette School of Public Affairs released a working paper analyzing the proposed revenue reduction impact on statewide school districts.76 The predicted statewide average amounted to a $547 loss per pupil in funding, and a total loss of $464,500,150 for the 2011-12 school year. The highest poverty districts were predicted to absorb a higher percentage of the per-student and total revenue limit. As cited above, this prediction was also accurate. The meaning of these budgetary and education funding decisions in Wisconsin become apparent in the context of our analyses of the School Report Cards and testing data. The Report Card data clearly demonstrate that this overall school performance measure is strongly correlated with level of ED in each school. As demonstrated in our first Report Card Study, nearly 50% of the school-to-school difference in School Report Card score can be explained by level of ED enrollment in the schools.77 While we found other factors having a significant impact, none came close to poverty. The Report Card analysis also raised serious doubt about the effectiveness of non-traditional charter schools in educating children of poverty.
74
Letter from Steven Deller to Wisconsin State Journal Reporter Steven Verburg, March 14,2011 “Re: Impact of Walker Budget Proposals” 75
http://host.madison.com/business/did-scott-walker-s-budget-cuts-hurt-economy-some-economists/article_125bd12a-6fca-11e2-ba01-0019bb2963f4.html?comment_form=true 76 Andrew Reschovsky, “An Analysis of the Proposal to Reduce Revenue Limits for Wisconsin School Districts” accessed at http://www.lafollette.wisc.edu/publications/workingpapers 77
http://forwardinstitutewi.org/wisconsin-report-card-study-2012/

49
Similarly, statewide testing data demonstrated a significant correlation to poverty. In Wisconsin, more of our children are moving into ED. These new populations of ED have been bringing their previously higher test scores into that group, giving the appearance of testing gains in ED students as the wide achievement gap remains. In reality, we are reaching critical mass of this effect and can expect to see further widening of the performance gap between ED and non-ED students and declines in overall performance. It is clear that the larger statewide fiscal policy is having a direct impact on the adequacy of students’ educational experience. The testing data also raises serious doubt about the effectiveness of private voucher school programs. More state funding per student is being spent on providing vouchers to families whose incomes exceed those qualifying as ED. These schools are underperforming the Milwaukee Public Schools they are supposed to be an effective alternative for, and there is little to no oversight for the funding they receive. There has also been little cooperation from private voucher school administrators and supporters in forming consistent methods for school assessment.78 It is very likely that the higher cuts in funding for higher poverty schools are a significant part of the problem in Wisconsin. As seen in Figure 6, above, high poverty schools saw a per pupil funding cut more than double the cut to low poverty districts ($703 compared to $319, respectively). A recent report by the non-partisan National Education Policy Center at the University of Colorado quantifies the importance of financial resources in educating children of poverty: “Economically disadvantaged children need approximately 40%-100% more funding per child. English language learners need 76% to 118% more. Yet for the nation as a whole, we spend $1,307 less per pupil on the education of disadvantaged students. Adequate or equitable funding is a legal requirement in most states but, more importantly, it is the foundation for any policy hoping to achieve equitable outcomes.”79 As we have made the connection between poverty and student/school performance, it is important to note the factors directly affecting student outcome as a result of the recent budget/funding policies in Wisconsin: 1. Economically disadvantaged enrollment – Recent state budgets have clearly played a role in more students dropping into the ranks of ED, with a higher financial burden being placed on lower-middle income families. The same state budget decisions have resulted in less funding to schools and areas of high ED. Based on previously cited performance data in the form of School Report Cards and testing outcome, we can cite a direct correlation of higher levels of school ED with lower School Report Card score, and student-level ED with lower percentages of proficient or advanced test scores. For this generation of students, we can predict with a reasonable amount of confidence the success of a students’ academic career based on their level of ED. The same can be said of a school or district statewide. No other single variable had a greater impact on student or educational outcome in our analysis.
78
http://www.jsonline.com/news/education/to-judge-the-performance-of-choice-schools-officials-need-consistent-data-vv8k4j0-190471761.html 79
http://nepc.colorado.edu/files/pb-options-6-moneymatters.pdf

50
2. Rural school districts – Rural school districts have significantly lower Report Card scores than urban/suburban school districts, even when controlling for the effects of poverty. Poor and rural school districts saw a greater negative impact from state funding cuts as a result of the 2011-2013 budget.80 3. Teacher experience and degree attainment – Teachers with greater experience and a master’s degree had a significant positive impact on school district Report Card Scores. Teacher experience and degree attainment accounted for 1.5% of the difference between districts. While any significant positive effect in educating children of poverty needs to be supported, recent budget decisions caused forced or voluntary retirements of record numbers of the most experienced teachers in the state, particularly in high poverty areas such as Milwaukee.81 4. State revenue caps and per student expenditure cuts – In comparison to ED, per pupil revenue caps were a small (0.5%), but significant factor in school district Report Card Score difference. The 2011-13 budget cut a greater share of revenue from high poverty schools than low poverty schools, diverting critical resources from districts with high poverty public schools.82 A large portion of the cut revenue went to funding non-traditional charter schools and private voucher program schools in these higher poverty districts.83 Further, the analysis we conducted shows that these non-traditional and private schools have highly suspect student outcomes, particularly with students of poverty. 5. Public schools – As cited previously, the data show that public schools are doing a better job of offsetting the effects of poverty than non-traditional charter schools and private voucher schools, based on Report Card and test scores. However, the 2011-13 budget diverted money away from the public schools who serve a higher proportion of ED and special needs students. The current budget and funding structure has created a dichotomy in both schools and students. There are schools and students of ED whose numbers are growing, and schools and students who are non-ED. ED school and student resources are shrinking in spite of their increasing population share, and their low outcomes and performance trends are becoming predictable and established. Non-ED schools and students are seeing stable or increasing resources as their enrollment share decreases, and they have predictable levels of success in student outcomes. Public attitudes and beliefs on the subject of poverty and education, as well as those of public policy makers in Madison, do not effectively address the problem. That in itself is a roadblock to real and effective education reform. Current “reformers” in education make no mention of the impact of poverty. This is a major hindrance to real education improvement. A March 2013 survey conducted for the conservative Wisconsin Policy Research Institute (WPRI) of Milwaukee households demonstrated that people’s attitudes about poverty and education reflect their
80
Andrew Reschovsky, “An Analysis of the Proposal to Reduce Revenue Limits for Wisconsin School Districts” accessed at http://www.lafollette.wisc.edu/publications/workingpapers 81
http://eis.dpi.wi.gov/files/eis/pdf/tl1112.pdf 82
“Making Matters Worse: School Funding, Achievement Gaps and Poverty Under Wisconsin Act 32,” James J. Shaw and Carolyn Kelley, May 4 2012, UW-Madison Educational Leadership and Policy Analysis http://elpa.education.wisc.edu/docs/elpa-documents/shawandkelleypolicybrief.pdf?sfvrsn=2 83
“MPCP Facts and Figures for 2012-13” accessed at http://sms.dpi.wi.gov/sms_geninfo
51
personal beliefs about what education should be, as opposed to reality.84 Question 23 of the survey asked the following of respondents:
“What about the capacity of poor students to learn academic material? In your view, are students from poor families much more able, slightly more able, just as able, slightly less able, or much less able to learn academic material as students from wealthier families?” Over 60% of respondents felt that “poor students” were as, or more able to “learn academic material” as students “from wealthier families.” Only 36% felt students of poverty faced a disadvantage. This is more a reflection of what these respondents want to believe about education. We very much want to believe that a sound, basic education is not only available to all, but can be a path out of poverty. The data dispute that belief. In the same survey, respondents also expressed a belief that Milwaukee Public Schools require more funding to be successful. Question 14 split the sample, asking the question in one sample with fiscal information included (the per-student expenditure figure includes all student costs, including non-instructional costs such as transportation):
“According to the most recent information available, roughly $14,000 is being spent each year per child attending public schools in Milwaukee. Do you think that government funding for public schools in Milwaukee should greatly increase, increase, stay about the same, decrease or greatly decrease?”
Over 62% of respondents felt funding should be increased. Only 10% said “decrease” funding. In the second form of the same question, the fiscal information was omitted:
“Do you think that government funding for public schools in Milwaukee should greatly increase, increase, stay about the same, decrease or greatly decrease?”
Over 77% felt funding should be increased. Only about 8% felt it should be cut. This clearly demonstrates the willingness of people to support quality public schools in Milwaukee. It also points to the likelihood that if people in Milwaukee were aware of the actual effects of poverty on education outcome, they would favor a system which would address this critical issue.
10. Current Walker Budget Proposal
Governor Scott Walker recently released his 2013-2015 budget proposals for education.85 The funding and assessment programs in the current Walker Budget proposal are contrary to what the best available data in this report have presented. It is possible to accurately predict that should the proposed mechanisms be enacted into policy, they will only serve to make matters far worse for students in poverty. Here are the specific issues that can be addressed by this report: School Funding – In what Governor Walker calls a step closer to funding parity, public and charter schools will see a 1% increase per pupil in state funding. Voucher schools will receive an increase of 9.4%
84
http://www.wpri.org/polls/December2012/MarchToplines.pdf 85
http://walker.wi.gov/Default.aspx?Page=85af883b-0583-43a2-b361-8f1880750bf0
52
(K-8 schools), and an increase of 22% (High School) per pupil in state funding.86 As with the 2011-13 budget, higher poverty public schools will bear the brunt of this funding disparity, as the funding formula will not be changed to compensate for rising levels of ED. Figures 37 and 38 illustrate the growing state funding disparities between public and private schools in actual and inflation-adjusted state funding, respectively. Note that after adjusting for inflation in the proposed education budget, private voucher schools will have exceeded 1999-2000 state funding per pupil levels, while public school funding will still be under 1999-2000 levels, by more than $1000 per pupil. Voucher School Expansion – From the Governor’s press release: 87
“Open the choice program to school districts with at least two underperforming schools (those receiving School Report Card grades of "fails to meet expectations" or "meets few expectations"), at least 4,000 students, and at least 20 students intending to participate in the program. This expansion will be capped at 500 students statewide for fiscal year 2014 and 1,000 students statewide for fiscal year 2015. Eligibility requirements for students would be similar to current choice program eligibility requirements.” This proposal will assure that schools and districts of high ED will lose resources. As cited above, the School Report Card scores are directly correlated to level of ED. The districts with underperforming schools are therefore districts with schools of higher ED. The funding to operate the newly proposed voucher school expansion will come directly out of those public schools of highest ED, and be put into schools which do not serve as large a proportion of high poverty populations. K-12 Performance Incentive Program – From the Governor’s press release:88
Reward High-Performing Schools: $24 million will be awarded to schools with grades of “significantly exceeds expectations” or “exceeds expectations.” A total of $30 million will be awarded to schools that improve Report Card scores by at least three points (out of 100 total) over the prior year. Although school districts are permitted to set policies regarding district wide objectives for use of awards, awarded schools will have discretion over spending the awards.
Help Under-Performing Schools: $10 million will be available as competitive grant funding for school districts that present innovative plans to turn around failing schools. Support for these districts recognizes the unique challenges faced by schools and provides opportunity and support for improvement.
As this report has previously cited, the School Report Card scores are so strongly correlated to level of ED enrollment that this proposal stands to exacerbate a distinct dichotomy of schools: those of poverty and those of non-poverty. Schools of ED would be faced with further challenges to educating children of poverty, if not becoming threatened outright with closure. Meanwhile, more affluent school districts will receive additional resources as a result of their typically higher Report Card scores.
Based on the current data, we can predict the outcome of such a system operating under the Walker proposals. Schools in more affluent districts are high performing, and already receive a larger share of state aid. These schools and students would, by their very nature, receive more funding under the
86
http://walker.wi.gov/Default.aspx?Page=65ea2073-bf41-460b-8f8a-911f18f8c620 87
Ibid 88
http://walker.wi.gov/Default.aspx?Page=85af883b-0583-43a2-b361-8f1880750bf0

53
incentive plan for high-performing schools. Schools of high poverty, on the other hand, would be required to meet a set of standards and improvements they would likely be unable to attain, based on the predicted effects of poverty. Without taking into account the overreaching effects of poverty, any “incentive” plan of this nature would also be highly suspect. It would have the predictable outcome of creating an even larger inequality in educational opportunity and resources for students attending schools with high poverty enrollment.
Figure 37. MPCP (Voucher School) Revenue per Member Compared with Statewide Public School Revenue per Member 1999-2000 to 2013-14 Projected in Actual Dollars Based on Walker Budget Proposal
4,000
4,500
5,000
5,500
6,000
6,500
7,000
7,500
8,000
Stat
e A
id in
Do
llars
Voucher School Revenue per Member
Public School Revenue per Member
Walker Budget
High School
K - 8

54
Figure 38. MPCP (Voucher School) Revenue per Member Compared with Statewide Public School Revenue per Member 1999-2000 to 2013-2014 Projected in Inflation-Adjusted Dollars Based on Walker Budget Proposal
4,000
4,500
5,000
5,500
6,000
6,500
7,000
7,500
8,000
Stat
e A
id in
Do
llars
Inflation Adjusted Voucher School Revenue per Member
Inflation Adjusted Public School Revenue per Member
High School
Walker Budget
K - 8

55
11. Conclusion In conclusion, we believe the case is strong for an adequacy challenge to the constitutionality of Wisconsin’s education funding and delivery formula, and the education portion of the budgets of 2009-2011 and 2011-2013. These consecutive budgets have exacerbated an already growing dichotomy between ED and non-ED schools and students. The proposed 2013-2015 budget, with its incentive plan and diversion of public school funds to an expanded voucher system, will further widen this gap. A situation exists that we can now, with a relatively high degree of certitude, predict both school and student performance based on the level of poverty. The fact also exists, based on the same data, that students of poverty do not have the same educational opportunity as provided for in the state constitution and statutes:
“The legislature has articulated a standard for equal opportunity for a sound basic education in Wis. Stat. §§ 118.30(1g)(a) and 121.02(L) (1997-98) as the opportunity for students to be proficient in mathematics, science, reading and writing, geography, and history, and for them to receive instruction in the arts and music, vocational training, social sciences, health, physical education and foreign language, in accordance with their age and aptitude.” 89 (Emphasis added)
The proficiency gaps which exist, coupled with the outsized resource cuts to schools and students of ED should finally force the issue, and bring the question of adequacy to the current system. The basis for this question is found in the final statement in the 2000 Court decision in Vincent v. Voigt:
“So long as the legislature is providing sufficient resources so that school districts offer students the equal opportunity for a sound basic education as required by the constitution, the state school finance system will pass constitutional muster."90 This report has demonstrated in detail that the resources being afforded schools and students of poverty are insufficient, and indeed are facing further reduction. Moreover, the resources being diverted from schools of poverty into non-traditional alternative education programs are producing questionable results with little to no accountability for the funding they receive. The failure of Wisconsin policy makers to acknowledge and address these issues is creating a generation of ED students that will lag far behind their more fortunate peers.
Public schools are not failing Wisconsin’s students, the state of Wisconsin is failing the public schools which serve these students.
89
http://www.wicourts.gov/html/sc/97/97-3174.htm 90
Ibid
56
12. Policy Recommendations 1. Fair Funding – The Legislature should approve, and the Governor should sign, Dr. Tony Evers’ “Fair Funding” formula into law.91 This would be a first step toward addressing the increasing needs of rural and urban districts most affected by poverty. 2. Address Issues of Poverty and Education – The two greatest challenges to ensuring a prosperous and vibrant Wisconsin for future generations are poverty and education. The Governor should join with non-partisan, bi-partisan, broad-based constituent groups to appoint a “Blue Ribbon Commission.” The commission would be charged with a one-year mission to develop a statewide plan bringing parents and communities (rural and urban) impacted by poverty together for the purpose of implementing an intervention plan to address poverty and education issues. There are already successful models that address the external poverty issues in communities that have negative effects on education.92 93 Achievement gaps are largely attributable to factors outside of school walls. If Wisconsin is to substantially narrow these gaps, education policy must incorporate health and nutrition supports and after-school enrichment to address barriers to learning that are driven by child poverty. 3. Voucher Program Sunset – The twenty-year Milwaukee and Racine private school voucher experiment should be sunsetted by the Legislature in 2024. The voucher experiment can show no positive voucher school effects on student outcomes and attainment, beyond what already can be attributed to the voucher schools’ select student demographic and parental factors. Taxpayers should not be forced to fund a second statewide school district, nor an expensive entitlement program, when the public schools are not failing. It is, in fact, the state of Wisconsin that is failing public schools and the children they serve. Dividing resources between two school districts exacerbates this growing problem in the face of increasing poverty rates. 4. Charter Schools – Charter schools eligible for state aid should be allowed only under the auspices and as an instrumentality of an existing public school district to ensure public accountability in fiscal, academic, staff, and student functions. 5. School Report Cards – School Report Cards issued by DPI should be used as part of the big picture to measure overall school and student performance along with other standards and measures, balancing “input” (educational access, quality, services, resources, etc.) and “output” (student results). It should be acknowledged that use of School Report Cards exclusively for reward, incentive, funding, penalty, or other fiscal consequence is improper and poor public policy.
91
http://fairfunding.dpi.wi.gov/ 92
http://www.diplomasnow.org/ 93
http://www.boldapproach.org/comprehensive-strategies