wisconsin lakes green algae toxic waters 200,000 plus acres aquatic plants habitat energy...
TRANSCRIPT

WISCONSIN LAKES
Courtesy of Lake PartnershipsWisconsin Department of Natural Resources Wisconsin Association of LakesUniversity of Wisconsin Extension

Wisconsin’s Glacial LegacyDefinitions & Background
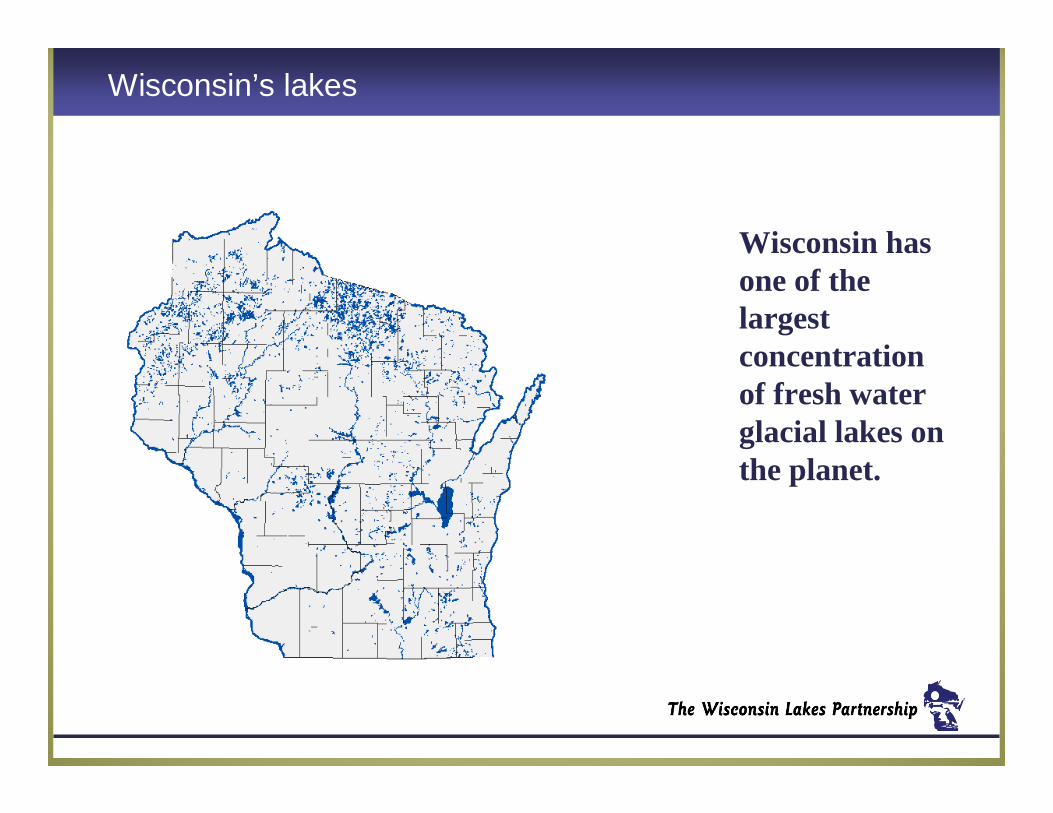
Wisconsin hasone of the largestconcentrationof fresh water glacial lakes onthe planet.
Wisconsin’s lakes

Lakes Provide Services
Ecosystem
Cultural
Societal

Recent History of Wisconsin’s Lakes
Steve Carpenter

Housing density 1940

Housing density 1990

Housing density 2010

Wisconsin’s Lakes are Changing Faster than Ever:
Algae blooms (phosphorus pollution)
Destruction of shoreline habitat
Invading plants andanimals
Steve Carpenter

OVERVIEW Unique Properties of Water Lake Types Physical, Chemical, Biological and Habitat
Characteristics Technical Aspects
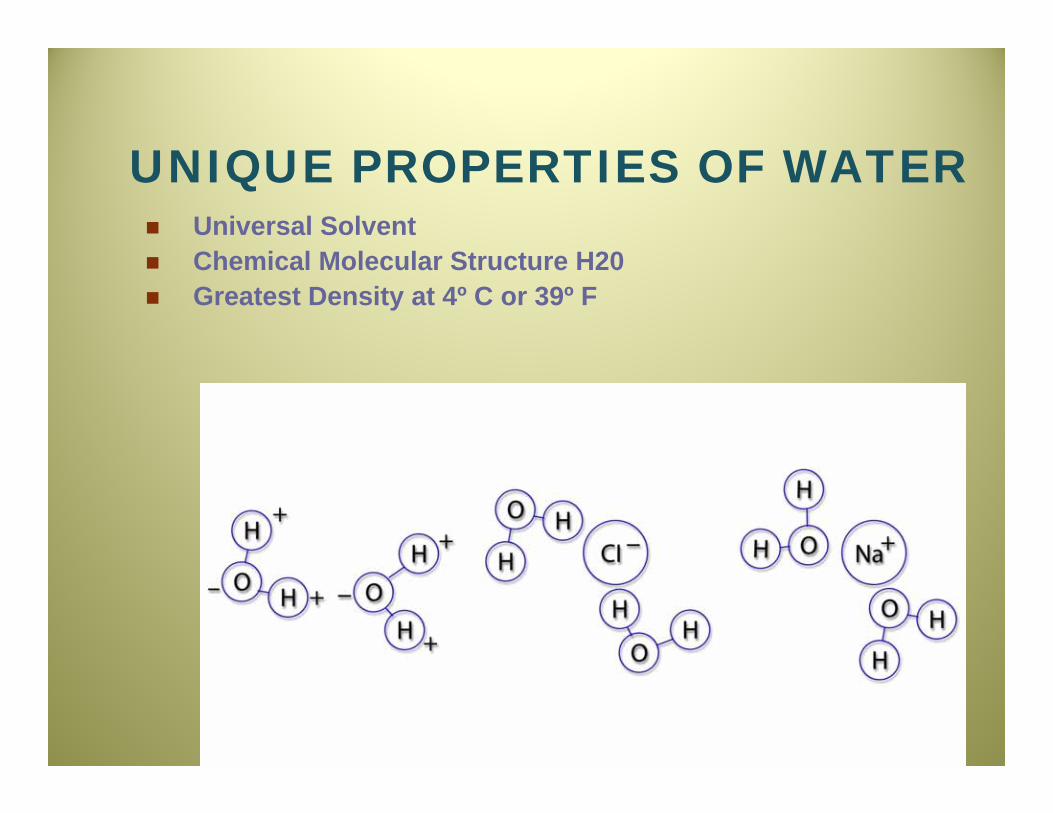
UNIQUE PROPERTIES OF WATER Universal Solvent Chemical Molecular Structure H20 Greatest Density at 4º C or 39º F

Living organisms (including us!) are ~70% water
71% Earth’s surface covered by water
<1% water on Earth is freshwater
.009% water on Earth is freshwater lakes
From waterencyclopedia.com
Unique Properties of Water

UNIQUE PROPERTIES OF WATER Physical
Properties 71% Earth’s
Surface Covered by Water
<1% Water on Earth is Freshwater
.009% water on Earth is Freshwater Lakes

HYDROLOGIC CYCLE

OVERVIEW Unique Properties of Water Lake Types Physical, Chemical, Biological and Habitat
Characteristics Technical Aspects

LAKE TYPES Seepage Groundwater Drainage Drainage Impoundments Oxbow

SEEPAGE LAKE Natural Lake Water Source
Groundwater Precipitation
No Stream Outlet/ Inlet
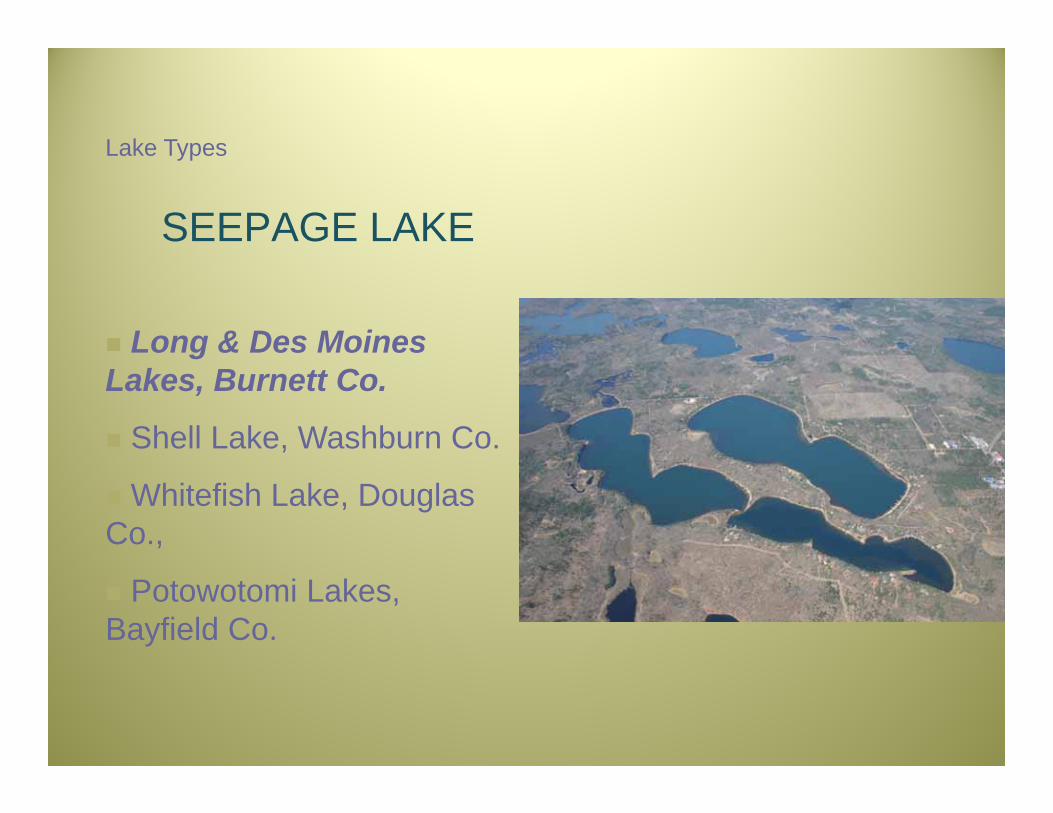
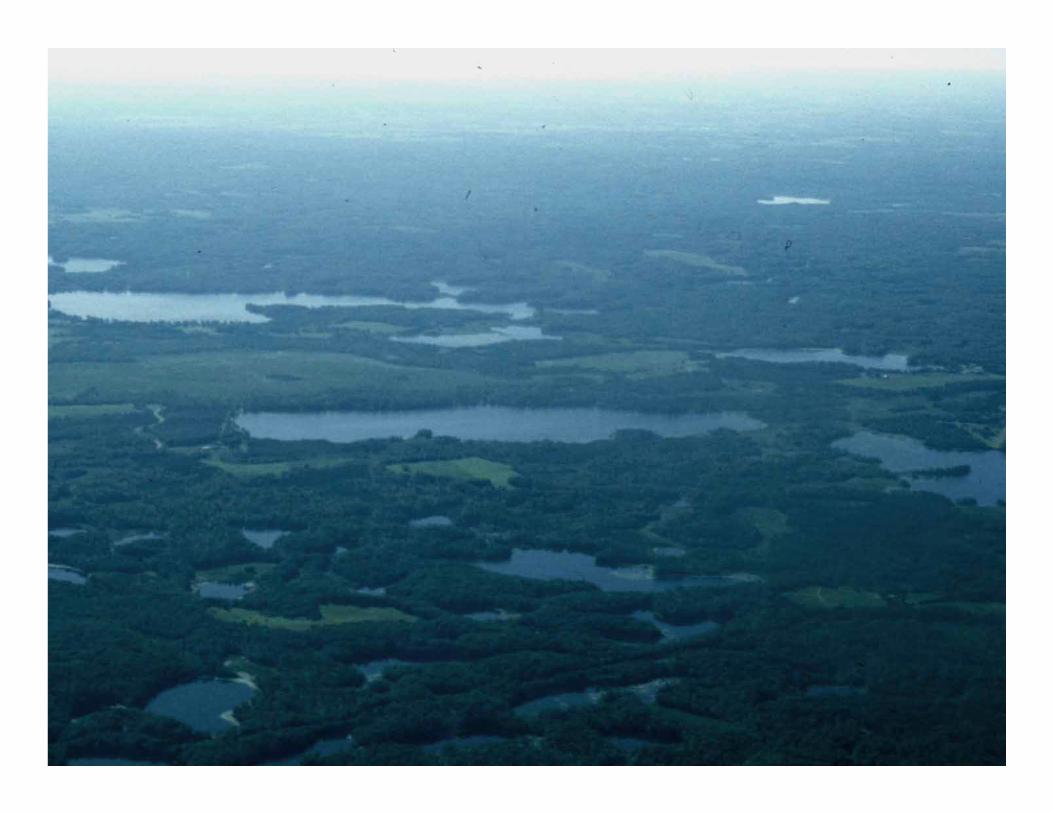
SEEPAGE LAKE
Lake Types
Long & Des Moines Lakes, Burnett Co.
Shell Lake, Washburn Co.
Whitefish Lake, Douglas Co.,
Potowotomi Lakes, Bayfield Co.
SEEPAGE LAKE
Round Lake, Chippewa County
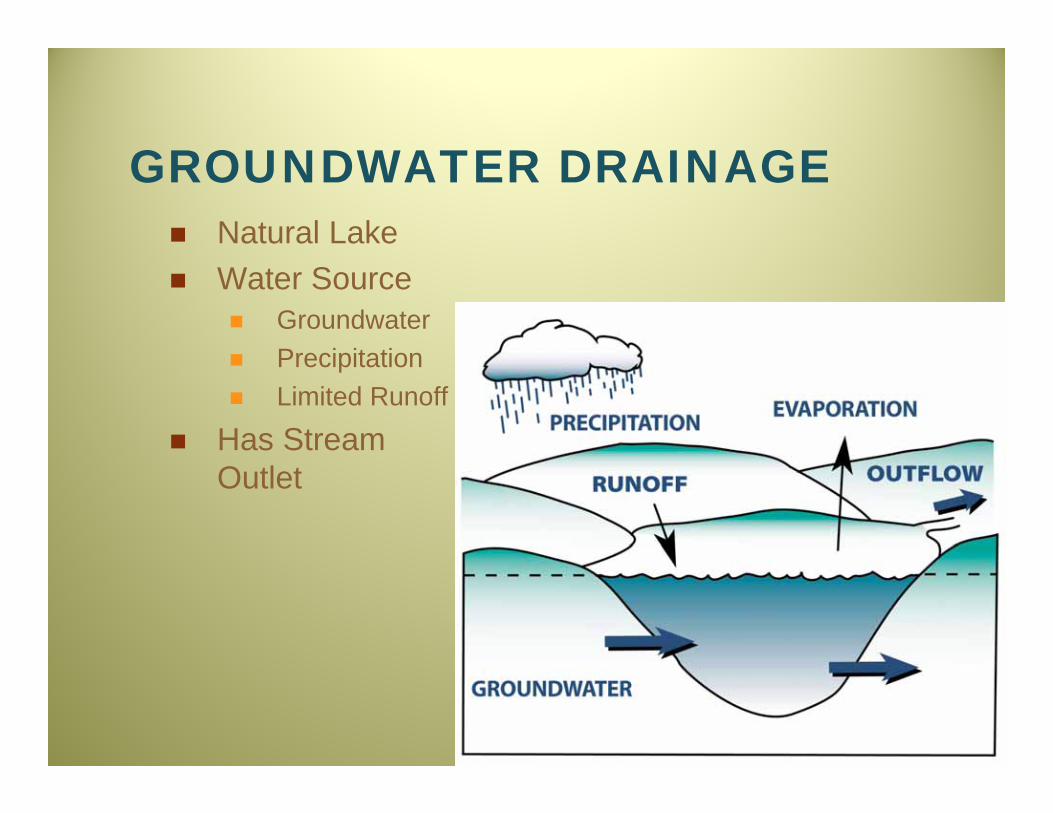
GROUNDWATER DRAINAGE Natural Lake Water Source
Groundwater Precipitation Limited Runoff
Has Stream Outlet

GROUNDWATER DRAINAGE LAKE
Sand Lake, Chippewa County

DRAINAGE LAKE Water Source
Streams Groundwater Precipitation Runoff
Stream Drained

DRAINAGE LAKE
Long Lake, Chippewa County

IMPOUNDMENT A manmade lake Dammed River
or Stream

IMPOUNDMENT
Lake Altoona, Eau Claire County
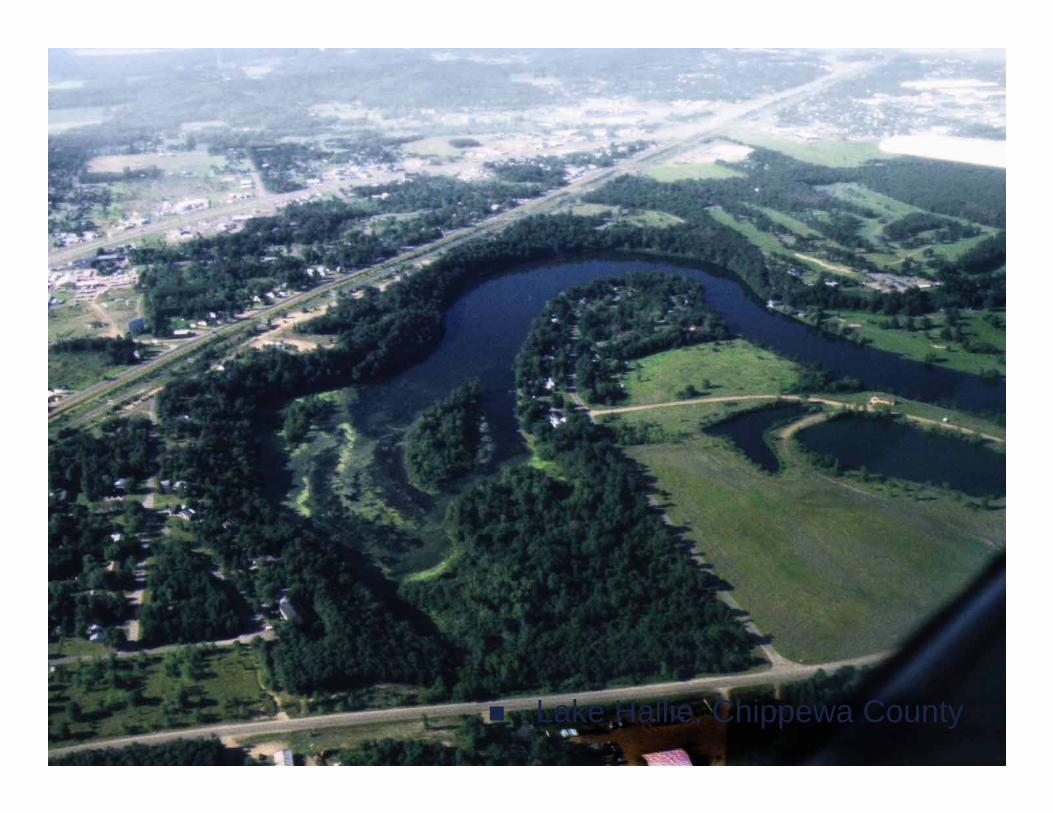
OXBOW
Half Moon Lake, Chippewa County Lake Hallie, Chippewa County

OVERVIEW Unique Properties of Water Lake Types Physical, Chemical, Biological and Habitat
Characteristics Technical Aspects
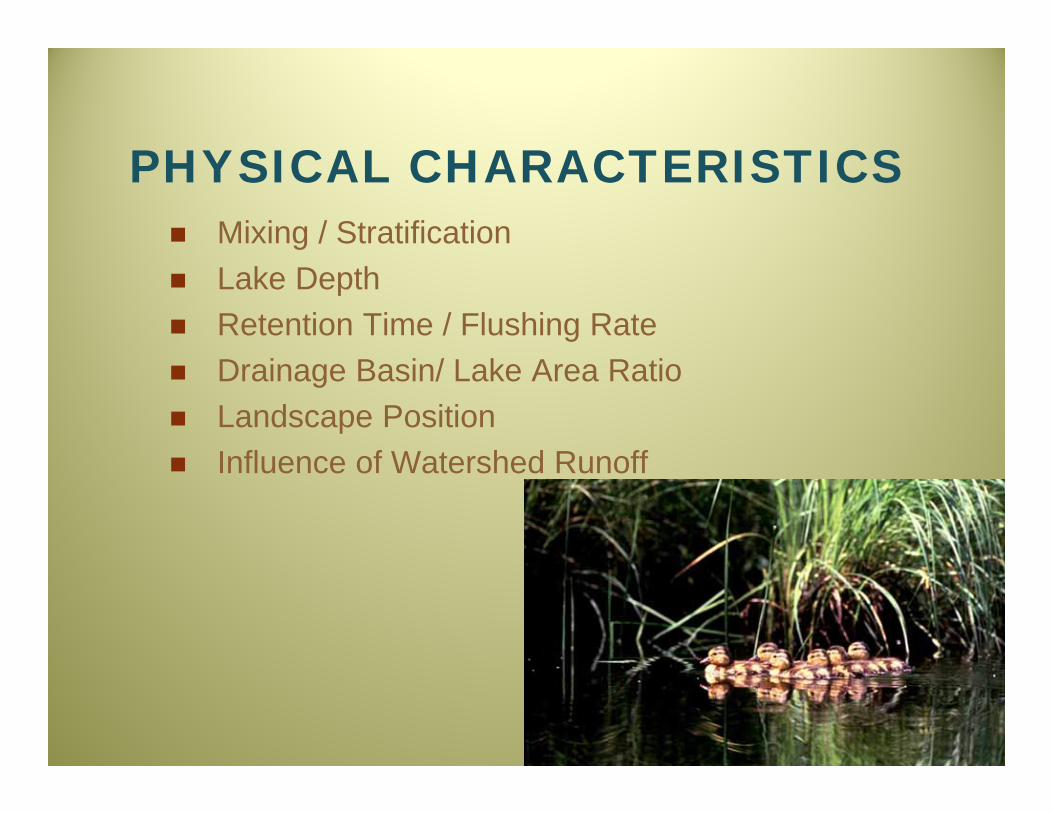
PHYSICAL CHARACTERISTICS Mixing / Stratification Lake Depth Retention Time / Flushing Rate Drainage Basin/ Lake Area Ratio Landscape Position Influence of Watershed Runoff

MIXING/ STRATIFICATION

LAKE DEPTH MATTERS Deep Lakes
Stratify
Shallow LakesContinuous Nutrient Recycling

Lake Level vs Lake Volume

RETENTION TIME/FLUSHING RATE How long would it
take to fill a drained lake?
Retention Time Matters
Long Lake & Altoona Long Lake, 7years Lake Altoona, 22days

DRAINAGE BASIN/LAKE AREA RATIO Seepage Lake- small Drainage Lake- large
watershed Seepage Lake w/
drainage area mapped Round Lake

LANDSCAPE POSITION

CHEMICAL CHARACTERISTICS Chemical Characteristics Limiting Nutrient Concept P vs N Lake 227

CHEMICAL CHARACTERISTICS Nutrients
P N
pH Hardness/ Alkalinity Dissolved Oxygen
(optimum 5 ppm)

CHEMICAL CHARACTERISTICS
Source: The Biology of Lakes and Ponds, by Christer Bronmark and Lars-Anders Hansson

Phactoids: Importance of P to organisms
Phosphorus is a critical nutrient Genetic molecules: DNA, RNA Structural molecules: phospholipids in cell walls Energy metabolism: ATP Every living organism needs phosphorus
A little P goes a long way 1 lb of P can produce 500 lb of algae, and that P can be recycled many
times
Phosphorus is less abundant than most other nutrients Both N and P tend to be high in demand by organisms, relative to their
supply in the environment N is often the limiting nutrient in terrestrial and marine ecosystems (with
P close behind...) But in lakes, P is nearly always the principal limiting nutrient

LIMITING NUTRIENT PRINCIPLE…That Nutrient in Least Supply
Relative to Plant Needs
N:P Ratio in plant Tissue 10:1 - 15:1
If the Ratio of N:P in Water is<10:1 Nitrogen Limited>15:1 Phosphorus Limited
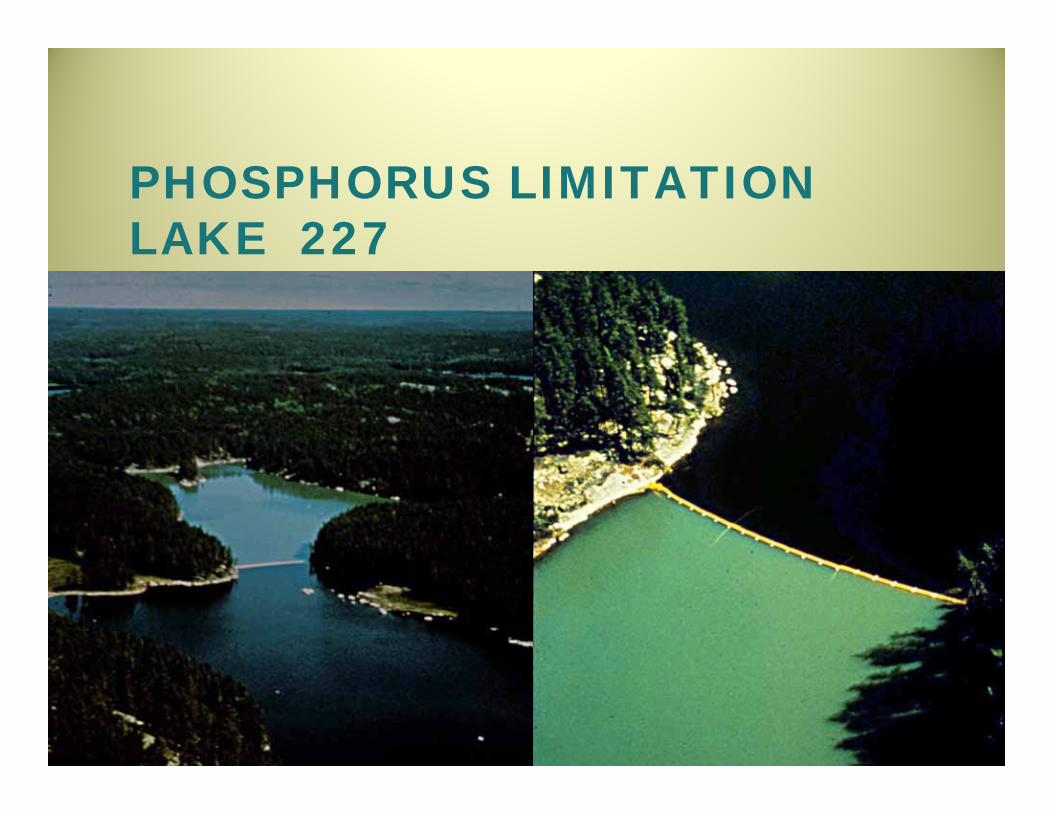
PHOSPHORUS LIMITATIONLAKE 227

TOTAL PHOSPHORUS/ CHLOROPHYLL a RELATIONSHIP Phosphorus
causes algaeto grow

Ecoregions
5 10 20 50 100 200
12
510
2050
100
200
Total Phosphorus (g L)
Chl
orop
hyll
a (
gL)
N Lakes & ForestsN Central Hardwood ForestsSE Wisc Till PlainsDriftless Area
N = 602

Why Develop the Criteria? Obvious water quality problems in state caused by
excess nutrient loading
Numeric goals for protecting or restoring Recreational and Fish and Aquatic Life Uses
EPA requirement

Specific Lake Criteria 2-story fishery lakes – 15 ug/l
Stratified seepage lakes – 20 ug/l
Stratified drainage lakes – 30 ug/l
Stratified reservoirs – 30 ug/l
Non-stratified lakes – 40 ug/l
Non-stratified reservoirs – 40 ug/l

TROPHIC STATE INDEX
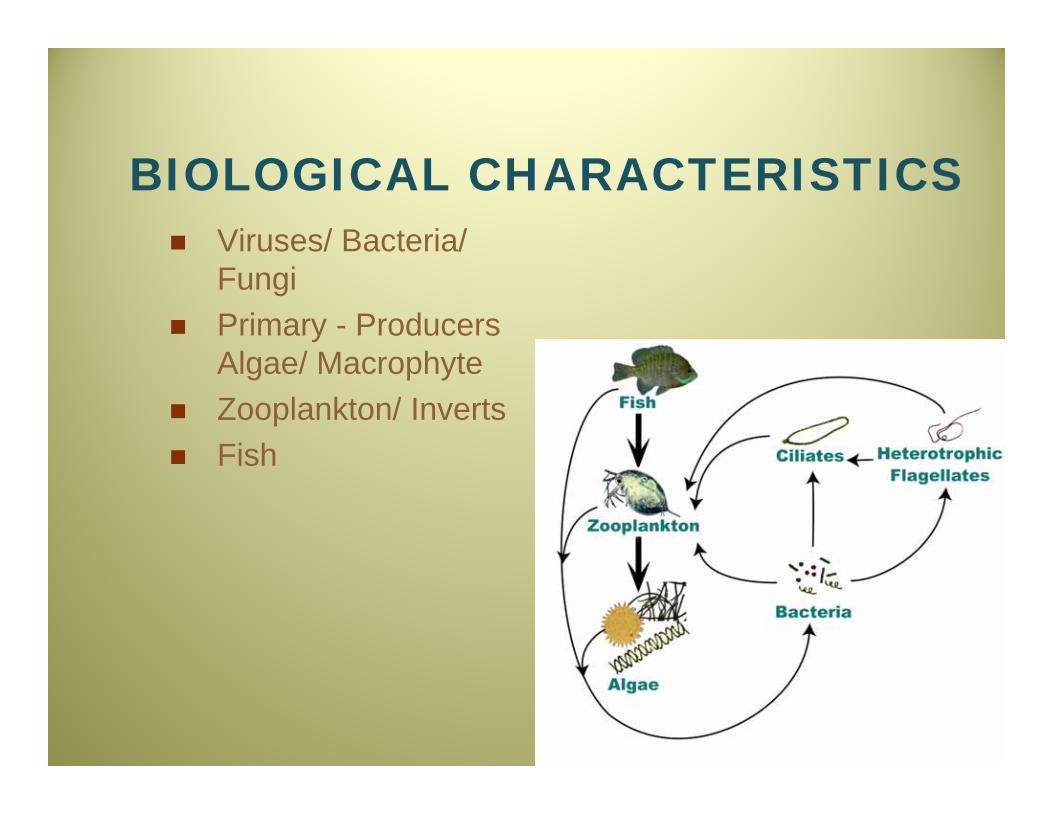
BIOLOGICAL CHARACTERISTICS Viruses/ Bacteria/
Fungi Primary - Producers
Algae/ Macrophyte Zooplankton/ Inverts Fish
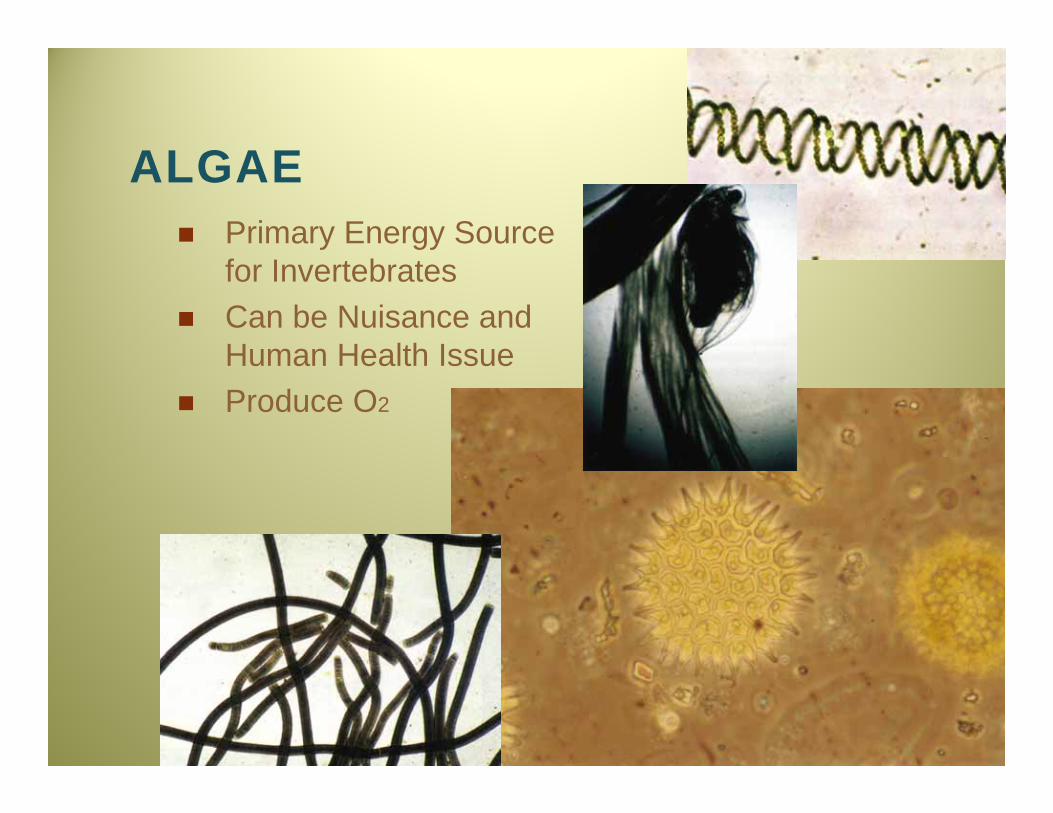
ALGAE Primary Energy Source
for Invertebrates Can be Nuisance and
Human Health Issue Produce O2

Human Health Concerns
Toxic algae

http://dhs.wisconsin.gov/eh/bluegreenalgae/#NewProg
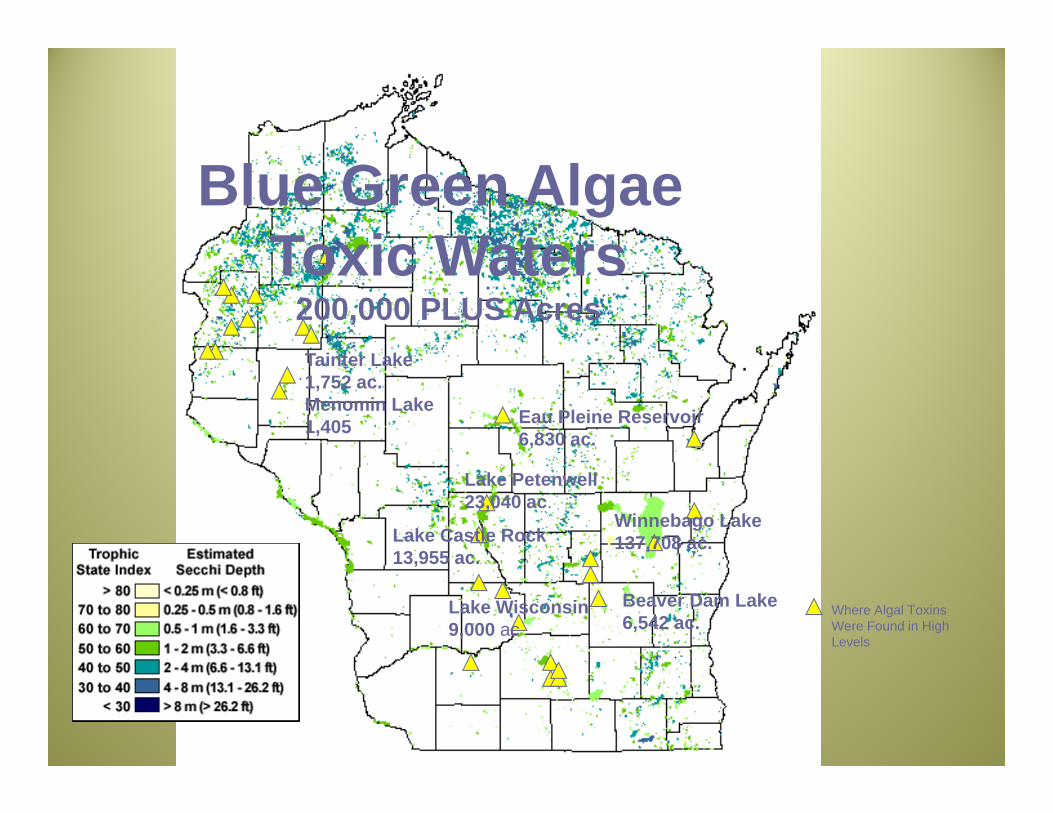
Where Algal Toxins Were Found in High Levels
Lake Petenwell23,040 ac.
Lake Castle Rock13,955 ac.
Eau Pleine Reservoir6,830 ac.
Winnebago Lake137,708 ac.
Lake Wisconsin9,000 ac
Beaver Dam Lake6,542 ac.
Tainter Lake1,752 ac.Menomin Lake1,405
Blue Green Algae Toxic Waters
200,000 PLUS Acres

AQUATIC PLANTS Habitat Energy Dissipation O2 Producers
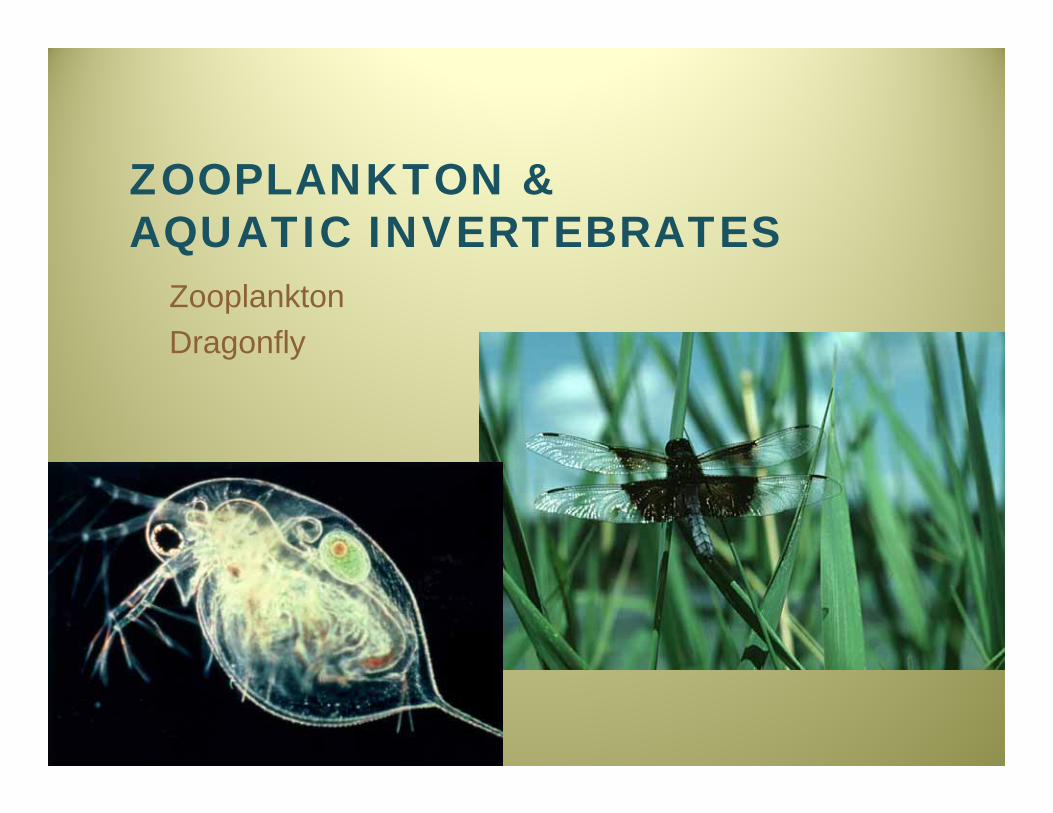
ZOOPLANKTON &AQUATIC INVERTEBRATES
ZooplanktonDragonfly
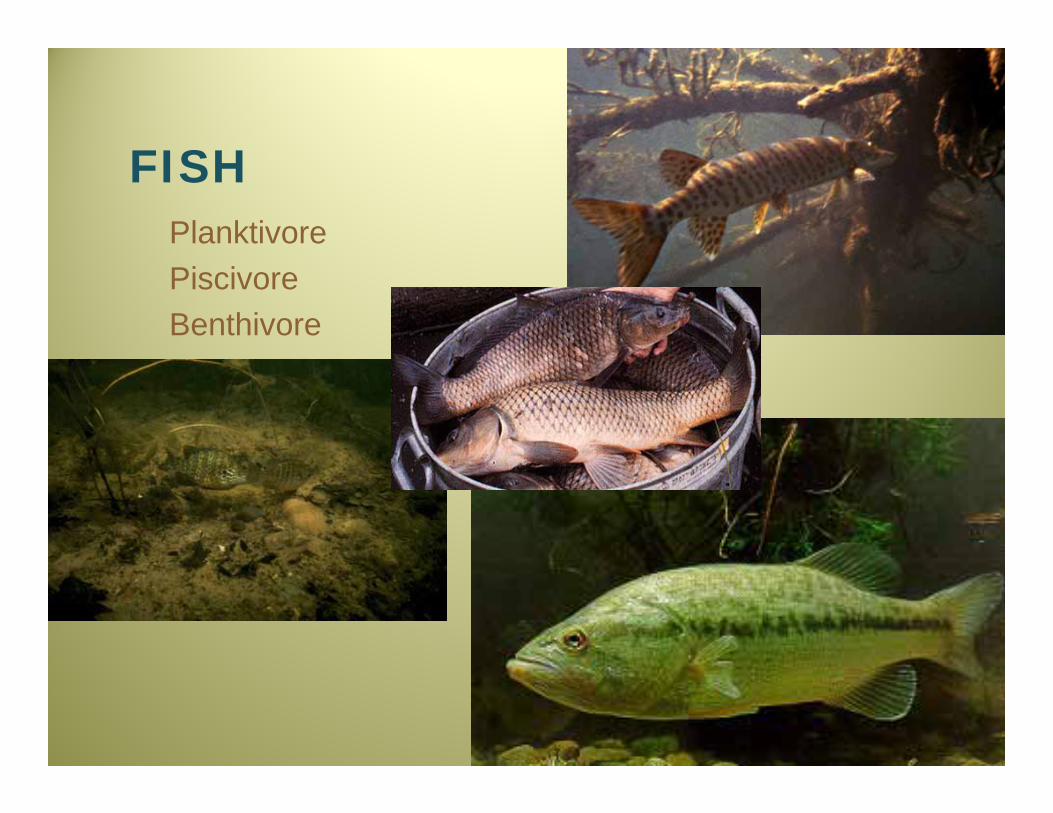
FISHPlanktivorePiscivoreBenthivore

TROPHIC PYRAMID

Fish species vary relative to lake trophic status
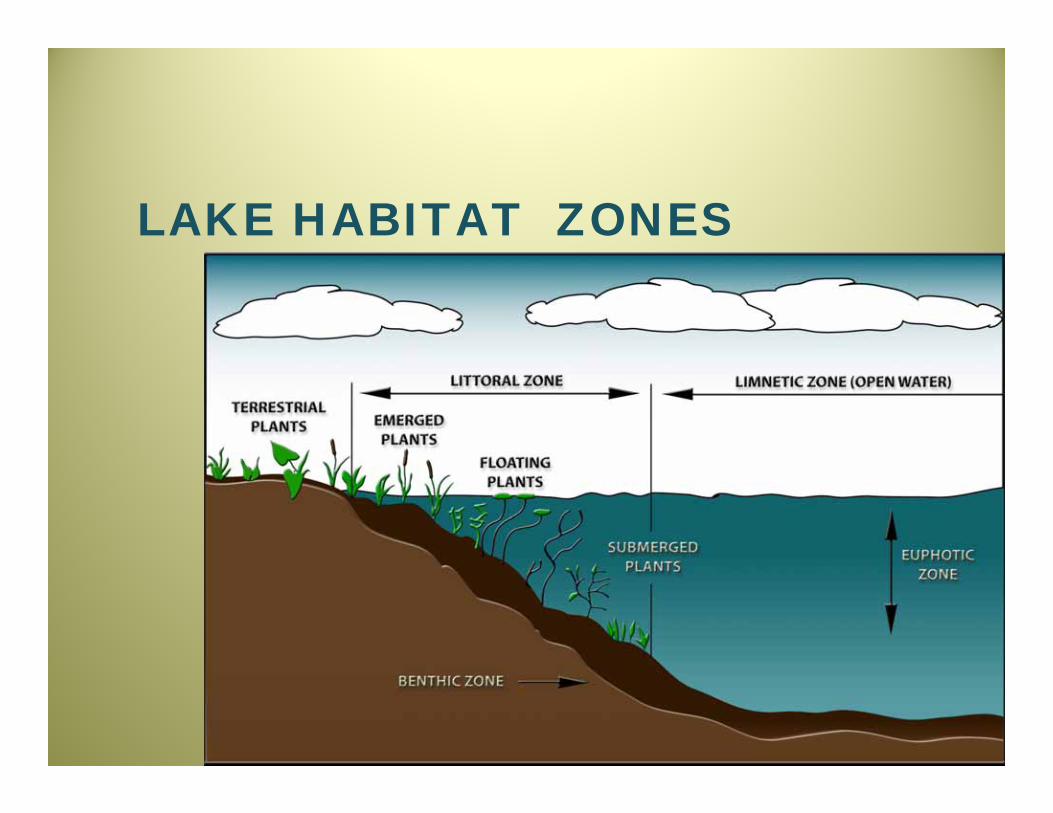
LAKE HABITAT ZONES
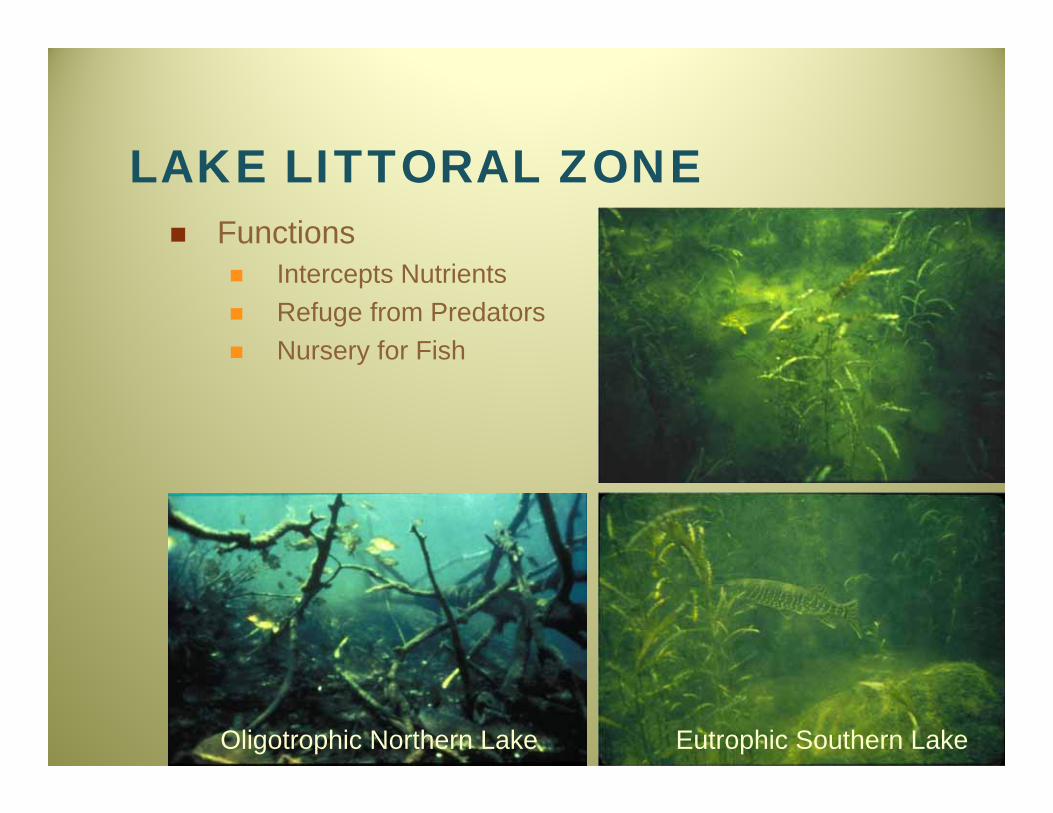
Oligotrophic Northern Lake Eutrophic Southern Lake
LAKE LITTORAL ZONE Functions
Intercepts Nutrients Refuge from Predators Nursery for Fish

ENVIRONMENTAL SIGNS OF DEGRADATION

LOSS OF WATER CLARITY
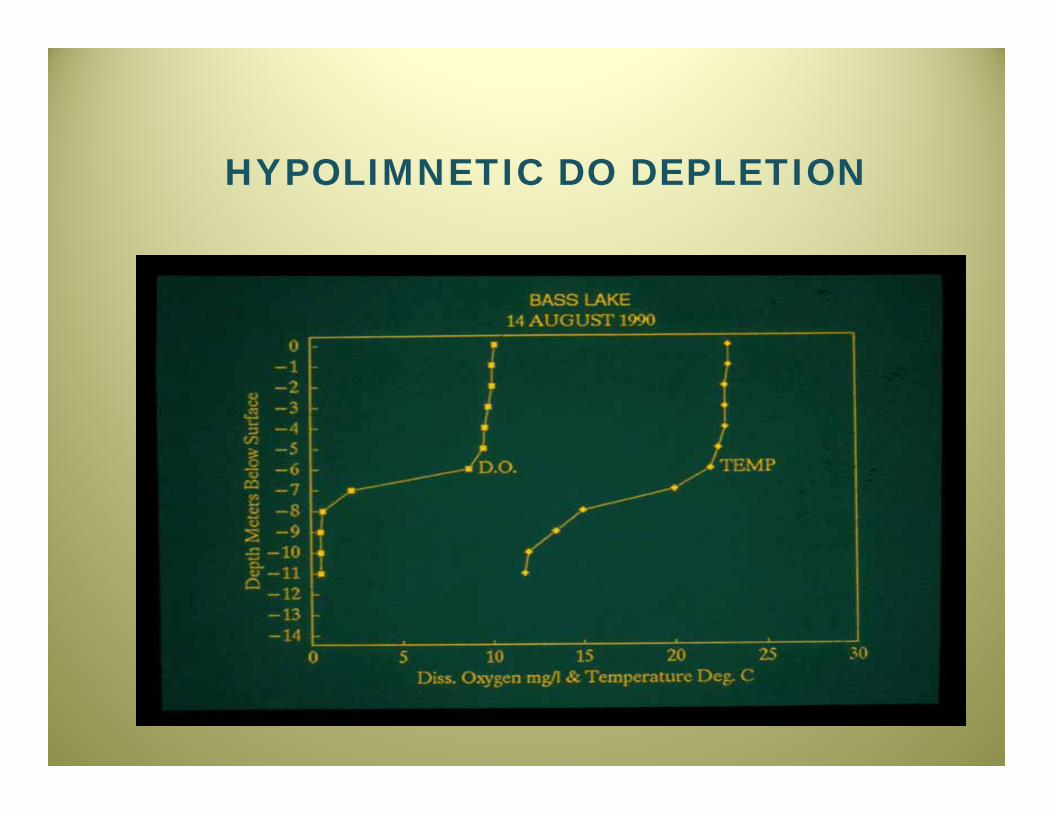
HYPOLIMNETIC DO DEPLETION

HARMFUL ALGAE BLOOMS
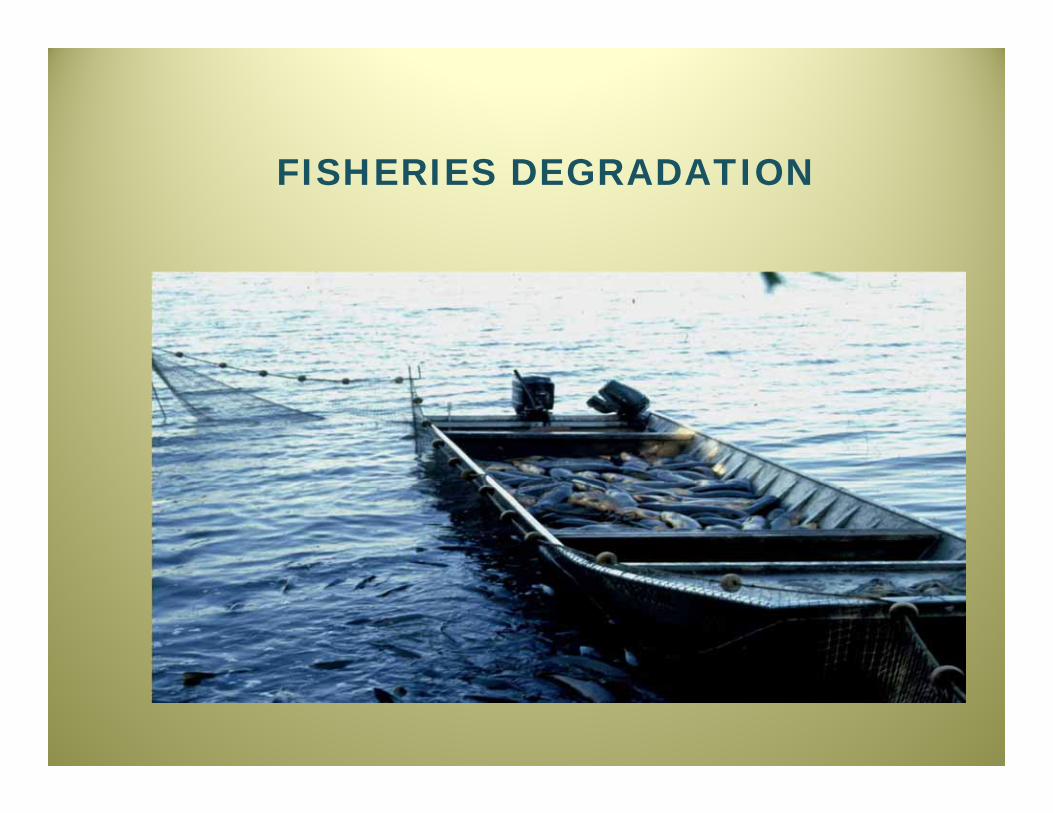
FISHERIES DEGRADATION

LEAVING A LEGACY
Help Protect Wisconsin’s…WATER RESOURCES.

PALEOLIMNOLGY

PALEOLIMNOLGY
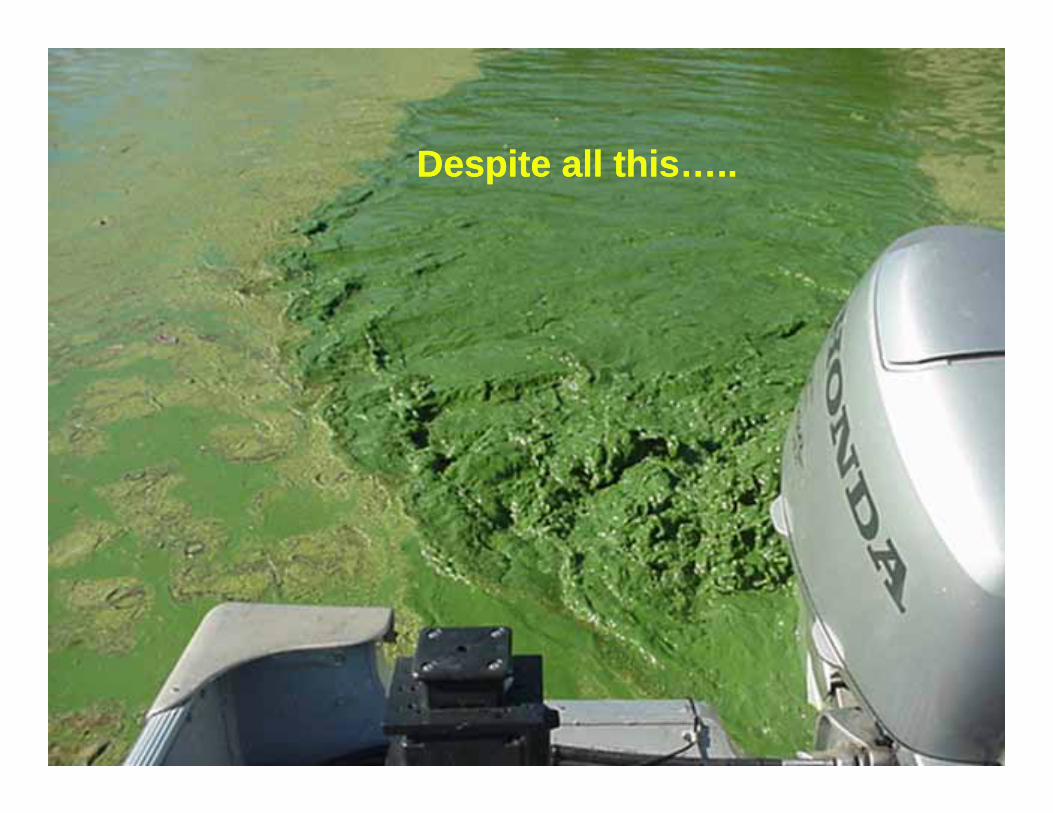
Despite all this…..Despite all this…..

Where Algal Toxins Were Found in High Levels
Lake Petenwell23,040 ac.
Lake Castle Rock13,955 ac.
Eau Pleine Reservoir6,830 ac.
Winnebago Lake137,708 ac.
Lake Wisconsin9,000 ac
Beaver Dam Lake6,542 ac.
Tainter Lake1,752 ac.Menomin Lake1,405
Blue Green Algae Toxic Waters
200,000 PLUS Acres

Algal toxinsA threat to both human and animal health
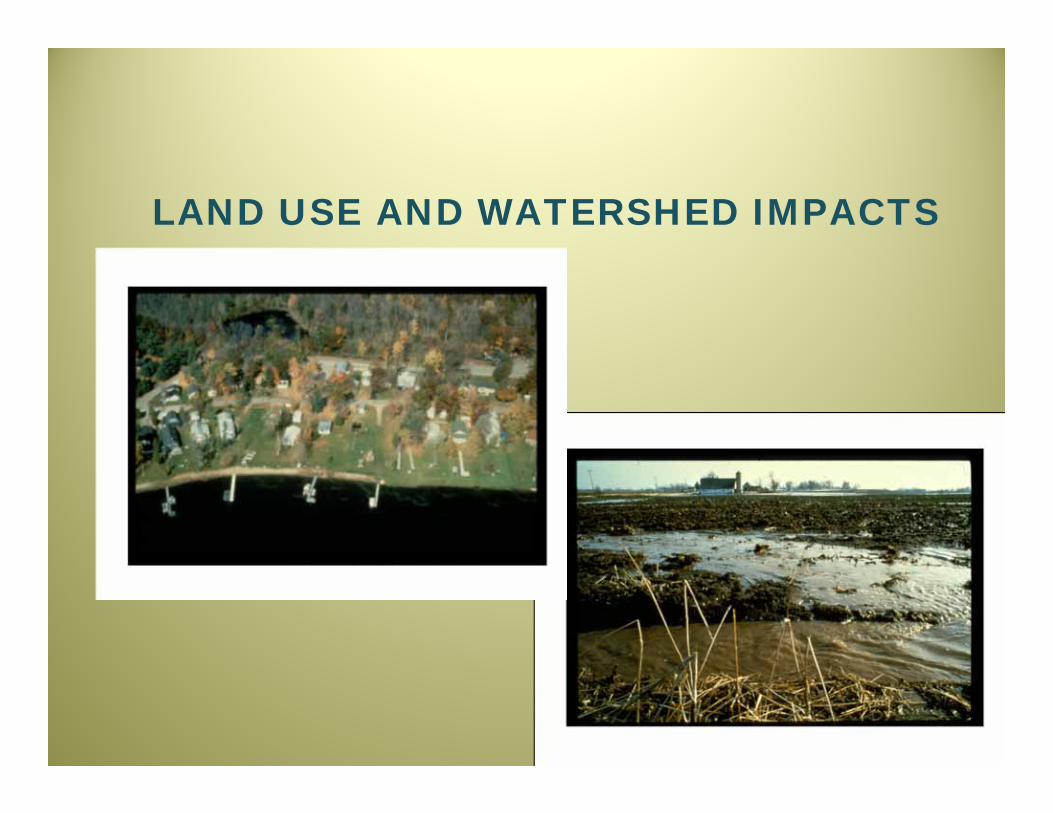
LAND USE AND WATERSHED IMPACTS

2) Land is a concentrated nutrient source
60 microgram/
liter
300,000 microgram/
liter

Empirical Watershed ModelsPhosphorus export coefficients - developed basedusing monitoring data.
WISCONSIN VALUES
Land Cover TP Export kg/ha/yr
High Density Urban 1.5 Row Crop Agriculture 1.0Mixed Agriculture 0.8Grass / Pasture 0.3Medium Density Urban 0.5Low Density Urban 0.1Forested 0.09
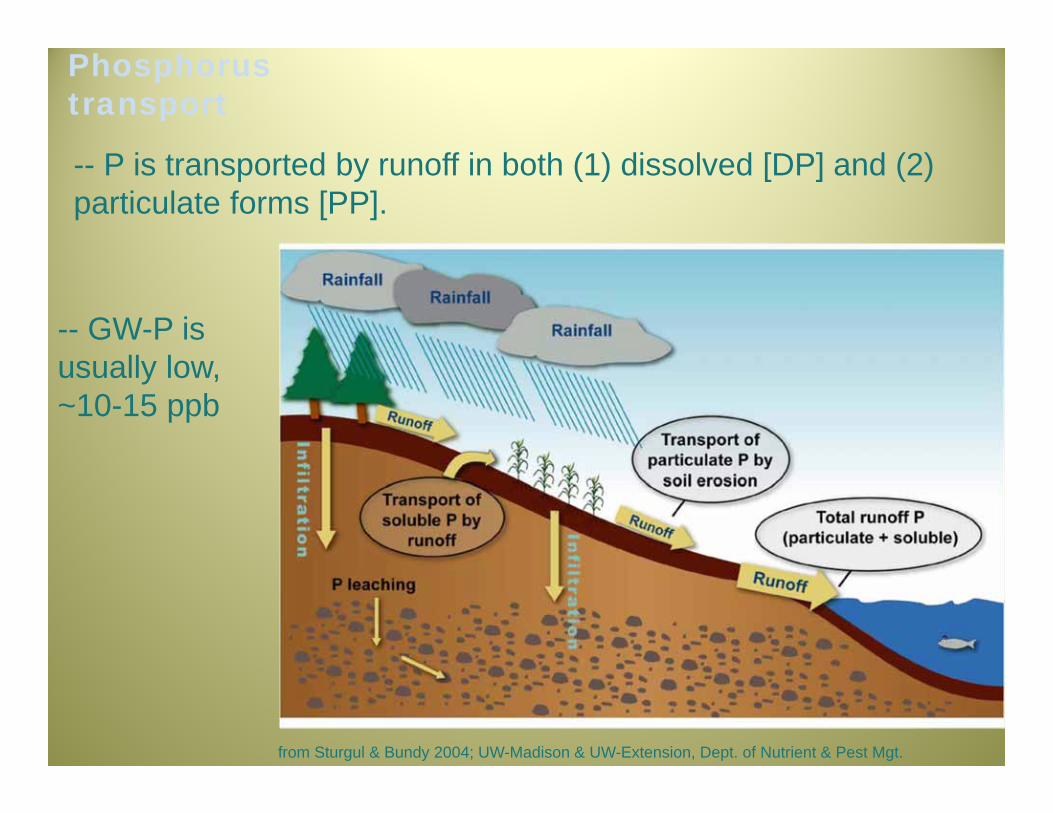
Phosphorus transport
from Sturgul & Bundy 2004; UW-Madison & UW-Extension, Dept. of Nutrient & Pest Mgt.
-- P is transported by runoff in both (1) dissolved [DP] and (2) particulate forms [PP].
-- GW-P is usually low, ~10-15 ppb

RESIDENTIAL DEVLOPMENT

AGRICULTURE IMPACTS

P Loading Sources to Lake Mendota
Cropland
48%
Existing Urban Areas 6%
Construction Sites
19%
Barnyards 21%
Streambanks 6% Source: Dane Co. Land Conservation Dept.

Figure 1. Schematic diagram of inputs and outputs used to calculate a P budget for the Lake Mendota watershed for 1995.
P in = 1,307 MT P out = 732 MTP Storage = + 575 MT !!
(from Bennett et al. 1999)
Lake Mendota Watershed P Budget
= 34 MT

Carlos, Latoka, Lobster, Mary
Red Rock
Courtesy of MN DNR
Domestication of Wisconsin
Lakes

LAKE HABITAT ZONES

Without habitat, they are gone

Shoreland green frog trends
Source: Wisconsin Dept. of Natural Resources

Data: U.W. BioComplexity project

logGrowthRate(mm/yr)
Woody Habitat (no./km)
High Development
Low Development
Undeveloped
High Development
Low Development
Undeveloped
From Schindler et al. 2000
Fish grow ~3X faster in lakes with lots of woody habitat


spiny waterflea
Eurasian water-milfoil
curly-leaf pondweed
zebra mussels
Aquatic Invasive Species in Wisconsin
John LyonsAsian Carp
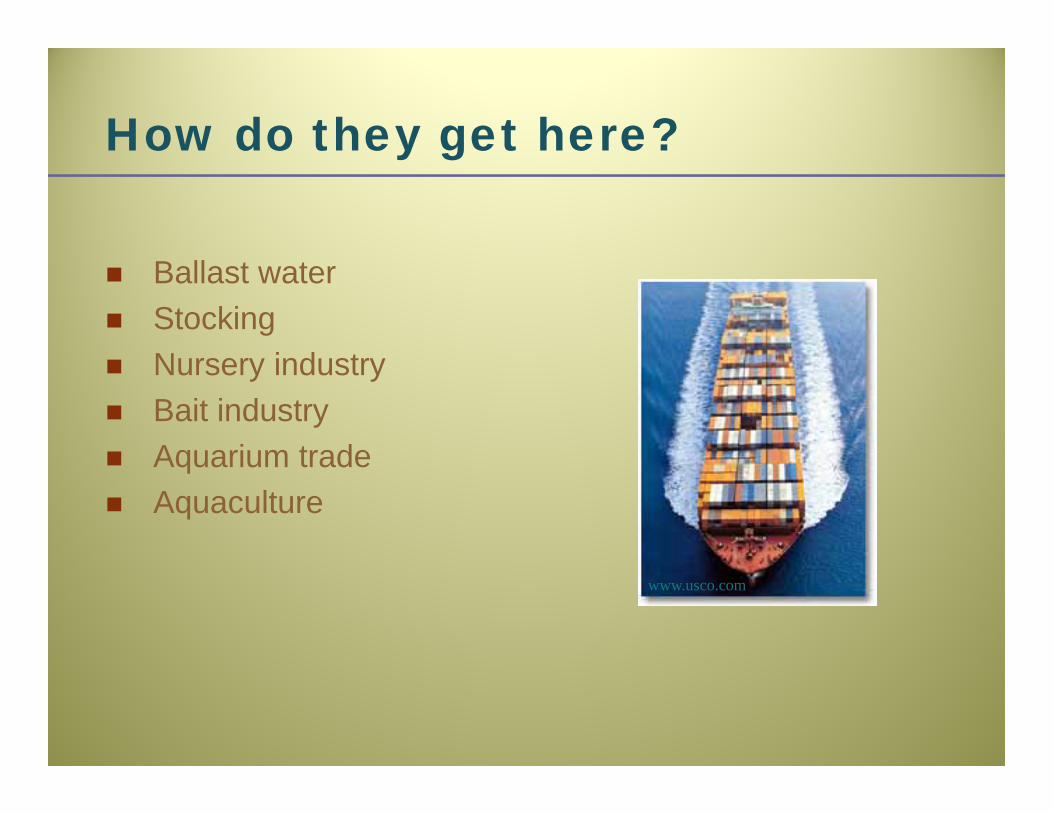
How do they get here?
Ballast water Stocking Nursery industry Bait industry Aquarium trade Aquaculture
www.usco.com
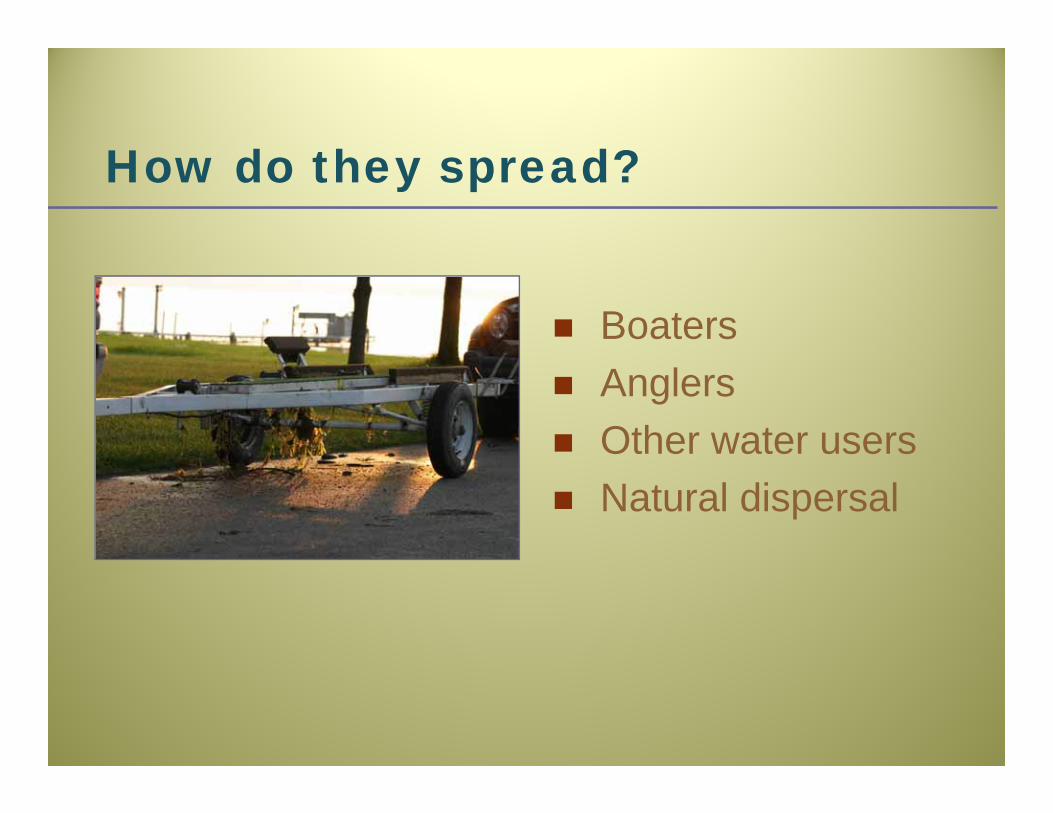
How do they spread?
Boaters Anglers Other water users Natural dispersal

Why do we care? Economic impacts
Fishing industry, tourism, property values
Ecological impacts Native fish, invertebrates, plants
Recreational impacts Boating, angling, swimming

Wisconsin’s AIS Program
Prevent introduction and limit the spread of aquatic invasive species

Program Goals Focus on containment Increase AIS awareness &
responsible behaviors Strengthen partnerships

AIS Program Elements Education & Outreach Watercraft Inspection Citizen Lake Monitoring Purple Loosestrife Biological Control Aquatic Invasive Species Grants Research Rules to Prevent Spread