wisconsin vehicle inspection program annual report … · wisconsin vehicle inspection program...
TRANSCRIPT

1
Wisconsin Vehicle Inspection Program Annual Report 2010

2
Contents Background ................................................................................................................................................... 4
Program Overview ........................................................................................................................................ 4
Program Rationale ........................................................................................................................................ 5
Motor Vehicle Emission Reductions & Air Quality Improvement ................................................................. 5
TEST DATA REPORT ....................................................................................................................................... 7
OPERATING STATISTICS ......................................................................................................................... 7
Vehicle Waivers ................................................................................................................................... 14
Check Engine Light Commanded On: .................................................................................................. 20
Readiness Monitors: ........................................................................................................................... 24
QUALITY ASSURANCE REPORT .................................................................................................................... 28
Testing Network .................................................................................................................................. 28
Overt and Covert Performance Audits ................................................................................................ 29
Covert Audits....................................................................................................................................... 29
Fines, Suspension or Termination Due to Audit Failures .................................................................... 29
Number of inspectors licensed or certified to conduct testing: ......................................................... 30
Number of hearings: ........................................................................................................................... 30
Fines: ................................................................................................................................................... 30
Covert Audits....................................................................................................................................... 30
QUALITY CONTROL REPORT ........................................................................................................................ 31
Number of Emission Testing Sites and Lanes ..................................................................................... 31
Number of Equipment audits by station and lane .............................................................................. 31
ENFORCEMENT REPORT.............................................................................................................................. 32
Registration denial based enforcement programs ............................................................................. 33
Computer‐matching based enforcement programs ........................................................................... 33
Sticker‐ based enforcement programs ............................................................................................... 33
ADDITIONAL REPORTING REQUIREMENTS ................................................................................................. 34
Program Changes – 2009 ........................................................................................................................ 35
Reduction of operating hours and inspection stations ....................................................................... 35
Reinstatement of Cost Waivers .......................................................................................................... 35
OBD‐II Wireless Test Pilot ................................................................................................................... 35
Program Changes – 2010 ........................................................................................................................ 36
3
Testing requirement expanded........................................................................................................... 36
OBD‐II Wireless Test Pilot ................................................................................................................... 36
Sheboygan waiver repair cost limit raised .......................................................................................... 36
Administrative Rule Changes .............................................................................................................. 36
Wisconsin Department of Transportation Personnel Change ............................................................ 37
Program Issues Identified and Corrected ........................................................................................... 37

4
Background
The Wisconsin Department of Transportation (WisDOT) implemented the Wisconsin Vehicle Inspection Program (WVIP) in April 1984 in response to the federal Clean Air Act requirements. A major focus of the Clean Air Act is to reduce emissions that form ground‐level ozone. Motor vehicles, industries, and smaller area sources such as lawn mowers, power boats, paints, solvents and other consumer products emit these ozone precursors. Areas exceeding federal air quality standards – established under the Clean Air Act – are designated as non‐attainment and are required by federal law to reduce emissions.
The WVIP is one of the primary components of the strategy to reduce air pollution in southeastern Wisconsin area. Each year, over 600,000 cars and light duty trucks in a seven county region of southeastern Wisconsin’s ozone non‐attainment area are tested for emissions. The program covers more than 2,500 square miles over seven counties: Kenosha, Milwaukee, Ozaukee, Racine, Sheboygan, Washington, and Waukesha. Vehicles are inspected in 9 stations located in Kenosha, Milwaukee, Racine, Sheboygan, Waukesha, West Bend, and West Allis.
The emissions tests are free to the motorist, but cost WisDOT about $5.25 each. The state Transportation and Petroleum Environmental Cleanup Fund Act (PECFA) funds pay for the program.
Program Overview
Geographical Area: Seven southeastern Wisconsin counties: Sheboygan, Washington, Ozaukee, Waukesha, Milwaukee, Racine and Kenosha. Testing region covers 2,500 square miles.
Test Procedure: OBDII testing, in which a vehicle’s on‐board computer is checked for emissions‐related problems, is the standard test for all 1996 and newer gasoline‐fueled vehicles equipped with OBDII technology and all 2007 and newer diesel‐fueled vehicles equipped with OBDII technology.
Network Size: 9 Stations, 21 Contractual Lanes, 2 Technical Assistance Centers
Model Years (MY) Tested Registration Renewal Testing: Odd Model Years 1996 through 2007
• Model year 1996‐2006 gasoline‐fueled vehicles up to 8,500 lbs. gross vehicle weight rating
• Model year 2007 and newer gasoline‐fueled and diesel‐fueled vehicles between 8,500 and 14,000 lbs, gross vehicle weight rating
Change of Ownership: Model year 2005 and older in CY 2010
5
Program Rationale
Southeastern Wisconsin is one of more than 120 metropolitan areas with ground‐level ozone levels that exceed federal air quality standards. Excessive air pollution is a public health hazard. Geographically, as part of the south Lake Michigan air basin, southeastern Wisconsin is one of the worst areas in the country for ozone pollution.
Motor Vehicle Emission Reductions & Air Quality Improvement
Reducing motor vehicle emissions plays a large role in improving regional air quality. Along with reformulated gasoline use, the Wisconsin Vehicle Inspection Program (WVIP) is Wisconsin’s most significant vehicle emission reduction program, and one that contributes to improved air quality in the entire upper Midwest.
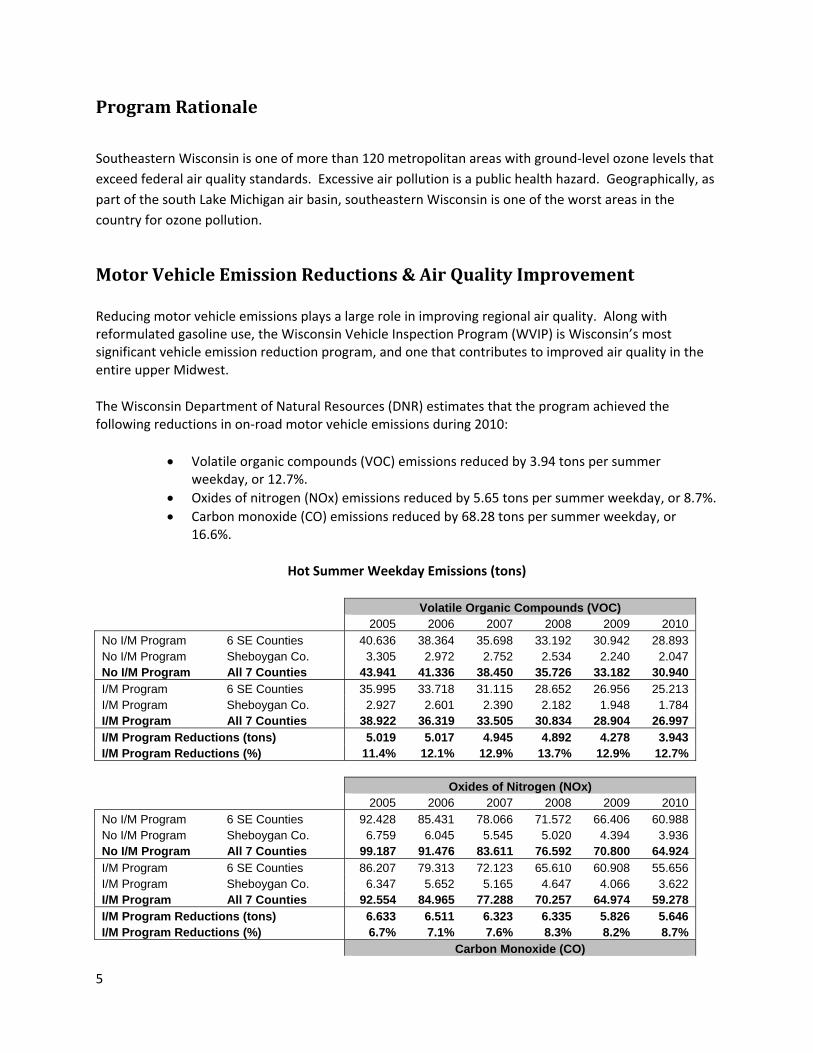
The Wisconsin Department of Natural Resources (DNR) estimates that the program achieved the following reductions in on‐road motor vehicle emissions during 2010:
• Volatile organic compounds (VOC) emissions reduced by 3.94 tons per summer weekday, or 12.7%.
• Oxides of nitrogen (NOx) emissions reduced by 5.65 tons per summer weekday, or 8.7%. • Carbon monoxide (CO) emissions reduced by 68.28 tons per summer weekday, or
16.6%.
Hot Summer Weekday Emissions (tons)
Volatile Organic Compounds (VOC) 2005 2006 2007 2008 2009 2010
No I/M Program 6 SE Counties 40.636 38.364 35.698 33.192 30.942 28.893 No I/M Program Sheboygan Co. 3.305 2.972 2.752 2.534 2.240 2.047 No I/M Program All 7 Counties 43.941 41.336 38.450 35.726 33.182 30.940 I/M Program 6 SE Counties 35.995 33.718 31.115 28.652 26.956 25.213 I/M Program Sheboygan Co. 2.927 2.601 2.390 2.182 1.948 1.784 I/M Program All 7 Counties 38.922 36.319 33.505 30.834 28.904 26.997 I/M Program Reductions (tons) 5.019 5.017 4.945 4.892 4.278 3.943 I/M Program Reductions (%) 11.4% 12.1% 12.9% 13.7% 12.9% 12.7%
Oxides of Nitrogen (NOx) 2005 2006 2007 2008 2009 2010
No I/M Program 6 SE Counties 92.428 85.431 78.066 71.572 66.406 60.988 No I/M Program Sheboygan Co. 6.759 6.045 5.545 5.020 4.394 3.936 No I/M Program All 7 Counties 99.187 91.476 83.611 76.592 70.800 64.924 I/M Program 6 SE Counties 86.207 79.313 72.123 65.610 60.908 55.656 I/M Program Sheboygan Co. 6.347 5.652 5.165 4.647 4.066 3.622 I/M Program All 7 Counties 92.554 84.965 77.288 70.257 64.974 59.278 I/M Program Reductions (tons) 6.633 6.511 6.323 6.335 5.826 5.646 I/M Program Reductions (%) 6.7% 7.1% 7.6% 8.3% 8.2% 8.7%
Carbon Monoxide (CO)
6
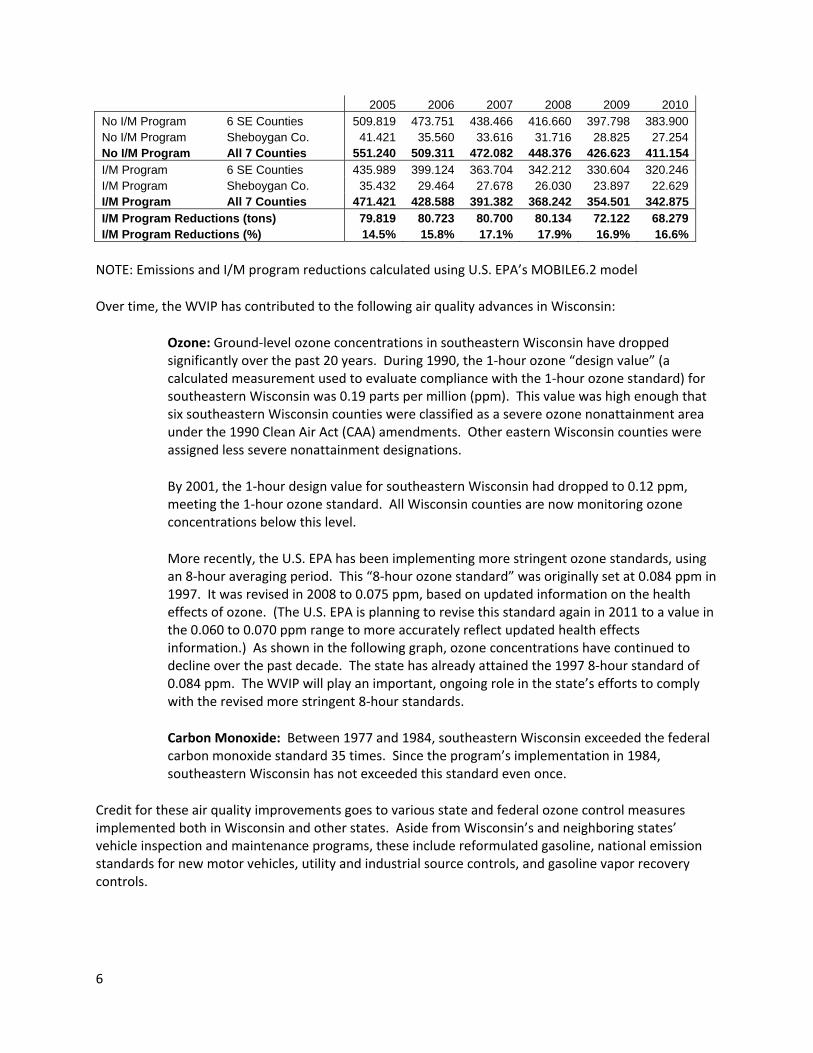
2005 2006 2007 2008 2009 2010 No I/M Program 6 SE Counties 509.819 473.751 438.466 416.660 397.798 383.900 No I/M Program Sheboygan Co. 41.421 35.560 33.616 31.716 28.825 27.254 No I/M Program All 7 Counties 551.240 509.311 472.082 448.376 426.623 411.154 I/M Program 6 SE Counties 435.989 399.124 363.704 342.212 330.604 320.246 I/M Program Sheboygan Co. 35.432 29.464 27.678 26.030 23.897 22.629 I/M Program All 7 Counties 471.421 428.588 391.382 368.242 354.501 342.875 I/M Program Reductions (tons) 79.819 80.723 80.700 80.134 72.122 68.279 I/M Program Reductions (%) 14.5% 15.8% 17.1% 17.9% 16.9% 16.6%
NOTE: Emissions and I/M program reductions calculated using U.S. EPA’s MOBILE6.2 model
Over time, the WVIP has contributed to the following air quality advances in Wisconsin:
Ozone: Ground‐level ozone concentrations in southeastern Wisconsin have dropped significantly over the past 20 years. During 1990, the 1‐hour ozone “design value” (a calculated measurement used to evaluate compliance with the 1‐hour ozone standard) for southeastern Wisconsin was 0.19 parts per million (ppm). This value was high enough that six southeastern Wisconsin counties were classified as a severe ozone nonattainment area under the 1990 Clean Air Act (CAA) amendments. Other eastern Wisconsin counties were assigned less severe nonattainment designations.
By 2001, the 1‐hour design value for southeastern Wisconsin had dropped to 0.12 ppm, meeting the 1‐hour ozone standard. All Wisconsin counties are now monitoring ozone concentrations below this level.
More recently, the U.S. EPA has been implementing more stringent ozone standards, using an 8‐hour averaging period. This “8‐hour ozone standard” was originally set at 0.084 ppm in 1997. It was revised in 2008 to 0.075 ppm, based on updated information on the health effects of ozone. (The U.S. EPA is planning to revise this standard again in 2011 to a value in the 0.060 to 0.070 ppm range to more accurately reflect updated health effects information.) As shown in the following graph, ozone concentrations have continued to decline over the past decade. The state has already attained the 1997 8‐hour standard of 0.084 ppm. The WVIP will play an important, ongoing role in the state’s efforts to comply with the revised more stringent 8‐hour standards.
Carbon Monoxide: Between 1977 and 1984, southeastern Wisconsin exceeded the federal carbon monoxide standard 35 times. Since the program’s implementation in 1984, southeastern Wisconsin has not exceeded this standard even once.
Credit for these air quality improvements goes to various state and federal ozone control measures implemented both in Wisconsin and other states. Aside from Wisconsin’s and neighboring states’ vehicle inspection and maintenance programs, these include reformulated gasoline, national emission standards for new motor vehicles, utility and industrial source controls, and gasoline vapor recovery controls.
7
TEST DATA REPORT
OPERATING STATISTICS
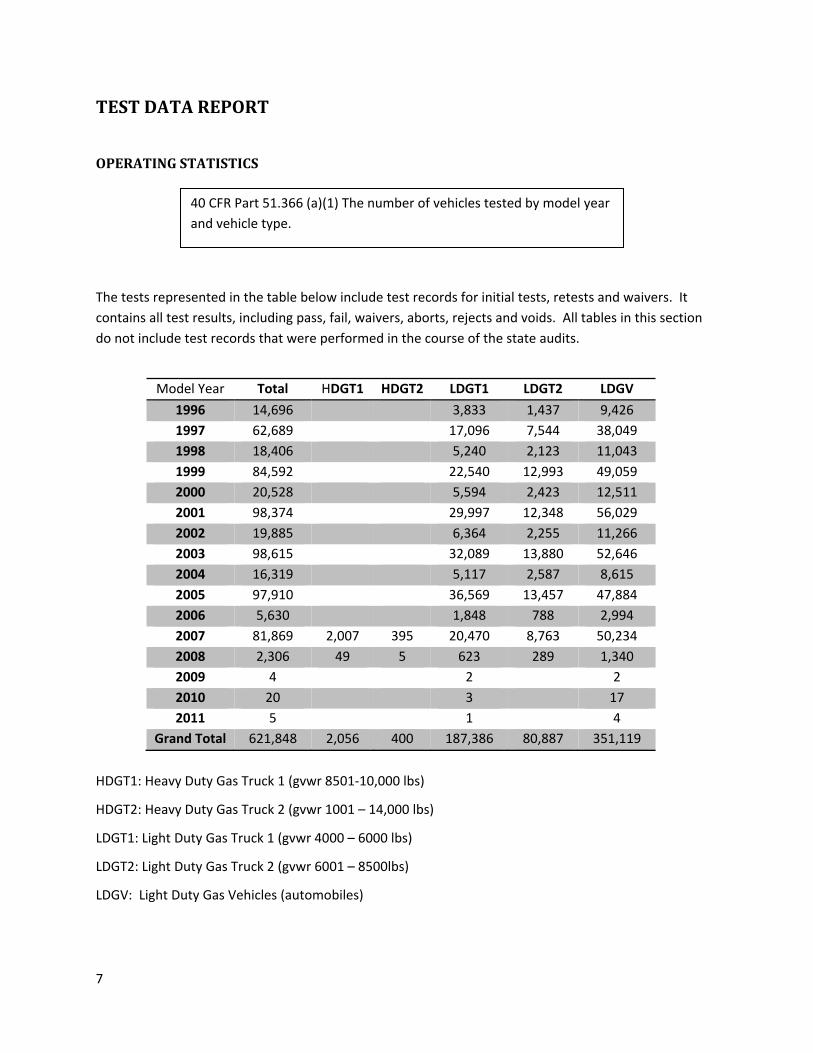
The tests represented in the table below include test records for initial tests, retests and waivers. It contains all test results, including pass, fail, waivers, aborts, rejects and voids. All tables in this section do not include test records that were performed in the course of the state audits.
Model Year Total HDGT1 HDGT2 LDGT1 LDGT2 LDGV
1996 14,696 3,833 1,437 9,426 1997 62,689 17,096 7,544 38,049 1998 18,406 5,240 2,123 11,043 1999 84,592 22,540 12,993 49,059 2000 20,528 5,594 2,423 12,511 2001 98,374 29,997 12,348 56,029 2002 19,885 6,364 2,255 11,266 2003 98,615 32,089 13,880 52,646 2004 16,319 5,117 2,587 8,615 2005 97,910 36,569 13,457 47,884 2006 5,630 1,848 788 2,994 2007 81,869 2,007 395 20,470 8,763 50,234 2008 2,306 49 5 623 289 1,340 2009 4 2 2 2010 20 3 17 2011 5 1 4
Grand Total 621,848 2,056 400 187,386 80,887 351,119
HDGT1: Heavy Duty Gas Truck 1 (gvwr 8501‐10,000 lbs)
HDGT2: Heavy Duty Gas Truck 2 (gvwr 1001 – 14,000 lbs)
LDGT1: Light Duty Gas Truck 1 (gvwr 4000 – 6000 lbs)
LDGT2: Light Duty Gas Truck 2 (gvwr 6001 – 8500lbs)
LDGV: Light Duty Gas Vehicles (automobiles)
40 CFR Part 51.366 (a)(1) The number of vehicles tested by model year and vehicle type.
8
Vehicle Year
Type Total Initial Tests Initial Fails Initial Pass Fail Rate
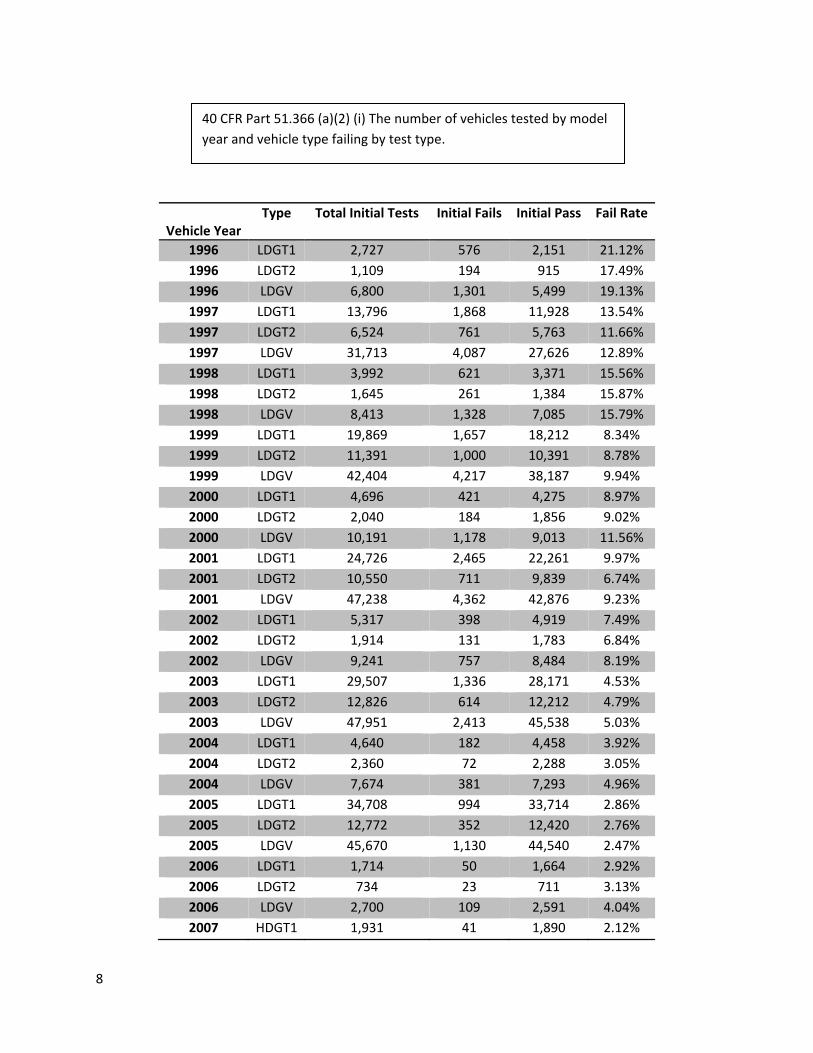
1996 LDGT1 2,727 576 2,151 21.12% 1996 LDGT2 1,109 194 915 17.49% 1996 LDGV 6,800 1,301 5,499 19.13% 1997 LDGT1 13,796 1,868 11,928 13.54% 1997 LDGT2 6,524 761 5,763 11.66% 1997 LDGV 31,713 4,087 27,626 12.89% 1998 LDGT1 3,992 621 3,371 15.56% 1998 LDGT2 1,645 261 1,384 15.87% 1998 LDGV 8,413 1,328 7,085 15.79% 1999 LDGT1 19,869 1,657 18,212 8.34% 1999 LDGT2 11,391 1,000 10,391 8.78% 1999 LDGV 42,404 4,217 38,187 9.94% 2000 LDGT1 4,696 421 4,275 8.97% 2000 LDGT2 2,040 184 1,856 9.02% 2000 LDGV 10,191 1,178 9,013 11.56% 2001 LDGT1 24,726 2,465 22,261 9.97% 2001 LDGT2 10,550 711 9,839 6.74% 2001 LDGV 47,238 4,362 42,876 9.23% 2002 LDGT1 5,317 398 4,919 7.49% 2002 LDGT2 1,914 131 1,783 6.84% 2002 LDGV 9,241 757 8,484 8.19% 2003 LDGT1 29,507 1,336 28,171 4.53% 2003 LDGT2 12,826 614 12,212 4.79% 2003 LDGV 47,951 2,413 45,538 5.03% 2004 LDGT1 4,640 182 4,458 3.92% 2004 LDGT2 2,360 72 2,288 3.05% 2004 LDGV 7,674 381 7,293 4.96% 2005 LDGT1 34,708 994 33,714 2.86% 2005 LDGT2 12,772 352 12,420 2.76% 2005 LDGV 45,670 1,130 44,540 2.47% 2006 LDGT1 1,714 50 1,664 2.92% 2006 LDGT2 734 23 711 3.13% 2006 LDGV 2,700 109 2,591 4.04% 2007 HDGT1 1,931 41 1,890 2.12%
40 CFR Part 51.366 (a)(2) (i) The number of vehicles tested by model year and vehicle type failing by test type.

9
2007 HDGT2 365 14 351 3.84% 2007 LDGT1 20,064 165 19,899 0.82% 2007 LDGT2 8,557 96 8,461 1.12% 2007 LDGV 48,990 518 48,472 1.06% 2008 HDGT1 49 1 48 2.04% 2008 HDGT2 5 5 0.00% 2008 LDGT1 621 3 618 0.48% 2008 LDGT2 288 2 286 0.69% 2008 LDGV 1,324 7 1,317 0.53% 2009 LDGT1 2 2 0.00% 2009 LDGV 2 2 0.00% 2010 LDGT1 3 3 0.00% 2010 LDGV 13 13 0.00% 2011 LDGT1 1 1 0.00% 2011 LDGV 2 2 0.00% Total 551,769 36,981 514,788 6.70%

10
Vehicle Year Type Total 1st Retests
Pass and Fail 1st Retest
Fails 1st Retest
Pass Fail Rate
1996 LDGT1 492 116 376 23.58% 1996 LDGT2 174 37 137 21.26% 1996 LDGV 1,023 239 784 23.36% 1997 LDGT1 1,408 230 1,178 16.34% 1997 LDGT2 540 63 477 11.67% 1997 LDGV 2,969 489 2,480 16.47% 1998 LDGT1 555 106 449 19.10% 1998 LDGT2 231 52 179 22.51% 1998 LDGV 1,112 187 925 16.82% 1999 LDGT1 1,297 153 1,144 11.80% 1999 LDGT2 769 107 662 13.91% 1999 LDGV 3,193 400 2,793 12.53% 2000 LDGT1 443 58 385 13.09% 2000 LDGT2 198 32 166 16.16% 2000 LDGV 1,054 181 873 17.17% 2001 LDGT1 1,982 236 1,746 11.91% 2001 LDGT2 554 56 498 10.11% 2001 LDGV 3,396 441 2,955 12.99% 2002 LDGT1 442 53 389 11.99% 2002 LDGT2 156 9 147 5.77% 2002 LDGV 769 113 656 14.69% 2003 LDGT1 1,127 83 1,044 7.36% 2003 LDGT2 533 29 504 5.44% 2003 LDGV 1,964 176 1,788 8.96% 2004 LDGT1 209 15 194 7.18% 2004 LDGT2 84 8 76 9.52% 2004 LDGV 411 52 359 12.65% 2005 LDGT1 852 39 813 4.58% 2005 LDGT2 291 9 282 3.09% 2005 LDGV 916 71 845 7.75% 2006 LDGT1 66 2 64 3.03% 2006 LDGT2 27 2 25 7.41% 2006 LDGV 135 10 125 7.41% 2007 HDGT1 34 2 32 5.88%
40 CFR Part 51.366 (a)(2) (ii) – (iii) The number of vehicles tested by model year and vehicle type passing or failing the first retest.

11
2007 HDGT2 6 6 0.00% 2007 LDGT1 145 6 139 4.14% 2007 LDGT2 89 3 86 3.37% 2007 LDGV 413 21 392 5.08% 2008 LDGT1 1 1 0.00% 2008 LDGV 1 1 0.00% Total 30,061 3,886 26,175 12.93%

12
Vehicle Year Type Initial Fails Pass 2nd or Subsequent Retest
Percentage
1996 LDGT1 576 71 12.33% 1996 LDGT2 194 32 16.49% 1996 LDGV 1,301 136 10.45% 1997 LDGT1 1,868 140 7.49% 1997 LDGT2 761 35 4.60% 1997 LDGV 4,087 280 6.85% 1998 LDGT1 621 63 10.14% 1998 LDGT2 261 35 13.41% 1998 LDGV 1,328 130 9.79% 1999 LDGT1 1,657 97 5.85% 1999 LDGT2 1,000 66 6.60% 1999 LDGV 4,217 268 6.36% 2000 LDGT1 421 43 10.21% 2000 LDGT2 184 20 10.87% 2000 LDGV 1,178 141 11.97% 2001 LDGT1 2,465 153 6.21% 2001 LDGT2 711 38 5.34% 2001 LDGV 4,362 284 6.51% 2002 LDGT1 398 44 11.06% 2002 LDGT2 131 13 9.92% 2002 LDGV 757 102 13.47% 2003 LDGT1 1,336 58 4.34% 2003 LDGT2 614 23 3.75% 2003 LDGV 2,413 114 4.72% 2004 LDGT1 182 11 6.04% 2004 LDGT2 72 4 5.56% 2004 LDGV 381 46 12.07% 2005 LDGT1 994 32 3.22% 2005 LDGT2 352 6 1.70% 2005 LDGV 1,130 48 4.25% 2006 LDGT1 50 2 4.00% 2006 LDGT2 23 0.00% 2006 LDGV 109 8 7.34% 2007 HDGT1 41 1 2.44% 2007 HDGT2 14 0.00% 2007 LDGT1 165 5 3.03% 2007 LDGT2 96 2 2.08% 2007 LDGV 518 16 3.09%
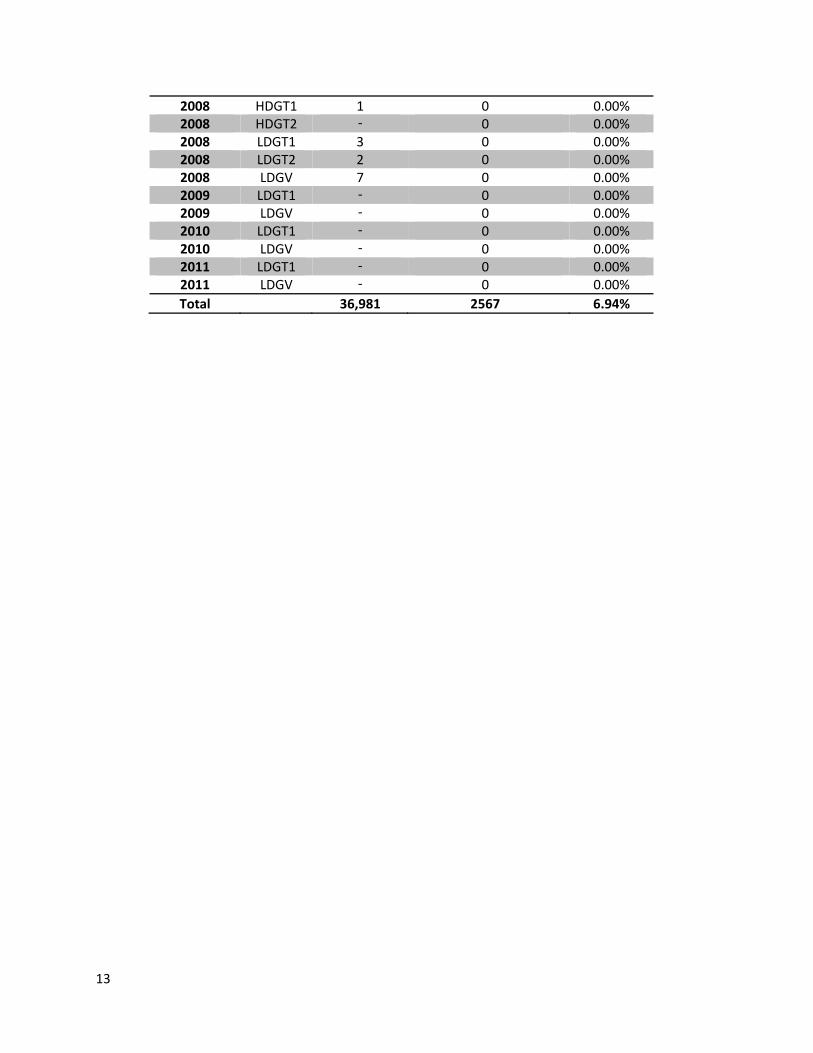
40 CFR Part 51.366 (a)(2) (iv) The number of vehicles tested by model year and vehicle type that initially failed and passed the second or subsequent retest.
13
2008 HDGT1 1 0 0.00% 2008 HDGT2 - 0 0.00% 2008 LDGT1 3 0 0.00% 2008 LDGT2 2 0 0.00% 2008 LDGV 7 0 0.00% 2009 LDGT1 - 0 0.00% 2009 LDGV - 0 0.00% 2010 LDGT1 - 0 0.00% 2010 LDGV - 0 0.00% 2011 LDGT1 - 0 0.00% 2011 LDGV - 0 0.00% Total 36,981 2567 6.94%

14
Vehicle Waivers
A motorist may request a waiver from further inspection requirements for the current inspection cycle if the vehicle fails a second retest after repairs. In general, a waiver may be granted if the motorist exceeds the cost limit on emission‐related repairs and adjustments at a recognized repair facility. The waiver repair cost limit excludes emission system warranty repairs and the repair/replacement of tampered emission control devices identified during the equipment check.
Vehicle owners can also apply for a waiver if their vehicles continue to fail the emissions test. A vehicle is eligible for a waiver when the following conditions are met:
1. The vehicle has failed an emissions inspection and following repair and reinspection, it still does not meet test requirements. Repairs made over 180 days prior to the expiration of the license plate cannot be applied to the waiver repair cost limit.
2. The vehicle has passed a waiver emission equipment inspection to determine if emission control equipment is missing, modified or disconnected.
3. The Vehicle Inspection Reports (VIR) has been presented to the Waiver Investigator at the time a waiver is requested. The REPAIR DATA section of these reports has been completed in accordance with instructions provided on the report form. Motorists must bring their vehicle and itemized receipts for parts and labor to verify the emission related repairs.
4. For all vehicles which exceed the terms of the manufacturer's emission performance or defect warranty coverage at the time of the scheduled emission inspection, the owner must have emission related repairs performed on the vehicle at a recognized repair facility.
5. The actual costs of emission related repairs and adjustments exceed the repair cost limit for that vehicle's county of domicile. Only repairs that are related to the vehicle's cause of failure can be used to apply for a cost waiver. Costs covered by any warranty or costs to repair/replace emission control equipment that has been removed, modified or disconnected are excluded.
6. For vehicles registered and kept in Washington, Ozaukee, Waukesha, Milwaukee, Racine and Kenosha Counties, the repair cost limit for all model year vehicles subject to testing is $788, effective for calendar year 2010. This figure is adjusted annually by the DNR per NR 485.045. For vehicles registered in Sheboygan County, the repair cost limit was $200 for calendar year 2010, but staring in 2011, the repair cost limit in Sheboygan County was modified to be the same limit as in the other six counties within the WVIP testing area.
The following chart illustrates the cost waivers granted in 2010 by model year. Since odd model year vehicles were tested in 2010, they account for the majority of the waivers.

15
Vehicle Year Type Initial Fails Waivers Waiver Rate 1996 LDGT1 576 2 0.35% 1996 LDGT2 194 1 0.52% 1996 LDGV 1,301 18 1.38% 1997 LDGT1 1,868 5 0.27% 1997 LDGT2 761 9 1.18% 1997 LDGV 4,087 34 0.83% 1998 LDGT1 621 2 0.32% 1998 LDGT2 261 9 3.45% 1998 LDGV 1,328 15 1.13% 1999 LDGT1 1,657 7 0.42% 1999 LDGT2 1,000 9 0.90% 1999 LDGV 4,217 24 0.57% 2000 LDGT1 421 0 0.00% 2000 LDGT2 184 7 3.80% 2000 LDGV 1,178 13 1.10% 2001 LDGT1 2,465 11 0.45% 2001 LDGT2 711 17 2.39% 2001 LDGV 4,362 53 1.22% 2002 LDGT1 398 4 1.01% 2002 LDGT2 131 4 3.05% 2002 LDGV 757 7 0.92% 2003 LDGT1 1,336 2 0.15% 2003 LDGT2 614 0 0.00% 2003 LDGV 2,413 27 1.12% 2004 LDGT1 182 0 0.00% 2004 LDGT2 72 2 2.78% 2004 LDGV 381 4 1.05% 2005 LDGT1 994 2 0.20% 2005 LDGT2 352 6 1.70% 2005 LDGV 1,130 2 0.18% 2006 LDGT1 50 0 0.00% 2006 LDGT2 23 1 4.35% 2006 LDGV 109 0 0.00% 2007 HDGT1 41 0 0.00% 2007 HDGT2 14 0 0.00%
40 CFR Part 51.366 (a)(2) (v) The number of vehicles tested by model year and vehicle type receiving a waiver.

16
2007 LDGT1 165 0 0.00% 2007 LDGT2 96 1 1.04% 2007 LDGV 518 0 0.00% 2008 HDGT1 1 0 0.00% 2008 HDGT2 ‐ 0 0.00% 2008 LDGT1 3 0 0.00% 2008 LDGT2 2 0 0.00% 2008 LDGV 7 0 0.00% Total 36,981 298 0.81%

17
The vehicles included in the table below did not have a final outcome of either a pass or waiver test result during the reporting period.
Vehicle Year HDGT1 HDGT2 LDGT1 LDGT2 LDGV Grand Total 1996 355 110 874 1,339 1997 739 316 1,743 2,798 1998 369 145 762 1,276 1999 579 401 1,495 2,475 2000 194 91 649 934 2001 855 277 1,580 2,712 2002 175 55 369 599 2003 304 102 709 1,115 2004 83 39 162 284 2005 205 87 297 589 2006 17 10 53 80 2007 14 13 36 22 138 223 2008 1 4 2 7 14 2010 4 4 2011 2 2
Grand Total 15 13 3,915 1,657 8,844 14,444
40 CFR Part 51.366 (a)(2)(vi) The number of vehicles tested by model year and vehicle type with no final outcome (regardless of reason).

18
Vehicle Year Type Total Fail Pass Percentage Fail
1996 LDGT1 3,312 714 2,598 21.56% 1996 LDGT2 1,333 249 1,084 18.68% 1996 LDGV 8,011 1,592 6,419 19.87% 1997 LDGT1 15,390 2,144 13,246 13.93% 1997 LDGT2 7,109 834 6,275 11.73% 1997 LDGV 35,044 4,658 30,386 13.29% 1998 LDGT1 4,635 752 3,883 16.22% 1998 LDGT2 1,925 327 1,598 16.99% 1998 LDGV 9,696 1,556 8,140 16.05% 1999 LDGT1 21,281 1,828 19,453 8.59% 1999 LDGT2 12,241 1,122 11,119 9.17% 1999 LDGV 45,902 4,654 41,248 10.14% 2000 LDGT1 5,191 488 4,703 9.40% 2000 LDGT2 2,265 223 2,042 9.85% 2000 LDGV 11,416 1,389 10,027 12.17% 2001 LDGT1 26,882 2,722 24,160 10.13% 2001 LDGT2 11,151 776 10,375 6.96% 2001 LDGV 50,983 4,868 46,115 9.55% 2002 LDGT1 5,811 459 5,352 7.90% 2002 LDGT2 2,084 141 1,943 6.77% 2002 LDGV 10,130 888 9,242 8.77% 2003 LDGT1 30,701 1,428 29,273 4.65% 2003 LDGT2 13,386 647 12,739 4.83% 2003 LDGV 50,046 2,606 47,440 5.21% 2004 LDGT1 4,862 199 4,663 4.09% 2004 LDGT2 2,448 80 2,368 3.27% 2004 LDGV 8,141 443 7,698 5.44% 2005 LDGT1 35,601 1,042 34,559 2.93% 2005 LDGT2 13,069 361 12,708 2.76% 2005 LDGV 46,641 1,208 45,433 2.59% 2006 LDGT1 1,783 53 1,730 2.97% 2006 LDGT2 761 25 736 3.29% 2006 LDGV 2,843 119 2,724 4.19% 2007 HDGT1 1,966 43 1,923 2.19%
40 CFR Part 51.366 (a)(2)(xi) (xii) The number of vehicles tested by model year and vehicle type passing or failing the on‐board diagnostic check.

19
2007 HDGT2 371 14 357 3.77% 2007 LDGT1 20,214 171 20,043 0.85% 2007 LDGT2 8,648 99 8,549 1.14% 2007 LDGV 49,419 539 48,880 1.09% 2008 HDGT1 49 1 48 2.04% 2008 HDGT2 5 5 0.00% 2008 LDGT1 622 3 619 0.48% 2008 LDGT2 288 2 286 0.69% 2008 LDGV 1,325 7 1,318 0.53% 2009 LDGT1 2 2 0.00% 2009 LDGV 2 2 0.00% 2010 LDGT1 3 3 0.00% 2010 LDGV 13 13 0.00% 2011 LDGT1 1 1 0.00% 2011 LDGV 2 2 0.00%
585,004 41,474 543,530 7.09%
40 CFR Part 51.366 (a)(2)(xiii) –(xviii)
There is no data for comparing on‐board diagnostic tests with other test types because Wisconsin only conducts on‐board diagnostic tests.
20
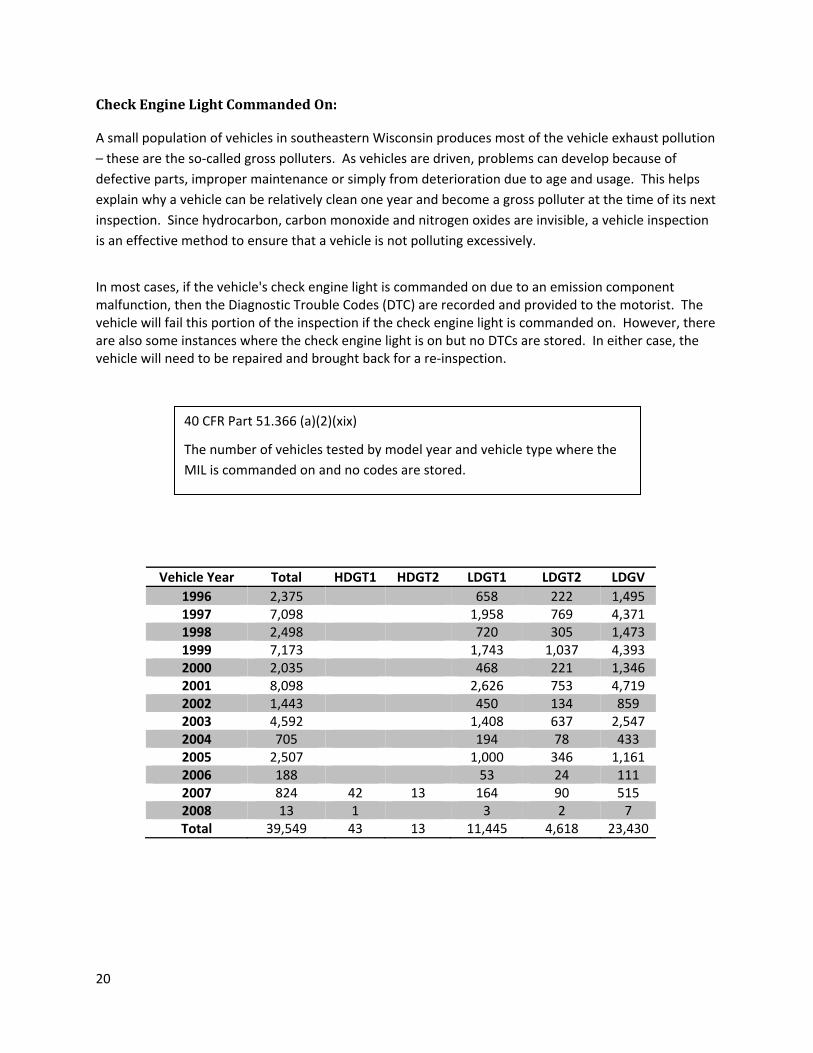
Check Engine Light Commanded On: A small population of vehicles in southeastern Wisconsin produces most of the vehicle exhaust pollution – these are the so‐called gross polluters. As vehicles are driven, problems can develop because of defective parts, improper maintenance or simply from deterioration due to age and usage. This helps explain why a vehicle can be relatively clean one year and become a gross polluter at the time of its next inspection. Since hydrocarbon, carbon monoxide and nitrogen oxides are invisible, a vehicle inspection is an effective method to ensure that a vehicle is not polluting excessively.
In most cases, if the vehicle's check engine light is commanded on due to an emission component malfunction, then the Diagnostic Trouble Codes (DTC) are recorded and provided to the motorist. The vehicle will fail this portion of the inspection if the check engine light is commanded on. However, there are also some instances where the check engine light is on but no DTCs are stored. In either case, the vehicle will need to be repaired and brought back for a re‐inspection.
Vehicle Year Total HDGT1 HDGT2 LDGT1 LDGT2 LDGV 1996 2,375 658 222 1,495 1997 7,098 1,958 769 4,371 1998 2,498 720 305 1,473 1999 7,173 1,743 1,037 4,393 2000 2,035 468 221 1,346 2001 8,098 2,626 753 4,719 2002 1,443 450 134 859 2003 4,592 1,408 637 2,547 2004 705 194 78 433 2005 2,507 1,000 346 1,161 2006 188 53 24 111 2007 824 42 13 164 90 515 2008 13 1 3 2 7 Total 39,549 43 13 11,445 4,618 23,430
40 CFR Part 51.366 (a)(2)(xix)
The number of vehicles tested by model year and vehicle type where the MIL is commanded on and no codes are stored.

21
Another condition that can occur is when the vehicle's check engine light is NOT commanded on but a Diagnostic Trouble Codes (DTC) is stored within the vehicle’s computer. The most likely reason for this condition is a pending code indicating a problem within the vehicle that has not yet met the threshold for activating the check engine light, or a condition that has since resolved itself. Since the MIL is not commanded on, the vehicle will pass this portion of the inspection.
Vehicle Year Total HDGT1 HDGT2 LDGT1 LDGT2 LDGV
1996 1,634 470 192 972 1997 6,026 1,782 644 3,600 1998 1,830 548 236 1,046 1999 6,683 1,644 1,197 3,842 2000 1,852 497 219 1,136 2001 6,827 1,700 740 4,387 2002 1,624 499 129 996 2003 5,357 2,038 656 2,663 2004 922 343 117 462 2005 3,706 1,535 490 1,681 2006 246 92 35 119 2007 1,594 53 24 454 164 899 2008 21 1 6 3 11 Total 38,322 54 24 11,608 4,822 21,814
40 CFR Part 51.366 (a)(2)(xx)
The number of vehicles tested by model year and vehicle type where the MIL is not commanded on and codes are stored.

22
Vehicle Year Total HDGT1 HDGT2 LDGT1 LDGT2 LDGV 1996 2,368 657 222 1,489 1997 7,094 1,958 768 4,368 1998 2,492 720 305 1,467 1999 7,147 1,727 1,029 4,391 2000 2,031 464 221 1,346 2001 8,086 2,623 748 4,715 2002 1,439 449 134 856 2003 4,578 1,396 637 2,545 2004 704 193 78 433 2005 2,499 995 345 1,159 2006 187 52 24 111 2007 822 42 13 162 90 515 2008 13 1 3 2 7 Total 39,460 43 13 11,399 4,603 23,402
40 CFR Part 51.366 (a)(2)(xxi)
The number of vehicles tested by model year and vehicle type where the MIL is commanded on and codes are stored.
23
Vehicle Year Total HDGT1 HDGT2 LDGT1 LDGT2 LDGV
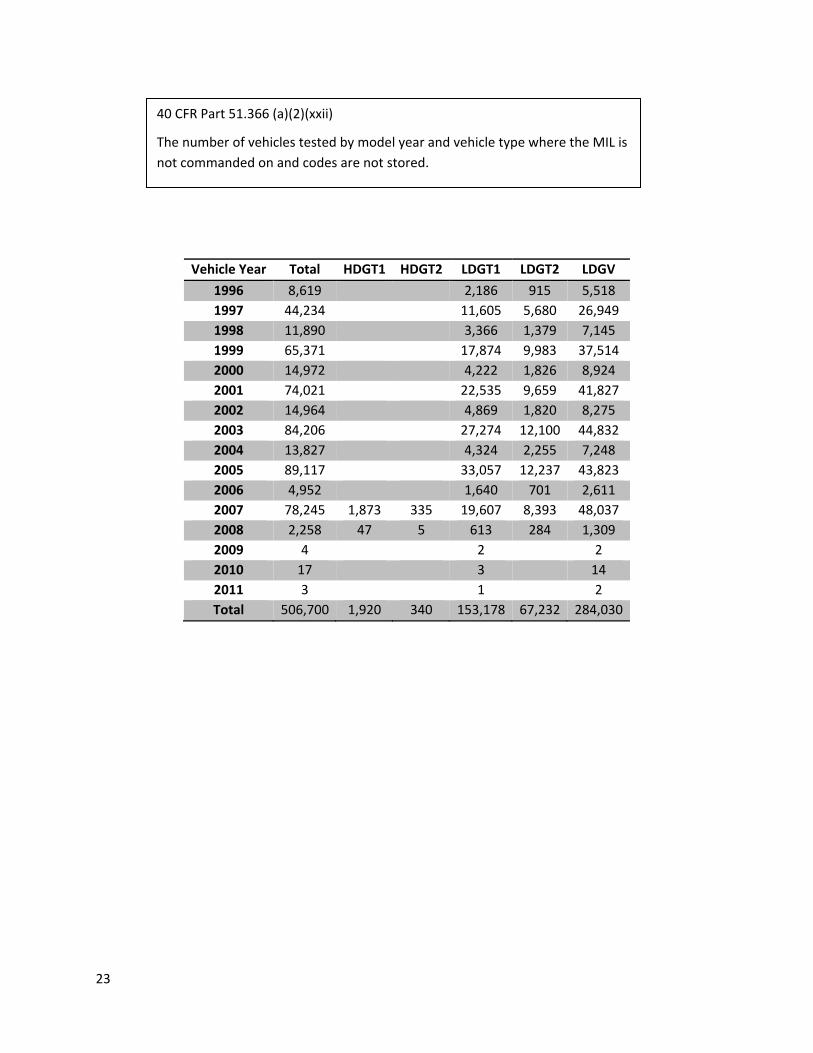
1996 8,619 2,186 915 5,518 1997 44,234 11,605 5,680 26,949 1998 11,890 3,366 1,379 7,145 1999 65,371 17,874 9,983 37,514 2000 14,972 4,222 1,826 8,924 2001 74,021 22,535 9,659 41,827 2002 14,964 4,869 1,820 8,275 2003 84,206 27,274 12,100 44,832 2004 13,827 4,324 2,255 7,248 2005 89,117 33,057 12,237 43,823 2006 4,952 1,640 701 2,611 2007 78,245 1,873 335 19,607 8,393 48,037 2008 2,258 47 5 613 284 1,309 2009 4 2 2 2010 17 3 14 2011 3 1 2 Total 506,700 1,920 340 153,178 67,232 284,030
40 CFR Part 51.366 (a)(2)(xxii)
The number of vehicles tested by model year and vehicle type where the MIL is not commanded on and codes are not stored.

24
Readiness Monitors: A vehicle’s OBD system continually tracks and stores information about the emission control devices and other engine related components. Readiness monitors indicate if components have been fully evaluated and whether system components have experienced any driving conditions that prevent the vehicle from operating as designed by the manufacturer. The test equipment reads the readiness monitor statuses as part of the vehicle emissions inspection. Vehicles “Not Ready” for OBD testing receive a reject test result. For 1996 ‐ 2000 model year vehicles, a vehicle can have up to 2 readiness monitors unset; for 2001 and newer vehicles, only 1 readiness monitor can be unset. If the unset readiness monitors exceed the requirements, the vehicle will be rejected from further testing until this condition is corrected.
Vehicle Year Total HDGT1 HDGT2 LDGT1 LDGT2 LDGV
1996 1,889 473 94 1,322 1997 4,784 1,601 405 2,778 1998 1,976 568 188 1,220 1999 4,562 1,197 696 2,669 2000 1,435 382 153 900 2001 8,707 2,940 1,147 4,620 2002 1,728 493 167 1,068 2003 3,790 1,093 412 2,285 2004 737 211 124 402 2005 1,938 719 291 928 2006 170 46 26 98 2007 691 33 16 129 93 420 2008 6 1 5 2010 3 3 2011 2 2 Total 32,418 33 16 9,853 3,796 18,720
40 CFR Part 51.366 (a)(2)(xxiii)
The number of vehicles tested by model year and vehicle type where the readiness status indicates that the evaluation is not complete for any module supported by on‐board diagnostic systems.

25
Vehicle Year
WB WAUK MILWS MILN MILC WA RAC KEN SHE TAC‐S TAC‐N DMV E
1996 795 1,141 1,405 1,864 2,548 1,175 1,079 1,341 693 11 20 9
1997 4,709 7,180 7,062 7,282 8,204 7,148 4,861 5,562 3,830 24 15 58
1998 1,031 1,703 1,865 2,284 3,011 1,590 1,428 1,690 877 5 19 10
1999 6,902 11,194 9,917 10,090 10,224 10,386 6,236 7,313 5,450 21 16 77
2000 1,344 2,246 2,148 2,820 3,365 1,994 1,451 1,770 988 6 6 15
2001 8,175 13,726 11,206 11,284 10,845 12,733 7,032 8,313 5,983 31 22 59
2002 1,357 2,412 2,112 2,624 2,838 2,200 1,421 1,777 1,038 8 3 17
2003 9,006 15,892 11,949 11,744 9,945 13,785 6,787 8,572 6,082 21 25 58
2004 1,313 2,385 1,797 2,206 2,098 1,937 1,113 1,530 918 1 2 12
2005 9,601 16,777 11,704 11,576 9,063 14,346 6,923 8,965 6,333 4 3 63
2006 447 916 580 863 644 789 325 468 288 1 1 8
2007 8,012 15,117 9,468 10,184 7,415 12,280 5,832 7,592 5,131 7 9 39
2008 258 493 269 228 162 341 191 215 150
2009 2 1 1
2010 5 4 1 12
2011 1 1 3
52,951 91,182 71,489 75,049 70,362 80,710 44,679 55,109 37,762 140 156 425
40 CFR Part 51.366 (a)(3)
The initial test volume by model year and test station.
26
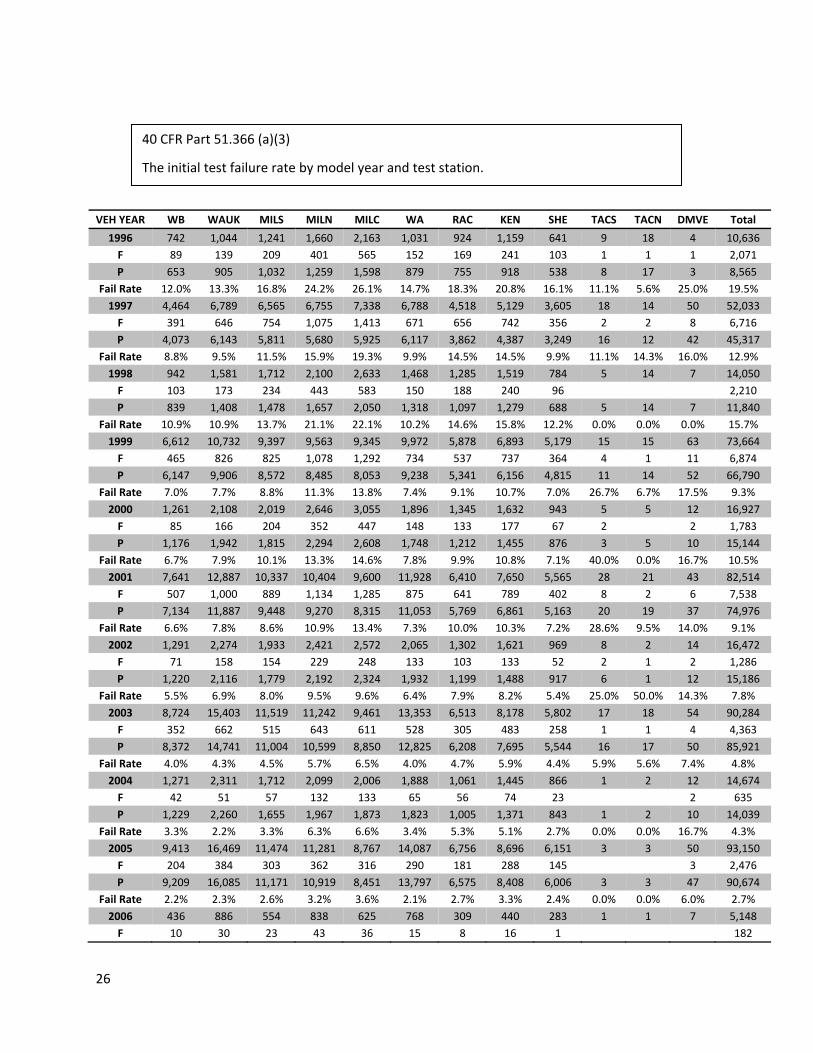
VEH YEAR WB WAUK MILS MILN MILC WA RAC KEN SHE TACS TACN DMVE Total
1996 742 1,044 1,241 1,660 2,163 1,031 924 1,159 641 9 18 4 10,636 F 89 139 209 401 565 152 169 241 103 1 1 1 2,071 P 653 905 1,032 1,259 1,598 879 755 918 538 8 17 3 8,565
Fail Rate 12.0% 13.3% 16.8% 24.2% 26.1% 14.7% 18.3% 20.8% 16.1% 11.1% 5.6% 25.0% 19.5% 1997 4,464 6,789 6,565 6,755 7,338 6,788 4,518 5,129 3,605 18 14 50 52,033 F 391 646 754 1,075 1,413 671 656 742 356 2 2 8 6,716 P 4,073 6,143 5,811 5,680 5,925 6,117 3,862 4,387 3,249 16 12 42 45,317
Fail Rate 8.8% 9.5% 11.5% 15.9% 19.3% 9.9% 14.5% 14.5% 9.9% 11.1% 14.3% 16.0% 12.9% 1998 942 1,581 1,712 2,100 2,633 1,468 1,285 1,519 784 5 14 7 14,050 F 103 173 234 443 583 150 188 240 96 2,210 P 839 1,408 1,478 1,657 2,050 1,318 1,097 1,279 688 5 14 7 11,840
Fail Rate 10.9% 10.9% 13.7% 21.1% 22.1% 10.2% 14.6% 15.8% 12.2% 0.0% 0.0% 0.0% 15.7% 1999 6,612 10,732 9,397 9,563 9,345 9,972 5,878 6,893 5,179 15 15 63 73,664 F 465 826 825 1,078 1,292 734 537 737 364 4 1 11 6,874 P 6,147 9,906 8,572 8,485 8,053 9,238 5,341 6,156 4,815 11 14 52 66,790
Fail Rate 7.0% 7.7% 8.8% 11.3% 13.8% 7.4% 9.1% 10.7% 7.0% 26.7% 6.7% 17.5% 9.3% 2000 1,261 2,108 2,019 2,646 3,055 1,896 1,345 1,632 943 5 5 12 16,927 F 85 166 204 352 447 148 133 177 67 2 2 1,783 P 1,176 1,942 1,815 2,294 2,608 1,748 1,212 1,455 876 3 5 10 15,144
Fail Rate 6.7% 7.9% 10.1% 13.3% 14.6% 7.8% 9.9% 10.8% 7.1% 40.0% 0.0% 16.7% 10.5% 2001 7,641 12,887 10,337 10,404 9,600 11,928 6,410 7,650 5,565 28 21 43 82,514 F 507 1,000 889 1,134 1,285 875 641 789 402 8 2 6 7,538 P 7,134 11,887 9,448 9,270 8,315 11,053 5,769 6,861 5,163 20 19 37 74,976
Fail Rate 6.6% 7.8% 8.6% 10.9% 13.4% 7.3% 10.0% 10.3% 7.2% 28.6% 9.5% 14.0% 9.1% 2002 1,291 2,274 1,933 2,421 2,572 2,065 1,302 1,621 969 8 2 14 16,472 F 71 158 154 229 248 133 103 133 52 2 1 2 1,286 P 1,220 2,116 1,779 2,192 2,324 1,932 1,199 1,488 917 6 1 12 15,186
Fail Rate 5.5% 6.9% 8.0% 9.5% 9.6% 6.4% 7.9% 8.2% 5.4% 25.0% 50.0% 14.3% 7.8% 2003 8,724 15,403 11,519 11,242 9,461 13,353 6,513 8,178 5,802 17 18 54 90,284 F 352 662 515 643 611 528 305 483 258 1 1 4 4,363 P 8,372 14,741 11,004 10,599 8,850 12,825 6,208 7,695 5,544 16 17 50 85,921
Fail Rate 4.0% 4.3% 4.5% 5.7% 6.5% 4.0% 4.7% 5.9% 4.4% 5.9% 5.6% 7.4% 4.8% 2004 1,271 2,311 1,712 2,099 2,006 1,888 1,061 1,445 866 1 2 12 14,674 F 42 51 57 132 133 65 56 74 23 2 635 P 1,229 2,260 1,655 1,967 1,873 1,823 1,005 1,371 843 1 2 10 14,039
Fail Rate 3.3% 2.2% 3.3% 6.3% 6.6% 3.4% 5.3% 5.1% 2.7% 0.0% 0.0% 16.7% 4.3% 2005 9,413 16,469 11,474 11,281 8,767 14,087 6,756 8,696 6,151 3 3 50 93,150 F 204 384 303 362 316 290 181 288 145 3 2,476 P 9,209 16,085 11,171 10,919 8,451 13,797 6,575 8,408 6,006 3 3 47 90,674
Fail Rate 2.2% 2.3% 2.6% 3.2% 3.6% 2.1% 2.7% 3.3% 2.4% 0.0% 0.0% 6.0% 2.7% 2006 436 886 554 838 625 768 309 440 283 1 1 7 5,148 F 10 30 23 43 36 15 8 16 1 182
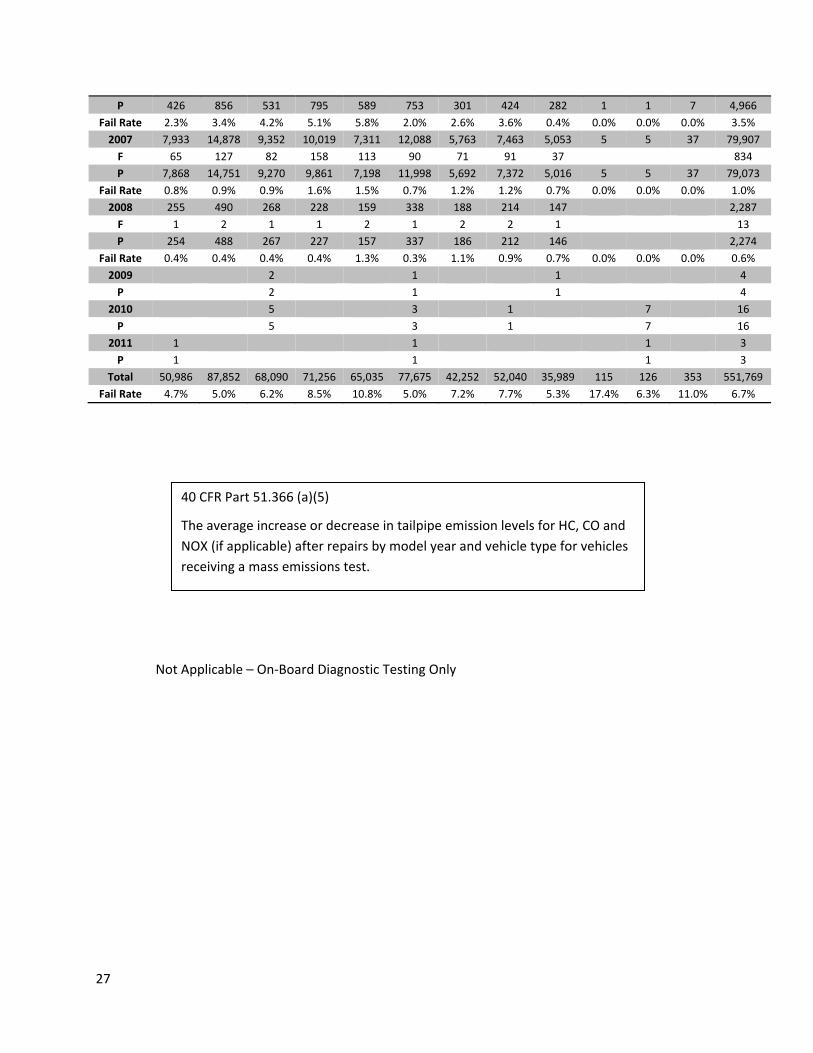
40 CFR Part 51.366 (a)(3)
The initial test failure rate by model year and test station.
27
P 426 856 531 795 589 753 301 424 282 1 1 7 4,966 Fail Rate 2.3% 3.4% 4.2% 5.1% 5.8% 2.0% 2.6% 3.6% 0.4% 0.0% 0.0% 0.0% 3.5% 2007 7,933 14,878 9,352 10,019 7,311 12,088 5,763 7,463 5,053 5 5 37 79,907 F 65 127 82 158 113 90 71 91 37 834 P 7,868 14,751 9,270 9,861 7,198 11,998 5,692 7,372 5,016 5 5 37 79,073
Fail Rate 0.8% 0.9% 0.9% 1.6% 1.5% 0.7% 1.2% 1.2% 0.7% 0.0% 0.0% 0.0% 1.0% 2008 255 490 268 228 159 338 188 214 147 2,287 F 1 2 1 1 2 1 2 2 1 13 P 254 488 267 227 157 337 186 212 146 2,274
Fail Rate 0.4% 0.4% 0.4% 0.4% 1.3% 0.3% 1.1% 0.9% 0.7% 0.0% 0.0% 0.0% 0.6% 2009 2 1 1 4 P 2 1 1 4
2010 5 3 1 7 16 P 5 3 1 7 16
2011 1 1 1 3 P 1 1 1 3
Total 50,986 87,852 68,090 71,256 65,035 77,675 42,252 52,040 35,989 115 126 353 551,769 Fail Rate 4.7% 5.0% 6.2% 8.5% 10.8% 5.0% 7.2% 7.7% 5.3% 17.4% 6.3% 11.0% 6.7%
Not Applicable – On‐Board Diagnostic Testing Only
40 CFR Part 51.366 (a)(5)
The average increase or decrease in tailpipe emission levels for HC, CO and NOX (if applicable) after repairs by model year and vehicle type for vehicles receiving a mass emissions test.