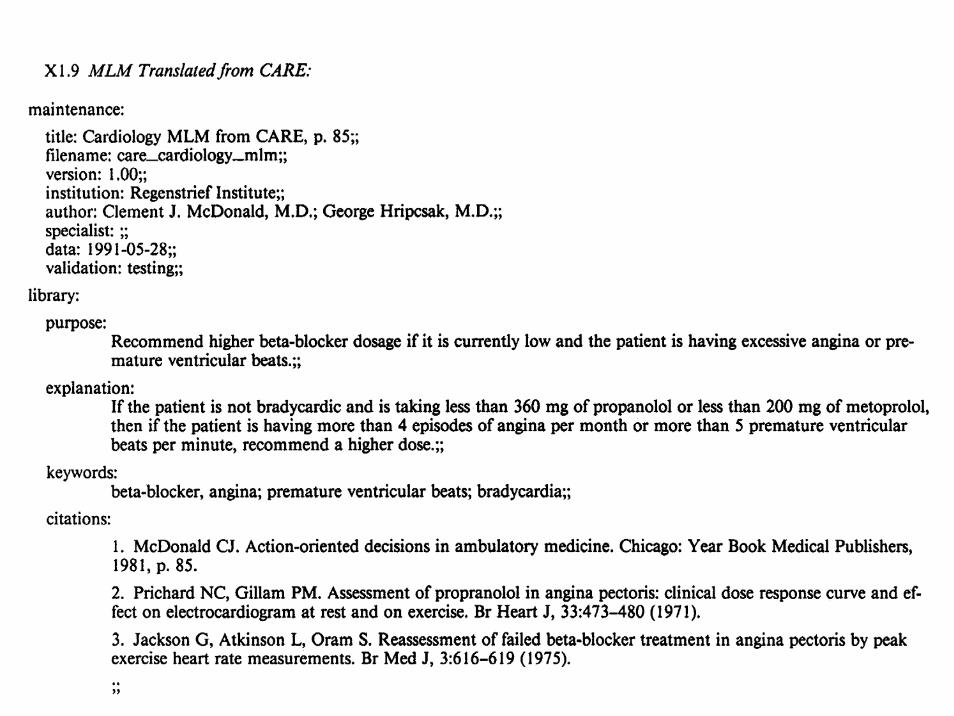
wissensbasierte toxoplasmose-diagnostik in der schwangerschaft 4 teil 2.pdf · wissensbasierte...
TRANSCRIPT

Wissensbasierte Toxoplasmose-Diagnostikin der Schwangerschaft
Klaus-Peter Adlassnig 1), Dieter Kopecky 1), Michael Hayde 2),Birgit Panzenböck 2), Arnold Pollak 2)
1) Institut für Medizinische ComputerwissenschaftenAbteilung für Medizinische Experten- und Wissensbasierte Systeme
2) Universitätsklinik für Kinder und JugendheilkundeKlin. Abteilung für Neonatologie, angeborene Störungen und Intensivmedizin
Medizinische Fakultät der Universität Wien

Toxopert
• Ziel: – Automatische Interpretation von Toxoplasmosetests im Zeitverlauf
• Methode:– Integration des Toxopert in das Routine-EDV-System der
jeweiligen medizinischen Einrichtung– Implementierung eines Entscheidungsgraphen– Befundausdruck mit Diagnose- und Therapievorschlag

Oozysten von Toxoplasma gondii
Aus dem Katzenkot. Natürliche Größe 12μm.(Aus: H. Aspöck, Toxoplasmose, Hoffmann-La Roche Wien, Wien 1992).


Antibody Concentration after Toxoplasmosis Infection
years
years
months
specific IgM detection

from: J.A.Pinard et al. (2003) Maternal Serologic Screening for Toxoplasmosis. Journal of Midwifery & Women’s Health 48, 308–316.

Beispiel
Befund/Untersuchung Datum SSW IgG berechneter
IgG-Trend IgM
Vorbefund 07.01.1999 10 negativ
1. 05.03.1999 18 negativ ⊥
2. 30.04.1999 26 1:256 ↑↑ positiv
3. 27.05.1999 30 1:16384 ↑↑ positiv

IgG≥1:4 undIgG≤1:256
Vorbefund
1. Untersuchung
2. Untersuchung
3. Untersuchung
Start
akute Infektion
keine Infektion
Akute InfektionVerdacht auf
akute Infektion
akute Infektionlatente Infektion oderwiderspr. Befunde
Infektion
neg pos
IgG neg IgG≥1:1024
IgG≥1:1024
↓↓,↓,⊥,↑ ↑↑
IgG≥1:4 undIgG≤1:256
IgG neg keine Infektion latente Infektion
Beispiel

TOXOPERT-I
• Stand-alone Small Talk-Version


TOXOPERT-Serologie

Evaluierung von TOXOPERT-I
Arzt →
TOXOPERT-I ↓akut latent keine
Infektionunzureichende oder inkonsistente Daten gesamt
akut 17 0 0 0 17
latent 0 361 0 7 368
keine Infektion 0 0 606 0 606
unzureichende oder inkonsistente Daten 0 2 0 7 9
gesamt 17 363 606 14 1000

TOXOPERT-II
• Integrierte Laborversion


Diskussion
• Modellierung des medizinischen Wissens als Entscheidungsgraph– zeitliche Abfolge der Befunde implizit enthalten
• Verlaufsbeurteilung bei Abweichung von Standardverläufen unzureichend– explizite Darstellung der Zeit erforderlich
• Visualisierung des Inferenzpfades

FuzzyTempTOXOPERT:Interpretation of Toxoplasmosis
Serology Test Results
Dieter Kopecky 1), Klaus-Peter Adlassnig 1), Michael Hayde 2), Andrea-Romana Prusa 2), and
Birgit Panzenböck 2)
1) Department of Medical Computer SciencesSection on Medical Expert and Knowledge-Based Systems
University of Vienna Medical School, Spitalgasse 23, A-1090 Vienna, Austria
2) Department of Pediatrics Division of Neonatology and Intensive Care
University of Vienna Medical School, Währinger Gürtel 18–20A-1090 Vienna, Austria

General Considerations• medical problem
– transplacental transmission of Toxoplasma gondii has to be treated immediately
* question: Did an acute toxoplasmosis infection occur after conception?
• objective– automatic interpretation of toxoplasmosis antibody test results in their
course of time* IgG SFT, IgM ISAGA
– automated generation of therapy proposals, if necessary• implementation
– decision graph, nonmonotonic reasoning, temporal distances are modelled by fuzzy sets
– integration into the routine laboratory information system of the toxoplasmosis laboratory
– web-based interpretive system

Decision Graph
2.01 (N)
2.02 (N)
2.03 (N)
1.01 (I)
Start
2.04 (N)
3.03 (A)3.08 (L)
[ ][ ]1024:1,4:1
,29∈
∧±−∈∧≤IgG
IgMGA−=∧≤
IgGGA 30
[ ]↑⊥↓⇓∈
∧≥
,,,
4:1
TT
IgG[ ]
+=∧∈
IgMIgG 1024:1,4:1
[ ]−=
∧∈IgG
GA 34,31
−=∧≥
IgGGA 35
?=PF
[ ]•=T
[ ]•=T [ ]•= ,4T
[ ]•= ,4T
[ ]•= ,4T[ ]•= ,4T
[ ]•= ,4T
[ ][ ]•= ,4,2T
[ ][ ]•= ,4,2T
[ ]•=T
[ ]•=T
3.08 (L)Latent (preconceptual) infection with Toxoplasma gondii is confirmed. The unborn is protected against an infection with Toxoplasma gondii.Additional serological control of this and future pregnancies is not necessary.

FuzzyTOXOPERT-III


At Least 3 to 5 Weeks
t in weeks
temporal compatibility
1 2 3 4 5 6 7 8 9 10 11 12
1.000.750.500.250.00
μ
[ )
[ ]( ]⎪
⎪⎩
⎪⎪⎨
⎧
+∞∈∀
∈∀−
∈∀
=
,5,..........,.........1
5,3,.,.........5.12
3,0,.........,.........0
)(temp
tt
ttttt
tμ

Within 7 Weeks
t in weeks
temporal compatibility
1 2 3 4 5 6 7 8 9 10 11 12
1.000.750.500.250.00
μ
[ ]
( )
[ )⎪⎪⎩
⎪⎪⎨
⎧
+∞∈∀
∈∀+−
∈∀
=
,9,..........,.........0
9,7,........5.42
7,0,...........,.........1
)(temp
tt
ttttt
tμ

Knowledge Base Taking Temporal Compatibility into Account–I
Interpretation 3.08 [0.0-0.3] Latent (preconceptual) infection with Toxoplasma gondii is very probable. [0.3-0.8] Latent (preconceptual) infection with Toxoplasma gondii is rather certain. [0.8-1.0] Latent (preconceptual) infection with Toxoplasma gondii is confirmed. The unborn is protected against an infection with Toxoplasma gondii. ]0.0-0.3] Serological followup required at 1-2 weeks. [0.3-0.8] Serological followup required at 2-3 weeks. [0.8-1.0] Additional serological control of this and future pregnancies is not necessary. ]0.0-0.99] Since the obligate time interval of @1 weeks has not been kept between the two tests on @2 and @3, it is possible, that a probable titer rise has not been recognized.
IF Graph Prel.Find. Findings GA IgG IgG trend IgM Time Start ? • 1.01 1 [30,37] [1:4,1:1024] ± + • 2.05 2 ≥ 1:4 ⇓ ↓ ⊥ ↑ [[2, 4], •] 3.08 3-i ≥ 1:4 ⇓ ↓ ⊥ ↑ •

Knowledge Base Taking Temporal Compatibility into Account–IIORGraph Prel.Find. Findings GA IgG IgG trend IgM TimeStart ? •1.01 1 ≤ 29 [1:4,1:1024] ± + •2.04 2 ≥ 1:4 ⇓ ↓ ⊥ ↑ [[2, 4], •]3.08 3-i ≥ 1:4 ⇓ ↓ ⊥ ↑ •
ORGraph Prel.Find. Findings GA IgG IgG trend IgM TimeStart – •1.02 1 [30,37] [1:4,1:1024] –± •2.05 2 ≥ 1:4 ⇓ ↓ ⊥ ↑ [[2, 4], •]3.08 3-i ≥ 1:4 ⇓ ↓ ⊥ ↑ •
ORGraph Prel.Find. Findings GA IgG IgG trend IgM TimeStart – •1.02 1 ≤ 37 [1:4,1:1024] + •2.15 2 ≥ 1:4 ⇓ ↓ ⊥ ↑ [[2, 4], •]3.08 3-i ≥ 1:4 ⇓ ↓ ⊥ ↑ •
ORGraph Prel.Find. Findings GA IgG IgG trend IgM TimeStart – •1.02 1 ≤ 29 [1:4,1:1024] –± •2.04 2 ≥ 1:4 ⇓ ↓ ⊥ ↑ [[2, 4], •]3.08 3-i ≥ 1:4 ⇓ ↓ ⊥ ↑ •

Diagnostic interpretation, therapy recommendation, and proposals for further examinations for a woman with acute toxoplasmosis.
The second inference cycle tried to eliminate test results that have lowered the overall temporal compatibility.

Discussion on FuzzyToxopert
• modeling of temporal concepts by fuzzy sets• degrees of applicability of rules < 1 (attributed to decision
paths) result in soft (= less decisive) interpretations

Logikbasierte Repräsentation

CADIAG: Computer-Assisted Diagnosis• predecessor (1968–1974):
– propositional logic: hepatology, rheumatology• CADIAG-I (1976–1983, 1990–1992):
– three-valued logic, predicate logic: rheumatology, gastroenterology, hepatology
• CADIAG-II (1978–present):– fuzzy set theory, fuzzy logic, compositional rule of inference with
occurrence and confirmability (numerical values): rheumatology, gastroenterology, hepatology, neurology, nosocomial infections)
• CADIAG-III (1992–1994):– extension of fuzzy operators (missing values in medicine), fix
point inference• MedFrame/CADIAG-IV (1986, 1994–present):
– extended data-to-symbol conversion, inference with SD-occurrence, SnotD-occurrence, SD-confirmability, SnotD-confirmability (linguistic values), generalization to symptoms, diseases, and therapies

Computer-Assisted Medical Diagnosis and Therapy
• “Reasoning Foundations of Medical Diagnosis” (1959)in Science by Ledley and Lusted– symbolic logic
∗ symptom complexes = logic combinations; diagnoses implicated or excluded
– probability∗ frequency of symptoms with diseases, frequency of symptoms
and frequency of diseases in a population; most probable diagnosis
– value theory∗ decision trees; optimal treatment


Relationships in CADIAG-I
necessity– O: obligatory occurring– F: facultative occurring
sufficiency– C: confirming– N: not confirming
positive association
OC: obligatory occurring and confirmingFC: facultative occurring and confirmingON: obligatory occurring and not confirmingFN: facultative occurring and not confirming
exclusionEX: excluding

Medizinische Relationen in Prädikatenlogik
• Relation OB (obligatorisch auftretend und beweisend):1. alle p mit S haben D2. alle p mit D haben S3. es gibt mindestens ein p mit S
∧S OB D = ∀p[S(p)→D(p)] ∧ ∀p[D(p)→S(p)] ∧ ∃p[S(p)]
• Relation FB (fakultativ auftretend und beweisend):1. alle p mit S haben D2. nicht alle p mit D haben S3. es gibt mindestens ein p mit S
∧S FB D = ∀p[S(p)→D(p)] ∧ ∃p[D(p)∧¬S(p)] ∧ ∃p[S(p)]

• Relation ON (obligatorisch auftretend aber nicht beweisend):1. alle p mit D haben S2. nicht alle p mit S haben D3. es gibt mindestens ein p mit D
∧S ON D = ∀p[D(p)→S(p)] ∧ ∃p[S(p)∧¬D(p)] ∧ ∃p[D(p)]
• Relation FN (fakultativ auftretend und nicht beweisend):1. nicht alle p mit S haben D2. nicht alle p mit D haben S3. es gibt mindestens ein p mit S und D
∧S FN D = ∃p[S(p)∧¬D(p)] ∧ ∃p[D(p)∧¬S(p)] ∧ ∃p[S(p)∧D(p)]
• Relation A (ausschließend)1. alle p mit S schließen D aus2. es gibt mindestens ein p mit S und nicht D3. es gibt mindestens ein p mit D und nicht S
∧S A D = ∀p[S(p)→¬D(p)] ∧ ∃p[S(p)∧¬D(p)] ∧ ∃p[D(p)∧¬S(p)]

Relationships in CADIAG-II
necessity ∈ (0,1] sufficiency ∈ (0,1]
positive association
necessity = [0] sufficiency = [0]
exclusion


Logikmodule

The system works behindthe scenes as an“active agents”
evaluatingclinical
scenarios. Notify the orderingpharmacist of the
drug interaction andcontact the requestingphysician immediately
Notify the clinicalpharmacist forfollow-up anddocumentation
Notify the requestingphysician of the
situation and suggesta potassiumsupplement
System checkspatient’s lab results
System checks patient’s medication
Pharmacist entersmedication order
CONDITIONSMET
ANDThe patient’s POTASSIUM
LEVEL is low
ANDThe patient is already
receiving FUROSEMIDE
IF. . .an order for DIGOXIN
is placed
AND
AND
THEN. . .The system immediately
takes the followingpredefined actions:
rule
“fire
s”


Drug-Laboratory Triggers

Clinical Pathways and Guidelines

Enacting Guidelines


FuzzyKBWean:A Fuzzy Control System for
Weaning from Artificial Ventilation
C. Schuh1, M. Hiesmayr2, K.-P. Adlassnig1, M. Kolb2
1Department of Medical Computer Sciences2Department of Cardiothoracic and Vascular Anaesthesia and Intensive Care
University of Vienna Medical School

Objective
• mechanically ventilated patients after cardiothoracic surgery in an intensive care unit (ICU)
• proposals for changes in ventilator settings during the three phases of mechanical ventilation (stabilization, weaning, and finally extubation of the patient)
• open-loop system: integration into the patient data management system (PDMS); time resolution of 1 minute
• closed-loop system as a long-term objective: integration into the ventilator (auto-mode)

Motivation
We found that nurses and respiratory therapists, usingprotocol guidance, weaned patients from mechanical
ventilation safely and more quickly than the team followingthe traditional practice of physician-directed weaning.
Koleff MH, et al : A Randomized, Controlled Trial of Protocoll-Directedversus Physician-Directed Weaning from Mechanical Ventilation.
Critical Care Medicine 1997; 25, 567–574.


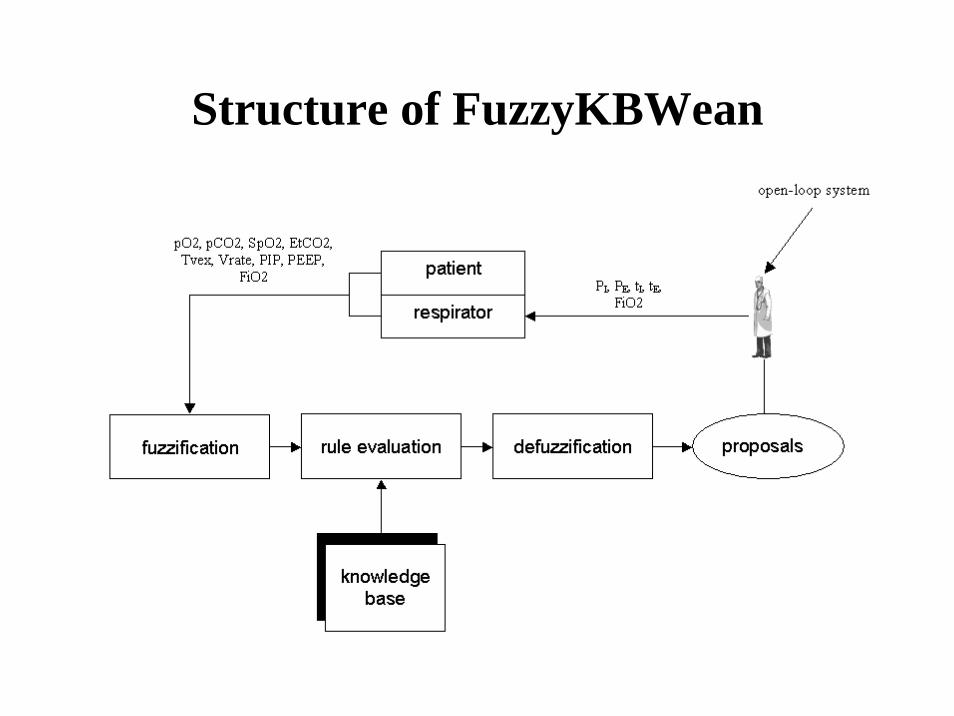
Structure of FuzzyKBWean

Methods
• phase-dependent fuzzy sets• linguistic if/then rules
– if: patient’s physiological parameters and ventilator measurement parameters (in a defined context)
– then: proposals for changes in ventilator settings
• fuzzification step – arithmetic, statistical, comparative, logical, temporal, and control
operators
• defuzzification step– Sugeno’s center of gravity method
• verification by the attending physician, i.e., open-loop

Patient’s Physiological Parameters
• oxygenation O2– arterial oxygen partial pressure pO2 (directly)– oxygen saturation SpO2 (indirectly: pulsoxymetry)
• ventilation: CO2-elimination (~ to alveolar ventilation)– arterial carbondioxide partial pressure pCO2 (directly)
endtidal carbondioxide EtCO2 (indirectly)
• expired tidal volume Tve
• respiratory rate Vrate


Fuzzy Control
fuzzification with
fuzzy sets
defuzzification with Sugeno’s
center of gravitymethod
PaO2 [mmHg]PaCO2 [mmHg]
FiO2-change[%]
measurement and observational level
inference processwith
linguistic fuzzy rules
low
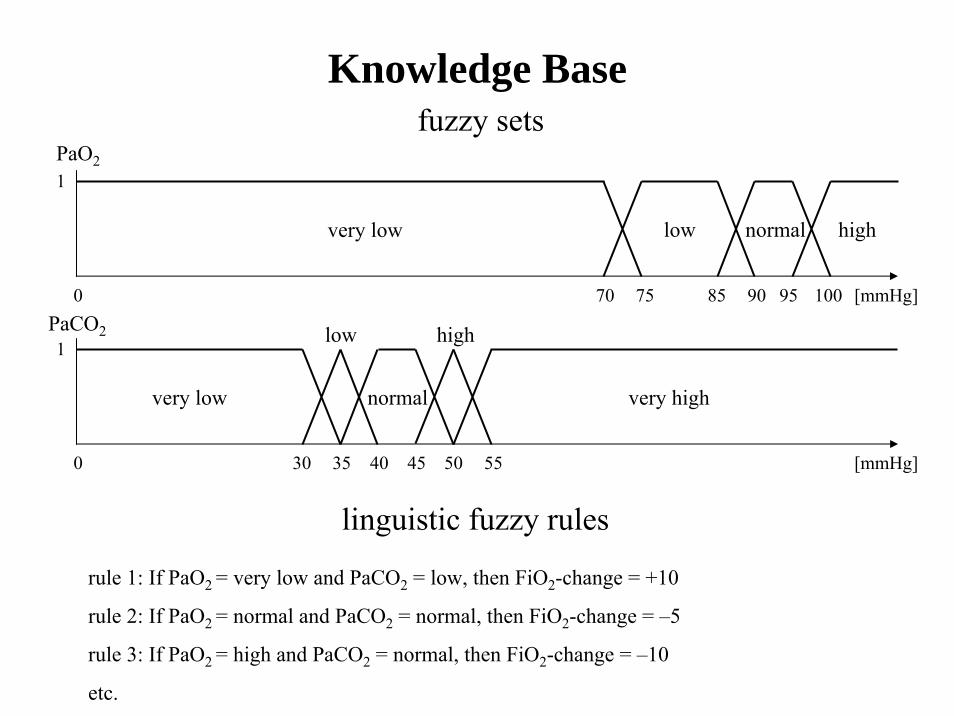
Knowledge Basefuzzy sets
linguistic fuzzy rules
rule 1: If PaO2 = very low and PaCO2 = low, then FiO2-change = +10
rule 2: If PaO2 = normal and PaCO2 = normal, then FiO2-change = –5
rule 3: If PaO2 = high and PaCO2 = normal, then FiO2-change = –10
etc.
1
3530 40 45 50 55
high
very low normal very high
PaCO2
0 [mmHg]
1
75 85 90 95 10070
very low low normal high
PaO2
[mmHg]0

low
PATIENT:
rule 2: If PaO2 = normal and PaCO2 = normal, then FiO2-change –5rule 3: If PaO2 = high and PaCO2 = normal, then FiO2-change –10
rule 2: min (PaO2 = normal, PaCO2 = normal) = min (0.8, 1) = 0.8rule 3: min (PaO2 = high, PaCO2 = normal) = min (0.2, 1) = 0.2
fuzzificationPaO2 = 96 mmHg, PaCO2 = 42 mmHg
inference process
defuzzification
1
75 85 90 95 10070
very low low normal high0.8
0.2
PaO2
[mmHg]96
1
3530 40 45 50 55
high
normal
PaCO2
very low very high
0 [mmHg]42
FiO2-change = = –60.8*(–5)+0.2*(–10)0.8+0.2


Results–I
• 23 variables– 74 fuzzy sets (phase-dependent)
• 16 if/then rules– 4 rules checking for measurement errors and validity– 3 rules for ventilation (normal range, hypoventilation,
hyperventilation)– 4 rules for oxygenation (stabilization, oxygenation normal,
hypoxia, severe hypoxia)– 4 rules for intermediate states (increased EtCO2, decreased EtCO2,
phase changes)– 1 rule for extubation

Results–II
• 10 prospectively randomized patients– FuzzyKBWean reacted correctly 131 (SEM 47) minutes earlier
than the attending physician– adjustment of ventilation parameters was more reliable than
adjustment of oxygenation (EtCO2 is more reliable as SpO2)– phase-specific rules often proposed too small changes of the
ventilator settings• temporal rule blocking, fuzzy set adaptations, employing
thresholds to avoid oscillations

Results–IIIDelay of Staff Reaction in Case of
Hyperventilationpatient episode proposed change at effective change at delay (min)
M 1 16:30 19:42 1922 23:50 01:55 1253 04:27 07:43 196
B 1 21:17 03:58 401D 1 22:57 23:16 19E 1 22:30 01:15 165
2 01:15 01:50 35K 1 13:45 14:45 60
2 20:20 20:48 28C 1 17:03 18:27 104
2 08:48 16:36 468G 1 20:02 20:12 10
2 20:12 20:30 183 20:30 22:47 1374 22:47 23:22 35
K 1 21:05 21:40 35

Discussion on FuzzyKBWean
• methodology– minimal number of therapeutically significant classes per variable– gradual transition between variable classes
• adequate consideration of the inherent fuzziness of medical concepts
– intuitive if/then rules at the knowledge level• physician’s medical knowledge was transferred to
FuzzyKBWean• clinical trial
– periods of deviation from the target parameters are shorter• contribution to the patient’s safety and comfort
– closed-loop: detection of artifacts and information obtained by direct observation of the patient

FuzzyARDS:Knowledge-Based Monitoring
and Decision Support
F. Steimann1, H. Steltzer2, K.-P. Adlassnig1
1Department of Medical Computer SciencesSection on Medical Expert and Knowledge-Based Systems
University of Vienna Medical School, Austria
2 Department of Anesthesiology and General Intensive Care MedicineUniversity of Vienna Medical School, Austria


Objective
• knowledge-based decision support– monitoring patients with acute respiratory distress syndrome
(ARDS) – early detection of ARDS– therapy advice in ARDS cases
• international study (Vienna, Berlin, Marburg, Paris, Milan)– to improve ARDS definition– to compare therapy entry criteria

Wir beobachteten, daß Krankenschwestern und Therapeuten, die für die Entwöhnung der Patienten von der künstlichen
Beatmung Protokolle verwendeten, diese schneller und sicherer entwöhnten, als das Team, welches
traditionellerweise den Anordnungen der Ärzte folgte.
Koleff MH, et al. : A Randomized, Controlled Trial of Protocoll-Directedversus Physician-Directed Weaning from Mechanical Ventilation.
Critical Care Medicine 1997; 25, 567–574.

VMVentilator Manager: Stanford University Medical School, 1979
STATUS-RULE: STABLE HEMODYNAMICSDEFINITION: defines stable hemodynamics based on blood pressure and heart rateAPPLIES TO: patients on volume, cmv, assist, T-pieceCOMMENT: look at mean arterial pressure for changes in blood pressure and systolic
blood pressure for maximum pressuresIF
1) heart rate is acceptable, and2) pulse rate does not change by 20 beats/minute in 15 minutes, and3) mean arterial pressure is acceptable, and4) mean arterial pressure does not change by 15 torr in 15 minutes, and5) systolic blood pressure is acceptable,
THENthe hemodynamics are stable.
• experimental, rule-based expert system for on-line data interpretation at the ICU
Example of a heuristic VM-rule.
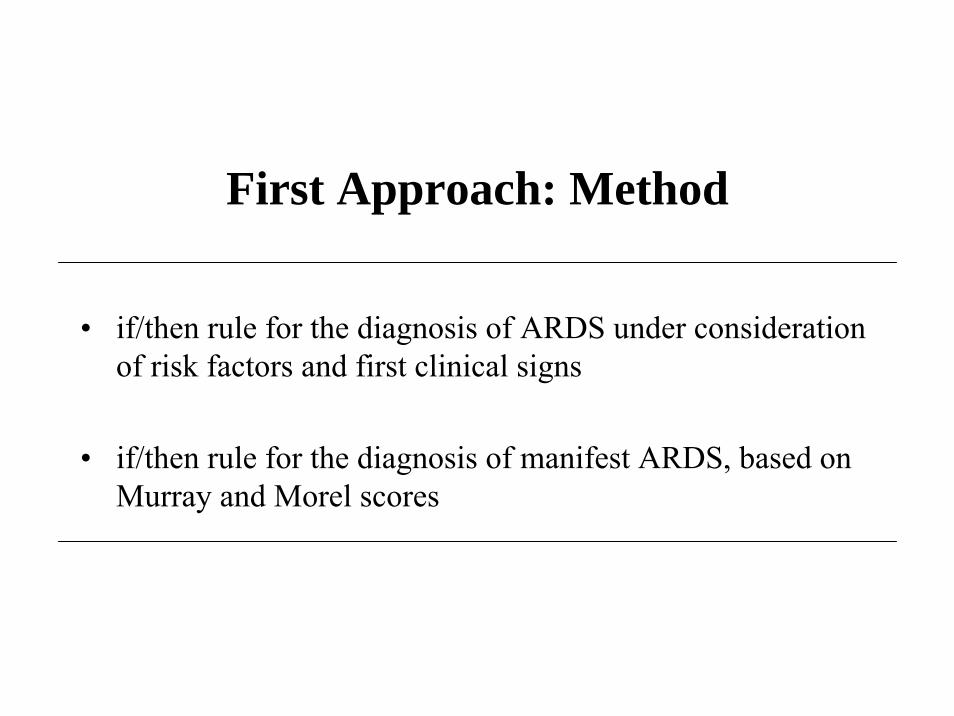
First Approach: Method
• if/then rule for the diagnosis of ARDS under consideration of risk factors and first clinical signs
• if/then rule for the diagnosis of manifest ARDS, based on Murray and Morel scores

risk = SEPSIS;.or. TRAUMA;.or. ASPIRATION;.or. PNEUMONIA;.or. SHOCK;.or. TRANSFUSION;.or. INHALATION;.or. PANKREATITIS;.or. DROWNING;.or. FAT EMBOLISM;.or. COAGULOPATHY;.or. BURNING;.or. KIDNEY FAILURE
signs = PAO2 < 75 .and. FIO2 ≥ 0.5;.or. PAO2 ≤ 65 .and. FIO2 ≥ 0.4;.or. PAO2 < 250 .and. FIO2 = 1.0;.or. PAO2 / FIO2 < 250;.or. ROENTSTAD ≥ 1;.or. SHUNT > 20;.or. TOTRAUMVEN;.or. COMPLIANCE < 50
signs = signs .and. PCWP < 18
ARDS: rule for early detection = risk .and. signs
ARDS: Rule for Early Detection
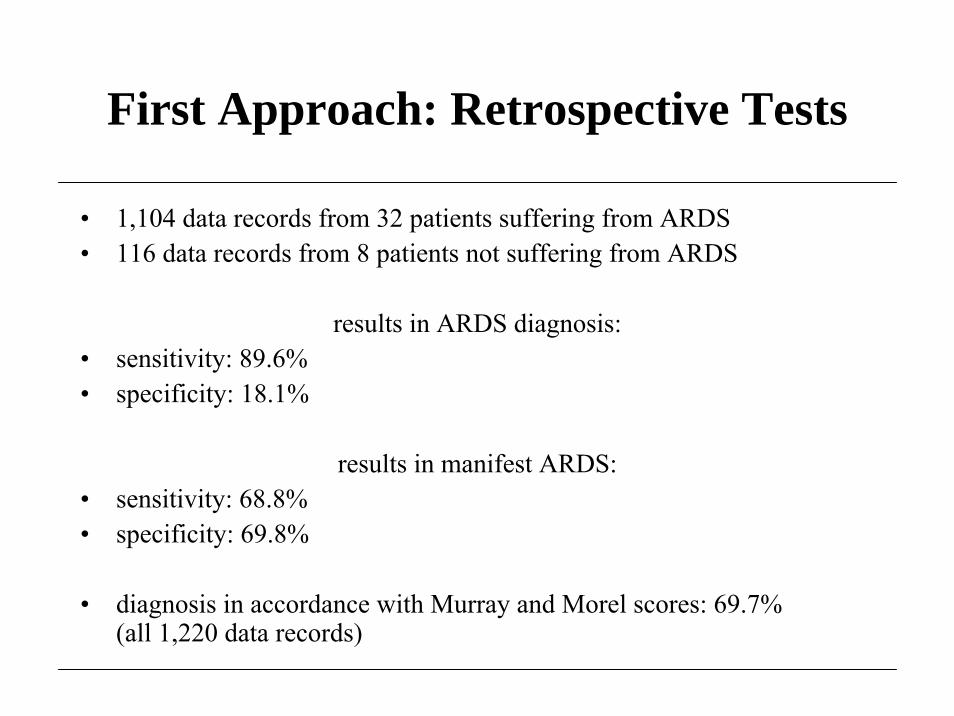
First Approach: Retrospective Tests
• 1,104 data records from 32 patients suffering from ARDS • 116 data records from 8 patients not suffering from ARDS
results in ARDS diagnosis:• sensitivity: 89.6%• specificity: 18.1%
results in manifest ARDS:• sensitivity: 68.8%• specificity: 69.8%
• diagnosis in accordance with Murray and Morel scores: 69.7%(all 1,220 data records)

First Approach: Problems
• ARDS is a fuzzily defined nosological entity⇒ a crisp definition of ARDS is inadequate⇒ in particular, the commitment to crisp limits of findings is unintuitive (see
figure)⇒ thresholds of PaO2 and FiO2 for patients suffering from ARDS:
⇒ hypothesis: it is practically impossible to characterize ARDS by a crisp definition
PaO2
FiO2

Second Approach: Methods
• development of a state transition diagram (deterministic automaton)– mutually exclusive states (no ARDS, suspected ARDS, early
detection of ARDS, confirmed ARDS, manifest ARDS, severe ARDS, ...)
– crisp transition conditions (PaO2/FiO2 < 250, ...)

severeARDS
not clarifiedPaO2/FiO2
suspected ARDS
moni-toring
ARDSdiagnosis
manifestARDS
ECCO2/ECMO
noARDS
chest radiograph,spontaneous breathing,
artificial respiration, and circulation negative
PaO2/FiO2 < 250for 1 day
exclusion criteria
chest radiograph,spontaneous breathing,artificial respiration, orcirculation pathological
risk factors
norisk factors
norisk factors
risk factors
CT: pulmonary lesion > 2/3and Morel score = 4
and Murray score > 3.5
CT: pulmonary lesion < 1/3and Morel score < 2.5and Murray score < 2.5or ...
CT: pulmonary lesion < 2/3and Morel score > 2.5
and Murray score > 2.5or ...
confirmedARDS

Weighted Scores

Scoring System
PaO2/FiO2 < 150 (with weight 2)shunt > 30 (with weight 1)
criteria fulfillmentPaO2/FiO2 = 100 2/(2+1)shunt = 25 0/(2+1)score 2/3
criteria fulfillmentPaO2/FiO2 = 160 0/(2+1)shunt = 35 1/(2+1)score 1/3
definition of two criteria:
case 1:
case 2:

New Approach: Methods
• development of a fuzzy state transition diagram (fuzzy automaton) – with mutually non exclusive states (gradual transition from one
state to another, concurrent partial presence of several states; the clinician is able to consider the situation carefully)
– with fuzzy conditions for the transition of states (fuzzy medical concepts, fuzzy trend detection)

not clarifiedPaO2/FiO2
ECCO2/ECMO
noARDS
chest radiograph,spontaneous breathing,
artificial respiration, and circulation negative
chest radiograph,spontaneous breathing,artificial respiration, or circulation pathological
risk factors
CT: pulmonary lesion < 1/3and Morel score < 2.5and Murray score < 2.5or ...
norisk factors
norisk factors
risk factors
CT: pulmonary lesion > 2/3and Morel score = 4
and Murray score > 3.5
exclusion criteria
PaO2/FiO2 < 250for 1 day
CT: pulmonary lesion < 2/3and Morel score > 2.5
and Murray score > 2.5or ...
severeARDS
manifestARDS
ARDScon-
firmed
ARDSdiagnosis
suspectedARDS
moni-toring

Scoring System withFuzzy Concepts

Scoring System with Fuzzy Concepts
degree
shunt
1
0 20 30
PaO2 / FiO2 < 150 (200) with weight 2Shunt > 30 (20) with weight 1
criteria score and fulfillmentPaO2/FiO2 = 164 0.72 * (2/3) = 0.72 * 2/3shunt = 23 0.3 * (1/3) = 0.3 * 1/3score 0.58
PaO2/FiO2
1
0 150 200
degree
164
0.72
0.3
23
} 2+1 = 3

Condition Definition with “fuzzified by” Graphical representation
adequate oxygenation SaO2 above 97% (93%) for 5 minutes
hypoxemia SaO2 between 90% and 93% (87% and97%) for 2 minutes
high FiO2 FiO2 above 60% for 30 seconds
low FiO2 FiO2 below 60% for 30 seconds
rapidly improving SaO2 increasing from 87–95%oxygenation (85–99%) to 97–100% (93–100%)
within 30–90 seconds(5–120 seconds)
slowly decreasing SaO2 above 96% (91%) steady oroxygenation decreasing to 94% (89%) within 25
minutes
Patient Conditions

Trend Detection Applied to SaO2(in part filtered through moving average)
12 hour period

State Transition Diagram of the Automaton
start
normal hypoxic
improved afterhand bagging
not improved afterhand bagging
respondingto high FiO2
not respondingto high FiO2

State Interpretation
start initial state, undecidednormal oxygenation is satisfactory without additional
effort such as increased FiO2
hypoxic oxygenation is too low and should beimproved
responding to high FiO2 high FiO2 has affected oxygenation positivelynot responding to high FiO2 high FiO2 does not have the desired effectimproved after hand hand bagging has persistently improvedbagging oxygenation
not improved after hand hand bagging shows no satisfactory effectbagging
Definition of States under Consideration

From state On condition To state
start adequate oxygenation normalhypoxemia hypoxic
normal hypoxemia hypoxic
hypoxic low FiO2 ∧ adequate oxygenation normalhigh FiO2 ∧ rapidly improving responding to high FiO2oxygenationhigh FiO2 ∧ hypoxemia not responding to high FiO2
responding to high FiO2 low FiO2 ∧ slowly decreasing improved after hand baggingoxygenationlow FiO2 ∧ hypoxemia not improved after hand bagging
not responding to high low FiO2 ∧ hypoxemia hypoxicFiO2 high FiO2 ∧ adequate oxygenation responding to high FiO2
improved after hand adequate oxygenation normalbagging hypoxemia hypoxic
not improved hypoxemia hypoxicafter hand bagging
Linguistic State Transitions

Distribution of States over Time

Discussion on FuzzyARDS
• concept modeling and trend detection with fuzzy sets– inherent fuzziness of medical and temporal concepts, unsharpness
of boundaries
• monitoring with fuzzy automata– fuzzily defined nosological concepts (partial lack of medical
theory)
• visualization on the ICU monitor– integration in the PDMS– dynamic visualization of changes of states– display of state transitions over time