witan pacific investment trust plc...witan pacific investment trust 10 source: datastream (to...
TRANSCRIPT

WITAN PACIFIC INVESTMENT TRUST PLC
110th Annual General Meeting
June 2017
These slides are intended to highlight some key points about Witan Pacific Investment Trust plc, for
the use of shareholders, analysts and other professional investors. This material is for
informational purposes only and does not constitute a solicitation or a personal recommendation in
any jurisdiction.
No reliance may be placed for any purpose on the information and opinions contained in this document or
their accuracy or completeness. No part of this material may be copied, photocopied or duplicated in any
form or distributed to any person that is not an employee, officer, director or authorised agent of the
recipient, without Witan Investment Services Limited’s prior permission.
Important note: Please remember that past performance is not a guide to future performance. Witan
Pacific Investment Trust is an equity investment. The value of an investment and the income from it
can fall as well as rise as a result of currency and market fluctuations and you may not get back the
amount originally invested.
Issued and approved by Witan Investment Services Limited. Witan Investment Services Limited is
registered in England no.5272533 of 14 Queen Anne’s Gate, London SW1H9AA. The VAT registration
number for Witan Investment Services Limited is 863573889.Witan Investment Services Limited provides
investment products and services and is authorised and regulated by the Financial Conduct Authority.
MSCI information. None of the MSCI information is intended to constitute investment advice or a recommendation to make (or refrain from making)
any kind of investment decision and may not be relied on as such. Historical data and analysis should not be taken as an indication or guarantee of
any future performance analysis, forecast or prediction, The MSCI information is provided on an “as is” basis and the user of this information assumes
the entire risk of any use made of this information. MSCI, each of its affiliates and each other person involved in or related to compiling, computing or
creating any MSCI information (collectively, the “MSCI Parties”) expressly disclaims all warranties (including, without limitation, any warranties of
originality, accuracy, completeness, timeliness, non-infringement, merchantability and fitness for a particular purpose) with respect to this information.
Without limiting any of the foregoing, in no event shall any MSCI Party have any liability for any direct, indirect, special, incidental, punitive,
consequential (including, without limitation, lost profits) or any other damages. (www.msci.com)
DISCLAIMER
WITAN PACIFIC INVESTMENT TRUST 2
AGENDA
WITAN PACIFIC INVESTMENT TRUST 3
• Chair’s Overview
• Investment Review
‒ Manager video commentaries
‒ Summary from Witan Investment Services
• Question and answer discussion
• Formal business of the meeting
• Tea

CHAIR’S OVERVIEWSarah Bates
INVESTMENT OBJECTIVE
WITAN PACIFIC INVESTMENT TRUST 5
• To provide shareholders with long term capital and income growth from
a diversified portfolio of investments in the Asia Pacific region,
employing an active multi-manager approach
• To grow the dividend in real terms over the long term
• To outperform the MSCI AC Asia Pacific Index (£), the Company’s
benchmark

ORGANISATIONAL STRUCTURE
WITAN PACIFIC INVESTMENT TRUST 6
Aberdeen
Portfolio Managers
Board
Executive Manager
Service Providers
Matthews
Gavekal
Witan Pacific
Witan Investment
Services
CapitaCompany Secretary
JPMorganCustodian
BNP ParibasFund Accounting
PWCAuditors

FULL YEAR TO 31 JANUARY 2017
WITAN PACIFIC INVESTMENT TRUST 7
• NAV total return of 30.7%, compared with benchmark 35.3%
• Share price total return of 26.1%
• Outperformed in 8 out of the 12 financial years since becoming
multi-manager in May 2005
• Final dividend of 2.55p, making 4.75p for the full year (+2.2%)
• Net assets £217m (2016: £170m)
• NAV total return of 195.8% since the adoption of the multi-manager
approach in 2005, compared with 183.1% for the benchmark
Please see disclaimer on slide 2
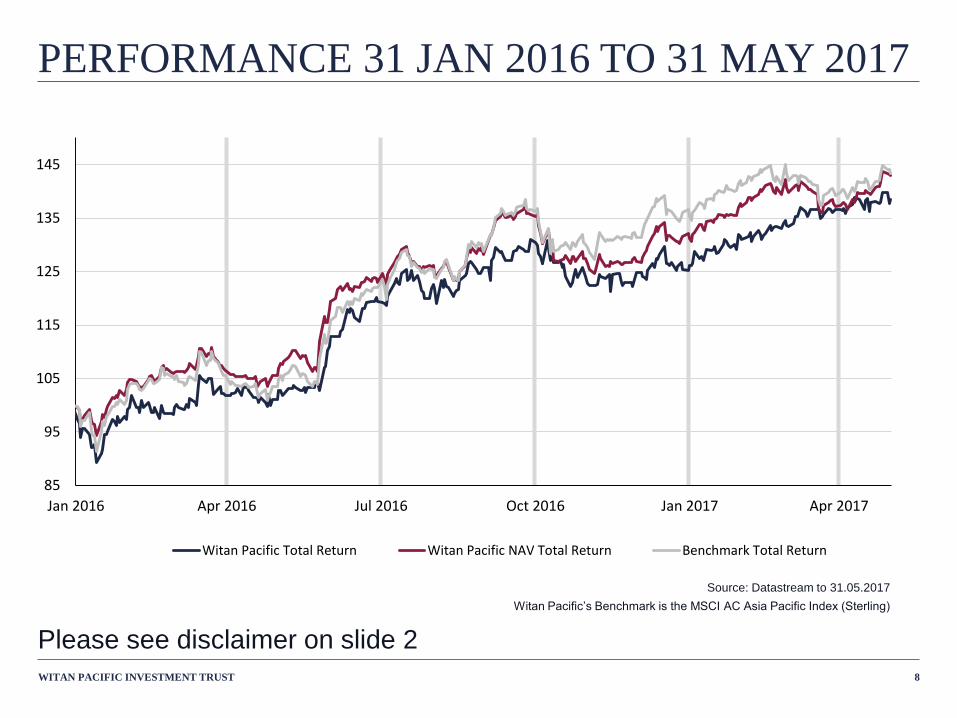
PERFORMANCE 31 JAN 2016 TO 31 MAY 2017
WITAN PACIFIC INVESTMENT TRUST 8
Source: Datastream to 31.05.2017
Witan Pacific’s Benchmark is the MSCI AC Asia Pacific Index (Sterling)
85
95
105
115
125
135
145
Jan 2016 Apr 2016 Jul 2016 Oct 2016 Jan 2017 Apr 2017
Witan Pacific Total Return Witan Pacific NAV Total Return Benchmark Total Return
Please see disclaimer on slide 2

• Final dividend of 2.55p,
making 4.75p for full year
• 2.2% increase over previous
year (CPI 1.8%)
• 12 consecutive years of
dividend growth
• The regular dividend is 4.5
times that paid in 2005
• Revenue reserves are circa
3 times annual dividend
WITAN PACIFIC DIVIDEND RECORD
WITAN PACIFIC INVESTMENT TRUST 9
0
0.5
1
1.5
2
2.5
3
3.5
4
4.5
5
2007 2008 2009 2010 2011 2012 2013 2014 2015 2016 2017
Regular dividend Special dividend
Policy – The Company aims to grow the
dividend in real terms over the long term
Source: Witan Pacific
Please see disclaimer on slide 2

DISCOUNT AND SHARE BUYBACKS (TO 31.05.2017)
WITAN PACIFIC INVESTMENT TRUST 10
Source: Datastream (to 31.05.2017)
• Discount widened in 2016 due to market volatility and Brexit uncertainty, pace of buybacks
increased in response to the widening discount
• 713,979 shares repurchased in the financial year to 31 Jan 2017
• 1.6m shares repurchased in the current financial year at discounts between 11% and 17%
-25.0%
-20.0%
-15.0%
-10.0%
-5.0%
0.0%
2005 2006 2007 2008 2009 2010 2011 2012 2013 2014 2015 2016 2017
Witan Pacific Discount (30 day average)
Please see disclaimer on slide 2

INVESTMENT REVIEWJames Hart, Investment Director
Witan Investment Services

HIGHLIGHTS FROM THE FINANCIAL YEAR
WITAN PACIFIC INVESTMENT TRUST 12
• Fluctuating hopes for economic growth which improved over the year
• Improved sentiment in Asia and particularly in emerging markets as
commodity prices recovered
• Asian corporate earnings showing signs of improvement
• Significant political shocks from the Brexit vote, US Presidential election and
South Korean impeachment
• Global interest rates appear to have troughed as economic policy edges
towards targeting tax cuts and investment spending
• These macro factors drove stock market rotation which made life difficult for
the majority of active managers, including our own

MANAGER STRUCTURE (AS AT 31.01.2017)
WITAN PACIFIC INVESTMENT TRUST 13
Annualised performance is since inception excludes cash balances held centrally by Witan Pacific
Gavekal returns are adjusted for 1.5% annual management fee charged within the
UCITS OEIC, of which 0.75% is rebated to the Company directly outside the fund.
Portfolio Manager
(inception)% managed
Performance
12m
Benchmark
12m
Annualised
Performance
Annualised
Benchmark
Performance
Aberdeen
(31.05.05)43.4 +39.2 +35.3 +11.4 +9.3
Matthews
(30.04.12)46.4 +28.4 +35.3 +13.3 +11.3
Gavekal
(24.04.12)10.2 +22.3 +35.3 +10.1 +11.5
TRUST PERFORMANCE 31st MAY 2005 to 31st JANUARY 2017
Cumulative
NAV TR
Cumulative
Benchmark
Annualised
NAV TR
Annualised
Benchmark
Total return
(since 31.05.05)100.0 +195.8 +183.1 +9.7% +9.3%
Source: WM Performance Services/Morningstar
All performance to 31.01.2017
Please see disclaimer on slide 2
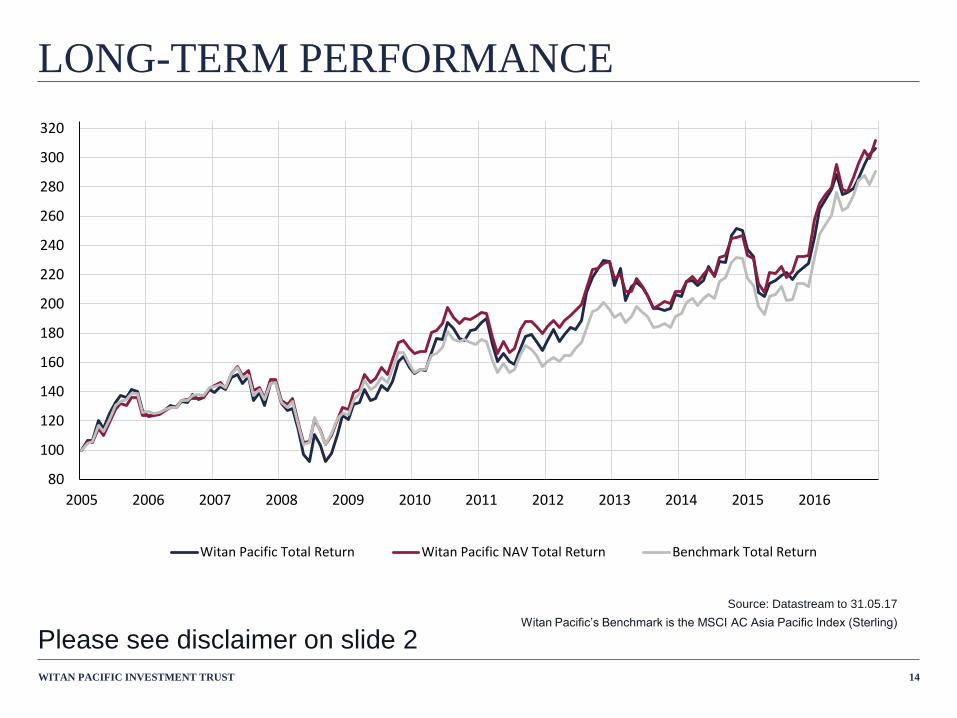
LONG-TERM PERFORMANCE
WITAN PACIFIC INVESTMENT TRUST 14
Source: Datastream to 31.05.17
Witan Pacific’s Benchmark is the MSCI AC Asia Pacific Index (Sterling)
80
100
120
140
160
180
200
220
240
260
280
300
320
2005 2006 2007 2008 2009 2010 2011 2012 2013 2014 2015 2016
Witan Pacific Total Return Witan Pacific NAV Total Return Benchmark Total Return
Please see disclaimer on slide 2

RELATIVE PERFORMANCE
WITAN PACIFIC INVESTMENT TRUST 15
Source: Datastream to 31.05.17
Witan Pacific’s Benchmark is the MSCI AC Asia Pacific Index (Sterling)
95
100
105
110
115
120
2005 2006 2007 2008 2009 2010 2011 2012 2013 2014 2015 2016
NAV Relative to benchmark
Please see disclaimer on slide 2

TOP 20 INVESTMENTS…
WITAN PACIFIC INVESTMENT TRUST 16
% %
1 Samsung Electronics 2.8 11 LG Chemical 1.3
2 Japan Tobacco 2.3 12 Shin-Etsu Chemical 1.3
3 Taiwan Semiconductor 2.3 13 Mitsubishi UFJ Financial Group 1.3
4 HSBC 2.1 14 Singapore Tech Engineering 1.2
5 Minth Group 2.0 15 Keyence Corp 1.2
6 Seven & I Holdings 1.7 16 AIA Group 1.2
7 China Mobile 1.6 17 Fanuc 1.2
8 United Overseas Bank 1.6 18 Sumitomo Mitsui Financial Group 1.2
9 BGF Retail Company 1.6 19 Sinopec 1.1
10 Shenzhou International 1.4 20 CapitaLand 1.0
By size of investment as a proportion of Witan Pacific’s overall portfolio
On a look through basis across managers, excluding open-end funds
Source: BNP Paribas as at 31 May 2017
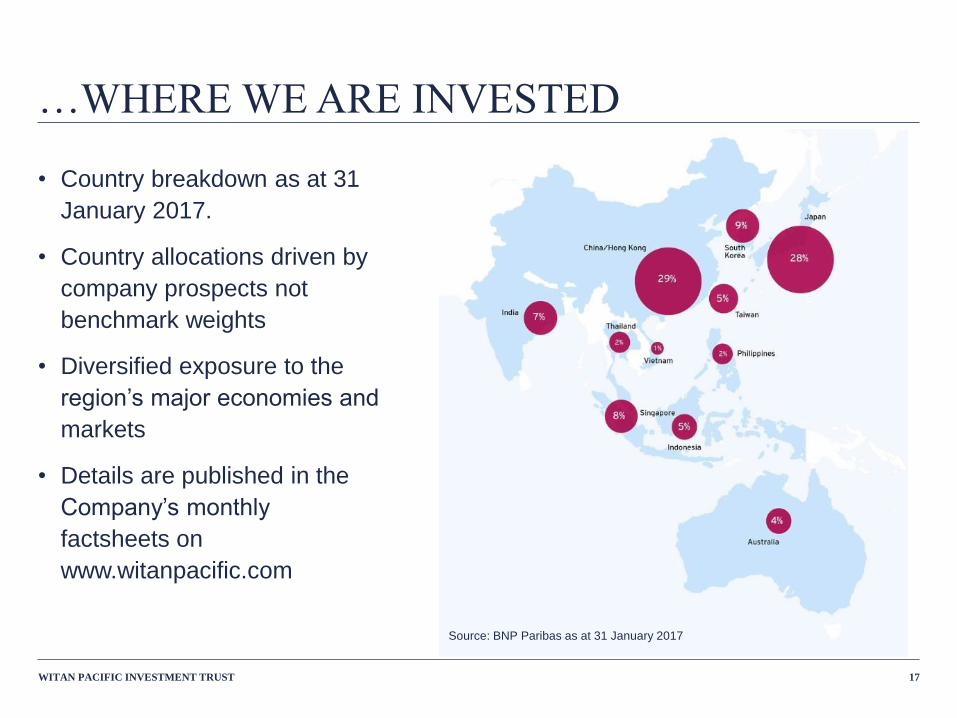
…WHERE WE ARE INVESTED
WITAN PACIFIC INVESTMENT TRUST 17
• Country breakdown as at 31
January 2017.
• Country allocations driven by
company prospects not
benchmark weights
• Diversified exposure to the
region’s major economies and
markets
• Details are published in the
Company’s monthly
factsheets on
www.witanpacific.com
Source: BNP Paribas as at 31 January 2017

REGIONAL PROSPECTS
WITAN PACIFIC INVESTMENT TRUST 18
• Home to 60% of the world’s population, a high standard of education, economic transition. Increased interdependence across the region
• Asian economic ‘miracle’ driven by a high rate of investment and productivity leading to increasing consumption and savings
• Political change accelerating, should lead to improved public governance, improved shareholder rights and a more business-friendly environment
• Chinese slowdown is part of a long-term trend and evolution from a low cost producer to a service economy
• Japan showing signs of life following unprecedented monetary policy action to boost the domestic economy
Please see disclaimer on slide 2
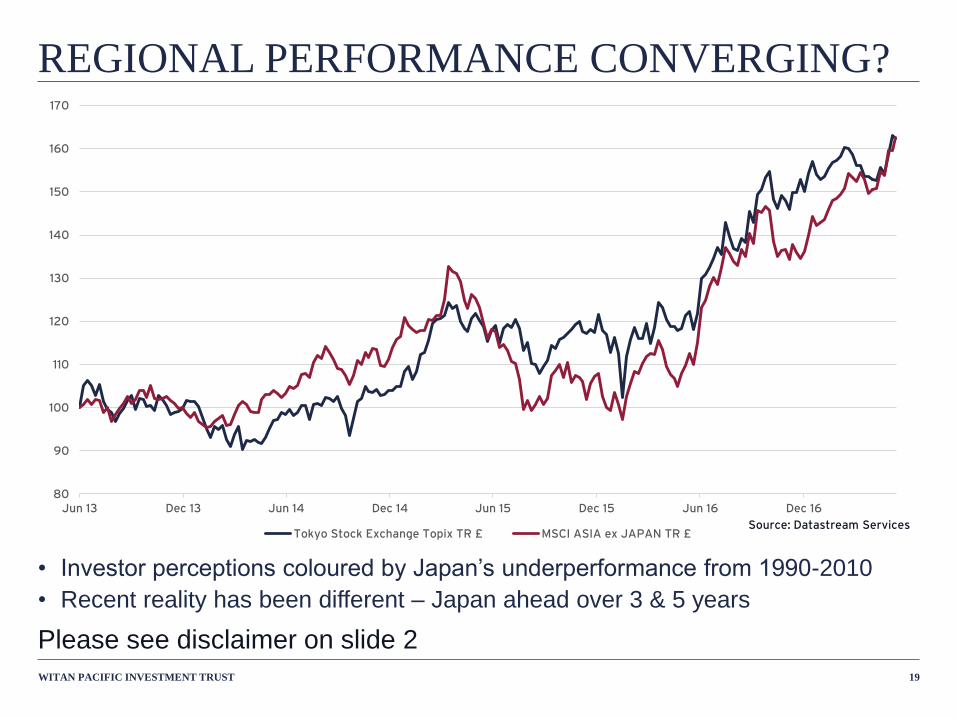
REGIONAL PERFORMANCE CONVERGING?
Source: Datastream Services
WITAN PACIFIC INVESTMENT TRUST 19
• Investor perceptions coloured by Japan’s underperformance from 1990-2010
• Recent reality has been different – Japan ahead over 3 & 5 years
80
90
100
110
120
130
140
150
160
170
Jun 13 Dec 13 Jun 14 Dec 14 Jun 15 Dec 15 Jun 16 Dec 16
Tokyo Stock Exchange Topix TR £ MSCI ASIA ex JAPAN TR £
Please see disclaimer on slide 2

CURRENT FINANCIAL YEAR
WITAN PACIFIC INVESTMENT TRUST 20
• Outperforming year to date. NAV total return (at 9 June) 11.9%, ahead of
Benchmark 8.8%. Share price total return 13.8%
• Discount to NAV has narrowed but remains at a relatively wide level
• Share repurchase activity has increased
• Asian markets have generally performed well so far this year. Japan has
underperformed its regional peers
• Sterling exchange rates will continue to be influenced by Brexit negotiations and
the UK political environment – especially after the General Election
Please see disclaimer on slide 2
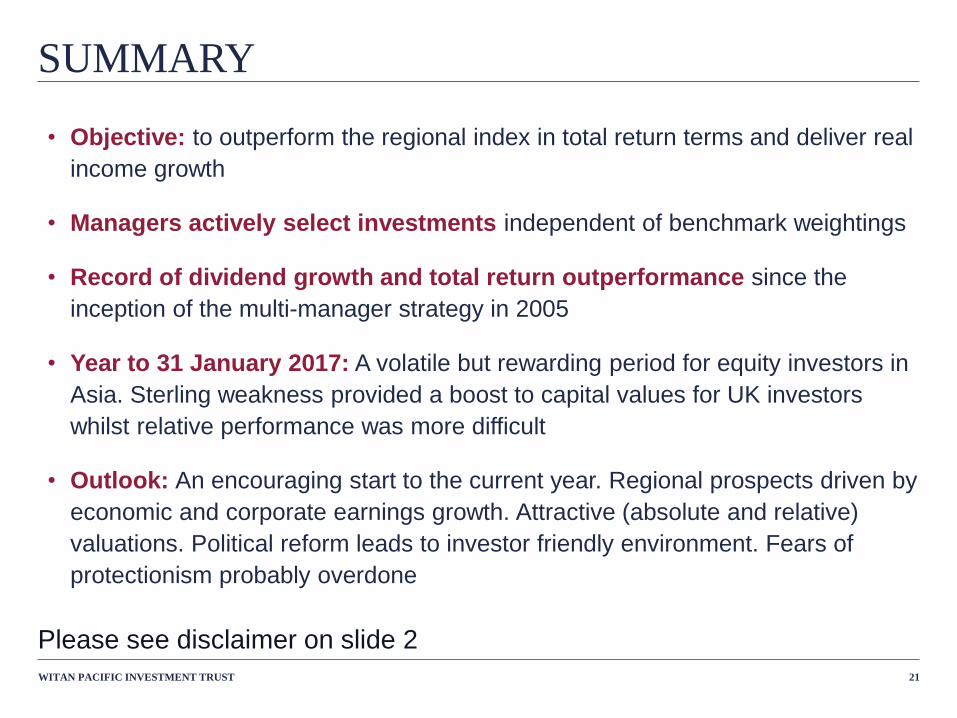
SUMMARY
WITAN PACIFIC INVESTMENT TRUST 21
• Objective: to outperform the regional index in total return terms and deliver real
income growth
• Managers actively select investments independent of benchmark weightings
• Record of dividend growth and total return outperformance since the
inception of the multi-manager strategy in 2005
• Year to 31 January 2017: A volatile but rewarding period for equity investors in
Asia. Sterling weakness provided a boost to capital values for UK investors
whilst relative performance was more difficult
• Outlook: An encouraging start to the current year. Regional prospects driven by
economic and corporate earnings growth. Attractive (absolute and relative)
valuations. Political reform leads to investor friendly environment. Fears of
protectionism probably overdone
Please see disclaimer on slide 2

LONGER-TERM PERSPECTIVE
WITAN PACIFIC INVESTMENT TRUST 22
Source: Morningstar
All performance for the discrete years to 31.03.17
TR= Total Return
Individual years to end-Mar 2017 2016 2015 2014 2013
MSCI AC Asia Pacific Index TR [A] 34.6 -6.4 22.3 -4.7 15.9
Witan Pacific Share Price TR 33.2 -10.1 26.2 -12.5 25.0
Witan Pacific NAV TR [B] 31.1 -5.0 20.9 -10.2 18.0
Relative NAV performance [B-A] -3.5 1.4 -1.4 -5.4 2.1
Over 10 years (May 2007 to May 2017): NAV total return of 119.0% and a share
price return of 116.6%, compared with the benchmark’s 103.2%.
Please see disclaimer on slide 2

THANKYOU
WITAN PACIFIC INVESTMENT TRUST

SUMMARY OF PROXY VOTES 2017
WITAN PACIFIC INVESTMENT TRUST 24
Resolution Votes Cast Total Votes For plus
DiscretionFor Against Discretion Withheld Total Cast
(excluding
withheld)
134,748,670 6,140 80,725 16,207 34,835,535 34,829,395
234,764,622 3,135 80,725 3,260 34,848,482 34,845,347
334,231,397 395,543 81,537 143,264 34,708,477 34,312,934
434,202,906 368,367 81,537 198,931 34,652,810 34,284,443
534,501,809 146,494 80,885 122,553 34,729,188 34,582,694
633,881,927 791,878 80,725 97,211 34,754,530 33,962,652
734,615,404 70,882 80,931 84,524 34,767,217 34,696,335
834,007,402 423,687 80,931 339,721 34,512,020 34,088,333
934,377,094 312,287 80,931 81,429 34,770,312 34,458,025
1034,590,905 159,857 80,931 20,047 34,831,693 34,671,836
1134,183,619 568,724 77,438 21,961 34,829,781 34,261,057

SUMMARY OF PROXY VOTES
WITAN PACIFIC INVESTMENT TRUST 25
Total Shares in Issue = 65,944,000
Total Voting Rights = 63,410,9431
Percentage of Shares Voted = 54.94%2
1 Voting rights as at 12 June 2017. Voting rights exclude shares
held in treasury.
2 Percentage based on validly received proxy votes prior to the
meeting in respect of Resolution 1.