witchcraft, weather and economic growth in renaissance europe · witchcraft, weather and economic...
TRANSCRIPT
Witchcraft, Weather and Economic Growthin Renaissance Europe
Emily Oster∗
January 8, 2004
∗I am grateful to Chris Avery, Brad DeLong, Claudia Goldin, Robert Jensen, Michael Kremer, DavidLaibson, Stephen Mitchell, Jesse Shapiro, Andrei Shelifer and Tim Taylor for helpful comments. Contact:[email protected]
1
Between the 13th and 19th centuries, as many as one million individuals in Europe
were executed for the crime of witchcraft. The majority of the trials and executions took
place during the 16th and 17th centuries. During this period the speed and volume of
executions were astonishing: in one German town as many as 400 people were killed in a
single day (Midelfort, 1972). The trials were ubiquitous: conducted by both ecclesiastical and
secular courts; by both Catholics and Protestants. The victims were primarily women,
primarily poor and disproportionately widows. The persecutions took place throughout
Europe, starting and ending earlier in southwest Europe than in the northern and eastern
areas, and spread even across the Atlantic to Salem, Massachusetts. Although witchcraft
trials in Europe and America largely ended by the late 18th century, witchcraft accusations
and killings still take place in many countries today, particularly in the developing world. For
example, witchcraft is often blamed for AIDS deaths in Sub-Saharan Africa (Ashforth, 2001)
and Miguel (2003) shows that negative economic shocks in Tanzania are associated with
increases in witch-killing there. Belief in the witch, and fear of her, is enduring.
While much work has been done on the motivations behind the European trials, the
large-scale causes remain unknown. The existing work has primarily been concerned with the
factors that played into trials on a small scale - why a certain individual was targeted, or why
a certain type of individual was targeted in a given area. This work has indicated that there
were a diverse set of issues that played into trials on an individual level, and there are clearly
numerous idiosyncratic reasons behind the targeting of specific people. More broadly,
however, there are few causal explanations for why witchcraft trials happened at all, and on
such a large scale in so many areas at the time they did. The earliest trials, going back to the
thirteenth century, were the work of the Church, particularly the Catholic Inquisition, but the
mass of trials later in the period saw very little formal Church involvement of this type.
Various hypotheses have been offered: for example, a need by the male medical profession to
rid the world of midwives and female folk healers (Ehrenreich and English, 1973); a perceived
2
need for moral boundaries by the Catholic Church (Ben-Yehuda, 1980); or an increase in
syphilis and subsequent increase in the mentally ill, who were then targeted as witches (Ross,
1995).
This paper explores the possibility that the witchcraft trials are a large-scale example
of violence and scapegoating prompted by a deterioration in economic conditions. In this
case, the downturn was brought on by a decrease in temperature and resulting food shortages.
The most active period of the witchcraft trials coincides with a period of lower than average
temperature known to climatologists as the ”little ice age.” The colder temperatures increased
the frequency of crop failure and colder seas prevented cod and other fish from migrating as
far north, eliminating this vital food source for some northern areas of Europe (Fagan, 2000).
Several kinds of data show more than a coincidental relationship between witch trials, weather
and economic growth. In a time period when the reasons for changes in weather were largely
a mystery, people would have searched for a scapegoat in the face of deadly changes in
weather patterns. ”Witches” became target for blame because there was an existing cultural
framework that both allowed their persecution and suggested that they could control the
weather.
Background on Witchcraft and the Little Ice Age
The belief in the existence of witches goes back at least as far as the Old Testament of the
Bible, which forbids the practice of witchcraft: ”Thou shalt not suffer a witch to live (Exodus
22:18).” Pre-Christian cultures in Greece, Rome and Iceland, among other places, believed in
the power of witches (Ankarloo and Clark, 1999; Davidson, 1973). The history of systematic
witch-hunting, however, is primarily associated with the Christian church. Russell (1972) and
the volume edited by Kors and Peters (2001) both offer good general histories of witchcraft in
the medieval period.
In the early medieval period the Catholic Church asserted that it was not possible for
3
mortals to do things that were attributed to witches. For this reason, the early church leaders
dismissed the view that witches could influence the weather. For example, in the ninth
century an important cleric, Agobard, Archbishop of Leon, dismissed the idea that witches
could produce weather in his letter, ”Against the foolish opinion of the masses about hail and
thunder” (”Contra insulsum vulgi opinionem de grandine et tonitruis”)(Agobard of Leon,
829). Early church documents went as far as to suggest that belief in witchcraft was heresy
(Kors and Peters, 2001).
Starting in the mid-thirteenth century, however, it became widely accepted that
witches existed, were capable of causing physical harm to others and could control natural
forces. The first trials for witchcraft emerged from the actions of the Catholic Inquisition at
this time (the Inquisition was an official Church-sponsored investigatory organization,
designed to stamp out heretical behavior and other religious groups). During this early
period, accusations of witchcraft and sorcery were primarily an offshoot of the accusations of
heresy that the Inquisition was originally charged to tackle. Some have argued that the move
toward persecuting witchcraft in addition to heresy was, in part, a response to the waning
power of the Inquisition once other heretic groups like the Cathars (who held the gnostic
belief that matter was evil and salvation came through spiritual renunciation of matter) and
the Waldensians (who preached in public without approval of the clergy and translated some
of the Bible into vernacular language) had been largely eliminated (Russell, 1972). During
this period, witchcraft accusations were often closer to heresy - accusations of prostration to
the devil, for example - than to criminal behavior.
There appeared to be a lull in the witchcraft trials between the end of the fifteenth
century and the middle of the sixteenth, after a significant period of witch-hunting in the
early fifteenth century. This lull was followed by the largest period of witch persecutions,
lasting from the mid-sixteenth century to the end of the eighteenth, which is the period
discussed in this paper. It is during this period that the majority of the executions took place,
4

and the trials spread throughout Europe and Scandinavia. The victims were
disproportionately women, especially those poor or widowed. Largely in contrast to earlier
periods, the later trials were conducted by both Catholics and Protestants, and in both
ecclesiastical and secular courts.
The principal text outlining the proper treatment of witches in this latter period was
the Malleus Malleficarum, published in 1484 (Summers,1971). This book was instrumental in
codifying the existing believes about witches, their powers and their actions. It gave specific
guidelines about how suspected witches should be ”questioned” until they confessed to their
crimes. In addition, it calls our attention to the extant beliefs about witchcraft,
weather-making and crop destruction at this time. In the Papal Bull that opens the Malleus,
Pope Innocent VIII recognizes the power of witches in the destruction of crops, writing: “It
has indeed lately come to Our ears ... many persons of both sexes ... have blasted the produce
of the earth, the grapes of the vine, the fruits of the trees, ..., vineyards, orchards, meadows,
pasture-land, corn, wheat, and all other cereals...” (Summers, 1971). In addition, the Malleus
contains a chapter detailing the powers of witches with regard to the weather, entitled ”How
they Raise and Stir up Hailstorms and Tempests, and Cause Lightning to Blast both Men and
Beasts.” This chapter ends with a line that leave no room for doubt about the perceived
power of witches: “Therefore it is reasonable to conclude that, just as easily as they raise
hailstorms, so can they cause lightning and storms at sea; and so no doubt at all remains on
these points,” (Summers,1971).
It has long remained a mystery why the witchcraft trials re-emerged in the
mid-sixteenth century, and why they did so with such force. The textual evidence shows us
why it would be possible in this time to believe that witches controlled the weather.
Moreover, the evidence on climate change suggests there were important and noticeable
weather changes during this period that would have severely affected food production.
Temperatures began to drop around the beginning of the fourteenth century (after a
5
400-year “medieval warm period”) and the world was warming again by the early 1800s. The
coldest segments of this “little ice age” period were in the 1590s and between 1680 and 1730
(Fagan, 2000). The temperature over the period was about two degrees Fahrenheit lower than
it had been in previous centuries. This decrease was large enough to leave Iceland completely
surrounded by ice, and to routinely freeze the Thames in England and the canals in Holland,
both otherwise unheard-of events.
The cause of the generally colder weather is not known. Climatic historians have
demonstrated that during the latter part of the little ice age (1645-1715), known as the
“Maunder Minimum”1 , there were very few sunspots, although it is not immediately clear
why this would lead to lower temperature. The colder weather was exacerbated by a number
of volcanic eruptions (including Huaynaputina in southern Peru in 1600, the volcano now
known as Mount Parker in the Philippines in 1641, and smaller volcanic episodes in 1666-1669,
1675 and 1698-99) which cooled much of the world for years at a time (Fagan, 2000).
In general, there is overlap in the time period of the colder weather and the
witchcraft trials. Over this period trials are generally rising and then falling, while the
temperature is falling and then rising. In addition to this general overlap, one of the sharpest
drops in temperature in the little ice age roughly coincides with the reinvigoration of
witchcraft trials around 1560, after a 70-year lull. It is possible that this drop in temperature
was a catalyzing factor in the regrowth of the trials. Some anecdotal evidence also suggests
that witchcraft accusations in Europe may have been connected with periods of particularly
extreme weather. Behringer (1995,1999) notes the overlap between the period of the little ice
age and the witchcraft trials and provides several examples of large storms or other weather
anomalies that were cited in specific trials. For example, Behringer (1999) shows historical
evidence that the particularly cold May in the year 1626 was associated with a renewed call
among peasants for persecution of witches and sorcerers in the Franconian town Zeil.
1Edward Walter Maunder (1851-1928) was a British astronomer who is best remembered today for his studiesof cyclical patterns of sunspots, but who was also active as a skeptic in the debate over whether observed markingson Mars were canals.
6
The remainder of this paper explores systematic evidence on the issue of whether
these poor weather and economic downturns were causally related to the witch trials.
Multi-Country Analysis
One way to test the relationship between weather and witch trials is to look at the correlations
across a number of regions. I collected data on witchcraft trials, weather and growth in a
number of regions of Europe between 1520 and 1770. Figure 1 presents the primary
relationship detailed in this paper. This graph shows standardized temperature (averaged
over all regions) and standardized trials (again, averaged over all regions) graphed against
time. The graph clearly shows that temperature and trials moved in opposite directions in
this period. The most extreme example of this is in the period after 1720, but the relationship
is also clear in the earlier time periods. A (quadratic) time trend has also been removed from
these data, which is one way of attempting to assure that the relationship between weather
and witchcraft is not just a coincidental relationship between two time trends.
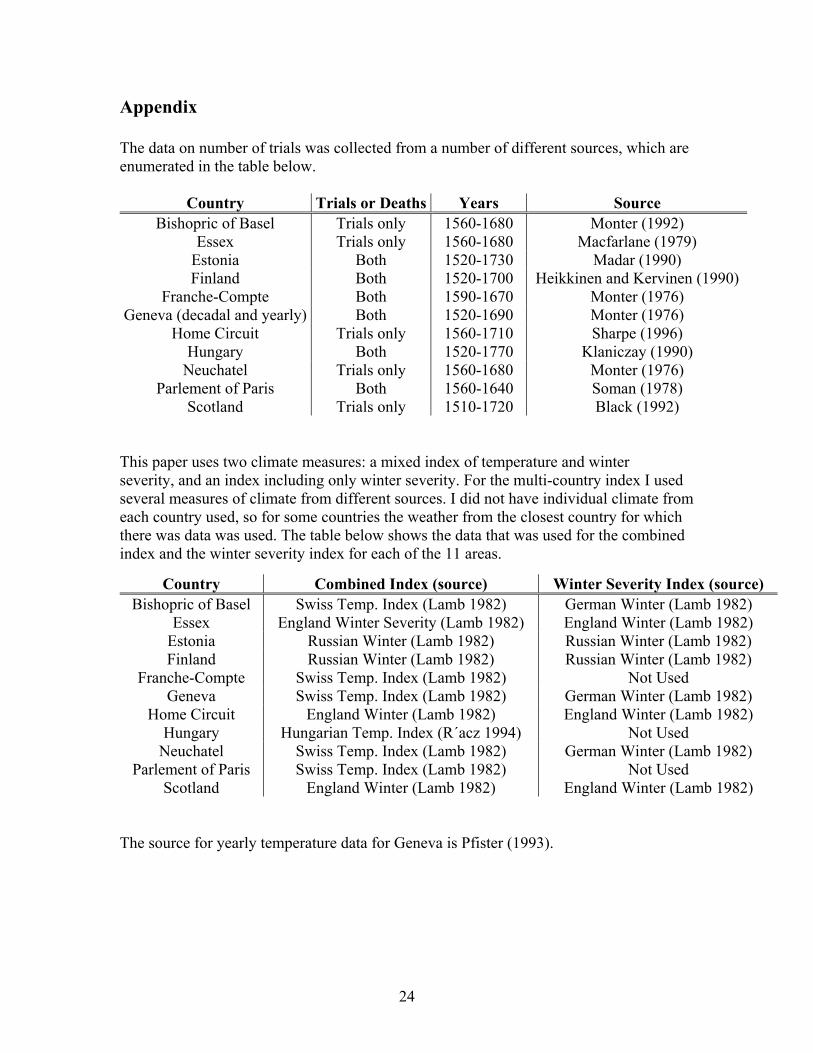
The data and calculations underlying Figure 1 deserve some additional explanation.
(Details of the data collection for trials and weather, and the sources for each part of the data
used, are in the Appendix). The data on the number of trials were complied from a variety of
secondary sources dealing with 11 regions of Europe: Bishopric of Basel (in the northern part
of modern Switzerland), Essex (in the modern United Kingdom), Estonia, Finland,
Franche-Compte (now in eastern France), Geneva, Home Circuit (England), Hungary,
Neuchatel (now near the western border of Switzerland), Parlement of Paris and Scotland. I
tabulated the trials by decade (in cases where the number of trials was available by year, they
were summed over the decade.) Recording at the decadal level was done primarily to match
the trial data with temperature data, which was generally available only decadally. In
addition, the number of trials was standardized relative to the regional means. This adjusts
for differences in the absolute number of trials across countries and makes the coefficients in
7

the regressions (presented later) easier to interpret. Thus, in each area the mean is zero and
the standard deviation is one.
Data on weather were also collected from secondary sources. It is available for fewer
regions, and as a result, more than one witch trial region was matched with each set of
temperature data. For some areas, data are available directly on temperature. For others,
data exist on “winter severity,” which should be a good proxy for temperature (colder winters
are more severe). To combine the two measures (which is done to ensure the closest geographic
temperature-trial matching) all data are standardized relative to the country mean. I create
two measures, one in which each trial region is matched with the closest weather region, in
which weather can be measured either through temperature or winter severity, and a second
measure in which only a subset of trial regions are matched to winter severity measures, as a
robustness check. The details of this matching appear in the Appendix.
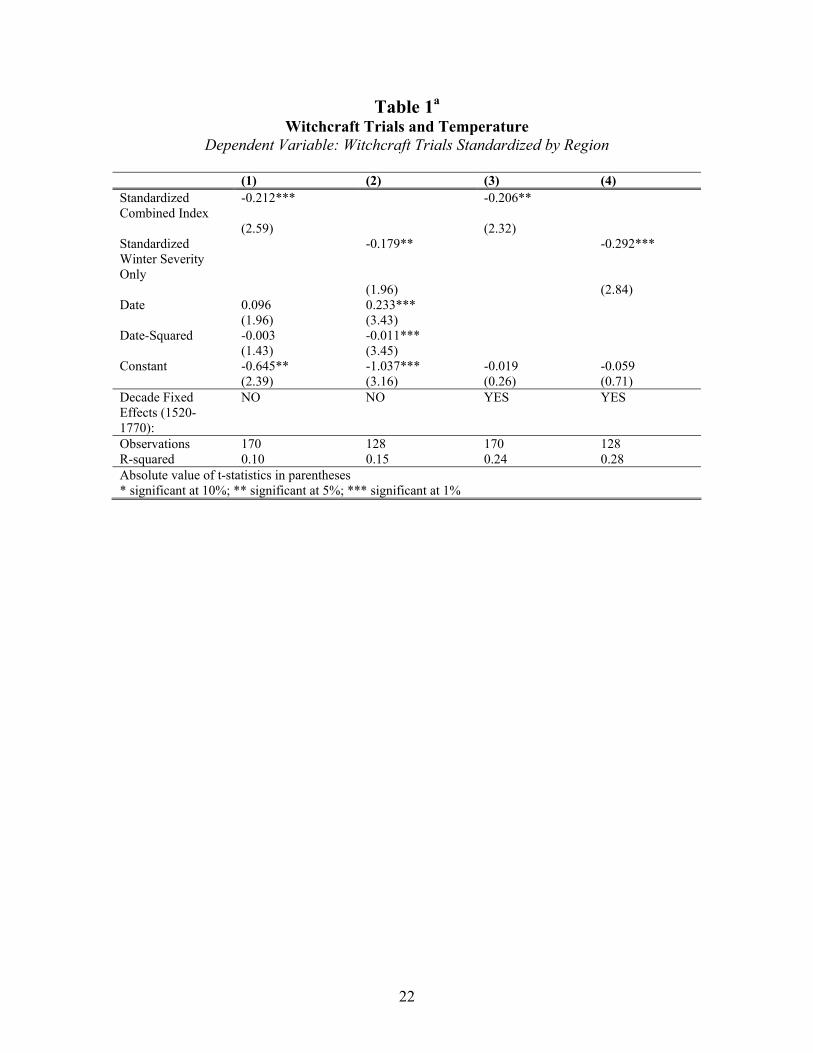
The relationship in Figure 1 is analyzed statistically in Table 1. Columns 1 and 2 of
the table provide a direct test of the relationship between weather and trials: the
standardized trial index is regressed against the standardized weather index, with quadratic
controls for date also included. Column 1 includes all observations and uses the combined
temperature/winter severity index to measure weather; Column 2 includes only the subset of
countries for which winter severity is available, and therefore uses winter severity to measure
weather. The results suggest that a one standard deviation decrease in temperature leads to
about a 0.20 standard deviation increase in witch trials. The small R-squared on columns 1
and 2 indicates that only about 8-12 percent of the variation in trials is explained by the
variation in temperature and simple date controls. This level of explanatory power is not
surprising given that the data are likely to be quite noisy and a number of other factors
certainly contributed to the witch trial phenomenon.
Two main econometric concerns arise with Columns 1 and 2. First, there is the
possibility that the regressions are simply picking up opposite directional trends in the data
8
that are not sufficiently controlled for by date variables. Second, there is the possibility of
omitted variable bias because of lack of controls for important historical events in this period:
for example, the Thirty Years War, really a series of wars fought across Europe from
1618-1648, mainly pitting the Hapsburg dynasty of Austria against, at various times, France,
Sweden, Denmark, and Holland; outbreaks of bubonic plague, which happened about once
every twenty years in heavily populated areas during this period; and others. Columns 3 and
4 address these issues by including decadal dummies. The dummies allow for overall changes
in trials over time. Thus, the results hinge on cross-sectional differences during each decade
rather than time-series trends. Moreover, any large events that affected the whole of Europe
in this time period will be implicitly controlled for by these dummy variables. The results in
columns 3 and 4 show only a small decrease in the magnitude of the relationship once the
decadal dummies are included, and the statistical significance is unaffected.2
I tested the robustness of these results in a number of ways. For example, one
possible concern about this analysis is that the results may be driven by a strong relationship
in one or two countries. But when the regression is run repeatedly, each time excluding one
area, the magnitude of the results does not change appreciably. Also, most of the regions are
missing observations either at the beginning of the 1520 to 1770 period, or at the end, or
both. But when the regressions were run using a subset of dates for which all countries were
observed, the results remained essentially the same. Overall, these results suggest that
decreases in temperature led to more witchcraft trials.
Geneva Yearly Analysis
Temperature data are generally available only at the decadal level. However, for the Geneva
region both trial data and temperature data were available on a yearly basis. Since food
2For some regions data on the number of executions for witchcraft is available alongside data on the numberof trials. When this regression is run using deaths rather than trials we see coefficients of similar magnitude,although only very marginal statistical significance, likely due to the smaller number of observations.
9

shortages are likely produced by circumstances in previous years, the analysis is carried out
by presenting the relationship between the number of trials and the average temperature for
the previous three years.
Figure 2 shows the negative relationship between number of trials and temperature.
Years with specific numbers of trials are grouped (1-5, 6-10, etc) because there are generally
only one or two years with any given number of trials. When the relationship in this graph is
tested statistically by running a regression of number of trials on the average temperature for
the last three years, the relationship is negative and marginally statistically significant at the
8% level. The coefficient implies that a 1 standard deviation increase in temperature leads to
about a 0.39 standard deviation decrease in trials.
Of course, it would be unwise to put too much weight on evidence from a single area.
However, taken together with the earlier results, the annual time series from Geneva provides
additional evidence that adverse weather conditions in this period should be part of an
explanation of the witchcraft trial phenomenon.
Witchcraft and Economic Growth
In the primarily agricultural economies of the medieval period, economic growth will be
heavily influenced by crop yield, and hence by weather. In this section we take this approach
one step further and attempt to test more directly the relationship between economic growth
and the witchcraft trials. However, a test of this hypothesis immediately runs into the
difficulty that sufficient data on economic growth are unavailable for the period between 1520
and 1770, so it becomes necessary to turn to proxies.
I use two measures to proxy for economic growth. The first is the number of cities in
the country with a population of more than 10,000. These data comes from de Vries (1984)
and were also used by Delong and Shleifer (1993) as a measure of growth. The second proxy
for growth is country population density from McEvedy and Jones (1978). These data have
10

been used by Acemoglu, Johnson and Robinson (2001), and they argue that only during
prosperous periods could countries support dense populations, implying that population
growth parallels economic growth. In addition, population growth is likely to be closely
related to food production so it may more directly than weather capture the effects of lower
food production on witchcraft trials. It should be noted that, although population density is
available for all regions in the analysis, the urbanization data are not available for Hungary or
Estonia. In addition, the growth data are country-specific, so to the extent that there is more
than one location in each country, all locations within the same country have the same growth
data.
Both the number of cities and population density data are available at 50-year
intervals (starting in 1500). Percentage population growth over each 50-year period is
standardized relative to the country mean (note that within an area of fixed size, growth in
population and growth in population density are identical). The number of cities over 10,000
is also standardized relative to the country mean. In addition, the witch trial data are
aggregated to 50-year intervals, to match the population data.
Figure 3 demonstrates the negative relationship between trials and growth graphically
(using the population density measure). The average number of trials for each growth
quantile is graphed against the level of population growth. Areas with slower-than-average
population growth had more witch trials; areas with faster-than-average population growth
had fewer witch trials. The relationship between growth and trials is statistically significant
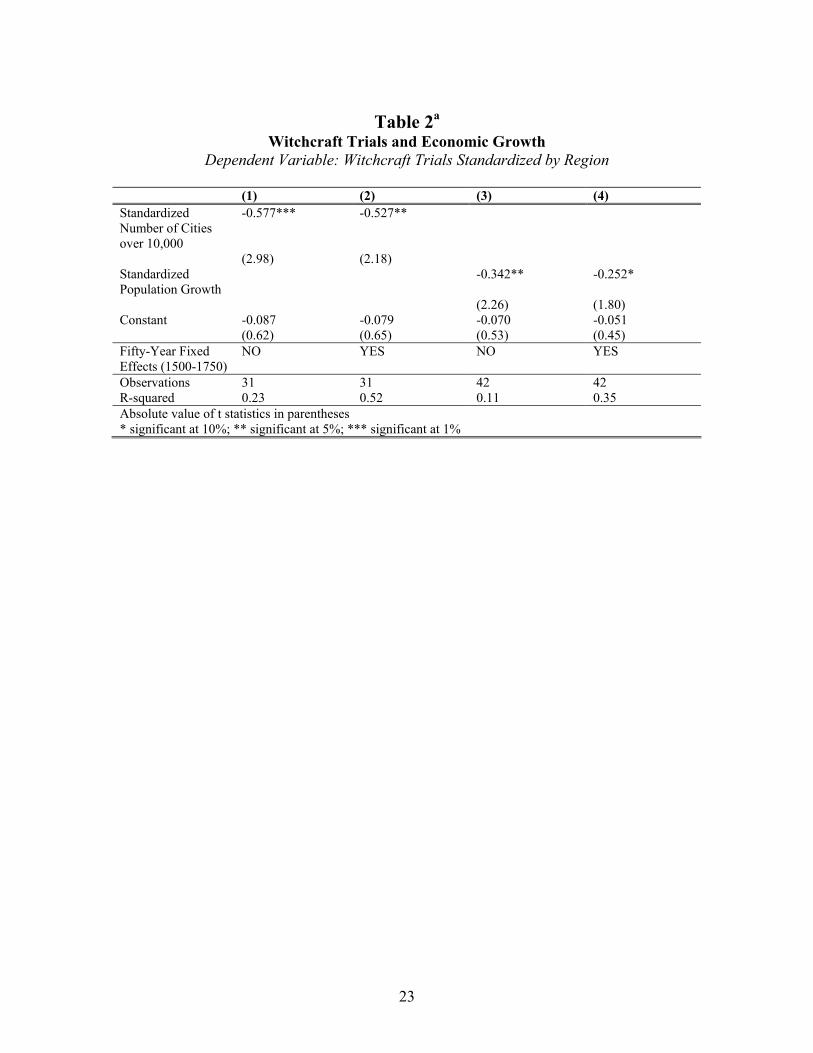
and negative in these data, despite the relatively small number of observations. Table 2 shows
this relationship, with and without controls for year (again, because both trials and growth
are standardized relative to area it is not necessary to control for region dummies.) Columns
1 and 2 show the relationship for urbanization and columns 3 and 4 for population density.
The coefficients suggest a relationship between trials and growth that is similar in magnitude
to the relationship between trials and weather, or slightly higher. Without controls for date,
11

the coefficient on urbanization is -0.57 and on population growth is -0.34, both significant at
the 5 percent level. Including dummy variables for 50-year period, the coefficient on
urbanization drops to -0.52 and is still significant at the 5 percent level, while the coefficient
on population density is -0.25 and is significant at only the 10 percent level.
Given the small sample size, the results are fairly robust. The negative relationship
between growth and trials holds for all countries in the sample except for Hungary (which has
only data on population growth, not urbanization data). During this time period, Hungary
had 200 years of stagnant population, due primarily to invasion and massacre by the Ottoman
Turks. When Hungary is excluded from the sample, the coefficients on population density in
Columns 3 and 4 are larger, and significant at 1% and 5%, respectively. It is more difficult to
draw strong conclusions about the relationship between trials and economic or population
growth than about that between trials and weather. There are many fewer observations, and
the links between economic growth and either population growth or urbanization are
obviously complex. On the other hand, the fact that we see even marginal statistical
significance with so few observations is suggestive, particularly coupled with the argument
that there is an immediate causal connection between weather, food production and economic
growth in this type of society.
Discussion and Conclusion
There is a small literature on how economic conditions may be associated with violent
scapegoating. Such papers are quite related to work on witchcraft because they, too, deal
with situations in which the victims are not personally responsible for causing an injury.
For example, in a pioneering study, Hovland and Sears (1940) explore whether
economic downturns were associated with a higher frequency of lynchings in the American
south. They find significant correlations between various measures of economic well being -
the value of land, or cotton, of economic well-being (the Ayres index) – and increases in the
12
number of black and total lynchings. Hepworth and West (1988) investigate whether the
results were driven by varying time trends in the data, by using more advanced time series
techniques to avoid this problem and they confirm the negative correlations between the
parameters, although the magnitude is somewhat smaller than suggested in the original work.
Specifically, they find a -0.21 correlation between farm value and number of black lynchings.
However, Green, Glaser and Rich (1998) have extended the time series in that paper through
the Great Depression and argued that the result does not hold when that is done. Despite
this, the earlier work is quite suggestive, and it is possible that the Depression is more of an
anomaly than the earlier time period.
In a series of papers on the causes of civil war, Collier and Hoeffler (2000, 2002) have
demonstrated that poor economic conditions are generally associated with an increased
chance of civil conflict. There are several possible explanations for the phenomenon. The
most consistent with the work presented here is that citizens blame the other ethnic groups
for deteriorated economic conditions (note that ”other ethnic groups” in this case may well
mean the government, given that political coalitions often form along ethnic lines). However,
Collier and Hoeffler argue that there are other major contributing factors that are not as
consistent with a scapegoating hypothesis - for example, rebels have fewer outside labor
market opportunities when the economy is slumping.
A final paper to mention in this discussion is the analysis by Miguel (2003) of the
relationship between witch killings and weather patterns in modern-day Tanzania. Unlike in
medieval Europe, where killings in this period were quite common and not within-family, a
Tanzanian village sees one witch killing approximately every five years, and the victims are
generally the oldest woman in the household, killed by her own family members. Miguel finds
that in years when there is extreme rainfall (either too little or too much) the number of
witch murders is significantly increased: moving from normal to severe rainfall in either
direction increases the number of witch-killings by 0.085. Miguel (2003) argues that in
13
Tanzania the killings may reflect an elimination of the least productive household member in
the face of food shortages. Although this argument is somewhat different than the
scapegoating argument presented here, they are by no means mutually exclusive. In
particular, if medieval communities felt responsible for feeding the poor older women in the
village then they may have had particular impulse to accuse them during difficult times.
Historians often base their arguments in the very specific context of relationships in a
certain place and time, an approach which can often be extraordinarily fruitful. In this spirit,
our understanding of events such as the witchcraft trials often relies on explanations revolving
around psychological factors in the population. This paper argues for mindfulness about
potential economic macro-foundations of historical events. The witchcraft trials suggest that
even when considering events and circumstances thought to be psychological or cultural, key
underlying motivations can be closely related to economic circumstances.
14

Figure 1: Temperature and Trials over Time1520-1770
-1.5
-1
-0.5
0
0.5
1
1.5
1520 1570 1620 1670 1720 1770
Stan
dard
ized
Tem
pera
ture
and
Tri
als
TrialsTemperature
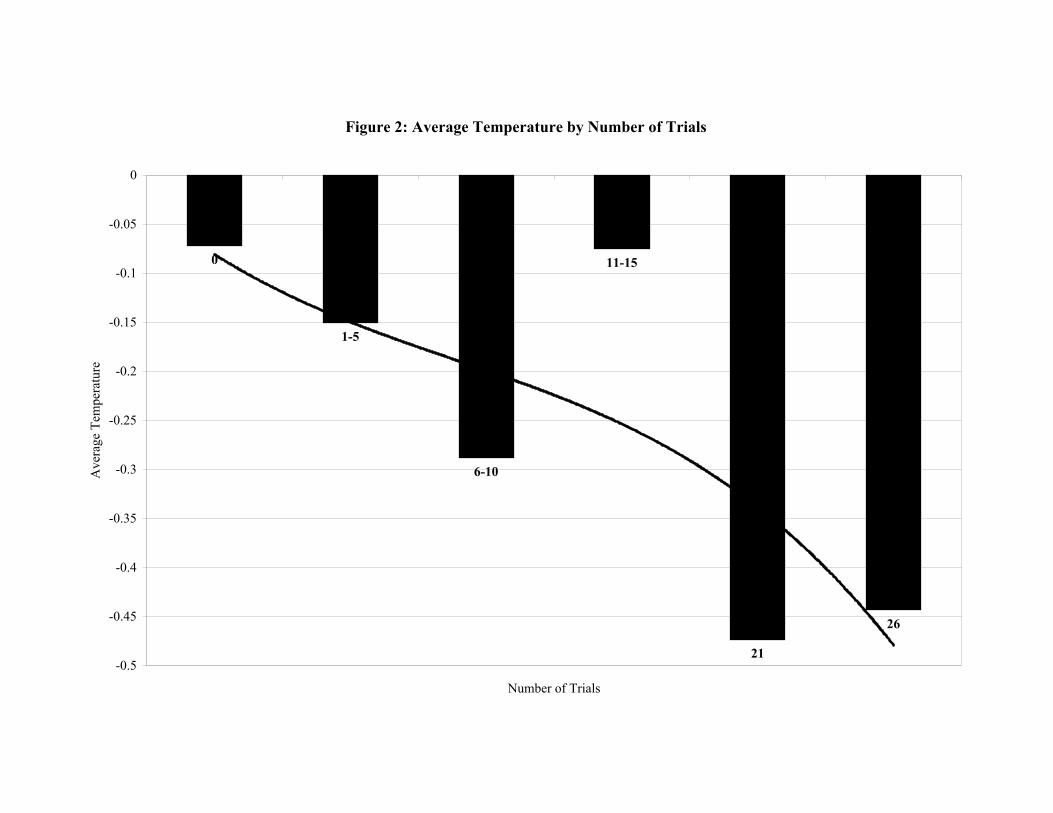
Figure 2: Average Temperature by Number of Trials
0
1-5
6-10
11-15
21
26
-0.5
-0.45
-0.4
-0.35
-0.3
-0.25
-0.2
-0.15
-0.1
-0.05
00 1-5 6-10 11-15 21 26
Number of Trials
Ave
rage
Tem
pera
ture
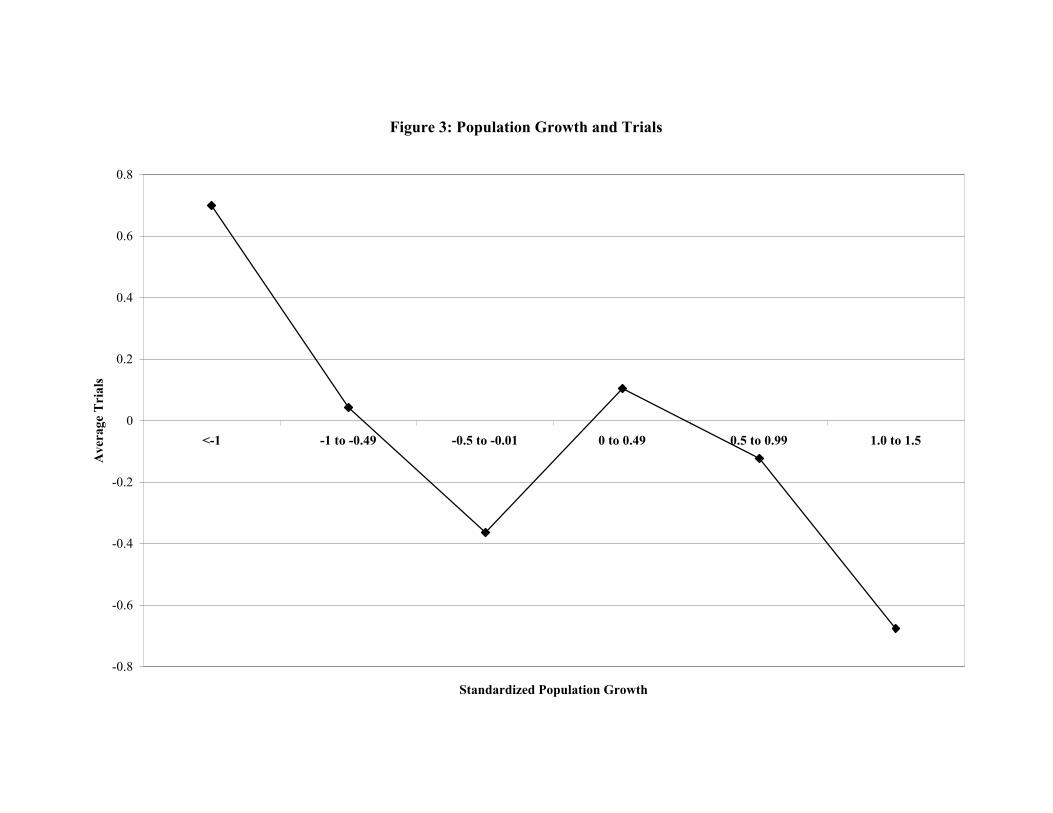
Figure 3: Population Growth and Trials
-0.8
-0.6
-0.4
-0.2
0
0.2
0.4
0.6
0.8
<-1 -1 to -0.49 -0.5 to -0.01 0 to 0.49 0.5 to 0.99 1.0 to 1.5
Standardized Population Growth
Ave
rage
Tri
als
19
References
Acemoglu, Daron, Simon Johnson, and James Robinson, “Reversal of Fortune: Geography and Institutions in the Making of the Modern World Income Distribution,” Quarterly Journal of Economics, 2002, 117(4), 1231-1294. Agobard of Leon, “Contra insulsam vulgi opinionem de grandine et tonitruis,” available at: <http://www.fordham.edu/halsall/source/Agobard-OnHailandThunder.html> Ankarloo, Bengt and Stuart Clark, eds, Ancient Greece and Rome Witchcraft and Magic in Europe, Philadelphia: University of Pennsylvania Press, 1999. Ashforth, Alan, “AIDS, Witchcraft, and the Problem of Power in Post-Apartheid South Africa,” Institute for Advanced Study, Ocassional Papers of the School of Social Science, No. 10, 2001. Behringer, Wolfgang, “Weather Hunger and Fear,” German History, 1995, 13 (1), 1–27. Behringer, Wolfgang , “Climatic Change and Witch-Hunting,” Climatic Change, 1999, 43, 335–351. Ben-Yehuda, Nachman, “The European Witch Craze of the 14th to 17th Centuries: A Sociologist’s Perspective,” American Journal of Sociology, 1980, 86 (1), 1–31. Black, George, “A Calendar of Witchcraft in Scotland, 1510-1727,” in Brian Levack, ed., Witchcraft in Scotland, New York: Garland Publishing, 1992. Collier, Paul and Anke Hoeffler, “Greed and Grievance in Civil War,” Centre for the Study of African Economies Working Paper, 2000, p. WPS0018. Collier, Paul and Anke Hoeffler,“On the Incidence of Civil War in Africa,” Journal of Conflict Resolution, 2002, 46 (1), 13–28. Davidson, H.R. Ellis, “Hostile Magic in the Icelandic Sagas,” in Venetia Newall, ed., The Witch Figure, London: Routledge, 1973. De Long, J. Bradford and Andrei Shleifer. “Princes and Merchants: European City Growth before the Industrial Revolution” Journal of Law & Economics, 1993, 36(2) 671-702. De Vries, Jan. European Urbanization 1500-1800. Cambridge: Harvard University Press, 1984. Ehrenreich, Barbara and Deirdre English, Witches, Midwives and Nurses: A History of Women Healers, New York: The Feminist Press, 1973.

20
Fagan, Brian, The Little Ice Age, New York, NY: Basic Books, 2000. Green, Donald, Jack Glaser, and A Rich, “From lynching to gay-bashing: The elusive connection between economic conditions and hate crime,” Journal of Personality and Social Psychology, 1998, 75, 82–92. Heikkinen, Antero and Timo Kervinen, “Finland: The Male Domination,” in Bengt Ankarloo and Gustav Henningsen, eds., Early Modern European Witchcraft, Oxford: Oxford University Press, 1990. Hepworth, Joseph and Stephen West, “Lynchings and the Economy: A Time-Series Reanalysis of Hovland and Sears (1940),” Journal of Personality and Social Psychology, 1988, 55 (2), 239–247. Hovland, C. and R. Sears, “Minor studies of Aggression: Correlation of Lynchings with Economic Indices,” Journal of Psychology, 1940, 9, 301–310. Klaniczay, Gabor, “Hungary: The Accusations and the Universe of Popular Magic,” in Bengt Ankarloo and Gustav Henningsen, eds., Early Modern European Witchcraft, Oxford: Oxford University Press, 1990. Kors, Alan and Edward Peters, eds, Witchcraft in Europe, 400-1700, Philadelphia: University of Pennsylvania Press, 2001. Lamb, H.H., Climate, History and the Modern World, London: Routledge, 1982. Macfarlane, Alan, Witchcraft in Tudor and Stuart England, New York, NY: Harper and Row, 1979. Madar, Maia, “Estonia 1: Werewolves and Poisoners,” in Bengt Ankarloo and Gustav Henningsen, eds., Early Modern European Witchcraft, Oxford: Oxford University Press, 1990. McEvedy, Colin and Richard Jones, Atlas of World Population History, New York: Facts on File, 1978. Midelfort, Erik, Witch Hunting in Southwestern Germany, 1562-1684, Stanford, California: Stanford University Press, 1972. Miguel, Edward, “Poverty and Witch Killing,” BREAD Working Paper #41, 2003. Monter, E. William, Witchcraft in France and Switzerland, Ithica, NY: Cornell University Press, 1976.
21
Monter, E. William, “Patterns of Witchcraft in the Jura,” in “Witch Hunting in Continental Europe: Local and Regional Studies,” New York, NY: Garland Publications, 1992. Pfister, Christian, “Historical Weather Indices from Switzerland. IGBP PAGES/World Data Center-A for Paleoclimatology Data Contribution Series, No. 93-027,” Technical Report, NOAA/NGDC Paleoclimatology Program, Boulder, CO. 1993. R´acz, Lajos, “The Climate of Hungary during the Late Maunder Minimum (1675-1715),” in Burkhard Frenzel, ed., Climatic Trends and Anomalies in Europe 1675-1715, New York: Gustav Fischer Verlug, 1994. Ross, Eric, “Syphilis, Misogyny and Witchcraft in 16th-Century Europe,” Current Anthropology, 1995, 36 (2), 333–337. Russell, Jeffrey Burton, Witchcraft in the Middle Ages, Ithica: Cornell University Press, 1972. Sharpe, James, Instruments of Darkness: Witchcraft in England 1550-1750, New York: Penguin, 1996. Soman, Alfred, “The Parlement of Paris and the Great Witch Hunt (1565-1640),” Sixteenth Century Journal, 1978, 9 (2), 30–44. Summers, Montague, The Malleus Maleficarum of Heinrich Kramer and James Sprenger, New York: Dover, 1971.
22
Table 1a Witchcraft Trials and Temperature
Dependent Variable: Witchcraft Trials Standardized by Region
(1) (2) (3) (4) Standardized Combined Index
-0.212*** -0.206**
(2.59) (2.32) Standardized Winter Severity Only
-0.179** -0.292***
(1.96) (2.84) Date 0.096 0.233*** (1.96) (3.43) Date-Squared -0.003 -0.011*** (1.43) (3.45) Constant -0.645** -1.037*** -0.019 -0.059 (2.39) (3.16) (0.26) (0.71) Decade Fixed Effects (1520-1770):
NO NO YES YES
Observations 170 128 170 128 R-squared 0.10 0.15 0.24 0.28 Absolute value of t-statistics in parentheses * significant at 10%; ** significant at 5%; *** significant at 1%
23
Table 2a
Witchcraft Trials and Economic Growth Dependent Variable: Witchcraft Trials Standardized by Region
(1) (2) (3) (4) Standardized Number of Cities over 10,000
-0.577*** -0.527**
(2.98) (2.18) Standardized Population Growth
-0.342** -0.252*
(2.26) (1.80) Constant -0.087 -0.079 -0.070 -0.051 (0.62) (0.65) (0.53) (0.45) Fifty-Year Fixed Effects (1500-1750)
NO YES NO YES
Observations 31 31 42 42 R-squared 0.23 0.52 0.11 0.35 Absolute value of t statistics in parentheses * significant at 10%; ** significant at 5%; *** significant at 1%
24
Appendix
The data on number of trials was collected from a number of different sources, which are enumerated in the table below.
Country Trials or Deaths Years Source Bishopric of Basel Trials only 1560-1680 Monter (1992)
Essex Trials only 1560-1680 Macfarlane (1979) Estonia Both 1520-1730 Madar (1990) Finland Both 1520-1700 Heikkinen and Kervinen (1990)
Franche-Compte Both 1590-1670 Monter (1976) Geneva (decadal and yearly) Both 1520-1690 Monter (1976)
Home Circuit Trials only 1560-1710 Sharpe (1996) Hungary Both 1520-1770 Klaniczay (1990)
Neuchatel Trials only 1560-1680 Monter (1976) Parlement of Paris Both 1560-1640 Soman (1978)
Scotland Trials only 1510-1720 Black (1992) This paper uses two climate measures: a mixed index of temperature and winter severity, and an index including only winter severity. For the multi-country index I used several measures of climate from different sources. I did not have individual climate from each country used, so for some countries the weather from the closest country for which there was data was used. The table below shows the data that was used for the combined index and the winter severity index for each of the 11 areas.
The source for yearly temperature data for Geneva is Pfister (1993).
Country Combined Index (source) Winter Severity Index (source) Bishopric of Basel Swiss Temp. Index (Lamb 1982) German Winter (Lamb 1982)
Essex England Winter Severity (Lamb 1982) England Winter (Lamb 1982) Estonia Russian Winter (Lamb 1982) Russian Winter (Lamb 1982) Finland Russian Winter (Lamb 1982) Russian Winter (Lamb 1982)
Franche-Compte Swiss Temp. Index (Lamb 1982) Not Used Geneva Swiss Temp. Index (Lamb 1982) German Winter (Lamb 1982)
Home Circuit England Winter (Lamb 1982) England Winter (Lamb 1982) Hungary Hungarian Temp. Index (R´acz 1994) Not Used
Neuchatel Swiss Temp. Index (Lamb 1982) German Winter (Lamb 1982) Parlement of Paris Swiss Temp. Index (Lamb 1982) Not Used
Scotland England Winter (Lamb 1982) England Winter (Lamb 1982)