with a buy rating wts: turnaround underway, growth...
TRANSCRIPT

Nathan Jones, CFA | (303) 291-5208 | [email protected] M. Farley | (303) 291-5233 | [email protected] Equity Trading Desk | (800) 424-8870
September 18, 2017 Water Technologies
Watts Water Technologies, Inc.WTS – NYSE
BUY
INITIATION OF COVERAGEWTS: Turnaround Underway, Growth Ahead: Initiating CoverageWith A Buy Rating
.Financial Summary
Changes Previous Current
Rating BuyTarget Price $72.00FY17E Rev (net) — $1.47BFY18E Rev (net) — $1.52BFY17E EPS (net) — $3.02FY18E EPS (net) — $3.25
Price ( 09/15/17 ): $64.0052-Week Range: $71 - $58Market Cap.(mm): 2,208.0Shr.O/S-Diluted (mm): 34.5Enterprise Val. (mm): $2,539.0Avg Daily Vol (3 Mo): 106,002LT Debt/Total Cap.: 40.8%Dividend / Yield: $0.76 / 1.2%
EPS (net) 2016A 2017E 2018EQ1 $0.57 $0.65A $NEQ2 $0.75 $0.83A $NEQ3 $0.71 $0.80 $NEQ4 $0.64 $0.74 $NEFY (Dec) $2.67A $3.02 $3.25P/E 24.0x 21.2x 19.7x
Rev (net) 2016A 2017E 2018EFY (Dec) $1.40B $1.47B $1.52BEV/Revenue 1.8x 1.7x 1.7x
Price Performance
75
70
65
60
55Nov-16 Jan-17 Mar-17 May-17 Jul-17 Sep-17
0.7
0.6
0.5
0.4
0.3
0.2
0.1
0
Price Volume
Volume (Mil.) Price (USD)WTS
SummaryWe are initiating coverage of Watts Water Technologies, Inc. with a Buy rating on the shares.Watts Water Technologies, Inc. is a leading supplier of products and solutions that conservewater and manage the flow of fluids and energy into, through, and out of buildings in theresidential and commercial markets of the Americas, Europe, Asia-Pacific, Middle East andAfrica. For over 140 years, Watts Water Technologies, Inc. has designed and produced valvesystems that safeguard and regulate water systems, energy efficient heating and hydronicsystems, drainage systems and water filtration technology that helps conserve water.
Key PointsWatts Water Technologies, Inc. operates in three geographic segments: Americas, Europe, andAPMEA. Each of these segments sells similar products.
Watts Water Technologies, Inc. is a manufacturer of residential and commercial flow controlproducts, HVAC and gas products, drainage and water re-use products, and water qualityproducts. The company sells through four primary channels including Wholesale, OEM,Specialty, and DIY chains, and has a diverse set of end market exposure including Agriculture& Irrigation, Healthcare, Manufacturing & Industrial, Residential Housing, Food-service &Hospitality, Commercial & Educational, Marine, and Municipal Waterworks.
As detailed in the following pages, we believe Watts Water Technologies, Inc. is in the earlystages of an operational turnaround with significant opportunities on multiple fronts to improveboth growth and profitability. Watts Water Technologies, Inc. has a long way to go to achieveacceptable operational performance including: improving the process control and capabilitiesout of its foundry to increase throughput and reduce the cost of poor quality; value stream mapand improve material flow through, reduce waste, and increase capacity; focus on talent witha strong leader in CEO Bob Pagano reshaping the company; and focusing on additional leanopportunities.
Watts Water Technologies is poised to pursue profitable growth in 2018. We believe incrementalorganic growth will drop through in the 35% range, before any incremental investments, whichprovides the potential for strong operational leverage.
WTS shares look attractive on both an absolute and relative basis. On an absolute basis, WTSshares are reasonably priced by historical standards (relative to an expensive industrial space)with shares currently trading at 19.7x 2018E EPS vs. a 5- and 10-year average of 18.8x and16.6x. Over the last 5 and 10 years WTS shares have traded at a 4.3x and 3.3x premium to theS&P 500 vs. a current premium of 2.5x on 2018 estimates, making the shares look attractiveon a relative basis, particularly with what we view as strong earnings growth potential. Withimproving market prospects, margin expansion potential, and a solid balance sheet (1.5x netdebt to 2017E EBITDA) we think WTS shares represent a solid investment case at this price.
We are initiating coverage of Watts Water Technologies, Inc. with a Buy rating on the sharesand a one-year target price of $72, which is based on 22x our 2018E EPS. Our three-year targetprice of $90 is based on 22x our 2020E EPS plus net cash.
All relevant disclosures and certifications appear on pages 26 - 28 of this report.
Stifel does and seeks to do business with companies covered in its research reports. As a result, investors should be aware thatthe firm may have a conflict of interest that could affect the objectivity of this report. Investors should consider this report asonly a single factor in making their investment decision.

Investment ThesisWatts Water Technologies, Inc. is in the early stages of an operational turnaround with significant opportunities on multiple fronts to improveboth growth and profitability. Additionally, shares look attractive on both an absolute and relative basis especially with what we view as strongearnings growth potential.
Investment Rationale
We are initiating coverage of Watts Water Technologies (WTS) with a Buy rating and a one-year target price of $72, which is based on22x Watts Water Technologies 2018 EPS estimate of $3.25. WTS shares are currently valued at 11.2x 2017E adjusted EBITDA of $226.9million, which is equivalent to 19.7x 2018E EPS.
We view Watts Water Technologies as being in the early stages of an operational turnaround with significant opportunities on multiple frontsto improve both growth and profitability. While the early steps of facility consolidations are largely behind the company our visit to the Franklinfacility (generates one-third of company revenue) demonstrated to us that the company clearly has a long way to go to achieve acceptable,let alone top tier, operating performance. As we walked the facility even our rudimentary education on operational excellence could identifymultiple areas of waste and inefficiency with poor material flow and plant layout along with some outdated machinery. Neither our hostnor upper management disagreed with most of our assertions about the performance of the operations and we were impressed that everyconcern we raised during our visit met not with excuses but with detailed discussions of the plans to solve the problems. As we detail belowwe view Watts operational efficiency as currently presenting significant improvement opportunities but were impressed with management’s,from the corner office to the GM in Franklin, plans to significantly improve the operations and this is the crux of our investment thesis forWTS shares. We expect operational improvements to demonstrate the following benefits over the next several years:
• Improving the process control and capabilities out of the foundry should increase the predictability of the output which in turn shouldincrease throughput and reduce the cost of poor quality.
• Value stream mapping and improving the material flow through the facility should increase throughput, reduce waste (including wastedtime and handling), increase capacity by reducing the footprint and freeing up space for additional equipment and/or further facilityconsolidations and improving cash flow by reducing the need for future capex. The company believes that this initiative alone could freeup 15%-20% of floor space in Franklin, reduce lead times by 50% and gain 20% in productivity.
• Focus on talent. CEO Bob Pagano, who has been at Watts for about 3 years having come from running ITT’s Industrial Process business,noted that when he arrived the company did not have the right people to lead a turnaround, did not have the right talent to implement alean transformation, didn’t have an effective marketing organization and didn’t have a global sourcing team. Of the top 120 leaders in thecompany fully half are new under Pagano’s leadership. Mr. Pagano now believes the company has the right talent in place but we notethat many of the improvement initiatives are still ahead of the company (e.g. value stream mapping Franklin, global sourcing to be set upin the next 12 months) which we believe should capture meaningful value over the next several years.
• CEO Bob Pagano noted that the Franklin facility was “about average” in terms of lean opportunities implying that the remainder of thefacilities have equivalent operational improvement opportunities.
Growth has been muted for several years with organic growth averaging 1.9% over the last seven years and less than 1% since the newteam was put in place, underperforming the markets during those periods. Mr. Pagano noted to us that he has deliberately stunted growthat the company since his arrival in order to build the foundation for profitable growth, as well as voluntarily exiting low profit businesses andrationalizing product lines. Mr. Pagano believes the foundation will be in place for the company to begin actively pursuing growth in 2018and his main focus is now around driving profitable growth at the company. With gross margins slightly over 40% and significant availablecapacity (both now and in the future as operational improvements take hold) we believe incremental growth will drop through in the 35%-40%range before any incremental investments (of which there are likely to be both operational and growth investments ahead) which providesthe potential for strong operating leverage.
Watts Water Technologies operates in generally stable markets with 65% of revenue generated from its extensive installed base and 35%coming from new builds, primarily levered to residential and non-residential construction. Over cycles we believe the company's marketsare low to mid-single digit growers which the company could eclipse over the next several years as focus turns to growth. The company istargeting new product introductions with a focus on innovation and increased geographic penetration to under-served markets.
On an absolute basis WTS shares are reasonably priced by historical standards (relative to an expensive industrials space) with sharescurrently trading at 19.7x 2018E EPS vs. a 5- and 10-year average of 18.8x and 16.6x. Over the last 5 and 10 years WTS shares have tradedat a 4.3x and 3.3x premium to the S&P 500 vs. a current premium of 2.5x on 2018 estimates, making the shares look attractive on a relativebasis, particularly with what we view as strong earnings growth potential. With improving market prospects, margin expansion potential, anda solid balance sheet (1.5x net debt to 2017E EBITDA) we think WTS shares represent a solid investment case at this price.
Watts Water Technologies, Inc.WTS – NYSE
Water TechnologiesInitiation of Coverage
September 18, 2017
2

Investment Risks Economic cycles, particularly those involving reduced levels of commercial and residential starts and remodeling, may have adverse effects on WTS’ revenues and operating results. WTS has experienced and expects to continue to experience fluctuations in revenues and operating results due to economic and business cycles. The businesses of most of its customers, particularly plumbing and heating wholesalers and OEM manufacturers, are cyclical. Therefore, the level of its business activity has been cyclical, fluctuating with economic cycles. An economic downturn may also affect the financial stability of its customers, which could affect their ability to pay amounts owed to their vendors, including WTS. WTS also believes its level of business activity is influenced by commercial and residential starts and renovation and remodeling, which are, in turn, heavily influenced by interest rates, consumer debt levels, changes in disposable income, employment growth and consumer confidence. Credit market conditions may prevent commercial and residential builders or developers from obtaining the necessary capital to continue existing projects or to start new projects. This may result in the delay or cancellation of orders from its customers or potential customers and may adversely affect its revenues and its ability to manage inventory levels, collect customer receivables and maintain profitability. If economic conditions worsen in the future or if economic recovery were to dissipate, its
revenues and profits could decrease or trigger additional goodwill, indefinite‑lived intangible assets, or long‑lived asset impairments and
could have a material effect on its financial condition and results of operations. Changes in the costs of raw materials could reduce WTS’ profit margins. Reductions or interruptions in the supply of components or finished goods from international sources could adversely affect its ability to meet its customer delivery commitments. WTS requires substantial amounts of raw materials, including bronze, brass, cast iron, stainless steel and plastic, and substantially all of the raw materials it requires are purchased from outside sources. The costs of raw materials may be subject to change due to, among other things, interruptions in production by suppliers and changes in exchange rates and worldwide price and demand levels. WTS typically
does not enter into long‑term supply agreements. WTS’ inability to obtain supplies of raw materials for its products at favorable costs
could have a material adverse effect on its business, financial condition or results of operations by decreasing its profit margins. The commodity markets have experienced tremendous volatility over the past several years, particularly copper. Should commodity costs increase substantially, WTS may not be able to recover such costs, through selling price increases to its customers or other product cost reductions, which would have a negative effect on its financial results. If commodity costs decline, WTS may experience pressure from customers to reduce its selling prices. Additionally, WTS continues to purchase increased levels of components and finished goods from
international sources. In limited cases, these components or finished goods are single‑sourced. The availability of components and
finished goods from international sources could be adversely impacted by, among other things, interruptions in production by suppliers, suppliers’ allocations to other purchasers, and new laws, tariffs, or regulations. Changes in regulations or standards could adversely affect WTS’ business. WTS products and business are subject to a wide var iety of statutory, regulatory and industry standards and requirements. A significant change to regulatory requirements, whether federal, foreign, state or local, or to industry standards, could substantially increase manufacturing costs, impact the size and timing of demand for its products, or put it at a competitive disadvantage, any of which could harm its business and have a material adverse effect on its financial condition, results of operations and cash flow. WTS is currently a decentralized company, which presents certain risks. WTS is currently a decentralized company, which sometimes
places significant control and decision‑making powers in the hands of local management. This presents various risks such as the risk of
being slower to identify or react to problems affecting a key business. Additionally, WTS is implementing in a phased approach for a
company‑wide initiative to standardize and upgrade its enterprise resource planning (ERP) systems. This initiative could be more
challenging and costly to implement because divergent legacy systems currently exist. Further, if the ERP updates are not successful, WTS could incur substantial business interruption, including its ability to perform routine business transactions, which could have a material adverse effect on its financial results. Conversion and sale of a significant number of shares of WTS Class B common stock could adversely affect the market price of its Class A common stock. As of January 27, 2017, there were outstanding 27,811,140 shares of WTS Class A common stock and 6,379,290 shares of WTS Class B common stock. Shares of its Class B common stock may be converted into Class A common stock at any time on a one for one basis. Under the terms of a registration rights agreement with respect to outstanding shares of WTS Class B common stock, the holders of WTS Class B common stock have rights with respect to the registration of the underlying Class A common stock. Under these registration rights, the holders of Class B common stock may require, on up to two occasions that WTS register their shares
for public resale. If WTS is eligible to use Form S‑3 or a similar short‑form registration statement, the holders of Class B common stock
may require that it register their shares for public resale up to two times per year. If WTS elects to register any shares of Class A common stock for any public offering, the holders of Class B common stock are entitled to include shares of Class A common stock into which such shares of Class B common stock may be converted in such registration. However, WTS may reduce the number of shares proposed to be registered in view of market conditions. WTS will pay all expenses in connection with any registration, other than underwriting discounts and commissions. If all of the available registered shares are sold into the public market the trading price of WTS Class A common stock could decline. Please reference Watts Water Technologies, Inc.’s latest Form 10-K for a complete list of investment risks.
Watts Water Technologies, Inc.WTS – NYSE
Water TechnologiesInitiation of Coverage
September 18, 2017
3
Company Overview
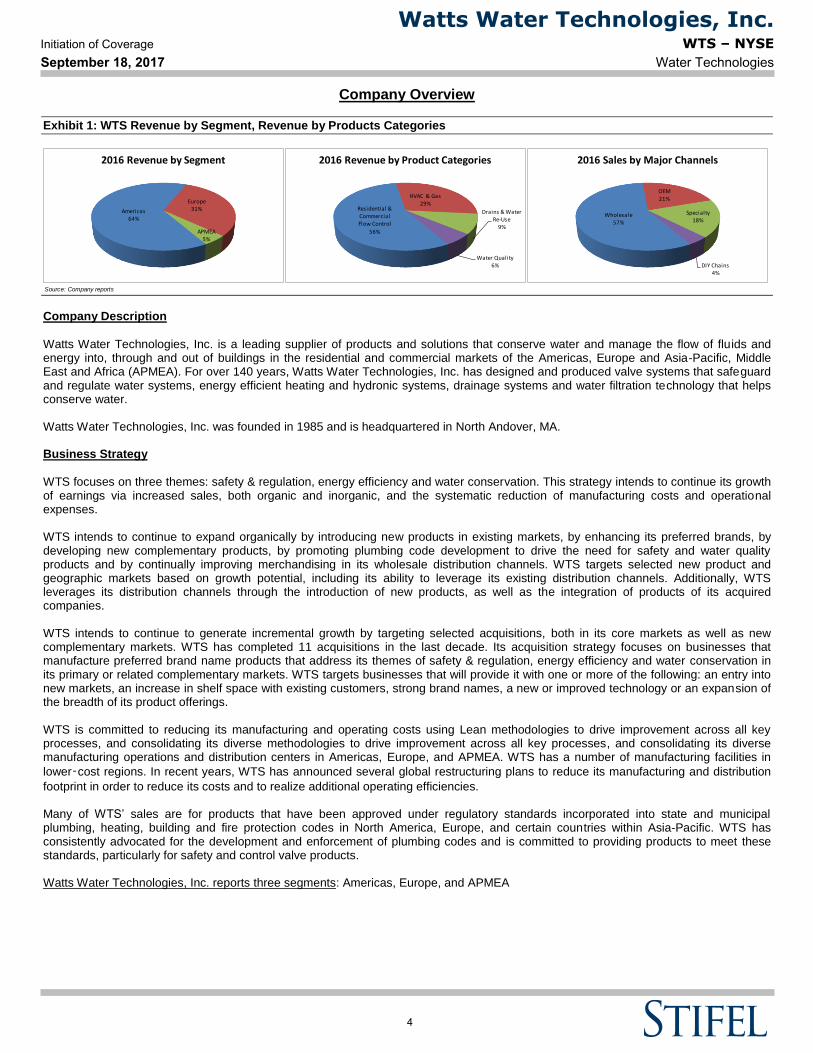
Exhibit 1: WTS Revenue by Segment, Revenue by Products Categories
Company Description
Watts Water Technologies, Inc. is a leading supplier of products and solutions that conserve water and manage the flow of fluids and energy into, through and out of buildings in the residential and commercial markets of the Americas, Europe and Asia-Pacific, Middle East and Africa (APMEA). For over 140 years, Watts Water Technologies, Inc. has designed and produced valve systems that safeguard and regulate water systems, energy efficient heating and hydronic systems, drainage systems and water filtration technology that helps conserve water. Watts Water Technologies, Inc. was founded in 1985 and is headquartered in North Andover, MA. Business Strategy
WTS focuses on three themes: safety & regulation, energy efficiency and water conservation. This strategy intends to continue its growth of earnings via increased sales, both organic and inorganic, and the systematic reduction of manufacturing costs and operational expenses. WTS intends to continue to expand organically by introducing new products in existing markets, by enhancing its preferred brands, by developing new complementary products, by promoting plumbing code development to drive the need for safety and water quality products and by continually improving merchandising in its wholesale distribution channels. WTS targets selected new product and geographic markets based on growth potential, including its ability to leverage its existing distribution channels. Additionally, WTS leverages its distribution channels through the introduction of new products, as well as the integration of products of its acquired companies. WTS intends to continue to generate incremental growth by targeting selected acquisitions, both in its core markets as well as new complementary markets. WTS has completed 11 acquisitions in the last decade. Its acquisition strategy focuses on businesses that manufacture preferred brand name products that address its themes of safety & regulation, energy efficiency and water conservation in its primary or related complementary markets. WTS targets businesses that will provide it with one or more of the following: an entry into new markets, an increase in shelf space with existing customers, strong brand names, a new or improved technology or an expansion of the breadth of its product offerings. WTS is committed to reducing its manufacturing and operating costs using Lean methodologies to drive improvement across all key processes, and consolidating its diverse methodologies to drive improvement across all key processes, and consolidating its diverse manufacturing operations and distribution centers in Americas, Europe, and APMEA. WTS has a number of manufacturing facilities in
lower‑cost regions. In recent years, WTS has announced several global restructuring plans to reduce its manufacturing and distribution
footprint in order to reduce its costs and to realize additional operating efficiencies. Many of WTS’ sales are for products that have been approved under regulatory standards incorporated into state and municipal plumbing, heating, building and fire protection codes in North America, Europe, and certain countries within Asia-Pacific. WTS has consistently advocated for the development and enforcement of plumbing codes and is committed to providing products to meet these standards, particularly for safety and control valve products. Watts Water Technologies, Inc. reports three segments: Americas, Europe, and APMEA
Source: Company reports
Americas64%
Europe31%
APMEA5%
2016 Revenue by Segment
Residential & Commercial Flow Control
56%
HVAC & Gas29%
Drains & Water Re-Use
9%
Water Quality6%
2016 Revenue by Product Categories
Wholesale57%
OEM21%
Specialty18%
DIY Chains4%
2016 Sales by Major Channels
Watts Water Technologies, Inc.WTS – NYSE
Water TechnologiesInitiation of Coverage
September 18, 2017
4

Segments Overview Americas – 64% of 2016 Sales Europe – 31% of 2016 Sales APMEA – 5% of 2016 Sales
Watts Water Technologies, Inc. operates in three geographic segments: Americas, Europe, and APMEA. Each of these segments sells similar products. Competitive Dynamics and Outlook
Major Products:
Residential & Commercial Flow Control Products: Includes products typically sold into plumbing and hot water applications such as backflow preventers, water pressure regulators, temperature and pressure relief valves, and thermostatic mixing valves.
HVAC and Gas Products: includes commercial high‑efficiency boilers, water heaters and heating solutions, hydronic and
electric heating systems for under‑floor radiant applications, custom heat and hot water solutions, hydronic pump groups for
boiler manufacturers and alternative energy control packages, and flexible stainless steel connectors for natural and liquid propane gas in commercial food service and residential applications.
Drainage and Water Re-Use Products: Includes drainage products and engineered rain water harvesting solutions for commercial, industrial, marine and residential applications.
Water Quality Products: Includes point‑of‑use and point‑of‑entry water filtration, conditioning and scale prevention systems for
both commercial and residential applications. Major Channels:
Wholesale: Primarily serves the plumbing, HVAC, irrigation, and waterworks markets. o ~57% of sales in 2016 were to wholesale distributors for commercial and residential applications.
OEM: Serves a wide range of industries with its manufactured products. o ~21% of sales in 2016. o In the Americas, its typical OEM customers are water heater manufacturers and equipment and water systems
manufacturers needing flow control devices and other products. o In EMEA, its products are primarily sold to boiler manufacturers and radiant system manufacturers. o In Asia-Pacific, its products are primarily sold to boiler, water heater and bath manufacturers, including manufacturers
of faucet and shower products.
Specialty: Primarily serves plumbing professionals. o ~18% of sales in 2016. o Sales are related to high-efficiency boilers and water heaters, water filtration and conditioning products, specialty floor
and tile products, and food service products.
DIY Chains: Primarily serves “do-it-yourselfers”. o ~4% of sales in 2016 sold to DIY chains.
Markets: Agriculture & Irrigation, Healthcare, Manufacturing & Industrial, Residential Housing, Foodservice & Hospitality, Commercial & Educational, Marine, Municipal Waterworks. Market Position: Undisclosed Market Share: Undisclosed Major Competitors: Rexnord (Water Management division – Zurn/Wilkens brands for plumbing and drains), Brasscraft (division of Masco) on gas connectors, Conbraco (division of Aalberts for plumbing valves), Viega, Rehau and Uponor for radiant heating, Honeywell (controls), ACO, JR Smith and George Fischer for drains, Cla-Val and Cash Acme in plumbing valves, Caleffi, Oventrop and Danfoss in Europe HVAC/plumbing, Lochinvar, Fulton and Hydrotherm in boilers. Key Brands: Watts, AERCO, Ames Fire & Waterworks, Blücher, Brae, Brae, Dormont Manufacturing Company, Febco, HF Scientific, Inc., Mueller Steam Specialty, Orion Fittings, Powers, Premier, Sea Tech, Inc., SunTouch, Tekmar Control Systems Ltd., Watts Radiant Outlook: Core residential and non-residential markets should grow low single digits or better in 2018. Long-term Expected Organic Growth Rate: GDP
Watts Water Technologies, Inc.WTS – NYSE
Water TechnologiesInitiation of Coverage
September 18, 2017
5

End Market Drivers
Exhibit 2: U.S. Construction and ABI
The value of total (annualized, seasonally adjusted) nonresidential construction put-in-place during July 2017 in the U.S. was $688.4 billion, a -4.3% y/y decrease. Of the 16 construction spending categories, four posted y/y increases and two posted m/m increases. In July, the Commercial category posted the strongest y/y improvement at 7.8%, which was lower than the previous 20.8% y/y growth in June. The Amusement and Recreation and Public Safety categories also were positive at 2.7% and 2.6% y/y growth, respectively. July private nonresidential spending decreased 3.6% y/y and was down 1.9% m/m, and total public nonresidential spending decreased by 5.5% y/y and was down 1.4% m/m. The June ABI posted a growth score of 54.2 vs. 53.0 in May, reflecting strong levels of billings activity. The New Projects Inquiry Index score of 58.6 again reflected robust project interest, and the Design Contracts Index remained positive with a score of 53.7 The Stifel Industrial team forecast of nonresidential construction currently reflects 6.2% core growth in 2017 versus 5.6% growth in 2016 and 8.6% growth in 2015. Our research suggests a peak in activity, excluding power and manufacturing, in mid-2019 or 2020.
Exhibit 3: Total Water and Sewer Construction
Total Public Water and Sewer Construction was down 12.1% y/y and down 1.2% m/m to $29.3 billion. Our interpretation of the data above is that while water and sewer construction spending is currently below trend, this likely represents a period of consolidation following a period of overbuilding during the U.S. housing bubble during 2005-2010. The U.S. has been on a consistent, long-term growth trajectory for many decades (~5%-6% over the past ~50 years). We would expect the long-term growth rate
Source: U.S. Census Bureau Source: The American Institute of Architects
0
200
400
600
800
1,000
1,200
1,400
U.S. Construction ($ billions)
Total Construction Total Private Construction
Total Public Construction Total Non Residential Construction
Total Residential Construction
30
35
40
45
50
55
60
65
70
Architectural Billings Index
Billings Inquiries
Source: U.S. Census Bureau
$0
$5
$10
$15
$20
$25
$30
$35
$40
$45
$50
bill
ion
s
Total Water and Sewer Construction
-40%
-20%
0%
20%
40%
60%
80%
Total Water and Sewer Construction y/y % change
Watts Water Technologies, Inc.WTS – NYSE
Water TechnologiesInitiation of Coverage
September 18, 2017
6

in water and sewer construction to return to trend to the same extent that the underlying growth in U.S. GDP returns to its long-term trend. Watts’ offers a wide range of solutions to Municipal Waterworks including backflow assemblies designed to prevent the reverse flow of polluted water into public water supplies, control valves, and water quality monitoring instrumentation designed to control and monitor pH, chlorine, and contaminants in drinking water supplies.
Exhibit 4: U.S. Commercial Non-Res Construction
Total Commercial non-res construction decreased 4.6% m/m and grew 7.8% y/y to $82.4 billion in July 2017. We expect high single to low double digit growth in U.S. commercial nonresidential construction in 2017. Watts offers a range of solutions for hotels, restaurants, and beverage service providers, including radiant floor heating systems for hotel bathrooms; water filtration systems designed to ensure high-quality, great-tasting water for potable use; faucets, sinks, and rinse devices designed to optimize performance and reduce maintenance downtime in commercial kitchens; and gas connection products designed to ensure the safe delivery and use of gas in kitchen settings. Watts serves Commercial and Educational facilities from office buildings to colleges. Watts’ solutions include anti-scale systems requiring minimal maintenance when compared to more traditional water softeners; rainwater harvesting systems for reducing water use in irrigation, toilet, and laundry operations; and HVAC control systems for centralized air conditioning & heating operations.
Exhibit 5: Healthcare Non-Res Construction Spending
Watts’ solutions to the healthcare industry include water tempering devices designed to prevent the spread of legionella, piping for safe disposal of chemicals, water filtration systems for ensuring water quality, snow melting systems for rooftop helicopter landing pads, and fully ADA compliant drains for hospital shower stalls. The value of total (annualized, seasonally adjusted) nonresidential Healthcare construction put-in-place during July 2017 was $38.5 billion, a 2.1% sequential decrease and a 0.6% y/y decrease.
Source: U.S. Census Bureau
$0
$10
$20
$30
$40
$50
$60
$70
$80
$90
$100
bill
ion
s
Commercial Non-Res Construction
-50%
-40%
-30%
-20%
-10%
0%
10%
20%
30%
Commercial Non-Res Construction y/y % change
Source: U.S. Census Bureau
$0
$10
$20
$30
$40
$50
$60
bill
ion
s
Healthcare Non-Res Construction
-25%
-20%
-15%
-10%
-5%
0%
5%
10%
15%
20%
25%
Healthcare Non-Res Construction y/y % change
Watts Water Technologies, Inc.WTS – NYSE
Water TechnologiesInitiation of Coverage
September 18, 2017
7
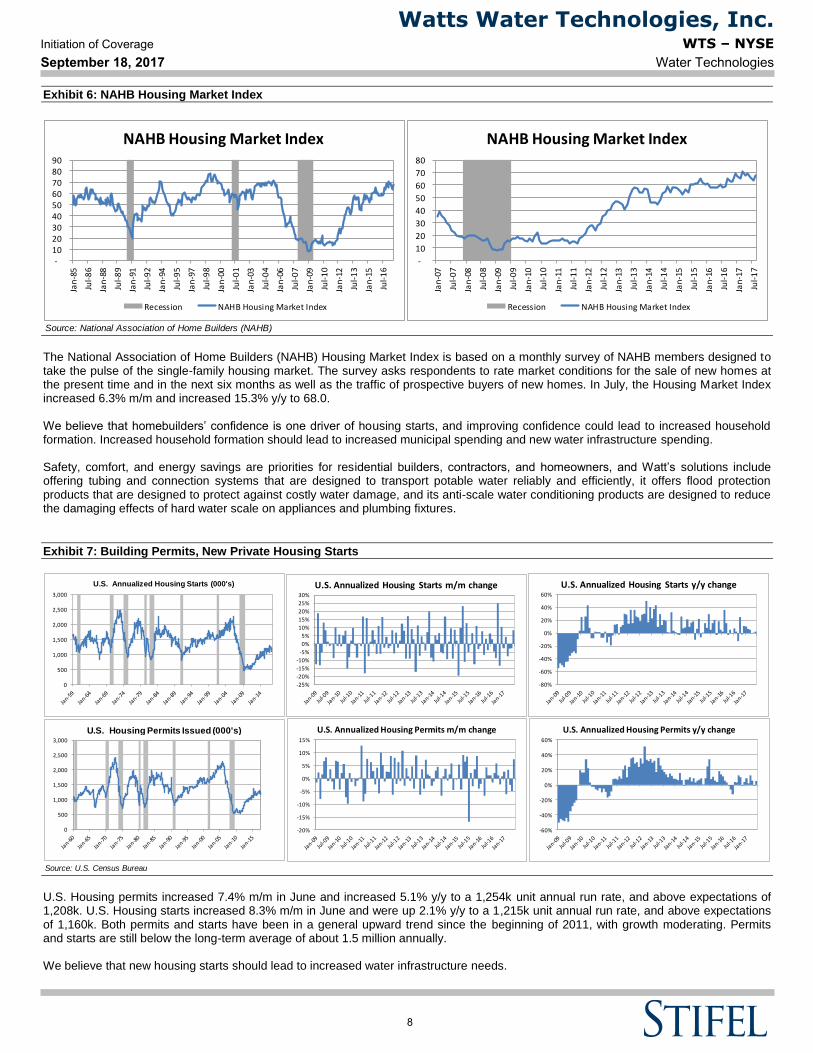
Exhibit 6: NAHB Housing Market Index
The National Association of Home Builders (NAHB) Housing Market Index is based on a monthly survey of NAHB members designed to take the pulse of the single-family housing market. The survey asks respondents to rate market conditions for the sale of new homes at the present time and in the next six months as well as the traffic of prospective buyers of new homes. In July, the Housing Market Index increased 6.3% m/m and increased 15.3% y/y to 68.0. We believe that homebuilders’ confidence is one driver of housing starts, and improving confidence could lead to increased household formation. Increased household formation should lead to increased municipal spending and new water infrastructure spending. Safety, comfort, and energy savings are priorities for residential builders, contractors, and homeowners, and Watt’s solutions include offering tubing and connection systems that are designed to transport potable water reliably and efficiently, it offers flood protection products that are designed to protect against costly water damage, and its anti-scale water conditioning products are designed to reduce the damaging effects of hard water scale on appliances and plumbing fixtures.
Exhibit 7: Building Permits, New Private Housing Starts
U.S. Housing permits increased 7.4% m/m in June and increased 5.1% y/y to a 1,254k unit annual run rate, and above expectations of 1,208k. U.S. Housing starts increased 8.3% m/m in June and were up 2.1% y/y to a 1,215k unit annual run rate, and above expectations of 1,160k. Both permits and starts have been in a general upward trend since the beginning of 2011, with growth moderating. Permits and starts are still below the long-term average of about 1.5 million annually. We believe that new housing starts should lead to increased water infrastructure needs.
Source: National Association of Home Builders (NAHB)
- 10 20 30 40 50 60 70 80 90
Jan
-85
Jul-
86
Jan
-88
Jul-
89
Jan
-91
Jul-
92
Jan
-94
Jul-
95
Jan
-97
Jul-
98
Jan
-00
Jul-
01
Jan
-03
Jul-
04
Jan
-06
Jul-
07
Jan
-09
Jul-
10
Jan
-12
Jul-
13
Jan
-15
Jul-
16
NAHB Housing Market Index
Recession NAHB Housing Market Index
-
10
20
30
40
50
60
70
80
Jan
-07
Jul-
07
Jan
-08
Jul-
08
Jan
-09
Jul-
09
Jan
-10
Jul-
10
Jan
-11
Jul-
11
Jan
-12
Jul-
12
Jan
-13
Jul-
13
Jan
-14
Jul-
14
Jan
-15
Jul-
15
Jan
-16
Jul-
16
Jan
-17
Jul-
17
NAHB Housing Market Index
Recession NAHB Housing Market Index
Source: U.S. Census Bureau
0
500
1,000
1,500
2,000
2,500
3,000
U.S. Annualized Housing Starts (000's)
0
500
1,000
1,500
2,000
2,500
3,000
U.S. Housing Permits Issued (000's)
-25%
-20%
-15%
-10%
-5%
0%
5%
10%
15%
20%
25%
30%
U.S. Annualized Housing Starts m/m change
-80%
-60%
-40%
-20%
0%
20%
40%
60%
U.S. Annualized Housing Starts y/y change
-20%
-15%
-10%
-5%
0%
5%
10%
15%
U.S. Annualized Housing Permits m/m change
-60%
-40%
-20%
0%
20%
40%
60%
U.S. Annualized Housing Permits y/y change
Watts Water Technologies, Inc.WTS – NYSE
Water TechnologiesInitiation of Coverage
September 18, 2017
8

Exhibit 8: U.S. Ship & Boat Building Index
Watts provides solutions for applications ranging from recreational boating to large cruise and cargo ships. Products include stainless steel drain and piping systems for sanitary discharge, ballast water monitoring systems to ensure ships meet regulations regarding invasive species, and quick-connect fittings for fast boat hookups and repairs. The U.S. ship & boat building production was up 1.3% m/m in August after being down 0.5% m/m in July.
Exhibit 9: Net Farm Income
Watts Water produces backflow prevention devices, control valves, and pipe connection systems for the agriculture & irrigation markets. In August 2017, the USDA published its agriculture outlook update and the report forecasts 2017 net cash income will increase 12.6% y/y to $100.4B ($93.5B prior forecast), net farm income will increase 3.1% y/y to $63.4B ($62.3B prior forecast), and value of crop production will increase 0.3% y/y to $190.1B ($186.7B prior forecast). After three consecutive years of decline, farm sector profits are forecast to increase in 2017. Despite the forecast upturn in these profit measures relative to 2016, levels would still be below all other years since 2010 (net farm income) and since 2011 (net cash farm income). We expect the USDA’s next update on November 29, 2017. Please reference Exhibit 18 for Purchasing Managers Indices.
Please reference Exhibit 20 for Manufacturing/Industrial Orders.
Please reference Exhibit 19 for Industrial Production.
Source: Federal Reserve
40
60
80
100
120
Jan
-72
Jan
-75
Jan
-78
Jan
-81
Jan
-84
Jan
-87
Jan
-90
Jan
-93
Jan
-96
Jan
-99
Jan
-02
Jan
-05
Jan
-08
Jan
-11
Jan
-14
Jan
-17
U.S. Ship & Boat Building Index
80
85
90
95
100
105
110
Jan
-07
Jan
-08
Jan
-09
Jan
-10
Jan
-11
Jan
-12
Jan
-13
Jan
-14
Jan
-15
Jan
-16
Jan
-17
U.S. Ship & Boat Building Index
Source: Factset, USDA
$25
$50
$75
$100
$125
$150
Net Farm Income
Net Farm Income
billions
$0
$5
$10
$15
$20
Historical Crop Prices
Corn Soy Wheat
Watts Water Technologies, Inc.WTS – NYSE
Water TechnologiesInitiation of Coverage
September 18, 2017
9

Raw Materials
Exhibit 10: Recent Trends in Major Raw Material Input Prices
WTS requires substantial amounts of raw materials to produce its products, including bronze, brass, cast iron, stainless steel, steel, plastic, and other materials used in its products. Substantially all of the raw materials WTS requires are purchased from outside sources. Watts internationally sources a significant amount of raw materials with several months of raw materials and work in process moving through its supply chain at any point in time. With limited exceptions, WTS has multiple suppliers for its commodities and other raw materials. WTS believes its relationships with key suppliers are good and that an interruption in supply from any one supplier would not materially affect its ability to meet its immediate demands while another supplier is qualified. Quarter to date, Iron Ore averaged $69.54 $/t, up 13.7% from the $61.18 $/t average in 2Q17 and up 21.8% y/y from $57.10 $/t in 3Q16. Holding Iron Ore prices flat, we estimate 3Q17 iron ore would be up 21.0% y/y, all else being equal.
Source: FactSet
$35
$55
$75
$95
$115
$135
$155
$175
Iron Ore (NYM $/t)
-80%
-60%
-40%
-20%
0%
20%
40%
60%
80%
100%
120%
140%
Iron Ore (NYM $/t) y/y change
Source: FactSet
-40%
-20%
0%
20%
40%
60%
80%
High Grade Copper - Y/Y change
$1
$2
$3
$4
$5
High Grade Copper (NYM $/lbs) - Price
Source: FactSet
-100%
-50%
0%
50%
100%
150%
200%
Amex Steel Index - Y/Y change
$0
$500
$1,000
$1,500
$2,000
$2,500
Amex Steel Index - Price
Source: FactSet
-80%
-60%
-40%
-20%
0%
20%
40%
60%
80%
100%
120%
WTI Crude Oil - Y/Y change
$0
$20
$40
$60
$80
$100
$120
WTI Crude Oil (NYM $/bbl) - Price
Watts Water Technologies, Inc.WTS – NYSE
Water TechnologiesInitiation of Coverage
September 18, 2017
10

Quarter to date, High Grade Copper averaged $2.89 $/lbs, up 11.8% from the $2.58 $/lbs average in 2Q17 and up 33.5% y/y from $2.16 $/lbs in 3Q16. Holding High Grade Copper prices flat, we estimate 3Q17 copper would be up 34.0% y/y, all else being equal. Quarter to date, the Amex steel index averaged $1,129 US$/tonne, up 9.7% from the $1,030 US$/tonne average in 2Q17 and up 33.5% y/y from $846 US$/tonne in 3Q16. Holding Amex steel index prices flat, we estimate 3Q17 steel would be up 34.5% y/y, all else being equal.
Quarter to date, Crude Oil averaged $47.59 $/bbl, down 1.6% from the $48.35 $/bbl average in 2Q17 and up 5.6% y/y from $45.08 $/bbl in 3Q16. Holding Crude Oil prices flat, we estimate 3Q17 oil would be up 6.4% y/y, all else being equal.
Management Robert J. Pagano, Jr., CPA, President, CEO & Director
Mr. Robert J. Pagano, Jr. has served as Chief Executive Officer, President and a Director of Watts Water Technologies, Inc. since May 2014. He also served as interim Chief Financial Officer from October 2014 to April 2015. Mr. Pagano previously served as Senior Vice President of ITT Corporation and President, ITT Industrial Process from April 2009 to May 2014. Mr. Pagano originally joined ITT in 1997 and served in several additional management roles during his career at ITT, including as Vice President Finance, Corporate Controller, and President of Industrial Products. ITT Corporation is a diversified manufacturer of highly engineered critical components and customized technology solutions for the energy, transportation and industrial markets. Prior to joining ITT, Mr. Pagano worked at KPMG LLP. Mr. Pagano is a Certified Public Accountant. Todd A. Trapp, CFO
Todd A. Trapp joined Watts Water Technologies, Inc. in April 2015 as Chief Financial Officer. Mr. Trapp previously served as Vice President of Financial Planning & Analysis of Honeywell International Inc. from August 2013 to April 2015. Mr. Trapp originally joined Honeywell in 2002 and served in several senior financial roles, including as Chief Financial Officer of the Airlines Business Unit from November 2010 to August 2013, Vice President of Business Analysis & Planning for Honeywell’s Aerospace Division from 2008 to November 2010, Director of Finance for the Transportation Systems Division from 2006 to 2008, Director of Business Analysis & Planning from 2005 to 2006, Investor Relations Manager from 2003 to 2005 and Senior Financial Analyst from 2002 to 2003. Honeywell is a Fortune 100 diversified technology and manufacturing leader, serving customers worldwide with aerospace products and services; control technologies for buildings, homes and industry; turbochargers; and performance materials. Prior to joining Honeywell, Mr. Trapp worked as Assistant Treasurer at United Business Media Inc. and Manager of Treasury Services and Special Projects at Pearson Inc.
Exhibit 11: Board of Directors
Name Position Affiliation Age Tenure Insider Holding (%)
Craig W. Kissel Independent Director Chairman 66 6 0.044%
Robert J. Pagano, Jr., CPA - President, Chief Executive Officer & Director 54 3 0.420%
David A. Dunbar - Director 54 <1 0.007%
Jes Munk Hansen, MBA - Director - <1 0.007%
Joseph William Reitmeier, MBA, CPA - Director 52 1 0.014%
Christopher L. Conway, MBA - Director 62 2 0.018%
Joseph T. Noonan - Director 35 4 0.017%
Merilee Raines, MBA Independent Director Independent Director 61 6 0.048%
Richard J. Cathcart Independent Director Independent Director 72 10 0.061%
Robert Louis Ayers, MBA Independent Director Independent Director 71 11 0.090%
Source: Factset
Watts Water Technologies, Inc.WTS – NYSE
Water TechnologiesInitiation of Coverage
September 18, 2017
11

Corporate History
Exhibit 12: WTS Historical Operating Summary and Forecast
Watts Water Technologies, Inc. (WTS)
Segment Model
$ millions except per share data
2011A 2012A 2013A 2014A 2015A 2016A 2017A 2018E 2019E 2020E
Revenues
Americas 819.4 835.0 878.5 926.8 978.5 900.9 958.1 981.4 1,010.9 1,041.2
Europe 436.0 431.3 442.9 472.0 481.5 491.1
APMEA 53.2 66.2 67.2 71.2 74.7 78.4
EMEA Net Sales 595.5 574.1 569.9 546.4
Asia-Pacific Net Sales 21.7 26.8 32.8 40.5
Total Revenues 1,436.6 1,435.9 1,481.2 1,513.7 1,467.7 1,398.4 1,468.2 1,524.6 1,567.1 1,610.8
Adjusted Operating Income
Americas 112.0 102.5 107.7 116.0 135.7 143.0 152.3 160.2 170.5 181.1
% of sales 13.7% 12.3% 12.3% 12.5% 13.9% 15.9% 15.9% 16.3% 16.9% 17.4%
Europe 40.0 44.6 51.4 56.8 60.1 63.5
% of sales 9.2% 10.3% 11.6% 12.0% 12.5% 12.9%
APMEA 6.5 8.1 8.7 9.9 11.2 12.5
% of sales 12.2% 12.2% 12.9% 13.9% 14.9% 15.9%
EMEA Net Sales 28.7 56.5 57.0 59.8
% of sales 4.8% 9.8% 10.0% 10.9%
Asia-Pacific Net Sales 12.2 7.8 9.1 6.6
% of sales 56.2% 29.1% 27.7% 16.3%
Total Adjusted Segment Operating Income 152.9 166.8 173.8 182.4 182.2 195.7 212.5 226.9 241.8 257.0
% of sales 10.6% 11.6% 11.7% 12.0% 12.4% 14.0% 14.5% 14.9% 15.4% 16.0%
Total Adjusted Operating Income 148.1 136.7 139.7 153.0 148.4 160.0 174.9 187.9 201.6 215.8
% of sales 10.3% 9.5% 9.4% 10.1% 10.1% 11.4% 11.9% 12.3% 12.9% 13.4%
Adjusted EPS Diluted 2.19$ 2.17$ 2.22$ 2.52$ 2.41$ 2.67$ 3.02$ 3.25$ 3.51$ 3.78$
Source: Company reports, Stifel estimates
Watts Water Technologies, Inc.WTS – NYSE
Water TechnologiesInitiation of Coverage
September 18, 2017
12

Exhibit 13: Acquisition History
Close Date Deal TitleTransaction
ValueRole
02 Nov '16 Watts Water Technologies, Inc. acquires PVI Industries LLC (Texas) from Alden Industries, Inc. 78.0$ Buyer
26 Feb '16 Watts Water Technologies, Inc. takes a majority stake in AERCO Korea Co. Ltd. 4.0$ Buyer
30 Nov '15 Watts Water Technologies, Inc. takes a majority stake in Apex Valves Ltd. 22.0$ Buyer
15 Sep '15 Sioux Chief Mfg. Co., Inc. acquires Watts Water Technologies, Inc. /Americas Product Lines/ from Watts Water Technologies, Inc. 35.5$ Seller
01 Dec '14 Watts Water Technologies, Inc. acquires AERCO International, Inc. from Riverside Partners LLC 264.5$ Buyer
21 Dec '12 GKG Progressive Enterprises, Inc. acquires Flomatic Corp. from Watts Water Technologies, Inc. -- Seller
20 Jan '12 Watts Water Technologies, Inc. acquires Tekmar Control Systems Ltd. 26.0$ Buyer
29 Apr '11 Watts Water Technologies, Inc. acquires Danfoss A/S /Water Controls Business/ from Onvest Oy 165.5$ Buyer
28 Jun '10 Watts Water Technologies, Inc. acquires Austroflex Rohr-Isoliersysteme GmbH 33.7$ Buyer
16 Apr '10 Watts Water Technologies, Inc. acquires Blue Ridge Atlantic, Inc. 5.3$ Buyer
01 Apr '09 Watts Water Technologies, Inc. acquires PROFIX Mobiler Industriereifen-Service GmbH -- Buyer
30 May '08 Watts Water Technologies, Inc. acquires Blücher Metal A/S from Blücher Holding A/S 183.0$ Buyer
21 Nov '07 Riverside Partners LLC (New York) acquires AERCO International, Inc. -- Seller
09 Nov '07 Watts Water Technologies, Inc. acquires Topway Global, Inc. -- Buyer
15 Aug '06 Watts Water Technologies, Inc. acquires Black Teknigas Ltd. -- Buyer
13 Jun '06 Watts Water Technologies, Inc. acquires KimSafe AB -- Buyer
02 Jun '06 Watts Water Technologies, Inc. acquires Calflex Manufacturing, Inc. -- Buyer
19 May '06 Watts Water Technologies, Inc. acquires ATS Expansion SA from Banque Fédérale des Banques Populaires SA 76.9$ Buyer
26 Apr '06 Watts Water Technologies, Inc. acquires Changsa Valve Works -- Buyer
28 Dec '05 Watts Water Technologies, Inc. acquires Dormont Manufacturing Co. 94.8$ Buyer
04 Dec '05 Watts Water Technologies, Inc. acquires SPX Corp. /3 Valve Product Lines/ from SPX Corp. -- Buyer
07 Nov '05 Watts Water Technologies, Inc. acquires Flexflow Tubing Ltd. -- Buyer
26 Apr '06 Watts Water Technologies, Inc. acquires Changsha Valve Works -- Buyer
08 Jul '05 Watts Water Technologies, Inc. acquires Donald E. Savard Co. /Water Connector Business/ from Donald E. Savard Co. -- Buyer
20 Jun '05 Watts Water Technologies, Inc. acquires Alamo Water Refiners, Inc. /Water Softener Ops/ from Watts Water Quality & Conditioning Products, Inc. -- Buyer
Source: Factset
Watts Water Technologies, Inc.WTS – NYSE
Water TechnologiesInitiation of Coverage
September 18, 2017
13

Forecast 3Q17 Forecast
We forecast net sales of $366.5 million, representing +1.4% y/y organic growth (+7.4% y/y total growth). We forecast adjusted operating income of $46.0 million (12.5% of sales) which compares to $41.4 million (12.1% of sales) in F3Q16. We forecast adjusted EPS of $0.80, which compare to $0.71 in F3Q16. Americas: We forecast net sales $233.9 million, representing +1.0% y/y organic growth (+8.4% y/y total growth). We forecast adjusted operating income of $39.2 million (16.8% of sales) which compares to $36.3 million (16.8% of sales) in F3Q16. Europe: We forecast net sales $113.9 million, representing +2.0% y/y organic growth (+6.5% y/y total growth). We forecast adjusted operating income of $14.5 million (12.7% of sales) which compares to $12.7 million (11.9% of sales) in F3Q16. APMEA: We forecast net sales $18.7 million, representing +3.0% y/y organic growth (+2.0% y/y total growth). We forecast adjusted operating income of $2.8 million (14.8% of sales) which compares to $2.1 million (11.5% of sales) in F3Q16. 2017 Forecast
We forecast net sales of $1.47 billion, representing +0.4% y/y organic growth (+5.0% y/y total growth). We forecast adjusted operating income of $174.9 million (11.9% of sales) which compares to $160.0 million (11.4% of sales) in F2016. We forecast adjusted EPS of $3.02, which compare to $2.67 in F2016. Americas: We forecast net sales $958.1 million, representing flat y/y organic growth (+6.3% y/y total growth). We forecast adjusted operating income of $152.3 million (15.9% of sales) which compares to $143.0 million (15.9% of sales) in F3Q16. Europe: We forecast net sales $442.9 million, representing +1.2% y/y organic growth (+2.7% y/y total growth). We forecast adjusted operating income of $51.4 million (11.6% of sales) which compares to $44.6 million (10.3% of sales) in F3Q16. APMEA: We forecast net sales $67.2 million, representing -0.1% y/y organic growth (+1.6% y/y total growth). We forecast adjusted operating income of $8.7 million (12.9% of sales) which compares to $8.1 million (12.2% of sales) in F3Q16. 2018-F2020 Forecast
Our longer term forecast assumes core residential and non-residential markets should grow low single digits or better. Please see our model for more details.
Watts Water Technologies, Inc.WTS – NYSE
Water TechnologiesInitiation of Coverage
September 18, 2017
14

Valuation Returns Watts has historically under-earned what we would view as a long term cost of capital in the 9%-10% range. We believe the current turnaround/operational improvement programs and improved capital discipline under the current management team are likely to push returns above our estimate of the long term cost of capital.
Exhibit 14: WTS Historical Return Profile
Historical Performance WTS shares have historically outperformed the S&P 500. Since WTS’s IPO on August 21, 1986, WTS shares have returned a 31 year CAGR of 8.0%, versus the S&P 500’s 7.7%. Recently WTS has underperformed. Since the 2016 election on November 8, 2016, shares have returned 1.9%, versus the S&P 500’s 16.9%.
Exhibit 15: WTS Share Performance
Source: Company reports, Stifel estimates
0%
5%
10%
15%
20%
25%
30%
Return On Equity
ROE Adjusted ROE ex cash
0%
2%
4%
6%
8%
10%
12%
Return On Invested Capital
ROIC ROIC ex cash
0%
1%
2%
3%
4%
5%
6%
7%
8%
9%
Return On Assets
ROA ROA ex cash
Source: Factset
0.8x
1.8x
2.8x
3.8x
4.8x
5.8x
6.8x
7.8x
8.8x
9.8x
10.8x
Relative WTS vs. S&P Price
WTS S&P500
Watts Water Technologies, Inc.WTS – NYSE
Water TechnologiesInitiation of Coverage
September 18, 2017
15

Exhibit 16: WTS Valuation
Exhibit 17: Comparison Matrix
Source: FactSet Source: FactSet
5X
10X
15X
20X
25X
30X
Historical Forward P/E
WTS S&P500
0X
5X
10X
15X
20X
25X
Historical Trailing EV/EBITDA
Price PE PE EV/EBITDA EV/EBITDA
Ticker 9/15/2017 Market Cap 2018E 2019E 2017E 2018E
Watts Water Technologies, Inc. (WTS) (Stifel)* WTS 64.00$ 2,188$ 19.7x 18.2x 11.2x 10.6x
Watts Water Technologies, Inc. (WTS) (Consensus) WTS 64.00$ 2,188$ 19.5x 18.3x 11.2x 10.5x
Xylem Inc.* XYL 63.30$ 11,367$ 22.5x 19.9x 15.7x 14.4x
IMI plc IMI-GB 11.21$ 3,049$ 16.2x 14.9x 12.0x 11.0x
KSB AG KSB-DE 493.75€ 864.72€ 11.4x 9.7x 5.3x 4.2x
Nordson Corporation NDSN 113.20$ 6,531$ 19.0x 17.1x 14.5x 13.1x
Rexnord Corporation RXN 24.52$ 2,542$ 17.4x 15.8x 10.0x 9.3x
Franklin Electric FELE 40.80$ 1,897$ 19.1x 16.4x 13.8x 12.0x
I-Tron ITRI 72.80$ 2,817$ 19.8x 16.7x 12.5x 10.8x
Sulzer SUN-SWX 106.90CHF 3,643.68CHF 19.6x 16.8x 12.6x 10.5x
Badger Meter* BMI 45.80$ 1,333$ 31.4x 28.3x 17.8x 16.2x
Roper* ROP 237.83$ 24,311$ 23.4x 21.4x 18.3x 16.9x
Mueller Water MWA 12.27$ 1,946$ 21.3x 18.7x 11.9x 10.4x
Average 20.1x 17.8x 13.1x 11.7x
WTS difference to average (Stifel) -0.4x 0.4x -1.9x -1.1x
WTS different to average (consensus) -0.6x 0.5x -1.9x -1.2x
Source: Factset, (*) Stifel estimates. Roper is covered by our colleague Robert McCarthy.
All valuations represent calendar years for comparison.
Watts Water Technologies, Inc.WTS – NYSE
Water TechnologiesInitiation of Coverage
September 18, 2017
16

Manufacturing – Macro Overview Purchasing Managers Index (PMI)
August’s headline ISM PMI number registered 58.8 (vs. 56.5 consensus), up 2.5 points from 56.3 in July. Recent industrial production data out of the U.S. showed July up 0.2% sequentially. Looking deeper into the ISM data, results overall were positive with the majority of components accelerating, with orders decreasing 0.1 points (60.3), production increasing 0.4 points (61.0), employment increasing 4.7 points (59.9), deliveries increasing 1.7 points (57.1), and inventories increasing 5.5 points (55.5). Orders - inventory (which tends to be a leading indicator of activity) decreased 5.6 points to 4.8. August's Manufacturing ISM PMI indicates economic activity in the manufacturing sector expanded for the twelfth consecutive month. Notably, the prices index remained flat at 62.0 for the month of August. Manufacturing PMI numbers released by Markit Economics were positive in August with the Eurozone, China, Brazil, and Global readings all up and in growth territory above 50. The Eurozone PMI was up 0.8 points to 57.4 from last month's 56.6 reading. Conditions in the UK accelerated and showed a solid rate of expansion at 56.9 in August, which was up from 55.3 in July. We believe European industrial production is likely to accelerate in 2H17 and prospects for stronger growth in 2018 are increasing as the weaker Euro provides the potential for more competitive exports (though the Euro has appreciated recently). The Chinese PMI was up 0.5 points to 51.6. vs. 51.1 in July. The Brazilian PMI was up 0.9 points to 50.9 in August. Globally, the PMI was up 0.4 points at 53.1.
Exhibit 18: Purchasing Managers Indices
Description
The Purchasing Managers Index is an indicator of economic activity. It reflects the percentage of purchasing managers that reported better or worse business conditions than in the previous month.
Source: Institute for Supply Management Source: Institute for Supply Management
20
30
40
50
60
70
80
U.S. Manufacturing PMI
30
35
40
45
50
55
60
65
70
U.S. Manufacturing PMI
Australia Brazil Canada China India Indonesia Japan Mexico Russia South Korea Taiwan
Aug-16 46.9 45.7 51.1 50.0 52.6 50.4 49.5 50.9 50.8 48.6 51.8
Sep-16 49.8 46.0 50.3 50.1 52.1 50.9 50.4 51.9 51.1 47.6 52.2
Oct-16 50.9 46.3 51.1 51.2 54.4 48.7 51.4 51.8 52.4 48.0 52.7
Nov-16 54.2 46.2 51.5 50.9 52.3 49.7 51.3 51.1 53.6 48.0 54.7
Dec-16 55.4 45.2 51.8 51.9 49.6 49.0 52.4 50.2 53.7 49.4 56.2
Jan-17 51.2 44.0 53.5 51.0 50.4 50.4 52.7 50.8 54.7 49.0 55.6
Feb-17 59.3 46.9 54.7 51.7 50.7 49.3 53.3 50.6 52.5 49.2 54.5
Mar-17 57.5 49.6 55.5 51.2 52.5 50.5 52.4 51.5 52.4 48.4 56.2
Apr-17 59.2 50.1 55.9 50.3 52.5 51.2 52.7 50.7 50.8 49.4 54.4
May-17 55.9 52.0 55.1 49.6 51.6 50.6 53.1 51.2 52.4 49.2 53.1
Jun-17 55.0 50.5 54.7 50.4 50.9 49.5 52.4 52.3 50.3 50.1 53.3
Jul-17 56.0 50.0 55.5 51.1 47.9 48.6 52.1 51.2 52.7 49.1 53.6
Aug-17 59.8 50.9 54.6 51.6 51.2 50.7 52.2 52.2 51.6 49.9 54.3
Source: Mark it Economics
Watts Water Technologies, Inc.WTS – NYSE
Water TechnologiesInitiation of Coverage
September 18, 2017
17
The PMI is a composite index based on the seasonally adjusted diffusion indexes for the following five indicators at equal weights.
New Orders: 20%
Production: 20%
Employment: 20%
Supplier Deliveries: 20%
Inventories: 20% Economists and statisticians have determined that the further away the index is from the center, the level for "no change" (50%), the rate of change is greater. Industrial Production
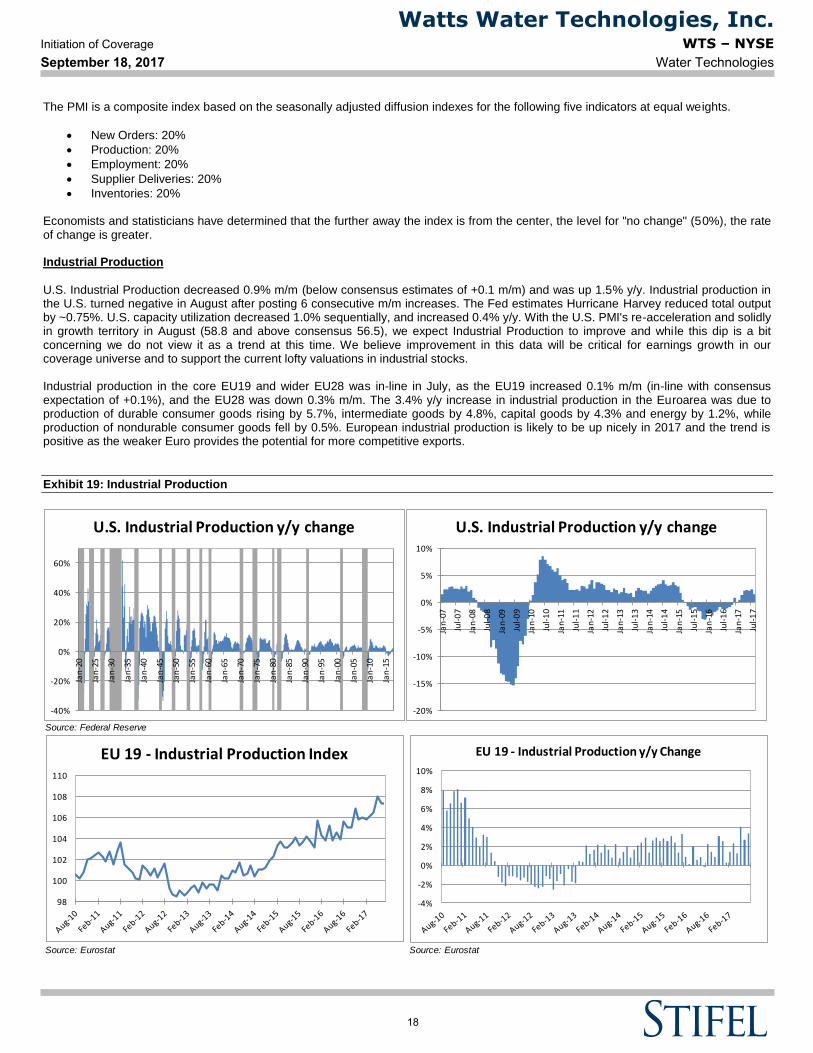
U.S. Industrial Production decreased 0.9% m/m (below consensus estimates of +0.1 m/m) and was up 1.5% y/y. Industrial production in the U.S. turned negative in August after posting 6 consecutive m/m increases. The Fed estimates Hurricane Harvey reduced total output by ~0.75%. U.S. capacity utilization decreased 1.0% sequentially, and increased 0.4% y/y. With the U.S. PMI's re-acceleration and solidly in growth territory in August (58.8 and above consensus 56.5), we expect Industrial Production to improve and while this dip is a bit concerning we do not view it as a trend at this time. We believe improvement in this data will be critical for earnings growth in our coverage universe and to support the current lofty valuations in industrial stocks. Industrial production in the core EU19 and wider EU28 was in-line in July, as the EU19 increased 0.1% m/m (in-line with consensus expectation of +0.1%), and the EU28 was down 0.3% m/m. The 3.4% y/y increase in industrial production in the Euroarea was due to production of durable consumer goods rising by 5.7%, intermediate goods by 4.8%, capital goods by 4.3% and energy by 1.2%, while production of nondurable consumer goods fell by 0.5%. European industrial production is likely to be up nicely in 2017 and the trend is positive as the weaker Euro provides the potential for more competitive exports.
Exhibit 19: Industrial Production
Source: Federal Reserve
-40%
-20%
0%
20%
40%
60%
Jan
-20
Jan
-25
Jan
-30
Jan
-35
Jan
-40
Jan
-45
Jan
-50
Jan
-55
Jan
-60
Jan
-65
Jan
-70
Jan
-75
Jan
-80
Jan
-85
Jan
-90
Jan
-95
Jan
-00
Jan
-05
Jan
-10
Jan
-15
U.S. Industrial Production y/y change
-20%
-15%
-10%
-5%
0%
5%
10%
Jan
-07
Jul-
07
Jan
-08
Jul-
08
Jan
-09
Jul-
09
Jan
-10
Jul-
10
Jan
-11
Jul-
11
Jan
-12
Jul-
12
Jan
-13
Jul-
13
Jan
-14
Jul-
14
Jan
-15
Jul-
15
Jan
-16
Jul-
16
Jan
-17
Jul-
17
U.S. Industrial Production y/y change
Source: Eurostat Source: Eurostat
98
100
102
104
106
108
110
EU 19 - Industrial Production Index
-4%
-2%
0%
2%
4%
6%
8%
10%
EU 19 - Industrial Production y/y Change
Watts Water Technologies, Inc.WTS – NYSE
Water TechnologiesInitiation of Coverage
September 18, 2017
18

Description
The industrial production index shows the output of the industrial sector. It measures changes in the volume of output on a monthly basis, adjusted for seasonality. Industrial Orders
New orders are the most forward looking of indicators, in our opinion. The index was down 0.1 points in August as compared to July. The index sits at 60.3, indicating growth in new orders for the twelfth consecutive month.
Exhibit 20: Manufacturing/Industrial Orders
Source: National Bureau of Statistics of China, Stifel Source: National Bureau of Statistics of China
$0
$5,000
$10,000
$15,000
$20,000
$25,000
$30,000
Chinese - Absolute Value Added of Industry - (100 million yuan)
0%
5%
10%
15%
20%
25%
30%
35%
40%
45%
50%
Chinese Industrial Production - y/y Change
Source: Ministry of Economy, Trade and Industry Source: Ministry of Economy, Trade and Industry
Base year 2010
70
75
80
85
90
95
100
105
110
115
120
Jan-08 Jan-09 Jan-10 Jan-11 Jan-12 Jan-13 Jan-14 Jan-15 Jan-16 Jan-17
Japan - Industrial Production
-40%
-30%
-20%
-10%
0%
10%
20%
30%
Japan - Industrial Production y/y % change
Source: Institute for Supply Management Source: Institute for Supply Management
20
30
40
50
60
70
80
U.S. Manufacturing Orders Index
25
30
35
40
45
50
55
60
65
70
U.S. Manufacturing Orders Index
Watts Water Technologies, Inc.WTS – NYSE
Water TechnologiesInitiation of Coverage
September 18, 2017
19

Economic Outlook and GDP Forecast
We are not economists, and do not claim to be experts on the global economic outlook, but, at this point, we expect modestly improving macro conditions globally in 2017. We expect U.S. GDP growth in 2017 will moderate at 2%-3%. We also believe Europe growth remains stagnant with risk, and expect 1%-2% GDP growth and slightly positive industrial production (taking a more conservative view than the IMF; see Exhibit 21). Considering emerging markets as a whole, we assume 3.5%-4.5% GDP growth. This leaves us looking for global GDP growth of 3%-4% in 2017. Our growth forecast is toward the low end of the IMF World Economic Outlook forecasts, which were published in January 2017.
Exhibit 21: Economic Growth Forecasts from the IMF
Source: IMF World Economic Outlook, January 2017
(6.0%)
(4.0%)
(2.0%)
0.0%
2.0%
4.0%
6.0%
8.0%
10.0%
12.0%
2008 2009 2010 2011 2012 2013 2014 2015 2016E 2017E 2018E
Re
al G
DP
% G
row
th
Real GDP Growth Forecasts
US Euro Area
Emerging and Developing Economies Global
Emerging and Developing Asia
Watts Water Technologies, Inc.WTS – NYSE
Water TechnologiesInitiation of Coverage
September 18, 2017
20

Target Price Methodology/RisksOur one-year target price of $72 is based on 22x our 2018E EPS. Our three-year target price of $90 is based on 22x our 2020E EPS plusnet cash.
Risks to our target price include economic cycles particularly those involving reduced levels of commercial and residential starts andremodeling, reductions or interruptions in the supply of components or raw materials, changes in regulations or industry standards in thecompany's end markets, and the conversion and sale of a significant number of shares of WTS Class B common stock could adverselyaffect the market price of its Class A common stock.
Company DescriptionWatts Water Technologies, Inc. designs, manufactures, and sells products and solutions that manage and conserve the flow of fluids andenergy into, through and out of buildings in the residential and commercial markets. It offers residential and commercial flow control products,including backflow preventers, water pressure regulators, temperature and pressure relief valves, and thermostatic mixing valves. Thecompany also provides heating, ventilation, air conditioning and gas products comprising commercial high-efficiency boilers, water heaters,and heating solutions; hydronic and electric heating systems for under-floor radiant applications; custom heat and hot water solutions;hydronic pump groups for boiler manufacturers and alternative energy control packages; and flexible stainless steel connectors for naturaland liquid propane gas in commercial food service and residential applications. In addition, it offers drainage and water re-use productsconsisting of drainage products and engineered rain water harvesting solutions for commercial, industrial, marine and residential applications;and water quality products, such as point-of-use and point-of-entry water filtration, conditioning, and scale prevention systems. The companysells its products to plumbing, heating, mechanical wholesale distributors, dealers, original equipment manufacturers, specialty productdistributors, and do-it-yourself chains, as well as directly to wholesalers and private label accounts. It operates in the Americas, Europe,the Middle East and Africa, and Asia-Pacific. Watts Water Technologies, Inc. was founded in 1874 and is headquartered in North Andover,Massachusetts.
Watts Water Technologies, Inc.WTS – NYSE
Water TechnologiesInitiation of Coverage
September 18, 2017
21

Watts Water Technologies, Inc. (WTS)
Income Statement
($ in mils, except per share data)
December Fiscal Year End
2010 2011 2012 2013 2014 2015 1Q16 2Q16 3Q16 4Q16 2016 1Q17 2Q17 3Q17 4Q17 2017 2018 2019 2020
A A A A A A A A A A A A A E E E E E E
Revenues 1,274.6 1,436.6 1,435.9 1,481.2 1,513.7 1,467.7 344.2 371.1 341.1 342.0 1,398.4 347.2 378.5 366.5 376.0 1,468.2 1,524.6 1,567.1 1,610.8
y/y growth 3.3% 12.7% 0.0% 3.2% 2.2% -3.0% -3.4% -4.1% -6.9% -4.5% -4.7% 0.9% 2.0% 7.4% 9.9% 5.0% 3.8% 2.8% 2.8%
organic y/y growth 4.2% 2.3% 0.7% 2.1% 2.6% 0.5% 6.0% 3.9% -1.4% -0.2% 1.0% -1.4% -0.4% 1.4% 2.0% 0.4% 2.1% 2.8% 2.8%
Cost of sales 809.7 921.1 920.7 953.2 971.9 914.6 209.0 220.4 199.1 204.3 832.8 203.4 221.8 214.2 223.8 863.2 894.5 921.8 950.2
Gross profit 464.9 515.5 515.2 528.0 541.8 553.1 135.2 150.7 142.0 137.7 565.6 143.8 156.7 152.3 152.2 605.0 630.2 645.3 660.5
SG&A 336.7 379.9 383.0 407.5 407.0 491.3 102.6 110.5 104.5 106.5 424.1 107.6 110.2 106.3 109.0 433.1 442.3 443.6 444.7
Restructuring and other charges, net 76.3 (12.5) (6.1) (18.6) (18.2) (86.6) (4.7) 4.8 (3.9) (6.0) (9.8) (2.2) (0.8) (3.0) - - -
Gain on disposition - - 1.6 (0.6) - - - (8.7) - - (8.7) - - - - - -
Adjusted Operating income 131.2 148.1 136.7 139.7 153.0 148.4 37.3 44.1 41.4 37.2 160.0 38.4 47.3 46.0 43.2 174.9 187.9 201.6 215.8
EBITDA 176.0 199.5 186.1 188.6 201.1 200.9 49.7 56.6 54.5 50.4 211.2 50.5 60.9 59.3 56.2 226.9 238.7 249.9 264.6
Interest income (1.0) (1.0) (0.7) (0.6) (0.7) (1.0) (0.2) (0.3) (0.3) (0.2) (1.0) (0.2) (0.2) (0.2) (0.2) (0.8) (0.7) (0.5) (0.3)
Interest expense 22.8 25.8 24.6 21.5 19.9 24.3 6.7 5.5 4.9 5.5 22.6 4.8 5.0 4.6 4.6 19.0 18.5 18.5 18.5
Other income, net (2.1) 0.8 (0.8) 2.8 3.1 (2.3) (2.2) (0.9) (0.5) (0.8) (4.4) 0.3 0.2 0.5 - - -
Income before income taxes 111.5 122.5 113.6 116.0 130.7 127.4 33.0 39.8 37.3 32.7 142.8 33.5 42.3 41.6 38.8 156.2 170.1 183.7 197.6
Tax rate 35.0% 33.3% 31.1% 31.9% 32.1% 33.8% 40.6% 34.7% 34.0% 32.1% 35.3% 33.4% 32.2% 34.0% 34.0% 33.4% 34.0% 34.0% 34.0%
Provision for income taxes 39.0 40.8 35.3 37.0 41.9 43.0 13.4 13.8 12.7 10.5 50.4 11.2 13.6 14.1 13.2 52.1 57.8 62.5 67.2
Net income 72.5 81.7 78.3 79.0 88.8 84.4 19.6 26.0 24.6 22.2 92.4 22.3 28.7 27.5 25.6 104.1 112.3 121.2 130.4
Adjusted EPS Diluted 1.94$ 2.19$ 2.17$ 2.22$ 2.52$ 2.41$ 0.57$ 0.75$ 0.71$ 0.64$ 2.67$ 0.65$ 0.83$ 0.80$ 0.74$ 3.02$ 3.25$ 3.51$ 3.78$
Weighted average diluted shares outstanding 37.4 37.5 36.1 35.6 35.4 34.9 34.5 34.5 34.5 34.5 34.5 34.5 34.5 34.5 34.5 34.5 34.5 34.5 34.5
Dividends per share 0.44$ 0.44$ 0.44$ 0.50$ 0.58$ 0.66$ 0.17$ 0.18$ 0.18$ 0.18$ 0.71$ 0.18$ 0.19$ 0.19$ 0.19$ 0.75$ 0.76$ 0.76$ 0.76$
Gross profit margin 36.5% 35.9% 35.9% 35.6% 35.8% 37.7% 39.3% 40.6% 41.6% 40.3% 40.4% 41.4% 41.4% 41.5% 40.5% 41.2% 41.3% 41.2% 41.0%
SG&A as % of sales 26.4% 26.4% 26.7% 27.5% 26.9% 33.5% 29.8% 29.8% 30.6% 31.1% 30.3% 31.0% 29.1% 29.0% 29.0% 29.5% 29.0% 28.3% 27.6%
EBITDA margin 13.8% 13.9% 13.0% 12.7% 13.3% 13.7% 14.4% 15.3% 16.0% 14.7% 15.1% 14.5% 16.1% 16.2% 14.9% 15.5% 15.7% 15.9% 16.4%
Adjusted Operating margin 10.3% 10.3% 9.5% 9.4% 10.1% 10.1% 10.8% 11.9% 12.1% 10.9% 11.4% 11.1% 12.5% 12.5% 11.5% 11.9% 12.3% 12.9% 13.4%
Net margin 5.7% 5.7% 5.5% 5.3% 5.9% 5.8% 5.7% 7.0% 7.2% 6.5% 6.6% 6.4% 7.6% 7.5% 6.8% 7.1% 7.4% 7.7% 8.1%
Sales growth 3.3% 12.7% 0.0% 3.2% 2.2% -3.0% -3.4% -4.1% -6.9% -4.5% -4.7% 0.9% 2.0% 7.4% 9.9% 5.0% 3.8% 2.8% 2.8%
Gross profit growth 6.5% 10.9% -0.1% 2.5% 2.6% 2.1% 3.6% 3.4% -0.1% 2.3% 2.3% 6.4% 4.0% 7.2% 10.5% 7.0% 4.2% 2.4% 2.4%
EBITDA growth 25.9% 13.4% -6.7% 1.3% 6.6% -0.1% 17.5% 3.1% -1.8% 4.6% 5.1% 1.6% 7.6% 8.8% 11.5% 7.4% 5.2% 4.7% 5.9%
Adjusted Operating income growth 41.1% 12.9% -7.7% 2.2% 9.5% -3.0% 27.3% 5.0% -0.7% 5.1% 7.8% 2.9% 7.3% 11.1% 16.0% 9.3% 7.4% 7.3% 7.0%
Net income growth 92.8% 12.7% -4.2% 0.9% 12.4% -5.0% 23.3% 7.0% 4.2% 7.8% 9.5% 13.8% 10.4% 11.7% 15.2% 12.6% 7.9% 8.0% 7.6%
EPS growth 91.0% 13.0% -0.8% 2.2% 13.7% -4.4% 25.8% 8.9% 5.7% 8.4% 10.6% 13.8% 10.4% 11.7% 15.2% 13.0% 7.9% 8.0% 7.6%GAAP EPS growth 66.5% 2.3% 13.0% -12.6% -16.7% -327.9% 42.5% 50.8% -186.4% -114.9% -175.4% 34.0% -4.9% 25.4% 46.2% 21.1% 10.1% 8.0% 7.6%
Source: Company reports, Stifel estimates
Watts Water Technologies, Inc.WTS – NYSE
Water TechnologiesInitiation of Coverage
September 18, 2017
22

Watts Water Technologies, Inc. (WTS)
Segment Model
($ in mils, except per share data)
December Fiscal Year End
2014 2015 1Q16 2Q16 3Q16 4Q16 2016 1Q17 2Q17 3Q17 4Q17 2017 2018 2019 2020
A A A A A A A A A E E E E E E
Revenues:
Americas Net Sales 978.5 222.3 239.5 215.8 223.3 900.9 228.7 250.5 233.9 244.9 958.1 981.4 1,010.9 1,041.2
y/y growth -7.9% 2.9% 4.6% 8.4% 9.7% 6.3% 2.4% 3.0% 3.0%
organic y/y growth -2.1% -0.7% 1.0% 2.0% 0.0% 2.0% 3.0% 3.0%
Europe Net Sales 436.0 108.3 114.3 107.0 101.7 431.3 104.9 110.7 113.9 113.4 442.9 472.0 481.5 491.1
y/y growth -1.1% -3.1% -3.1% 6.5% 11.5% 2.7% 6.6% 2.0% 2.0%
organic y/y growth 1.1% 0.0% 2.0% 2.0% 1.2% 2.0% 2.0% 2.0%
APMEA Net Sales 53.2 13.6 17.3 18.3 17.0 66.2 13.6 17.3 18.7 17.7 67.2 71.2 74.7 78.4
y/y growth 24.4% 0.0% 0.0% 2.0% 4.0% 1.6% 5.8% 5.0% 5.0%
organic y/y growth -10.2% 1.7% 3.0% 3.0% -0.1% 5.0% 5.0% 5.0%
Total revenues 1,467.7 344.2 371.1 341.1 342.0 1,398.4 347.2 378.5 366.5 376.0 1,468.2 1,524.6 1,567.1 1,610.8
y/y growth -4.7% 0.9% 2.0% 7.4% 9.9% 5.0% 3.8% 2.8% 2.8%
organic y/y growth -1.4% -0.4% 1.4% 2.0% 0.4% 2.1% 2.8% 2.8%
Adjusted Operating Income:
Americas 135.7 33.0 39.5 36.3 34.2 143.0 33.6 41.4 39.2 38.1 152.3 160.2 170.5 181.1
margin 13.9% 14.8% 16.5% 16.8% 15.3% 15.9% 14.7% 16.5% 16.8% 15.6% 15.9% 16.3% 16.9% 17.4%
Europe 40.0 10.2 12.8 12.7 8.9 44.6 12.6 13.0 14.5 11.3 51.4 56.8 60.1 63.5
margin 9.2% 9.4% 11.2% 11.9% 8.8% 10.3% 12.0% 11.7% 12.7% 10.0% 11.6% 12.0% 12.5% 12.9%
APMEA 6.5 2.4 1.6 2.1 2.0 8.1 1.0 2.2 2.8 2.7 8.7 9.9 11.2 12.5
margin 12.2% 17.6% 9.2% 11.5% 11.8% 12.2% 7.4% 12.7% 14.8% 15.3% 12.9% 13.9% 14.9% 15.9%
Total Adjusted Segment Operating Income 182.2 45.6 53.9 51.1 45.1 195.7 47.2 56.6 56.5 52.2 212.5 226.9 241.8 257.0
margin 12.4% 13.2% 14.5% 15.0% 13.2% 14.0% 13.6% 15.0% 15.4% 13.9% 14.5% 14.9% 15.4% 16.0%
Corporate (33.8) (8.3) (9.8) (9.7) (7.9) (35.7) (8.8) (9.3) (10.5) (9.0) (37.6) (39.0) (40.1) (41.2)
Total Adjusted Operating Income 148.4 37.3 44.1 41.4 37.2 160.0 38.4 47.3 46.0 43.2 174.9 187.9 201.6 215.8 margin 10.1% 10.8% 11.9% 12.1% 10.9% 11.4% 11.1% 12.5% 12.5% 11.5% 11.9% 12.3% 12.9% 13.4%
Source: Company reports, Stifel estimates
Watts Water Technologies, Inc.WTS – NYSE
Water TechnologiesInitiation of Coverage
September 18, 2017
23

Watts Water Technologies, Inc. (WTS)
Cash Flow Statement
($ in mils, except per share data)
December Fiscal Year End
2010 2011 2012 2013 2014 2015 1Q16 2Q16 3Q16 4Q16 2016 1Q17 2Q17 3Q17 4Q17 2017 2018 2019 2020
A A A A A A A A A A A A A E E E E E E
Net income 58.8 66.4 68.4 58.6 50.3 (112.9) 16.2 28.6 21.9 17.5 84.2 21.7 27.2 27.5 25.6 102.0 112.3 121.2 130.4
Loss from discontinued operations, net of taxes (4.3) 1.7 (2.2) (2.3) - - - - - - - - - - - - -
Net income including non-controlling interests 63.1 64.7 70.6 60.9 50.3 (112.9) 16.2 28.6 21.9 17.5 84.2 21.7 27.2 27.5 25.6 102.0 112.3 121.2 130.4
D&A 44.8 51.4 49.4 48.9 48.1 52.5 12.4 12.5 13.1 13.2 51.2 12.1 13.6 13.3 13.0 52.0 50.9 48.2 48.8
Loss on disposal, impairment of goodwill, PP&E, and other 2.6 5.2 4.1 1.5 15.3 132.4 0.3 1.6 (0.1) 1.9 3.7 0.4 0.2 0.6 - - -
Stock-based compensation 4.7 8.3 6.6 9.6 8.6 10.9 2.8 4.5 3.3 2.8 13.4 2.9 4.0 3.0 3.0 12.9 13.4 13.8 14.2
Deferred income taxes (6.9) (0.6) - (6.8) (2.7) (20.5) (1.0) 0.6 3.3 0.6 3.5 5.3 (3.0) - - 2.3 1.1 1.5 1.5
Gain on acquisition/ disposition - - - - - - (1.7) (8.3) (0.3) - (10.3) - - - - - -
Defined benefit plans settlement - - - - - 59.7 - - - - - - - - - - -
Other - - - - - - - - - - - - - - - - -
Change in Net Working Capital 5.1 (0.8) 1.2 4.2 15.6 (12.7) (50.9) (9.8) 20.6 32.5 (7.6) (51.5) (23.9) 25.7 18.5 (31.2) (4.7) (6.2) (6.4)
CFO 113.4 128.2 131.9 118.3 135.2 109.4 (21.9) 29.7 61.8 68.5 138.1 (9.1) 18.1 69.5 60.1 138.6 173.0 178.5 188.5
Additions to PP&E (CapEx) (24.6) (22.7) (30.6) (27.7) (23.7) (27.7) (9.2) (10.0) (7.1) (9.7) (36.0) (5.8) (5.2) (13.0) (14.0) (38.0) (38.1) (39.2) (40.3)
Proceeds from the sale of PP&E 2.2 0.8 3.5 1.5 0.4 0.1 0.1 (0.1) - 0.1 0.1 - 0.1 0.1 - - -
Proceeds from the sale of asset held for sale - - - - - 30.7 - - 4.2 5.7 9.9 1.9 - 1.9 - - -
Proceeds from sale of securities 2.5 - 2.0 2.1 - - - - - - - - - - - - -
Restricted cash - - - - - - (18.2) 18.2 - - - - - - - - -
Business acquisitions, net of cash acquired (36.3) (165.5) (17.5) - (272.2) (20.4) (2.1) - - (85.9) (88.0) 0.1 - 0.1 - - -
Other (1.0) (0.9) (0.1) - - - - - - - - - - - - - -
CFI (57.2) (188.3) (42.7) (24.1) (295.5) (17.3) (29.4) 8.1 (2.9) (89.8) (114.0) (3.8) (5.1) (13.0) (14.0) (35.9) (38.1) (39.2) (40.3)
FCF from operations 88.8 105.5 101.3 90.6 111.5 81.7 (31.1) 19.7 54.7 58.8 102.1 (14.9) 12.9 56.5 46.1 100.6 134.9 139.3 148.2
Unlevered FCF 103.0 122.0 117.8 104.8 124.5 97.1 (27.2) 23.1 57.7 62.4 116.1 (11.8) 16.2 59.4 49.0 112.7 146.6 151.1 160.2
FCF per share 2.37$ 2.81$ 2.81$ 2.54$ 3.15$ 2.34$ (0.90)$ 0.57$ 1.59$ 1.70$ 2.96$ (0.43)$ 0.37$ 1.64$ 1.34$ 2.92$ 3.91$ 4.04$ 4.30$
Proceeds from long-term borrowings 75.0 184.0 9.2 - 275.0 - 300.0 230.0 - 158.8 688.8 10.0 10.0 20.0 - - -
Payments of long-term debt (50.9) (168.0) (23.9) (77.2) (2.3) (2.0) (275.4) (225.3) (0.4) (113.3) (614.4) (38.9) (87.4) (126.3) - - -
Payment of capital leases and other (1.2) (2.6) (2.9) (4.8) (3.6) (4.0) (0.5) (0.6) (0.5) (0.3) (1.9) (3.3) (1.0) (4.3) - - -
Proceeds from share transactions under employee stock plans 3.4 5.4 17.8 11.9 11.8 2.5 0.6 2.1 4.6 0.9 8.2 0.3 0.2 0.5 - - -
Tax benefit of stock awards exercised 0.2 0.8 0.9 1.3 2.0 0.3 - 0.2 0.2 - 0.4 - - - - - -
Payments to repurchase common stock - (27.2) (65.8) (23.0) (39.6) (44.6) (12.5) (5.1) (4.6) (4.6) (26.8) (4.4) (4.6) (9.0) - - -
Debt issuance costs (3.2) - - - (2.0) - (2.1) - - - (2.1) - - - - - -
Dividends (16.4) (16.3) (16.0) (17.7) (20.5) (23.1) (5.9) (6.1) (6.2) (6.3) (24.5) (6.2) (6.6) (6.6) (6.6) (25.9) (26.2) (26.2) (26.2)
Other - - - - - - - - - - - - - - - - -
CFF 6.9 (23.9) (80.7) (109.5) 220.8 (70.9) 4.2 (4.8) (6.9) 35.2 27.7 (42.5) (89.4) (6.6) (6.6) (145.0) (26.2) (26.2) (26.2)
Effect of exchange rates (2.7) 7.3 3.2 4.1 (27.3) (26.1) 10.3 (5.7) (0.1) (14.1) (9.6) 4.0 6.9 10.9 - - -
Net cash used in operating activities of discontinued operations 5.5 (1.9) 1.4 (0.1) - - - - - - - - - - - - -
Net cash provided by investing activities of discontinued operations 5.1 - 8.1 7.9 - - - - - - - - - - - - -
Beginning cash 258.2 329.2 250.6 271.3 267.9 301.1 296.2 259.4 286.7 338.6 296.2 338.4 287.0 217.5 267.5 338.4 307.0 415.7 528.7
Change in cash 71.0 (78.6) 21.2 (3.4) 33.2 (4.9) (36.8) 27.3 51.9 (0.2) 42.2 (51.4) (69.5) 50.0 39.5 (31.4) 108.7 113.1 122.0
Ending cash 329.2 250.6 271.3 267.9 301.1 296.2 259.4 286.7 338.6 338.4 338.4 287.0 217.5 267.5 307.0 307.0 415.7 528.7 650.7
End of period summary
Cash and equivalents 329.2 250.6 271.8 267.9 301.1 296.2 259.4 286.7 338.6 338.4 338.4 287.0 217.5 267.5 307.0 307.0 415.7 528.7 650.7
Equity 901.5 919.8 939.5 1,002.1 912.4 704.9 731.1 733.8 756.4 736.3 736.3 757.0 797.2 796.8 821.3 821.3 919.8 1,027.3 1,144.4
Total debt 378.7 399.4 384.6 307.7 579.7 577.3 598.2 603.0 602.9 650.4 650.4 623.6 548.3 548.3 548.3 548.3 548.3 548.3 548.3
Debt as % of capital 29.6% 30.3% 29.0% 23.5% 38.9% 45.0% 45.0% 45.1% 44.4% 46.9% 46.9% 45.2% 40.8% 40.8% 40.0% 40.0% 37.3% 34.8% 32.4%
Net Debt as % of capital 5.2% 13.9% 10.7% 3.8% 23.4% 28.5% 31.7% 30.1% 25.9% 29.8% 29.8% 30.8% 29.3% 26.1% 22.7% 22.7% 12.6% 1.9% -9.8%
Cash and equivalents per share 8.80$ 6.68$ 7.53$ 7.53$ 8.51$ 8.49$ 7.52$ 8.31$ 9.81$ 9.81$ 9.81$ 8.32$ 6.30$ 7.75$ 8.90$ 8.90$ 12.05$ 15.33$ 18.86$
Net Cash and equivalents per share (1.32)$ (3.97)$ (3.12)$ (1.12)$ (7.87)$ (8.05)$ (9.82)$ (9.17)$ (7.66)$ (9.04)$ (9.04)$ (9.76)$ (9.59)$ (8.14)$ (6.99)$ (6.99)$ (3.84)$ (0.57)$ 2.97$
Source: Company reports, Stifel estimates
Watts Water Technologies, Inc.WTS – NYSE
Water TechnologiesInitiation of Coverage
September 18, 2017
24

Watts Water Technologies, Inc. (WTS)
Balance Sheet
($ in mils, except per share data)
December Fiscal Year End
2010 2011 2012 2013 2014 2015 2016 1Q17 2Q17 3Q17 4Q17 2017 2018 2019 2020
A A A A A A A A A E E E E E E
Cash and equivalents 329.2 250.6 271.8 267.9 301.1 296.2 338.4 287.0 217.5 267.5 307.0 307.0 415.7 528.7 650.7
Restricted Cash/ Short-term investment securities 4.0 4.1 2.1 - - - - - - - - - -
Trade receivables, net 186.9 207.1 207.1 212.9 207.8 186.4 198.0 211.4 245.5 230.7 217.7 217.7 222.3 228.5 234.9
Inventories, net 265.6 284.2 290.7 310.2 291.6 240.0 239.4 255.1 258.8 250.0 250.0 250.0 255.4 262.5 269.8
Prepaid expenses and other assets 18.4 26.6 22.7 35.0 27.4 46.1 40.5 41.9 37.0 45.0 44.5 44.5 45.5 46.7 48.1
Deferred income taxes 41.1 37.4 21.6 29.8 45.3 38.4 38.6 - - - - - -
Assets held for sale 10.0 4.6 - 1.3 1.1 1.9 3.1 3.0 2.9 2.9 2.9 2.9 2.9 2.9 2.9
Other current assets 1.8 - - - - - - - - - - - - - -
Total current assets 857.0 814.6 816.0 857.1 874.3 809.0 858.0 798.4 761.7 796.1 822.1 822.1 941.7 1,069.4 1,206.5
PP&E, net 197.5 226.7 223.6 219.9 203.3 184.4 189.7 189.8 191.6 184.3 190.6 190.6 196.2 201.9 207.8
Goodwill 428.0 490.4 508.2 514.8 639.0 489.0 532.7 537.0 544.7 544.7 544.7 544.7 544.7 544.7 544.7
Intangible assets, net 152.6 154.6 146.6 132.4 210.1 192.8 202.5 197.9 194.6 189.4 184.1 184.1 165.7 150.9 136.5
Deferred income taxes 0.9 1.1 4.8 3.8 4.7 3.7 1.5 2.3 2.7 1.8 1.6 1.6 1.7 1.7 1.8
Other, net 10.1 10.1 9.8 12.2 16.6 13.9 15.9 16.8 16.6 16.6 16.6 16.6 16.6 16.6 16.6
Total assets 1,646.1 1,697.5 1,709.0 1,740.2 1,948.0 1,692.8 1,800.3 1,742.2 1,711.9 1,732.9 1,759.7 1,759.7 1,866.6 1,985.3 2,113.8
Accounts payable 113.9 126.5 131.6 145.6 120.8 101.7 101.1 104.2 110.1 110.0 110.0 110.0 112.4 115.5 118.7
Accrued expenses and other liabilities 115.6 109.2 116.8 135.2 138.8 145.7 136.8 124.9 122.3 130.0 130.0 130.0 132.8 136.5 140.3
Accrued pension plan settlements - - - - 40.0 - - - - - - - - - -
Accrued compensation and benefits 42.6 45.9 42.5 43.9 44.2 46.5 48.5 40.6 45.8 48.4 53.3 53.3 54.5 56.0 57.6
Current portion of long-term debt 0.7 2.0 77.1 2.2 1.9 1.1 139.1 117.8 37.9 37.9 37.9 37.9 37.9 37.9 37.9
Other current liabilities 5.8 - - - - - - - - - - - - - -
Total current liabilities 278.6 283.6 368.0 326.9 345.7 295.0 425.5 387.5 316.1 326.3 331.2 331.2 337.5 345.9 354.5
Long-term debt, net of current portion 378.0 397.4 307.5 305.5 577.8 576.2 511.3 505.8 510.4 510.4 510.4 510.4 510.4 510.4 510.4
Deferred income taxes 40.1 58.2 45.2 45.9 77.4 71.8 85.7 53.4 51.2 51.2 51.2 51.2 52.3 53.8 55.3
Other noncurrent liabilities 47.9 38.5 48.8 59.8 34.7 44.9 41.5 38.5 37.0 48.2 45.6 45.6 46.6 47.9 49.2
Total Liabilities 744.6 777.7 769.5 738.1 1,035.6 987.9 1,064.0 985.2 914.7 936.1 938.4 938.4 946.8 957.9 969.4
Preferred - - - - - - - - - - - - - - -
Common Class A 3.0 2.9 2.9 2.9 2.9 2.8 2.8 2.8 2.8 2.8 2.8 2.8 2.8 2.8 2.8
Common Class B 0.7 0.7 0.6 0.6 0.6 0.6 0.6 0.6 0.6 0.6 0.6 0.6 0.6 0.6 0.6
APIC 405.2 420.1 448.7 473.5 497.4 512.0 535.2 539.5 543.7 543.7 543.7 543.7 543.7 543.7 543.7
Retained earnings 492.9 515.1 498.1 513.1 500.6 317.7 348.5 356.9 372.1 393.0 412.0 412.0 498.1 593.1 697.4
AOIC (0.3) (19.0) (10.8) 12.0 (89.1) (128.2) (150.8) (142.8) (122.0) (143.3) (137.9) (137.9) (125.4) (112.9) (100.0)
Total equity 901.5 919.8 939.5 1,002.1 912.4 704.9 736.3 757.0 797.2 796.8 821.3 821.3 919.8 1,027.3 1,144.4
Total liabilities and equity 1,646.1 1,697.5 1,709.0 1,740.2 1,948.0 1,692.8 1,800.3 1,742.2 1,711.9 1,732.9 1,759.7 1,759.7 1,866.6 1,985.3 2,113.8
Source: Company reports, Stifel estimates
Watts Water Technologies, Inc.WTS – NYSE
Water TechnologiesInitiation of Coverage
September 18, 2017
25

Important Disclosures and CertificationsI, Nathan Jones, certify that the views expressed in this research report accurately reflect my personal views about the subjectsecurities or issuers; and I, Nathan Jones, certify that no part of my compensation was, is, or will be directly or indirectly relatedto the specific recommendations or views contained in this research report. Our European Policy for Managing ResearchConflicts of Interest is available at www.stifel.com.
Watts Water Technologies, Inc. (WTS) as of September 18, 2017 (in USD)
Pric
e (U
SD
)
75
70
65
60
55
50
45
40Jul-14 Oct-14 Jan-15 Apr-15 Jul-15 Oct-15 Jan-16 Apr-16 Jul-16 Oct-16 Jan-17 Apr-17 Jul-17 Oct-17
Powered by: BlueMatrix*Represents the value(s) that changed.B=Buy; H=Hold; S=Sell; D=Discontinued; SU=Suspended; D=Discontinued; I=Initiation
For a price chart with our ratings and target price changes for WTS go tohttp://stifel2.bluematrix.com/sellside/Disclosures.action?ticker=WTS
Stifel or an affiliate expects to receive or intends to seek compensation for investment banking services from Watts Water Technologies,Inc. in the next 3 months.
Stifel or an affiliate is a market maker or liquidity provider in the securities of Watts Water Technologies, Inc..The equity research analyst(s) responsible for the preparation of this report receive(s) compensation based on various factors, includingStifel’s overall revenue, which includes investment banking revenue.Our investment rating system is three tiered, defined as follows:
BUY -We expect a total return of greater than 10% over the next 12 months with total return equal to the percentage price change plusdividend yield.
HOLD -We expect a total return between -5% and 10% over the next 12 months with total return equal to the percentage price changeplus dividend yield.
SELL -We expect a total return below -5% over the next 12 months with total return equal to the percentage price change plus dividend yield.
Occasionally, we use the ancillary rating of SUSPENDED (SU) to indicate a long-term suspension in rating and/or target price, and/orcoverage due to applicable regulations or Stifel policies. SUSPENDED indicates the analyst is unable to determine a “reasonable basis”for rating/target price or estimates due to lack of publicly available information or the inability to quantify the publicly available informationprovided by the company and it is unknown when the outlook will be clarified. SUSPENDED may also be used when an analyst has leftthe firm.
Of the securities we rate, 49% are rated Buy, 41% are rated Hold, 2% are rated Sell and 8% are rated Suspended.
Within the last 12 months, Stifel or an affiliate has provided investment banking services for 20%, 7%, 0% and 14% of the companieswhose shares are rated Buy, Hold, Sell and Suspended, respectively.
Additional Disclosures
Please visit the Research Page at www.stifel.com for the current research disclosures and respective target price methodology applicableto the companies mentioned in this publication that are within Stifel's coverage universe. For a discussion of risks to target price please seeour stand-alone company reports and notes for all stocks.
The information contained herein has been prepared from sources believed to be reliable but is not guaranteed by us and is not a completesummary or statement of all available data, nor is it considered an offer to buy or sell any securities referred to herein. Opinions expressed are
Watts Water Technologies, Inc.WTS – NYSE
Water TechnologiesInitiation of Coverage
September 18, 2017
26

subject to change without notice and do not take into account the particular investment objectives, financial situation or needs of individualinvestors. Employees of Stifel, or its affiliates may, at times, release written or oral commentary, technical analysis or trading strategies thatdiffer from the opinions expressed within. Past performance should not and cannot be viewed as an indicator of future performance.
As a multi-disciplined financial services firm, Stifel regularly seeks investment banking assignments and compensation from issuers forservices including, but not limited to, acting as an underwriter in an offering or financial advisor in a merger or acquisition, or serving as aplacement agent in private transactions.
Affiliate Disclosures
“Stifel”, includes Stifel Nicolaus & Company (“SNC”), a US broker-dealer registered with the United States Securities and ExchangeCommission and the Financial Industry National Regulatory Authority and Stifel Nicolaus Europe Limited (“SNEL”), which is authorized andregulated by the Financial Conduct Authority (“FCA”), (FRN 190412) and is a member of the London Stock Exchange.
Registration of non-US Analysts: Any non-US research analyst employed by SNEL contributing to this report is not registered/qualifiedas a research analyst with FINRA and is not an associated person of the US broker-dealer and therefore may not be subject to FINRARule 2241 or NYSE Rule 472 restrictions on communications with a subject company, public appearances, and trading securities held bya research analyst account.
Country Specific and Jurisdictional Disclosures
United States: Research produced and distributed by SNEL is distributed by SNEL to “Major US Institutional Investors” as defined in Rule15a-6 under the US Securities Exchange Act of 1934, as amended. SNC may also distribute research prepared by SNEL directly to USclients, including US clients that are not Major US Institutional Investors. In these instances, SNC accepts responsibility for the content.SNEL is a non-US broker-dealer and accordingly, any transaction by a US client in the securities discussed in the document must be effectedby SNC. US clients wishing to place an order should contact their SNC representative.
Canadian Distribution: Research produced by SNEL is distributed in Canada by SNC in reliance on the international dealer exemption.This material is intended for use only by professional or institutional investors. None of the investments or investment services mentioned ordescribed herein is available to other persons or to anyone in Canada who is not a “permitted client” as defined under applicable Canadiansecurities law.
UK and European Economic Area (EEA): This report is distributed in the EEA by SNEL, which is authorized and regulated in the UnitedKingdom by the FCA. In these instances, SNEL accepts responsibility for the content. Research produced by SNEL is not intended for useby and should not be made available to non-professional clients.
The complete preceding 12-month recommendations history related to recommendation(s) in this research report is available at https://stifel2.bluematrix.com/sellside/MAR.action
Brunei: This document has not been delivered to, registered with or approved by the Brunei Darussalam Registrar of Companies, Registrarof International Business Companies, the Brunei Darussalam Ministry of Finance or the Autoriti Monetari Brunei Darussalam. This documentand the information contained within will not be registered with any relevant Brunei Authorities under the relevant securities laws of BruneiDarussalam. The interests in the document have not been and will not be offered, transferred, delivered or sold in or from any part of BruneiDarussalam. This document and the information contained within is strictly private and confidential and is being distributed to a limitednumber of accredited investors, expert investors and institutional investors under the Securities Markets Order, 2013 ("Relevant Persons")upon their request and confirmation that they fully understand that neither the document nor the information contained within have beenapproved or licensed by or registered with the Brunei Darussalam Registrar of Companies, Registrar of International Business Companies,the Brunei Darussalam Ministry of Finance, the Autoriti Monetari Brunei Darussalam or any other relevant governmental agencies withinBrunei Darussalam. This document and the information contained within must not be acted on or relied on by persons who are not RelevantPersons. Any investment or investment activity to which the document or information contained within is only available to, and will be engagedin only with Relevant Persons.
In jurisdictions where Stifel is not already licensed or registered to trade securities, transactions will only be affected in accordance withlocal securities legislation which will vary from jurisdiction to jurisdiction and may require that a transaction is carried out in accordancewith applicable exemptions from registration and licensing requirements. Non-US customers wishing to effect transactions should contact arepresentative of the Stifel entity in their regional jurisdiction except where governing law permits otherwise. US customers wishing to effecttransactions should contact their US salesperson.
The recommendation contained in this report was produced at 18 September 2017 16:03EDT and disseminated at 18 September 201716:03EDT.
Additional Information Is Available Upon Request
Watts Water Technologies, Inc.WTS – NYSE
Water TechnologiesInitiation of Coverage
September 18, 2017
27

© 2017 Stifel. This report is produced for the use of Stifel customers and may not be reproduced, re-distributed or passed to any otherperson or published in whole or in part for any purpose without the prior consent of Stifel. Stifel, Nicolaus & Company, Incorporated, OneSouth Street, Baltimore, MD 21202.
Watts Water Technologies, Inc.WTS – NYSE
Water TechnologiesInitiation of Coverage
September 18, 2017
28