with oracle database 12c release 2€¦ · 5 | database manageability the automatic workload...
TRANSCRIPT

Database Manageability
With Oracle Database 12c Release 2
O R A C L E W H I T E P A P E R | D E C E M B E R 2 0 1 6

DATABASE MANAGEABILITY
Disclaimer
The following is intended to outline our general product direction. It is intended for information
purposes only, and may not be incorporated into any contract. It is not a commitment to deliver any
material, code, or functionality, and should not be relied upon in making purchasing decisions. The
development, release, and timing of any features or functionality described for Oracle’s products
remains at the sole discretion of Oracle.

1 | DATABASE MANAGEABILTY
Table of Contents
Disclaimer 1
Introduction 3
Manageability Challenges 3
Performance Management and Application Tuning 4
Performance Diagnostics 4
Application Tuning 4
Manageability Solutions 4
Automatic Workload Repository 4
AWR Warehouse 5
Automatic Database Diagnostics Monitor (ADDM) 5
Real-Time ADDM 6
Compare Period ADDM 6
AWR Baselines and Adaptive Thresholds 6
Real Time Performance Analysis with ASH Analytics 7
SQL Tuning Advisor 8
SQL Access Advisor 9
Real-Time SQL Monitoring 9
Database Operations Monitoring 10
Performance Hub 11
SQL Plan Management 11
Oracle Enterprise Manager Database Express 12

2 | DATABASE MANAGEABILITY
Real Application Testing 12
Response Time Testing using SQL Performance Analyzer 12
SPA Quick Check: Optimized for use on production systems 13
Throughput Testing using Database Replay 14
Lower Test Infrastructure Cost 14
Consolidation Testing using Consolidated Database Replay 15
Database Replay Workload Scale-Up 15
Enhanced PL/SQL Support 16
Ongoing Administration 16
Resource Management 16
Automatic Memory Management 16
Space Management 16
Proactive Space Management 16
Transparent Space Reclamation 17
Segment Creation on Demand 17
Compression Advisor 17
Exadata Management and Cloud Consolidation 17
Integrated System Monitoring 17
Fault Diagnostics 18
Support Workbench 19
What does it mean to you? 20
Conclusion 20

3 | DATABASE MANAGEABILITY
Introduction
Oracle Database is the market-leader and preferred database for hundreds of thousands of
businesses as well as for application developers and database administrators worldwide. Over the
years, enterprises have come to rely on the Oracle database to provide unparalleled performance and
reliability. In Oracle Database 10g, Oracle delivered a self-managing database with breakthrough
manageability that dramatically increased IT productivity and reduced management costs. In Oracle
Database 11g, Oracle added capabilities to perform database testing using production workloads as
well as the ability to monitor database queries automatically. Oracle is ready to raise the bar once
again with the release of Oracle Database 12c. The built-in features of Oracle Database 12c cater to
data center environments that are rapidly evolving and continuously changing to keep up with the
demands of consolidation and cloud computing. In addition, building on its industry-leading self-
managing capabilities, Oracle Database 12c has made significant advances in the areas of
manageability, testing, and fault diagnostics that address many of the top challenges facing
businesses today. Oracle Database is now also available in the Oracle Database Cloud Service and it
is 100% compatible with those deployed on-premise, while supporting an efficient Hybrid Cloud
strategy for a smooth transition to the Cloud.
Oracle Enterprise Manager 13c streamlines and automates complex management tasks across the
complete cloud lifecycle. On-premise administrators can monitor and manage public cloud services,
and vice versa through a single pane of glass. Oracle Database Cloud services are managed by the
same Oracle Enterprise Manager tools that customers use for on-premise to monitor, provision, and
maintain the entire Oracle eco-system including a variety of third-party systems. These include Oracle
Databases, Engineered Systems, Oracle Applications, Oracle Middleware, and a variety of third-party
plug-ins and connectors. This strategy eliminates the costly consequences of purchasing and learning
numerous new tools to manage enterprise hybrid clouds.
Manageability Challenges
When managing a large number of databases in an enterprise, the areas that continue to pose the biggest
management challenges to database administrators include:
» Database performance diagnostics and tuning: How to maintain production databases at their peak performance
to maintain committed service levels
» Testing and test data management: How to reduce the risk of rolling out changes through testing and managing
test data in Oracle Database environments at lower costs.

4 | DATABASE MANAGEABILITY
» Ongoing administration: How to automate day-to-day repetitive tasks so that labor can be freed up to focus on
more strategic requirements, such as security, data center consolidation and business continuity. How to use
existing tools to monitor, manage, and tune database services on the Cloud.
» Cloud consolidation and Exadata management: How to consolidate databases onto a common infrastructure to
reduce data center costs and increase server efficiency. How to estimate required compute resources when
consolidating on-premise or to Cloud.
To address these challenges, Oracle Database 12c has been significantly enhanced in the areas of performance,
change assurance, and Cloud support to make it easier to manage than ever before.
Performance Management and Application Tuning
Performance management has traditionally been a major challenge for database administrators. Oracle Database
12c continues to expand its self-managing capabilities in all areas, including the two key aspects of database
performance management: performance diagnostics and application tuning.
Performance Diagnostics
Performance issues reported in a database can be broadly classified under the following four categories
1. Persistent performance problems
2. Transient performance problems
3. Comparative performance problems
4. Real-Time performance problems
Application Tuning
Application design issues are the most predominant cause of performance problems. The query optimizer makes
crucial decisions that have a tremendous impact on the performance of a query, such as whether to use an index or
not, which join techniques to use if the query involves joining multiple tables, etc. While Oracle Database attempts to
provide the best possible query optimization technology, which maximizes the application/query performance
without any administrator intervention in the majority of cases, there may still be cases where the design of the
application or a skew in data distribution may cause certain SQL statements to consume an unusually high
percentage of total system resources.
Manageability Solutions
In the subsequent sections we will explore how the Oracle Database addresses these issues.
The steps to achieve good performance are to gather the right data, make a proper analysis, and derive an effective
action plan. The Oracle Database self-management framework performs these tasks for the DBA, making
performance diagnostics simple and routine. The Automatic Workload Repository gathers the required data and the
Automatic Database Diagnostics Monitor analyzes the data and makes targeted, concrete and actionable
recommendations. Oracle provides database administrators the option to use Oracle Enterprise Manager Cloud
Control for managing many databases from a single console or use Enterprise Manager Database Express that is
integrated with the Oracle database for managing a specific target, be it on-premise or cloud.
Enterprise Manager Cloud Control now provides you with a single pane of glass for monitoring and managing on-
premise, Oracle Cloud, and Oracle Cloud Machine deployments, all from the same management console.
Automatic Workload Repository

5 | DATABASE MANAGEABILITY
The Automatic Workload Repository (AWR) is a built-in repository within every Oracle Database that contains
operational statistics about that particular database and other configuration and usage information. At regular
intervals, the Oracle Database takes a snapshot of all its performance statistics and workload information and stores
it in AWR. By default, the snapshots are made every 60 minutes and are stored in the AWR for an 8-day period,
after which they are automatically purged.
AWR forms the foundation for most of the self-management functionality of Oracle Database. It is the source of
information that gives the Oracle Database a historical perspective on how it is being used and enables it to make
decisions, which are accurate and specifically tailored for the system’s environment. Most of the self-managing
features of the Oracle Database rely heavily on the information captured in AWR. The data in AWR is useful for
diagnosing all types of performance issues ranging from persistent or comparative performance diagnosis.
AWR has been enhanced in Oracle Database 12c Release 2 to better support Multitenant architecture by allowing
per PDB snapshot control and reporting. Additionally, the ability to monitor Active Data Guard (standby) database
workload, and persisting reports such as for Real-Time SQL Monitoring, Real-Time ADDM and Database
Operations Monitoring automatically makes the task of performance diagnostics significantly easier for the DBA.
AWR Warehouse
Beyond ongoing performance management, enterprises are also interested in analyzing their database performance
data over a longer time periods for tasks such as capacity planning or identifying trends or patterns affecting
performance in their mission critical databases. Oracle Enterprise Manager now provides the ability to transfer the
performance data from AWR across all enterprise databases into a central performance warehouse called AWR
Warehouse.
AWR Warehouse allows DBAs and capacity planners to get answers to questions such as what was the
performance of the database this quarter compared the same quarter last year or whether database servers in the
next 6 months could support the growth in resource utilization of the databases running on the servers. Enterprise
Manager completely automates the extraction, transfer and load of the performance data into the AWR warehouse
so that the critical source databases can keep operating at optimal performance without incurring additional storage
overhead. As a result, the DBAs now have all the performance data they need for analysis at their fingertips for all
their critical databases for all time.
Automatic Database Diagnostics Monitor (ADDM)
Persistent performance issues generally last for hours or even days. Poorly written code, application design issues
or over-utilized system resources (e.g. I/O bandwidth fully utilized) etc. usually lead to persistent performance
problems. Automatic Database Diagnostics Monitoring (ADDM), which is built as part of the self-managing
framework of the Oracle Database, is best suited for diagnosing such problems.
ADDM builds upon the data captured in AWR. ADDM makes it possible for the Oracle Database to diagnose its
own performance and determine how any identified problems could be resolved. ADDM runs automatically after
each AWR statistics capture and makes the performance diagnostic data available immediately.
ADDM examines data captured in AWR and performs analysis to determine the major issues on a proactive basis,
recommends solutions and quantifies expected benefits. Some of the common problems detected by ADDM
include: CPU bottlenecks, poor connection management, excessive parsing, lock contention, I/O capacity, under
sizing of Oracle memory structures (such as PGA, buffer cache, log buffer, high load SQL statements), high PL/SQL
and Java time, high checkpoint load and RAC-specific issues.
6 | DATABASE MANAGEABILITY
Besides reporting the potential performance issues, ADDM also documents the non-problem areas of the system.
The sub-components, such as I/O, memory, etc., that are not significantly impacting the performance of the system
are pruned from the classification tree at an early stage and are listed so that the DBA can quickly see that there is
little to be gained by performing actions in those areas. For RAC environments, ADDM provides cluster-wide
performance analyses and reports on issues that are affecting the entire database as well as its individual instances.
DBAs can now use ADDM to perform database-wide analysis of global resources, such as high-load SQL, global
cache interconnect traffic, network latency issues, skew in instance response times, and I/O capacity. With Oracle
Database 12c and Multitenant architecture, ADDM recommendations include the associated pluggable database
(PDB) where the issue has been detected to pinpoint the impacted database.
Real-Time ADDM
Transient performance issues often last for a few seconds or minutes and result in inconsistencies in application
performance. Extremely slow or unresponsive conditions often lead to unplanned outages, which can potentially
result in loss of revenue. It is extremely important to have the right set of tools to capture and analyze the root cause
of these problems.
Real-Time ADDM is an innovative way to analyze problems in extremely slow or unresponsive databases, which
would have traditionally required a database restart. Real-Time ADDM can help resolve issues such as deadlocks,
hangs, and shared pool contention, as well as many other exception situations, without resorting to a restart of the
database.
In Oracle Database 12c, Real-Time ADDM has been enhanced to proactively detect and diagnose performance
spikes. Built inside the database engine, Real-Time ADDM is triggered automatically when a “new” performance
problem is detected in the server. The framework is built using a polling mechanism where a database background
process (MMON) obtains performance statistics without lock or latch every 3 seconds. It then checks these statistics
against past behavior and triggers a report if necessary, which is also stored in the AWR.
Compare Period ADDM
Database administrators are often required to investigate why performance of one time period is slower than a
similar time-period. Such comparative performance problem investigation is often very time consuming and usually
leads to inconclusive results.
Compare Period ADDM makes these investigations very simple. The administrator can choose from an AWR
baseline, the older AWR snapshot period, or any calendar period of choice to determine why database performance
during a particular period is slower than another period. Compare Period ADDM checks both the base period and
the comparison period and lists out a set of findings pinpointing the root cause for the difference in performance. At
the first step the causes behind the performance differences are detected and then measured to quantify the effect
of these differences. In the second step, the causes and effects are correlated to pinpoint a performance issue.
Compare Period ADDM also indicates whether the two periods are comparable, i.e. have similar SQL running in the
same period, by the use of the SQL Commonality index for the two periods.
AWR Baselines and Adaptive Thresholds
AWR baselines allow DBAs to capture and save system performance data over time periods with interesting or
representative workloads. This data is very useful in running comparative analysis across multiple time periods or
after introducing any configuration or parameter changes.
In addition, DBAs can use baselines to set alert thresholds on system performance metrics. Most metrics can be
viewed in Oracle Enterprise Manager against statistical aggregates of those same metrics observed over the

7 | DATABASE MANAGEABILITY
baseline period. This helps users set baseline-informed thresholds rather than selecting thresholds without the
context of actual data. In addition, adaptive thresholds are available for certain key performance metrics. Adaptive
thresholds are performance alert thresholds that are automatically set and periodically adjusted by the system using
the System Moving Window Baseline data as the basis for threshold determination. AWR baselines provide powerful
capabilities for defining dynamic and future baselines and considerably simplify the process of creating and
managing performance data for comparison purposes.
Adaptive Thresholds can be used in two ways to help administrators set threshold values for metrics. The first
method involves fully employing Adaptive Thresholds and letting Enterprise Manager set thresholds automatically
based on settings within the tool. The second method allows end users to see the values Enterprise Manager
recommends in a manual mode without automatically updating the thresholds.
Setting threshold values for Key Performance Indicators for an Exadata system can be time consuming and difficult.
This is especially true in situations where administrators have new system types or are responsible for setting up
monitoring for systems for which they are not directly responsible. By using the adaptive thresholds methodology,
administrators can determine thresholds in a quick, easy and accurate manner
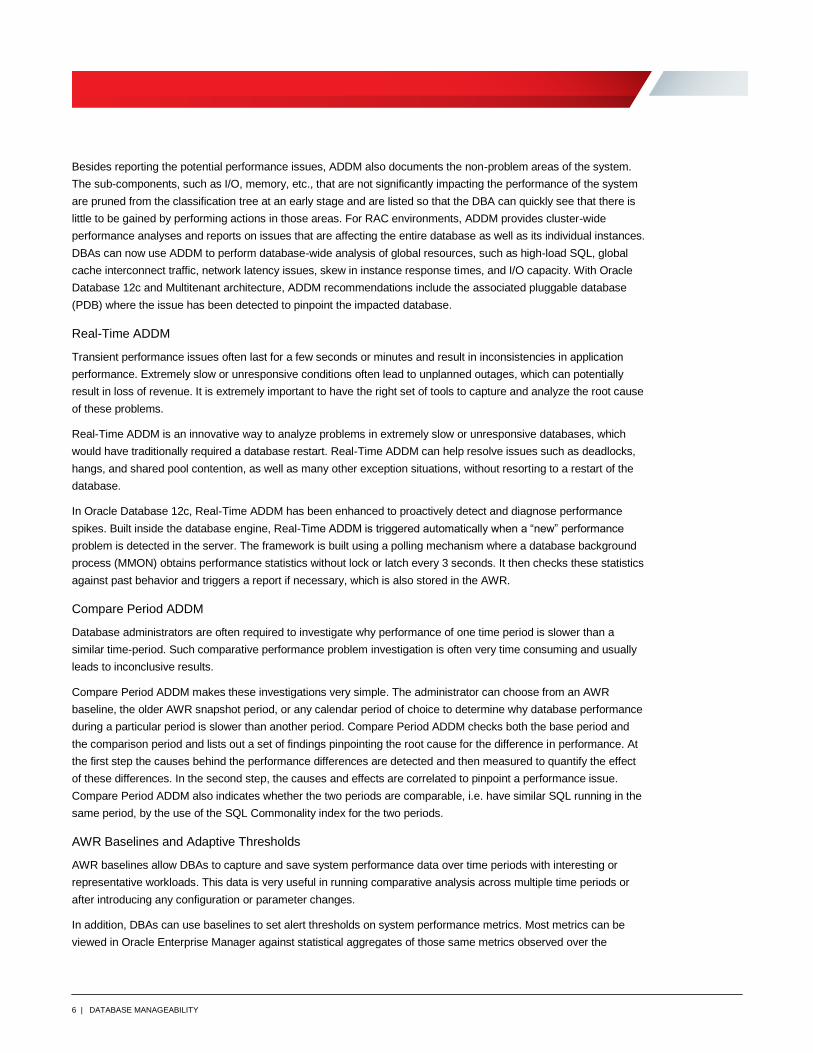
Real Time Performance Analysis with ASH Analytics
A key component of AWR is the Active Session History (ASH).
All active database sessions are automatically sampled once every second and stored in ASH. The data is captured
in a rolling buffer in database memory and once the buffer is filled or after 60 minutes, which ever happens first, the
data is written to disk. When the data is written to disk 1 out of every 10 samples is written to minimize the footprint
on disk. The ASH data shows where the database is currently spending its time and highlights any performance
bottlenecks.
As ASH captures the session state with many performance attributes, the in-memory ASH data can be very
effectively used to understand the database workload profile and proactively diagnose any transient performance
issue, such as a CPU spike or an I/O storm that occurs for a very short duration. Oracle Enterprise Manager Cloud
Control 13c includes ASH Analytics, a tool to explore ASH data that allows the administrator to roll up, drill down,
and slice or dice performance data across various performance dimensions. Using ASH Analytics, the database
administrator can explore the different performance attributes of a database session at any point in time.
The ASH Analytics view is also available as an active report that can be used for offline analysis of any performance
issues at a later point in time. The ASH Analytics pages are also available in Oracle Enterprise Manager Database
Express and are accessible from the Performance Hub, which provides a consolidated view of all performance data
for a given time range.
8 | DATABASE MANAGEABILITY
Figure 1: ASH Analytics
For Oracle Database 12c targets, ASH Analytics also captures a PDB as a dimension so that a CDB administrator
can drill down into the performance activity of a particular PDB. The PDB administrators also have access to ASH
Analytics that allows them to view the workload profile for their own PDBs.
SQL Tuning Advisor
ADDM identifies SQL statements that are consuming unusually high system resources and are therefore causing
performance problems. In addition, the top SQL statements in terms of CPU and shared memory consumption are
automatically captured in AWR. Thus, the identification of high load SQL statements happens automatically in the
tuning framework and requires no intervention from the administrator.
After the top resource consuming SQL statements have been identified, Oracle Database can automatically analyze
them and recommend solutions using the added automatic tuning capability of the query optimizer, called the
automatic tuning optimizer. The Automatic Tuning Optimizer is exposed to the database administrator via an advisor
called the SQL Tuning Advisor. The SQL Tuning Advisor takes one or more SQL statements and produces well-
tuned plans along with tuning advice. The administrator does not need to do anything other than invoke the SQL
Tuning Advisor to recommend the optimal tuning solution. It is important to bear in mind that the solution is coming
right from the optimizer and not from external tools that use pre-defined heuristics.

9 | DATABASE MANAGEABILITY
The recommendation of the automatic tuning optimizer can fall into one of the following categories:
Category Details
Statistics Analysis Checks each query object for statistics and recommends to gather them if they are missing or stale.
SQL Profiling The automatic tuning optimizer builds a SQL profile using auxiliary information, such as customized optimizer
settings or past execution history, and generates a recommendation to create the SQL profile. The most powerful
aspect of SQL profiles is that they enable transparent tuning of queries without requiring any application changes
to allow Oracle administrators to tune SQL in packaged applications.
Access path Analysis The automatic tuning optimizer explores whether a new index can be used to significantly improve access to each
table in the query, and when appropriate makes recommendations to create such indexes.
SQL Structure
Analysis
Identifies poorly written SQL statements that lend themselves to bad plans, and makes relevant recommendations
to restructure them.
Alternative Plan
Analysis
While tuning a SQL statement, SQL Tuning Advisor searches real-time and historical performance data for better
alternative execution plans for the statement. If plans other than the original plan exist, then SQL Tuning Advisor
reports an alternative plan finding.
The SQL Tuning Advisor also runs automatically during the system maintenance windows as a maintenance task. In
each run, it automatically selects high-load SQL queries in the system and generates recommendations for tuning
them.
To validate a recommendation, SQL Tuning Advisor in Oracle Database performs a test-execute of the SQL
statements with the new execution plan for which a SQL profile is recommended. This dramatically increases the
accuracy and reliability of SQL profile recommendations. The SQL Tuning Advisor can be configured to
automatically implement SQL profile recommendations for SQL statements where the performance improvement
would be at least three-fold.
SQL Tuning Advisor functionality in Oracle Database 12c has been enhanced to seamlessly support tuning at both
the CDB and PDB level. SQL Tuning Advisor is CDB-aware, it can be successfully used in the root container to tune
queries across PDBs. At a same time, PDB administrators can also use the SQL Tuning Advisor to tune queries for
their individual PDBs. Oracle Database 12c Release 2 introduces the ability to tune SQL workload running on Active
Data Guard (standby) databases.
SQL Access Advisor
The SQL Access Advisor is another major component of Oracle Database manageability. The SQL Access Advisor
takes a database workload as its input and recommends adding various access structures. While generating
recommendations, the SQL Access Advisor considers the impact of adding new indexes, materialized views or
materialized view logs etc. on data manipulation activities, such as insert, update and delete, in addition to the
performance improvement they are likely to provide for queries.
The partition advisor, which has been part of the SQL Access Advisor since Oracle Database 11g, has been
enhanced in Oracle Database 12c. Along with advice on range, interval and hash based partitions; the partition
advisor can now also recommend list based partition schemes.
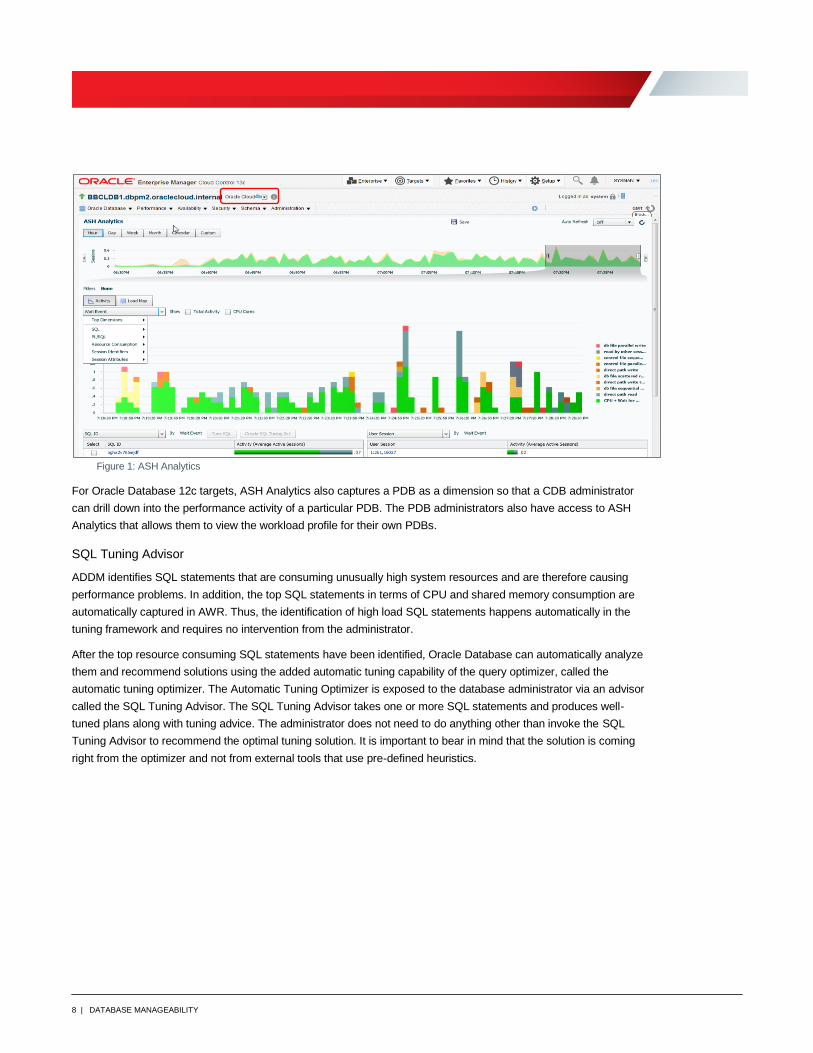
Real-Time SQL Monitoring
Part of Real-Time performance analysis involves examining the execution details of an in-flight query to determine
why a query is taking a long time to run. Traditionally, this analysis has been done using reactive methods like SQL
tracing, but the addition of Real Time SQL Monitoring enables you to monitor SQL statements while they are
executing. Live execution plans of long running SQL are automatically displayed on the SQL Monitor page in Oracle
Enterprise Manager using new, fine-grained SQL statistics that are tracked out-of-the-box.
10 | DATABASE MANAGEABILITY
By default, SQL monitoring is automatically initiated when a SQL statement runs in parallel, or when it has
consumed at least 5 seconds of CPU or I/O time in a single execution. The DBA can observe the SQL statement
step through the execution plan, displaying statistics for each step as it executes. SQL monitoring gives the DBA
information on what steps long running SQL are executing and allows the DBA to decide if additional tuning is
required.
Figure 2: Real Time SQL Monitoring execution plan
In addition to being able to monitor SQL and PL/SQL statements in real time in Oracle Database 12c Release 2, the
DBA can also save all the execution details in an active report - an interactive report that can be used for offline
analysis. It offers the same level of interactivity as the live screens, with drill-downs to various levels of detail. Real-
Time SQL Monitoring in Oracle Database works at the CDB as well as at the PDB level.
Database Operations Monitoring
While Real-Time SQL monitoring allows the DBA to monitor individual SQL and PL/SQL statements, there
previously was no way to tie them to business operations. Real-Time Database Operations Monitoring, a new
feature in Oracle Database 12c, combines the capability to monitor both SQL and PL/SQL with the ability to monitor
long running database tasks such as batch jobs, ETLs etc. as a composite business operation. Live visual displays
track the progress of SQL and PL/SQL queries associated with the business operation being monitored. Developers
or DBAs can define business operations for monitoring by explicitly specifying the start and end of the operation or
implicitly through the use of tags that identify the operation. With negligible overhead compared to SQL trace,
Database Operations Monitoring can be used to proactively monitor critical business transactions automatically
without any DBA intervention.
Oracle Database 12c Release 2 supports enabling Database Operations Monitoring for already running sessions,
this helps avoid restarting sessions to get performance diagnostic information for trouble shooting purposes.

11 | DATABASE MANAGEABILITY
Figure 3: A Real-Time Database Operations Monitoring Report
Performance Hub
Database Performance Hub, a completely new unified interface for performance monitoring is available through
Oracle Enterprise Manager Database Express (discussed below) and Database server API. It is the single pane of
glass view of database performance with access to ADDM, SQL Tuning, Real-Time SQL Monitoring and ASH
Analytics (features discussed in detail above) under the same hood. A flexible time picker allows the administrator to
seamlessly switch between Real-Time and Historical views of database performance. For Oracle Exadata Cloud
databases, there is an additional Exadata tab that allows the database administrator to monitor the related
performance problems.
Figure 4: Performance Hub
SQL Plan Management
SQL plan management prevents performance regressions resulting from sudden changes to the execution plan of a
SQL statement by providing components for capturing, selecting, and evolving SQL executions plans. Various
changes can affect SQL performance, such as a new optimizer version, changes to optimizer statistics and/or

12 | DATABASE MANAGEABILITY
parameters, or creation of SQL profiles. SQL plan management is a preventative mechanism that records and
evaluates the execution plans of SQL statements over time, and builds SQL plan baselines composed of a set of
existing plans known to be efficient. The SQL plan baselines are then used to preserve performance of the
corresponding SQL statements, regardless of changes occurring in the system.
SQL plan baselines evolve over time to produce better performance. During the SQL plan baseline evolution phase,
Oracle Database routinely evaluates the performance of new plans and integrates plans with better performance
into SQL plan baselines. A successful verification of a new plan consists of comparing its performance to that of a
plan selected from the SQL plan baseline and ensuring that it delivers better performance.
Oracle Enterprise Manager Database Express
Oracle Database 12c includes an out of the box web-based database management tool, Oracle Enterprise Manager
Database Express, optimized for performance management. This tool is embedded inside the database and is auto-
configured at the time of installation. With only a 20 MB disk footprint, there is no resource usage when it is not
invoked or used. Oracle Enterprise Manager Database Express can manage both single instance and Oracle Real
Application Clusters (Oracle RAC) databases. The tool also has built in support for container databases (CDBs) and
Oracle Database Cloud Services. Along with in-depth support for performance management features Oracle
Enterprise Manager Database Express can be used for configuration management, storage management and
security management. One of the significant additions is the performance hub, which is discussed below.
Oracle Enterprise Manager Database Express has been enhanced in Oracle Database 12c Release 2 to include
extensive support for resource manager and SQL Performance Analyzer. The support for Database Resource
Manager includes the ability to easily create, manage and monitor resource plans over time in the database.
Support for SQL Performance Analyzer includes support for both SPA Quick Check and standard SPA.
Real Application Testing
Real Application Testing offers an extremely cost-effective and easy-to-use risk free administration tool that enables
businesses to fully assess the outcome of a system change in a production or a test environment, take any
corrective action if necessary, and then to introduce the change safely to production systems, minimizing the
undesirable impact on them. This approach reduces risk. Real Application Testing offers SQL Performance Analyzer
(SPA), SPA Quick Check, Database Replay and Consolidated Database Replay. These features together provide
customers a comprehensive and flexible risk free administration solution that significantly mitigates business risk,
reduces testing costs and future-proofs database infrastructure.
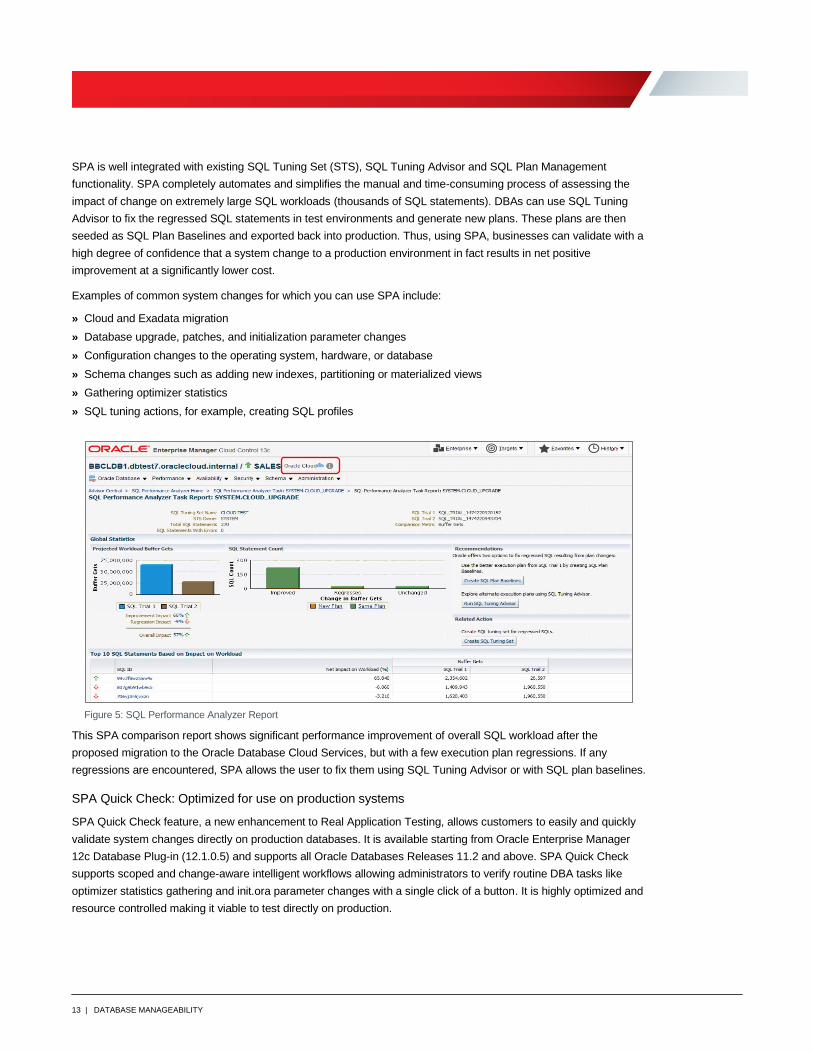
Response Time Testing using SQL Performance Analyzer
Changes that affect SQL execution plans can severely impact application performance and availability. As a result,
DBAs spend enormous amounts of time identifying and fixing SQL statements that have regressed due to the
system changes. SQL Performance Analyzer (SPA) can predict and prevent SQL execution performance problems
caused by environment changes.
SPA provides a granular view of the impact of environment changes on SQL execution plans and statistics by
running the SQL statements serially before and after the changes. SPA generates a report outlining the net benefit
on the workload due to the system change as well as the set of regressed SQL statements. For regressed SQL
statements, appropriate execution plan details along with recommendations to tune them are provided.
13 | DATABASE MANAGEABILITY
SPA is well integrated with existing SQL Tuning Set (STS), SQL Tuning Advisor and SQL Plan Management
functionality. SPA completely automates and simplifies the manual and time-consuming process of assessing the
impact of change on extremely large SQL workloads (thousands of SQL statements). DBAs can use SQL Tuning
Advisor to fix the regressed SQL statements in test environments and generate new plans. These plans are then
seeded as SQL Plan Baselines and exported back into production. Thus, using SPA, businesses can validate with a
high degree of confidence that a system change to a production environment in fact results in net positive
improvement at a significantly lower cost.
Examples of common system changes for which you can use SPA include:
» Cloud and Exadata migration
» Database upgrade, patches, and initialization parameter changes
» Configuration changes to the operating system, hardware, or database
» Schema changes such as adding new indexes, partitioning or materialized views
» Gathering optimizer statistics
» SQL tuning actions, for example, creating SQL profiles
Figure 5: SQL Performance Analyzer Report
This SPA comparison report shows significant performance improvement of overall SQL workload after the
proposed migration to the Oracle Database Cloud Services, but with a few execution plan regressions. If any
regressions are encountered, SPA allows the user to fix them using SQL Tuning Advisor or with SQL plan baselines.
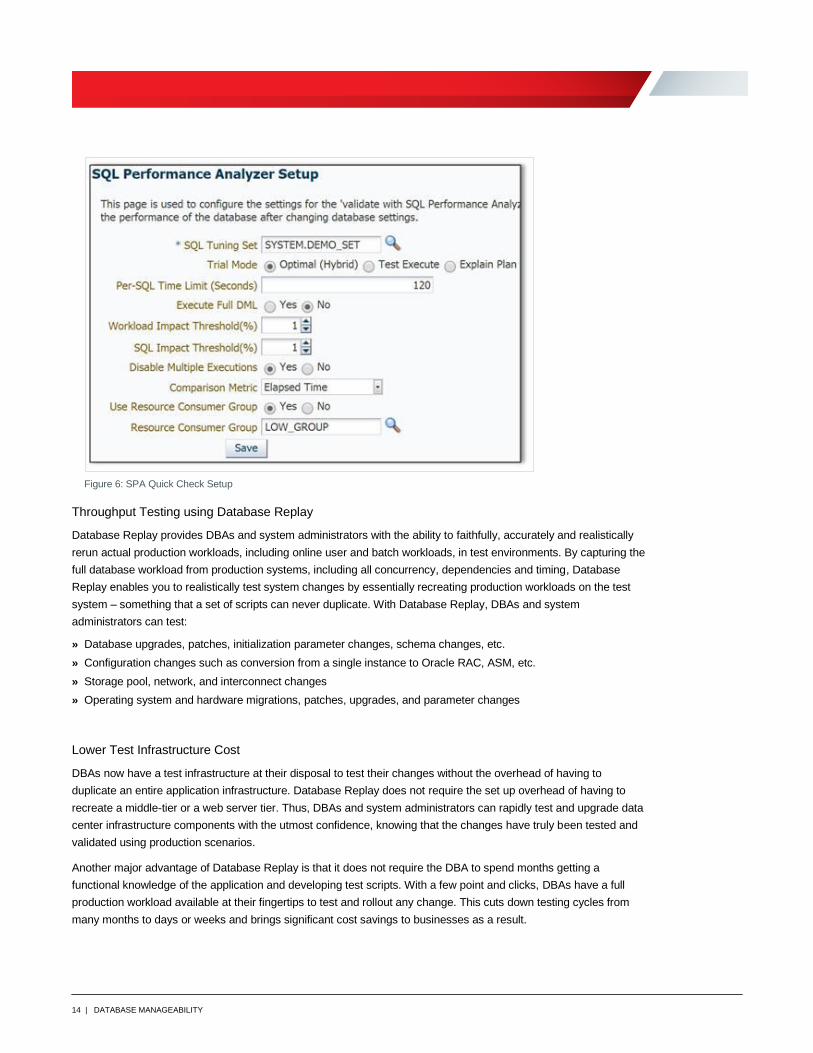
SPA Quick Check: Optimized for use on production systems
SPA Quick Check feature, a new enhancement to Real Application Testing, allows customers to easily and quickly
validate system changes directly on production databases. It is available starting from Oracle Enterprise Manager
12c Database Plug-in (12.1.0.5) and supports all Oracle Databases Releases 11.2 and above. SPA Quick Check
supports scoped and change-aware intelligent workflows allowing administrators to verify routine DBA tasks like
optimizer statistics gathering and init.ora parameter changes with a single click of a button. It is highly optimized and
resource controlled making it viable to test directly on production.
14 | DATABASE MANAGEABILITY
Figure 6: SPA Quick Check Setup
Throughput Testing using Database Replay
Database Replay provides DBAs and system administrators with the ability to faithfully, accurately and realistically
rerun actual production workloads, including online user and batch workloads, in test environments. By capturing the
full database workload from production systems, including all concurrency, dependencies and timing, Database
Replay enables you to realistically test system changes by essentially recreating production workloads on the test
system – something that a set of scripts can never duplicate. With Database Replay, DBAs and system
administrators can test:
» Database upgrades, patches, initialization parameter changes, schema changes, etc.
» Configuration changes such as conversion from a single instance to Oracle RAC, ASM, etc.
» Storage pool, network, and interconnect changes
» Operating system and hardware migrations, patches, upgrades, and parameter changes
Lower Test Infrastructure Cost
DBAs now have a test infrastructure at their disposal to test their changes without the overhead of having to
duplicate an entire application infrastructure. Database Replay does not require the set up overhead of having to
recreate a middle-tier or a web server tier. Thus, DBAs and system administrators can rapidly test and upgrade data
center infrastructure components with the utmost confidence, knowing that the changes have truly been tested and
validated using production scenarios.
Another major advantage of Database Replay is that it does not require the DBA to spend months getting a
functional knowledge of the application and developing test scripts. With a few point and clicks, DBAs have a full
production workload available at their fingertips to test and rollout any change. This cuts down testing cycles from
many months to days or weeks and brings significant cost savings to businesses as a result.

15 | DATABASE MANAGEABILITY
Consolidation Testing using Consolidated Database Replay
New in Oracle Database 12c, Database Replay supports simultaneous execution of multiple database captures on a
single consolidated database. The consolidated database can be a CDB with Oracle Pluggable Databases or a
traditional database consolidated using schema consolidation methods. Replaying multiple workloads against a
consolidated database gives assurance that the target platform can support the workload. Database Replay works
with supports all supported Oracle Database versions. Database Replay can be executed on Oracle Database 11.1
and above. Consolidated Database Replay can be executed on Oracle Database 11.2.0.2 and above. The captures
for Database Replay are platform agnostic and can be replayed on any supported operating system.
In addition, Consolidated Database Replay supports scheduling of the individual replays enabling investigations of
various workload scenarios.
Database Replay Workload Scale-Up
Database Replay also supports the creation of new workloads based on existing captured workloads. The new
workloads can be used for capacity planning and validation of various what-if workload scenarios. Three techniques
that can be used with Database Replay to validate consolidation include Workload Folding, Time Shifting and
Schema Remapping.
The first of these techniques is Workload Folding. Workload subsetting can be used to compose new workloads.
Existing captures can be divided into two smaller workloads by slicing an existing captured workload into subsets by
specifying a point in time within the captured duration. Then you can double the workload by folding the workload
along this specified point-in-time. This is done by submitting simultaneous replays of the subset workloads on the
target database, which effectively doubles the workload without the need to use scripting or supplying binds. This
technique is suitable for applications where individual transactions are mostly independent of each other.
Another scale-up technique is Time Shifting. You can schedule multiple database replays so that their peak
database utilizations are aligned. This allows you to see if your target consolidated system can handle the
maximum production workload from your current production systems.
Database Replay also supports testing with schema duplication. You can duplicate your target schema and run
multiple replays of the same workload. Before running these multiple replays, you remap users so that each replay
goes against its separate schema, avoiding workload collisions. Schema duplication allows you to test multiple
scales of the current workload, maintaining the exact workload profile and concurrency. This is useful in scenarios
such as schema as a service (SaaS) or where each line of business has its own schema.
Test Database Provisioning
Administrators can leverage the provisioning capabilities in Oracle Enterprise Manager to roll out pre-tested,
standardized gold images of Oracle Database. This provides administrators with tremendous labor savings instead
of having to execute each step of the provisioning process manually. These gold images can be used to provision
test systems from backups or live production databases.
When enterprises copy production data into test environments for the purposes of application development or
testing, they risk falling out of compliance with regulations or incurring fines and penalties that accompany violations
of these data privacy laws. The data masking capabilities available to administrators helps organizations comply
with privacy and confidentiality laws by masking sensitive or confidential data in development, test or staging
environments. By using an irreversible process to replace sensitive data with realistic-looking but scrubbed data
based on masking rules, security administrators can ensure that the original data cannot be retrieved, recovered or
restored while maintaining the integrity of the application.

16 | DATABASE MANAGEABILITY
Enhanced PL/SQL Support
In Oracle Database 12c Release 2, Database Replay has enhanced support for long running PL/SQL packages.
Database Replay always captured and replayed top-level PL/SQL calls, which results in accurate and complete
replays in almost all cases. In Oracle Database 12c Release 2, the option has been added to either capture and
replay the top level PL/SQL calls, or to capture and replay the individual SQL issued within those PL/SQL blocks.
In some special cases, capturing and replaying the recursive SQL can produce a more correct and higher quality
replay.
Ongoing Administration
Automating the day-to-day repetitive tasks that in the past have taken too much of an administrator’s time is a key
achievement of the self-managing Oracle Database. By relieving the administrators of the tedious management
tasks, such as provisioning or patching databases, managing memory allocations, and managing disk resources,
they can be freed to focus on more strategic requirements, such as security and high availability.
Resource Management
Automating resource management tasks, such as managing memory allocation and disk resources, has been
another key achievement of the self-managing database. Let’s examine these tasks in more detail.
Automatic Memory Management
One of the key self-management enhancements in Oracle Database 11g has been automatic memory management.
This functionality automates the management of shared memory used by an Oracle instance and liberates
administrators from manually configuring the shared memory components. The automatic memory management
feature is based on sophisticated heuristics internal to Oracle Database that monitors the memory distribution and
changes it according to the demands of the workload.
All memory, PGA and SGA, is now managed centrally with the automatic memory management feature. DBAs
specify a single parameter, MEMORY_TARGET, and Oracle Database automatically sizes the PGA and SGA based
on the workload. Using indirect memory transfer, Oracle Database transfers memory from SGA to PGA and vice
versa to respond to the load.
Space Management
Space management can be one of the most time consuming tasks for database administrators. Fortunately, Oracle
Database automatically manages its space consumption, alerts administrators on potential space problems, and
recommends possible solutions.
Proactive Space Management
Starting with version 11g, the Oracle Database does non-intrusive and timely monitoring checks for space utilization
in the database server. Oracle Database’s space monitoring functionality is set up out-of-box, causes no
measurable performance impact, and is uniformly available across all tablespace types. Since the monitoring is
performed at the same time as space is allocated and freed in the database server, space usage information is
guaranteed to be available whenever the user needs it.

17 | DATABASE MANAGEABILITY
Transparent Space Reclamation
Oracle Database can perform an in-place reorganization of data for optimal space utilization by shrinking segments.
Shrinking of a segment makes unused space available to other segments in the tablespace and may improve the
performance of queries and DML operations.
The segment shrink functionality provides the ability to both compact the space used in a segment and then de-
allocate it from the segment. The de-allocated space is returned to the tablespace and is available to other objects
in the tablespace. Segment shrink is an online operation – the table being shrunk is open to queries and DML while
the segment is being shrunk. Additionally, segment shrink is performed in-place. In order to easily identify candidate
segments for shrinking, Oracle Database also includes an automatic segment advisor that runs every night in a
predetermined maintenance window to proactively identify segments that should be shrunk.
Segment Creation on Demand
Installation of a packaged application can often create thousands of database tables and indexes. The creation of
these tables and indexes can be time consuming and use a significant amount of disk space. Many of these tables
and indexes may never be used if you have not licensed all the modules of the packaged application. In the Oracle
Database, when creating non-partitioned tables and indexes, the database by default uses delayed segment
creation to update only database metadata and avoids the initial creation of user segments, saving disk space and
greatly speeding up installation time. When a user inserts the first row into a table, the database creates segments
for the table, its LOB columns, and its indexes.
Segment creation on demand saves time, space and computing resources.
Compression Advisor
Oracle Database 12c table compression feature is completely transparent to applications. A compression advisor
built into the Oracle Database facilitates choosing the correct compression level for your data. As part of the existing
advisor framework in Oracle Database 12c, the compression advisor analyzes the objects in the database,
discovers the possible compression ratios that could be achieved, and recommends optimal compression settings.
Exadata Management and Cloud Consolidation
As enterprises increasingly look to consolidate their disparate databases onto the Oracle Exadata infrastructure
either on-premise or Oracle Exadata cloud, Oracle Enterprise Manager Cloud Control 13c can help administrators
manage the Exadata Database Machine using a holistic approach and can provide comprehensive lifecycle
management from monitoring to management and ongoing maintenance for the entire engineered system.
Enterprise Manager 13c offers out of the box integration to provide single pane of management across on-premise
and cloud services.
Integrated System Monitoring
Oracle Enterprise Manager provides comprehensive monitoring and notifications to enable administrators to
proactively detect and respond to problems with Oracle Exadata Database Machine and its software and hardware
components. Administrators can easily adjust these monitoring settings to suit the needs of their datacenter
environment. When notified of these alerts, administrators can easily view the history of alerts and associated
performance metrics of the problem component, such as the network performance of an Infiniband port or the disk
activity of an Exadata storage cell, to identify the root cause of the problem. Oracle Enterprise Manager Cloud

18 | DATABASE MANAGEABILITY
Control 13c allows complete management and monitoring of the Exadata Storage Server, Infiniband Switches, Cisco
Switch, KVM, PDU and ILOMs. In Oracle Enterprise Manager 13c, some of the important hardware management
features have been tightly integrated and thus enables to have a more sophisticated management like monitoring
open incidents, resource utilization and metrics for a specific component by making them available in a dashboard.
The information appears in graphs, tables, charts, schematic, and photo-realistic views to help you to quickly
understand the status and relationships between components. Exacheck configuration audit check feature is now
integrated into the Compliance framework of Enterprise Manager 13c and can be helpful to generate automated
notifications and reports for any violation in Exadata configurations.
Figure 7: Enhanced Exadata schematic with a photorealistic view
Fault Diagnostics
Oracle Database includes an advanced fault diagnosability infrastructure for collecting and managing diagnostic
data. Diagnostic data includes the trace files, dumps, and core files that are also present in previous releases, plus
new types of diagnostic data that enable customers and Oracle Support to identify, investigate, track, and resolve
problems quickly and effectively.
The goals of the fault diagnosability infrastructure are the following:
» First-failure diagnosis
» Problem prevention
» Limiting damage and interruptions after a problem is detected
» Reducing problem diagnostic time
» Reducing problem resolution time
» Simplifying customer interaction with Oracle Support
The keys to achieving these goals are the following technologies:
» Automatic capture of diagnostic data upon first failure—for critical errors, the ability to capture error information at
first-failure greatly increases the chance of a quick problem resolution and reduced downtime. An always-on
memory-based tracing system proactively collects diagnostic data from many database components, and can
help isolate root causes of problems. Such proactive diagnostic data is similar to the data collected by airplane
"black box" flight recorders. When a problem is detected, alerts are generated and the fault diagnosability
infrastructure is activated to capture and store diagnostic data. The data is stored in a repository that is outside
the database (and therefore available when the database is down), and is easily accessible with command line
utilities and Oracle Enterprise Manager Cloud Control (Cloud Control).

19 | DATABASE MANAGEABILITY
» Standardized trace formats—Standardizing trace formats across all database components enables DBAs and
Oracle Support personnel to use a single set of tools for problem analysis. Problems are more easily diagnosed,
and downtime is reduced.
» Health checks—Upon detecting a critical error, the fault diagnosability infrastructure can run one or more health
checks to perform deeper analysis of a critical error. Health check results are then added to the other diagnostic
data collected for the error. Individual health checks look for data block corruptions, undo and redo corruption,
data dictionary corruption, and more. As a DBA, you can manually invoke these health checks, either on a regular
basis or as required.
» Incident packaging service (IPS) and incident packages—The IPS enables you to automatically and easily gather
the diagnostic data—traces, dumps, health check reports, and more—pertaining to a critical error and package
the data into a zip file for transmission to Oracle Support. Because all diagnostic data relating to a critical error are
tagged with that error's incident number, you do not have to search through trace files and other files to determine
the files that are required for analysis; the incident packaging service identifies the required files automatically and
adds them to the zip file. Before creating the zip file, the IPS first collects diagnostic data into an intermediate
logical structure called an incident package (package). Packages are stored in the Automatic Diagnostic
Repository. If you choose to, you can access this intermediate logical structure, view and modify its contents, add
or remove additional diagnostic data at any time, and when you are ready, create the zip file from the package.
After these steps are completed, the zip file is ready to be uploaded to Oracle Support.
» Data Recovery Advisor—The Data Recovery Advisor integrates with database health checks and RMAN to
display data corruption problems, assess the extent of each problem (critical, high priority, low priority), describe
the impact of a problem, recommend repair options, conduct a feasibility check of the customer-chosen option,
and automate the repair process.
» SQL Test Case Builder—For many SQL-related problems, obtaining a reproducible test case is an important
factor in problem resolution speed. The SQL Test Case Builder automates the sometimes difficult and time-
consuming process of gathering as much information as possible about the problem and the environment in which
it occurred. After quickly gathering this information, you can upload it to Oracle Support to enable support
personnel to easily and accurately reproduce the problem.
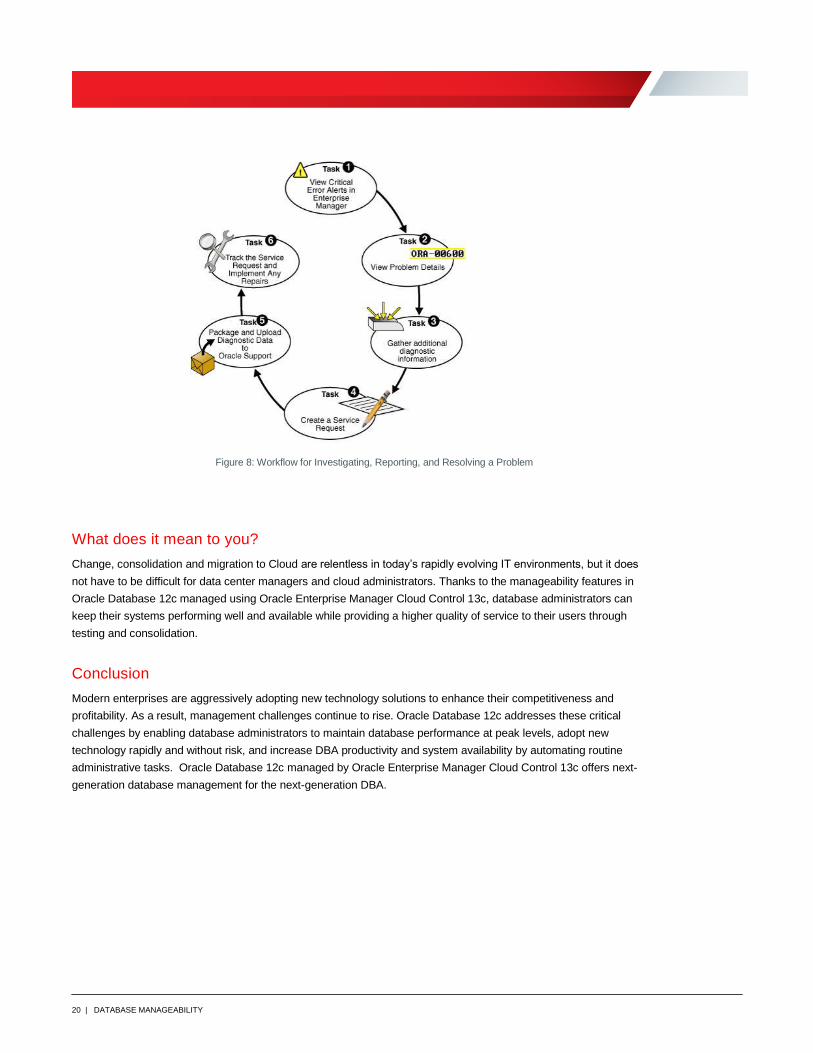
Support Workbench
The Support Workbench is a facility in Oracle Enterprise Manager that enables you to interact with the fault
diagnostic infrastructure of the Oracle Database. With it you can investigate, report, and where appropriate, repair
problems, all with an easy-to-use graphical interface. The Support Workbench provides a self-service means for you
to package diagnostic data using IPS, obtain a support request number, and upload the IPS package to Oracle
Support with a minimum of effort and in a very short time, thereby reducing time-to-resolution for problems.
20 | DATABASE MANAGEABILITY
Figure 8: Workflow for Investigating, Reporting, and Resolving a Problem
What does it mean to you?
Change, consolidation and migration to Cloud are relentless in today’s rapidly evolving IT environments, but it does
not have to be difficult for data center managers and cloud administrators. Thanks to the manageability features in
Oracle Database 12c managed using Oracle Enterprise Manager Cloud Control 13c, database administrators can
keep their systems performing well and available while providing a higher quality of service to their users through
testing and consolidation.
Conclusion
Modern enterprises are aggressively adopting new technology solutions to enhance their competitiveness and
profitability. As a result, management challenges continue to rise. Oracle Database 12c addresses these critical
challenges by enabling database administrators to maintain database performance at peak levels, adopt new
technology rapidly and without risk, and increase DBA productivity and system availability by automating routine
administrative tasks. Oracle Database 12c managed by Oracle Enterprise Manager Cloud Control 13c offers next-
generation database management for the next-generation DBA.

Oracle Corporation, World Headquarters Worldwide Inquiries
500 Oracle Parkway Phone: +1.650.506.7000
Redwood Shores, CA 94065, USA Fax: +1.650.506.7200
Copyright © 2016, Oracle and/or its affiliates. All rights reserved. This document is provided for information purposes only, and the
contents hereof are subject to change without notice. This document is not warranted to be error-free, nor subject to any other warranties or conditions, whether expressed orally or implied in law, including implied warranties and conditions of merchantability or fitness for a particular purpose. We specifically disclaim any liability with respect to this document, and no contractual obligations are formed either directly or indirectly by this document. This document may not be reproduced or transmitted in any form or by any means, electronic or mechanical, for any purpose, without our prior written permission. Oracle and Java are registered trademarks of Oracle and/or its affiliates. Other names may be trademarks of their respective owners. Intel and Intel Xeon are trademarks or registered trademarks of Intel Corporation. All SPARC trademarks are used under license and are trademarks or registered trademarks of SPARC International, Inc. AMD, Opteron, the AMD logo, and the AMD Opteron logo are trademarks or registered trademarks of Advanced Micro Devices. UNIX is a registered trademark of The Open Group. 0116 White Paper Title December 2016 Author: [OPTIONAL] Contributing Authors: [OPTIONAL]
C O N N E C T W I T H U S
blogs.oracle.com/oracle
facebook.com/oracle
twitter.com/oracle
oracle.com