with the great complexity of their disease burden, the ... · formance measures (cpm) project,...
TRANSCRIPT

I will shatter the wallOf darkness that risesFrom gleaming dayAnd seeks to hide the sun.I will turn this wall ofDarkness (that is night)Into a thing of beauty.
Mae V Cowdery “Goal”

Wamong these efforts is the assessment of provider performance under CMS’s ESRD Clinical Per-formance Measures (CPM) project, which looks at the implementation of NKF’s Kidney Dialysis Outcomes Quality Initiative (K/DOQI) guide-lines. K/DOQI targets for dialysis therapy, vas-cular access, and clinical indicators are shown on the next page, along with other targets based on practice guidelines and on safety issues such as the maintenance of hemoglobin levels within various target ranges.
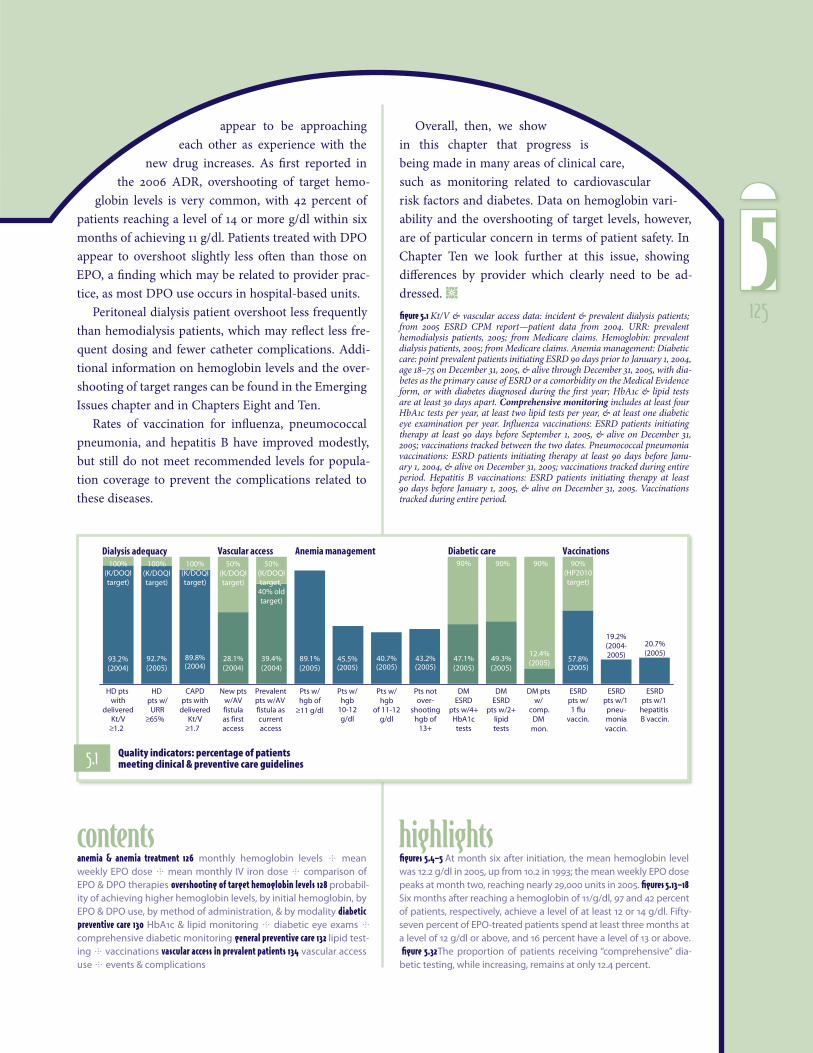
It appears, for instance, that the target for he-modialysis therapy—a Kt/V greater than or equal to 1.2 (single-pool kinetics), or a urea reduction ratio of 65 percent or greater—is reached in 93 per-cent of patients. Among CAPD patients, 90 per-cent reach a delivered weekly Kt/V of 1.7 or above, the target from the revised 2006 guidelines.
Guidelines related to vascular access, recom-mending increased use of arteriovenous fistulas, have been based on the considerable morbidity and mortality associated with dialysis catheters, and on marked differences in the use of simple fistulas in the U.S. compared to Europe, Japan, and other parts of the world.
Vascular access use in the hemodialysis popu-lation continues to be a major area of concern. The number of new patients using a fistula within the first year on dialysis has reached 28 percent—moving, albeit slowly, toward the new K/DOQI target of at least 50 percent. Prevalent use of fistulas also continues to rise, and at al-most 39 percent is nearing the initial 40 percent
target. As we show later in this chapter, catheter use in the prevalent population continues to be more frequent in women than in men. Catheter complications are very common, with high rates of removals, replacements, and sepsis events. And as we illustrate in Chapter Three, catheter use is also high at the initiation of dialysis, con-tributing to early mortality and increased com-plication rates.
An extended section of this chapter focuses on anemia treatment and the overshooting of target hemoglobin levels. Currently, target hemo-globin levels of 11 g/dl and above are achieved by 89 percent of prevalent dialysis patients. There is, however, a growing number of patients with hemoglobins exceeding 13 g/dl—57 percent in 2005—which is an issue of increasing concern. The FDA-required package insert for erythropoie-sis stimulating agents (ESAs) lists a target monthly hemoglobin of 10–12 g/dl, while the K/DOQI rec-ommended range is 11–12 g/dl. Just 45.5 percent of prevalent patients meet the first target each month, and 40.7 percent meet the second.
In the incident population, hemoglobin lev-els after the initiation of therapy are rising more quickly than in the past, and achieved levels with-in the first six months are higher as well. These changes have been concurrent with a dramatic rise in epoetin dosing between 1993 and 2005.
This year we introduce expanded data on the use of darbepoetin, a longer-acting ESA with a greater half life. Achieved hemoglobin levels in EPO and DPO patients have differed slightly, but
With the great complexity of their disease burden, the care of ESRD patients poses many challenges for providers, public health officials, and policy makers. Over the past decade, improvements in ESRD care have been identified by a number of organizations. Most notable
124
5
appear to be approaching each other as experience with the
new drug increases. As first reported in the 2006 ADR, overshooting of target hemo-
globin levels is very common, with 42 percent of patients reaching a level of 14 or more g/dl within six months of achieving 11 g/dl. Patients treated with DPO appear to overshoot slightly less often than those on EPO, a finding which may be related to provider prac-tice, as most DPO use occurs in hospital-based units.
Peritoneal dialysis patient overshoot less frequently than hemodialysis patients, which may reflect less fre-quent dosing and fewer catheter complications. Addi-tional information on hemoglobin levels and the over-shooting of target ranges can be found in the Emerging Issues chapter and in Chapters Eight and Ten.
Rates of vaccination for influenza, pneumococcal pneumonia, and hepatitis B have improved modestly, but still do not meet recommended levels for popula-tion coverage to prevent the complications related to these diseases.
Overall, then, we show in this chapter that progress is being made in many areas of clinical care, such as monitoring related to cardiovascular risk factors and diabetes. Data on hemoglobin vari-ability and the overshooting of target levels, however, are of particular concern in terms of patient safety. In Chapter Ten we look further at this issue, showing differences by provider which clearly need to be ad-dressed. ½
figure 5.1 Kt/V & vascular access data: incident & prevalent dialysis patients; from 2005 ESRD CPM report—patient data from 2004. URR: prevalent hemodialysis patients, 2005; from Medicare claims. Hemoglobin: prevalent dialysis patients, 2005; from Medicare claims. Anemia management: Diabetic care: point prevalent patients initiating ESRD 90 days prior to January 1, 2004, age 18–75 on December 31, 2005, & alive through December 31, 2005, with dia-betes as the primary cause of ESRD or a comorbidity on the Medical Evidence form, or with diabetes diagnosed during the first year; HbA1c & lipid tests are at least 30 days apart. Comprehensive monitoring includes at least four HbA1c tests per year, at least two lipid tests per year, & at least one diabetic eye examination per year. Influenza vaccinations: ESRD patients initiating therapy at least 90 days before September 1, 2005, & alive on December 31, 2005; vaccinations tracked between the two dates. Pneumococcal pneumonia vaccinations: ESRD patients initiating therapy at least 90 days before Janu-ary 1, 2004, & alive on December 31, 2005; vaccinations tracked during entire period. Hepatitis B vaccinations: ESRD patients initiating therapy at least 90 days before January 1, 2005, & alive on December 31, 2005. Vaccinations tracked during entire period.
93.2%(2004)
92.7%(2005)
28.1%(2004)
39.4%(2004)
57.8%(2005)
47.1%(2005)
49.3%(2005)
89.1%(2005)
89.8%(2004)
45.5%(2005)
40.7%(2005)
43.2%(2005)
HD pts with
deliveredKt/V
≥1.2
100%(K/DOQItarget)
HD pts w/URR
≥65%
CAPDpts with
deliveredKt/V
≥1.7
New ptsw/AVfistulaas firstaccess
Prevalentpts w/AV fistula ascurrentaccess
Pts w/hgb
of 11-12g/dl
Pts notover-
shootinghgb of
13+
100%(K/DOQItarget)
100%(K/DOQItarget)
50%(K/DOQItarget)
DMESRD
pts w/4+HbA1ctests
ESRDpts w/1 flu
vaccin.
DMESRD
pts w/2+lipidtests
DM pts w/
comp.DM
mon.
12.4%(2005)
90%(HP2010target)
Dialysis adequacy Vascular access Anemia management Diabetic care Vaccinations
19.2%(2004-2005)
20.7%(2005)
90% 90% 90%
40% oldtarget)
50%(K/DOQItarget,
ESRDpts w/1
hepatitis B vaccin.
ESRDpts w/1 pneu-moniavaccin.
Pts w/hgb of
≥11 g/dl
Pts w/hgb
10-12g/dl
highlightscontentsanemia & anemia treatment 126� monthly hemoglobin levels mean weekly EPO dose mean monthly IV iron dose comparison of EPO & DPO therapies overshooting of target hemoglobin levels 128 probabil-ity of achieving higher hemoglobin levels, by initial hemoglobin, by EPO & DPO use, by method of administration, & by modality diabetic preventive care 130� HbA1c & lipid monitoring diabetic eye exams comprehensive diabetic monitoring general preventive care 132 lipid test-ing vaccinations vascular access in prevalent patients 134� vascular access use events & complications
figures 5.4�–5 At month six after initiation, the mean hemoglobin level was 12.2 g/dl in 2005, up from 10.2 in 1993; the mean weekly EPO dose peaks at month two, reaching nearly 29,000 units in 2005. figures 5.13–18 Six months after reaching a hemoglobin of 11/g/dl, 97 and 42 percent of patients, respectively, achieve a level of at least 12 or 14 g/dl. Fifty-seven percent of EPO-treated patients spend at least three months at a level of 12 g/dl or above, and 16 percent have a level of 13 or above. figure 5.32 The proportion of patients receiving “comprehensive” dia-betic testing, while increasing, remains at only 12.4 percent.
5.1 Quality indicators: percentage of patients meeting clinical & preventive care guidelines
125
5

91 92 93 94 95 96 97 98 99 00 01 02 03 04 05
Mea
n E
PO
do
se (i
n t
ho
usa
nd
s o
f un
its)
5
10
15
20
Hem
og
lob
in (g
/dl)
9
10
11
12
EPO
Hemoglobin
1 2 3 4 5 6
<9
9-<10
10-<11
11-<12
12+
All
1 2 3 4 5 6
By initial hemoglobin: Hemodialysis, 2004-2005 By initial hgb: Peritoneal dialysis, 2004-2005
Months after start of ESRD1 2 3 4 5 6
Hem
og
lob
in (g
/dl)
8
9
10
11
12
13By year
1993
1997
2001
2005
1 2 3 4 5 610
15
20
25
30
35
<99-<1010-<11
11-<1212+All
1 2 3 4 5 60
4
8
12
16
20By initial hemoglobin: Hemodialysis, 2004-2005 By initial hgb: Peritoneal dialysis, 2004-2005
Months after start of ESRD1 2 3 4 5 6
Mea
n w
eekl
y EP
O d
ose
(1,0
00s
of u
nit
s)
5
10
15
20
25
30By year
1993
19972001
2005
All <9 9-<10 10-<11 11-<12 12+ All <9 9-<10 10-<11 11-<12 12+
By initial hemoglobin: Hemodialysis, 2004-2005 By initial hgb: Peritoneal dialysis, 2004-2005
1993 1997 2001 2005
Perc
ent
of p
atie
nts
0
20
40
60
80
100By year
450+
<200 mg 200-349350-449
91 92 93 94 95 96 97 98 99 00 01 02 03 04 05
Perc
ent
of p
atie
nts
0
20
40
60
80
100
<9
12-<13
10-<11
11-<12
9-<10
13+
clinical indicators & preventive health
5.2 Patient distribution, by mean monthly hemoglobin (g/dl) period prevalent dialysis patients
5.4 Mean monthly hemoglobin incident dialysis patients
anemia & anemia treatment
5.3 Mean monthly hemoglobin & mean EPO dose per week� period prevalent dialysis patients
Anemia treatment in incident dialysis patients, by modality & initial hemoglobin level
5.5 Mean EPO dose per week� incident dialysis patients
5.6 Mean monthly IV iron dose during the first six months of dialysis therapy incident dialysis patients
126
5
Mea
n m
on
thly
EPO
(in
1,0
00s
of u
nit
s)
Mea
n m
on
thly
DPO
(in
mic
rog
ram
s)
2005 2006
Num
ber
of c
laim
s (in
th
ou
san
ds)
0
5
10
15
20
190200210
EPO
DPO
EPO
DPO
2005 20060
2
4
6
8
10Peritoneal dialysisHemodialysis
Peritoneal dialysisHemodialysis
2005 2006
Mea
n h
emog
lob
in (g
/dl)
11.0
11.5
12.0
12.5
EPO
EPO
DPO
DPO
2005 200611.0
11.5
12.0
12.5
EPO
DPO
All chains Non-chain Hosp. based
Perc
ent
of c
laim
s
0
20
40
60
80
100
EPO DPO
2005 2006
Stan
dar
d d
evia
tion
1.0
1.2
1.4
1.6
1.8
2.0
EPO
DPO
July-Dec 04Jan-June 05
July-Dec 05Jan-June 06
Stan
dar
d d
evia
tio
n
0.8
0.9
1.0
1.1
1.2
EPO
DPO
2005 200660
70
80
90
100
220
240
260
280
300
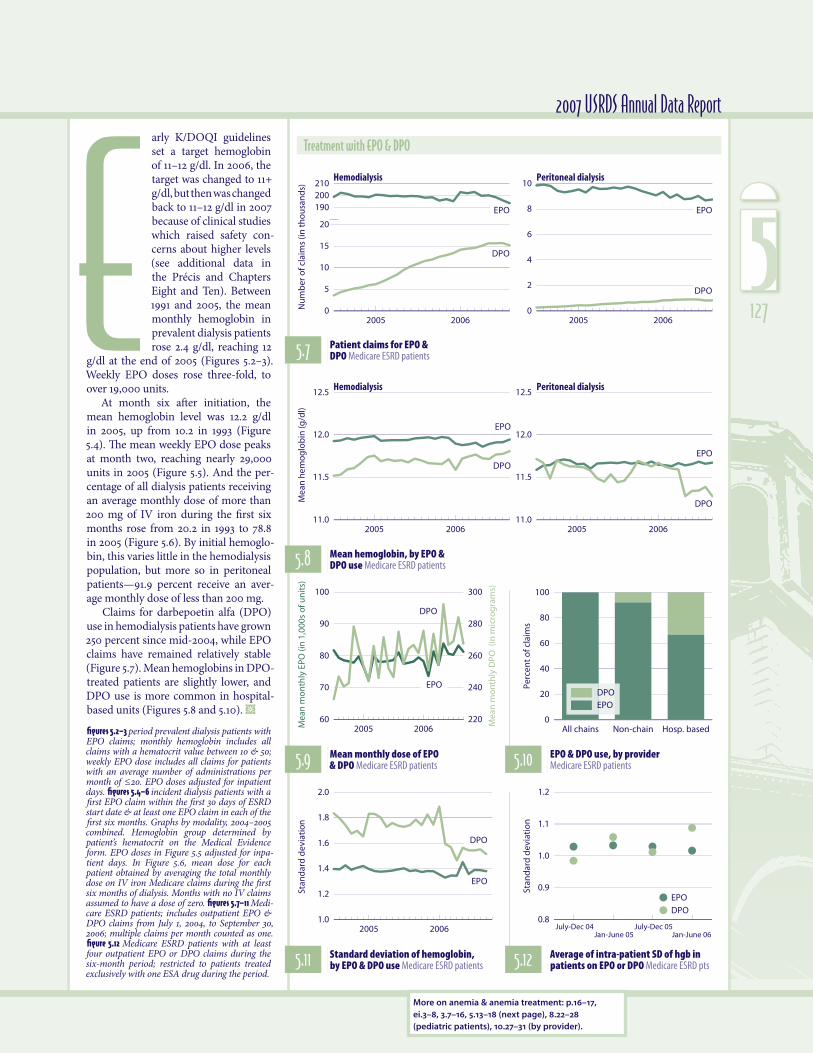
2007 USRDS Annual Data Reportarly K/DOQI guidelines set a target hemoglobin of 11–12 g/dl. In 2006, the target was changed to 11+ g/dl, but then was changed back to 11–12 g/dl in 2007 because of clinical studies which raised safety con-cerns about higher levels (see additional data in the Précis and Chapters Eight and Ten). Between 1991 and 2005, the mean monthly hemoglobin in prevalent dialysis patients rose 2.4 g/dl, reaching 12
g/dl at the end of 2005 (Figures 5.2–3). Weekly EPO doses rose three-fold, to over 19,000 units.
At month six after initiation, the mean hemoglobin level was 12.2 g/dl in 2005, up from 10.2 in 1993 (Figure 5.4). The mean weekly EPO dose peaks at month two, reaching nearly 29,000 units in 2005 (Figure 5.5). And the per-centage of all dialysis patients receiving an average monthly dose of more than 200 mg of IV iron during the first six months rose from 20.2 in 1993 to 78.8 in 2005 (Figure 5.6). By initial hemoglo-bin, this varies little in the hemodialysis population, but more so in peritoneal patients—91.9 percent receive an aver-age monthly dose of less than 200 mg.
Claims for darbepoetin alfa (DPO) use in hemodialysis patients have grown 250 percent since mid-2004, while EPO claims have remained relatively stable (Figure 5.7). Mean hemoglobins in DPO-treated patients are slightly lower, and DPO use is more common in hospital-based units (Figures 5.8 and 5.10). ½
figures 5.2–3 period prevalent dialysis patients with EPO claims; monthly hemoglobin includes all claims with a hematocrit value between 10 & 50; weekly EPO dose includes all claims for patients with an average number of administrations per month of ≤20. EPO doses adjusted for inpatient days. figures 5.4�–6� incident dialysis patients with a first EPO claim within the first 30 days of ESRD start date & at least one EPO claim in each of the first six months. Graphs by modality, 2004–2005 combined. Hemoglobin group determined by patient’s hematocrit on the Medical Evidence form. EPO doses in Figure 5.5 adjusted for inpa-tient days. In Figure 5.6, mean dose for each patient obtained by averaging the total monthly dose on IV iron Medicare claims during the first six months of dialysis. Months with no IV claims assumed to have a dose of zero. figures 5.7–11 Medi-care ESRD patients; includes outpatient EPO & DPO claims from July 1, 2004, to September 30, 2006; multiple claims per month counted as one. figure 5.12 Medicare ESRD patients with at least four outpatient EPO or DPO claims during the six-month period; restricted to patients treated exclusively with one ESA drug during the period.
Treatment with EPO & DPO
5.7 Patient claims for EPO & DPO Medicare ESRD patients
5.8 Mean hemoglobin, by EPO & DPO use Medicare ESRD patients
5.9 Mean monthly dose of EPO & DPO Medicare ESRD patients 5.10 EPO & DPO use, by provider
Medicare ESRD patients
5.11 Standard deviation of hemoglobin, by EPO & DPO use Medicare ESRD patients 5.12 Average of intra-patient SD of hgb in
patients on EPO or DPO Medicare ESRD pts
More on anemia & anemia treatment: p.16–17, ei.3–8, 3.7–16, 5.13–18 (next page), 8.22–28 (pediatric patients), 10.27–31 (by provider).
E 127
5

Months after achieving a hgb of 11 g/dl
1 2 3 4 5 6
Cu
mu
lati
ve p
rob
abili
ty
0.0
0.2
0.4
0.6
0.8
1.012.0
12.513.0
13.5
14.0
Hemoglobin level (g/dl)
>12 13+ 14+
Perc
ent
of p
atie
nts
0
20
40
60
80
100
0 months
1 month
2 months
3+ months
clinical indicators & preventive health
igher hemoglobin levels have been a concern since the reporting of adverse outcomes in clinical trials of anemia correction when tar-geting treatment to levels of 13 g/dl and higher. In this spread we explore the likelihood of dialysis patients overshooting various hemo-globin levels.
In Figure 5.13 we show the probability of EPO-treated dialysis patients reaching higher hemoglobin levels once they have achieved the minimum level of 11 g/dl recommended by the NKF K/DOQI guidelines and by CMS’s ESRD Clinical Performance Measures (CPM) project. Six months after reaching 11 g/dl, for instance, 97 and 42 percent of patients, respectively, achieve a level of at least 12 or 14 g/dl.
After reaching a hemoglobin level of 12 g/dl or higher, 54 per-cent of prevalent dialysis patients treated with EPO spend at least three months at this level (Figure 5.14). Nearly 61 percent of those who reach a level of 13 g/dl or above remain at 12 g/dl or above for at least three months.
Interestingly, 95–98 percent of incident patients reach a hemo-globin level of 11 g/dl in the first six months of therapy, regard-less of the level at which they initiate treatment (Figure 5.15). It also appears that half of incident patients reach a hemoglobin of
H
overshooting of target hemoglobin levels
5.13 Probability of achieving hemoglobin levels ≥ 12 g/dl incident dialysis patients 5.14 Time at hemoglobin levels of >12
g/dl point prevalent dialysis patients
12 g/dl by the end of the second month on hemodialysis treat-ment, and approximately 60 percent reach 13 g/dl by the end of month four; by the end of the first six months on dialysis, nearly 40 percent will reach 14+ g/dl. The likelihood of reaching these levels varies little with the initial hemoglobin level reported on the Medical Evidence form, even when this level is less than 9 g/dl. The probability of overshooting is slightly lower for those being treated with DPO versus EPO, less likely in those treated with subcutaneous EPO, and significantly lower in those treated with peritoneal dialysis (Figures 5.16–18). ½
all figures patients with Medicare as primary payor. ½ figure 5.13 dialysis patients incident between July 1, 2004, & June 30, 2005, receiving EPO during the first six months after incidence, & achieving a hemoglobin of 11+ g/dl during that time period; probabilities calculated using Kaplan-Meier method. figure 5.14� point prevalent dialysis patients with a first service date 90 days prior to January 1, 2005, & receiving EPO in each of the first six months after January 1, 2005. figure 5.15 dialysis patients incident between July 1, 2004, & June 30, 2005, & receiving EPO during the first six months after incidence. Initial hemoglobin obtained from Medical Evidence form; probabilities calculated using Kaplan-Meier method. figure 5.16� dialysis patients incident between July 1, 2004, & June 30, 2005, receiving EPO during the first six months after incidence, & with a hemoglobin less than 11 g/dl during that time period; probabilities calculated using Kaplan-Meier method. figure 5.17 ESRD CPM data; prevalent hemodialysis patients, age 20 & older, 2004, with a hemoglobin of 11–12 during the CPM period, & receiv-ing EPO during the first five months after the CPM period; probabilities cal-culated using Kaplan-Meier method. figure 5.18 point prevalent dialysis patients with a first service date 90 days before January 1, 2005, receiving EPO in the first six months after January 1, 2005, & with a hemoglobin less than 11 g/dl during that time period; probabilities calculated using Kaplan-Meier method.
128
5

1 2 3 4 5 6
Cu
mu
lati
ve p
rob
abili
ty
0.0
0.2
0.4
0.6
0.8
1.0
<9
9-<10
10-<11
11-<12
12-<13
13+
1 2 3 4 5 6Months after initiation
1 2 3 4 5 6 1 2 3 4 5 6
Hemoglobin: 11+ g/dl 12+ 13+ 14+
1 2 3 4 5 6
Cu
mu
lati
ve p
rob
abili
ty
0.0
0.2
0.4
0.6
0.8
1.0
EPO
DPO
1 2 3 4 5 6Months after initiation
1 2 3 4 5 6 1 2 3 4 5 6
Hemoglobin: 11+ g/dl 12+ 13+ 14+
1 2 3 4 5 6
Cu
mu
lati
ve p
rob
abili
ty
0.0
0.2
0.4
0.6
0.8
1.0
Intravenous
Subcutaneous
1 2 3 4 5 6Months
1 2 3 4 5 6
Hemoglobin: 12+ g/dl 13+ 14+
1 2 3 4 5 6
Cu
mu
lati
ve p
rob
abili
ty
0.0
0.2
0.4
0.6
0.8
1.0
Hemodialysis
Peritoneal dialysis
1 2 3 4 5 6Months
1 2 3 4 5 6
Hemoglobin: 12+ g/dl 13+ 14+
2007 USRDS Annual Data Report
5.15 Probability of reaching hemoglobin levels of 11 g/dl or greater, by initial hemoglobin level (from the Medical Evidence form) incident dialysis patients, July, 2004, to June, 2005
5.16 Probability of reaching hemoglobin levels of 11 g/dl or greater, by EPO & DPO use incident dialysis patients, July, 2004, to June, 2005
5.17 Probability of reaching hemoglobin levels of 12 g/dl or greater, by method of ESA administration prevalent hemodialysis patients age 20 & older, 2004; ESRD CPM data
5.18 Probability of achieving hemoglobin levels of 12 g/dl or greater, by modality point prevalent dialysis patients
More on anemia & anemia treatment: p.16–17, ei.3–8, 3.7–16, 5.2–12 (previous page), 8.22–28 (pedi-atric patients), 10.27–31 (by provider).
129
5

4+ tests
2 tests
1 test
No tests
4+ tests
2 tests
1 test
No tests
2+ tests
No tests
56.2 + (61.8)49.2 to <56.242.1 to <49.2
34.7 to <42.1below 34.7 (28.6)
58.2 + (66.9)48.7 to <58.242.0 to <48.7
34.2 to <42.0below 34.2 (29.1)
50.1 + (54.7)45.4 to <50.142.1 to <45.4
38.2 to <42.1below 38.2 (34.2)
92-3 94-5 96-7 98-9 00-1 02-3 04-5
Perc
ent
of p
atie
nts
0
20
40
60
80
100
3 tests
92-3 94-5 96-7 98-9 00-1 02-3 04-05
Perc
ent
of p
atie
nts
0
20
40
60
80
100
3 tests
92-3 94-5 96-7 98-9 00-1 02-3 04-05Pe
rcen
t o
f pat
ien
ts
0
20
40
60
80
100
1 test
All HD PD Tx
Perc
ent
test
ed
0
20
40
60
80
100
All HD PD Tx
Perc
ent
test
ed
0
20
40
60
80
100
All HD PD Tx
Perc
ent
test
ed
0
20
40
60
80
100
Race/ethnicityAge
All18-30
31-4041-50
51-6061-70
71-75 W AA NA A H All18-30
31-4041-50
51-6061-70
71-75 W AA NA A H All18-30
31-4041-50
51-6061-70
71-75 W AA NA A H
Perc
ent
rece
ivin
g 4
+ t
ests
0
20
40
60
80Dialysis
Transplant
Race/ethnicityAge
Perc
ent
rece
ivin
g 2
+ t
ests
0
20
40
60
80Dialysis
Tx
Race/ethnicityAge
Perc
ent
rece
ivin
g 1
+ e
xam
0
20
40
60
80Dialysis
Transplant
Zero One Two Three Four +
Zero One Two Three Four +
Zero One Two +
clinical indicators & preventive health
5.22 HbA1c testing, by age, race/ ethnicity, & modality, 2005 5.26 Lipid testing, by age, race/
ethnicity, & modality, 2005 5.30 Diabetic eye examinations, by age, race/ethnicity, & modality, 2005
diabetic preventive care
HbA1c testing in diabetic patients point prevalent ESRD patients
5.21 Number of HbA1c tests, by modality, 2005 5.25 Number of lipid tests,
by modality, 2005 5.29 Number of diabetic eye examinations, by modality, 2005
5.20 HbA1c testing, by number of tests 5.24 Lipid testing, by
number of tests 5.28 Diabetic eye examinations, by number of examinations
5.19 Geo. variations in the % of pts receiving 4+ HbA1C tests, by HSA, 2005 5.23 Geo. variations in the % of pts receiving
2+ lipid tests, by HSA, 2005 5.27 Geo. variations in the % of pts receiving a diabetic eye exam, by HSA, 2005
Lipid monitoring in diabetic patients point prevalent ESRD patients
Diabetic eye examinations point prevalent ESRD patients
130
5

92-3 94-5 96-7 98-9 00-1 02-3 04-5% re
ceiv
ing
co
mp
reh
ensi
ve m
on
ito
rin
g%
rece
ivin
g c
om
pre
hen
sive
mo
nit
ori
ng
% re
ceiv
ing
co
mp
reh
ensi
ve m
on
ito
rin
g
0
5
10
15
92-3 94-5 96-7 98-9 00-1 02-3 04-50
5
10
15Hemodialysis
Peritoneal dialysis
Transplant
Race/ethnicityAge
0
5
10
15
20Dialysis
Transplant
14.4 + (19.1)10.9 to <14.4
8.8 to <10.9
6.6 to <8.8below 6.6 (5.2)
All18-30
31-4041-50
51-6061-70
71-75 W AA NA A H
2007 USRDS Annual Data Report
5.33 Comprehensive diabetic monitoring, by modality
5.32 Overall trends in comprehensive diabetic monitoring
5.31 Geo. var. in the % of pts receiving comp. diabetic monitoring, by HSA, 2005
5.34 Comprehensive DM monitoring, by age, race/eth., & modality, 2005
he American Diabetes Association recommends that patients with dia-betes receive 2–4 gly-cosylated hemoglobin (HbA1c) tests each year. Progress toward this goal in ESRD patients has been encouraging, with rates for patients receiv-ing four or more tests nearly doubling in this decade to 47 percent, and reaching 61.8 percent for patients residing in areas represented by the
upper map quintile (Figures 5.19–20). It is noteworthy, however, that during 2004–2005 more than one-fifth of patients still received no testing at all.
Hemodialysis patients are the most likely to receive an HbA1c test four or more times per year, at 56.5 percent, fol-lowed by peritoneal dialysis patients, at 48 percent (Figure 5.21). Fewer than 20 percent of transplant patients, in contrast, receive frequent testing.
In the dialysis population, HbA1c test-ing is more evident in older patients, at 50.8, 55.4, 59.2, and 60.0 percent, respec-tively, for ages 41–50, 51–60, 61–70, and 71–75 (Figure 5.22). By race and ethnicity there is less variation—from a low of 54.2 percent in African Americans to a high of 59.6 percent in the Hispanic popula-tion. Native American transplant patients are the least likely to receive four or more tests, at 13 percent.
Lipid testing guidelines stipulate that at-risk patients receive two or more tests per year. Nearly half of the diabetic ESRD population met this criterion during 2004–2005—nearly a third, however, received no testing at all (Figures 5.23–24). Rates vary across the country, and average 66.9 and 29.1 percent, respectively, for patients residing in areas represented by the upper and lower quintiles.
In contrast to HbA1c testing, the pro-portion of diabetic transplant patients receiving two or more lipid tests is much higher than that of dialysis patients—at 66.3 percent versus 43.2 and 51.3 percent, respectively, in hemodialysis and perito-neal dialysis patients (Figure 5.25).
The proportion of diabetic dialysis patients who receive two or more lipid tests a year varies little among age groups (Figure 5.26). More variability exists among racial and ethnic categories, with
34.5 percent of Native Americans being tested compared to 49.1, 47.6, 46.3, and 41.0 percent, respectively, of Asians, His-panics, whites, and African Americans.
Diabetes increases the likelihood of vision problems such as cataracts and glaucoma, but most threatening is diabetic retinopathy. In the 2004–2005 period, less than half of the diabetic ESRD population received at least one eye exam in a year; patients residing in the north-central tier of states and Northern New England were more likely to be tested, averaging 54.7 percent in the upper quintile (Figures 5.27–28). The proportion of patients tested is similar across modalities, at 43–48 per-cent, and rises with age. By race and eth-nicity, Hispanics and whites are the most likely to be examined, at 46.7 and 45.7 per-cent, respectively (Figures 5.29–30).
The proportion of patients receiving “comprehensive” diabetic testing (see cap-tion), while increasing, remains disturb-ingly low, in 2004–2005 reaching only 12.4 percent. Rates of monitoring average 19.1 and 5.2 percent, respectively, for patients residing in areas represented by the upper and lower map quintiles (Figures 5.31–32).
Comprehensive testing is more com-mon among dialysis patients than among those with a functioning graft, at 13–14 percent compared to 9.5 (Figure 5.33). Rates of testing increase by age and, in the dialysis population, are highest in Hispanics and whites, at 16.2 and 15 per-cent, respectively (Figure 5.34). ½
all figures patients with Medicare inpatient/outpa-tient & physician/supplier primary payor coverage during entire period. figures 5.19, 5.23, 5.27, & 5.31 point prevalent patients initiating ESRD 90 days prior to January 1, 2004, age 18–75 on December 31, 2005, & alive through that day, with diabetes as the primary cause of ESRD or a comorbidity on the Medical Evi-dence form, or with diabetes diagnosed during 2004. Maps by HSA, unadjusted; exclude patients resid-ing in Puerto Rico & the Territories. Testing tracked in 2005; HbA1c & lipid tests are at least 30 days apart. figures 5.20�, 5.24�, 5.28, & 5.32–33 point prevalent patients initiating ESRD 90 days prior to January 1 of the first year, age 18–75 on December 31 of the second year, & alive through the end of the second year, with diabetes as the primary cause of ESRD or a comorbidity on the Medical Evidence form, or with diabetes diagnosed during the first year. Testing tracked in second year & tests are at least 30 days apart. figures 5.21–22, 5.25–26�, 5.29–30�, & 5.34� point prev-alent ESRD patients, 2004, with 90-day rule, age 18–75 on December 31, 2005, & alive through that day, with diabetes as the primary cause of ESRD or a comorbidity on the Medical Evidence form, or with diabetes diagnosed in 2004. Testing tracked in 2005; for Figures 5.21–22, 5.25–26, & 5.29, tests are at least 30 days apart. ½ Comprehensive diabetic monitoring includes at least four HbA1c tests per year, at least two lipid tests per year, & at least one diabetic eye examination per year.
Comprehensive diabetic monitoring point prevalent ESRD patients
More on diabetic preventive care: p.19, hp.21–22, 1.12 & 1.14, 7.69–70 (transplant patients), 10.23 & 10.44–46 (by provider).
T 131
5

All HD PD Tx
Perc
ent
test
ed
0
20
40
60
80
100
Race/ethnicityAge
Perc
ent
rece
ivin
g 2
+ t
ests
0
20
40
60
80Dialysis
Transplant
4+ tests
2 tests
1 test
No tests
93 95 97 99 01 03 05
Perc
ent
of p
atie
nts
0
20
40
60
80
100
3 tests
55.4 + (66.6)44.2 to <55.435.6 to <44.2
28.3 to <35.6below 28.3 (23.0)
All 18-3031-400-17
41-5051-60
61-7071+
W AA NA A H
Zero One Two Three Four +
clinical indicators & preventive healthgeneral preventive care
Lipid monitoring in ESRD patients point prevalent ESRD patients
5.38 Lipid testing, by age, race/ ethnicity, & modality, 2005
5.37 Number of lipid tests, by modality, 2005
5.36 Lipid testing, by number of tests
5.35 Geo. variations in the % of patients receiving 2+ lipid tests, by HSA, 2005
ipid testing rates show that 44 percent of prevalent ESRD patients received two or more tests in 2005, but more than a third were not tested at all. Geographically, rates average 66.6 and 23.0 percent, respectively, for patients residing in areas represented by the upper and lower map quintiles (Figures 5.35–36).
Transplant patients are more likely than dialysis patients to receive at least one lipid test, at 82.7 versus
60–64 percent (Figure 5.37). By age, the proportion of patients tested increases through age 70, with rates in older trans-plant patients nearly double those found in their dialysis counterparts (Figure 5.38). By race and ethnicity, Native American and African American dialysis patients are least likely to receive recommended testing, at 33.3 and 35.2 percent, respec-tively, compared to 43.4 percent of His-panics, 41.2 percent of Asians, and 40.9 percent of whites. Testing in the trans-plant population averages nearly 65 per-cent across all racial and ethnic categories with the exception of Native Americans, of whom only 40 percent receive two or more tests.
Rates of vaccination for influenza rose from 41.9 to 57.8 percent between 1996 and 2005, and rates have remained high-est for patients age 75 and older—at 68.1 percent in 2005 (Figure 5.39). By race and ethnicity, 60.3 percent of whites were vac-cinated in 2005, compared to 54.4, 51.7, 56.3, and 53.4 percent, respectively, of African Americans, Native Americans, Asians, and Hispanics. Vaccination rates continue to be greatest in hemodialy-sis patients, at 62.7 percent compared to 55.8 and 40.4 percent in peritoneal dialy-sis and transplant patients, respectively.Rates average 69.4 percent for patients residing in the central and northwestern portions of the country, as represented by the upper map quintile (Figure 5.40).
The proportion of patients receiving a pneumococcal pneumonia vaccina-tion during a two-year period increased from 10.0 to 19.2 percent between 1996 and 2005, and, as with influenza vacci-nations, is highest in older patients (Fig-ure 5.41). Rates vary least by race and ethnicity, and more widely by modal-
ity, with vaccinations most common in hemodialysis patients—at 21.9 percent compared to 18.5 and 11.7 percent in the peritoneal dialysis and transplant popu-lations, respectively. Across the country, rates vary widely, averaging 36.4 percent for patients residing in areas represented by the upper map quintile (Figure 5.42).
Between 2004 and 2005, hepatitis B vaccination rates fell slightly from 21.7 to 20.7 percent, with similar decreases of 0.76–1.7 percentage points occurring across all age, race, and ethnicity catego-ries, and across dialysis modalities. Rates average 27.8 for some Gulf Coast resi-dents and for those residing in scattered areas along the East and West Coasts (Figures 5.43–44). Vaccination rates tend to be highest in older patients, at 22.9 and 28.5 percent, respectively, in those age 65–74 and 75 and older. By race and eth-nicity, whites and Hispanics are the most likely to receive the vaccine, at 21.4 and 22.7 percent, and Asians the least likely, at 13.7 percent. Fewer than 2 percent of transplant patients received the vaccine in 2005. ½
all figures patients with Medicare inpatient/outpa-tient & physician/supplier primary payor coverage during entire period. ½ figure 5.35 ESRD patients initiating ESRD 90 days prior to January 1, 2005, & alive on December 31, 2005. Maps by HSA, unad-justed; exclude patients residing in Puerto Rico & the Territories. Testing tracked during 2005; tests are at least 30 days apart. figure 5.36� ESRD patients initiating therapy at least 90 days prior to January 1 of each year & alive on December 31. Testing tracked each year; tests are at least 30 days apart. figures 5.37–38 point prevalent ESRD patients, 2005, with 90-day rule, alive on December 31, 2005. Testing tracked during 2005; tests are at least 30 days apart. figure 5.39 ESRD patients initiating therapy at least 90 days before September 1 of each year & alive on December 31; vaccinations tracked between Septem-ber 1 & December 31 of each year. figure 5.4�0� ESRD patients initiating therapy at least 90 days before September 1, 2005, & alive on December 31; vaccina-tions tracked between September 1 & December 31, 2005. Maps by HSA, unadjusted; exclude patients residing in Puerto Rico & the Territories. figure 5.4�1 ESRD patients initiating therapy at least 90 days before the start of the period/year & alive on the period or year’s last day; vaccinations tracked dur-ing entire period/year. figure 5.4�2 ESRD patients initi-ating therapy at least 90 days before January 1, 2004, & alive on December 31, 2005; vaccinations tracked during 2004–2005. Maps by HSA, unadjusted; exclude patients residing in Puerto Rico & the Ter-ritories. figure 5.4�3 ESRD patients initiating therapy at least 90 days before January 1 of each year & alive on December 31; vaccinations tracked each year. fig-ure 5.4�4� ESRD patients initiating therapy at least 90 days before January 1, 2005, & alive on December 31; vaccinations tracked during 2005. Maps by HSA, unadjusted; exclude patients residing in Puerto Rico & the Territories.
L132
5

Race/ethnicityAge
96-97 98-99 00-01 02-03 04-0596-97 98-99 00-01 02-03 04-05
Per
cen
t re
ceiv
ing
vac
cin
atio
n
0
5
10
15
20
25
96-97 98-99 00-01 02-03 04-05
Hemodialysis
Peritoneal dialysis
Transplant
Hemodialysis
Peritoneal dialysis
Transplant
ModalityAll
0-19
20-44
45-64
65-74
75+
White
African American
Native American
Asian
Hispanic
Race/ethnicityAge
97 99 01 03 0597 99 01 03 05
Perc
ent
rece
ivin
g v
acci
nat
ion
0
20
40
60
80
97 99 01 03 05
Hemodialysis
Peritoneal dialysis
Transplant
ModalityAll
0-19
20-44
45-64
65-74
75+
White
African American
Asian
Hispanic
Native American
White
African American
Asian
Hispanic
Native American
Race/ethnicityAge
97 99 01 03 0597 99 01 03 05
Per
cen
t re
ceiv
ing
vac
cin
atio
n
0
10
20
30
97 99 01 03 05
ModalityAll
0-19
20-44
45-64
65-74
75+
66.8 + (69.4)63.5 to <66.860.7 to <63.5
56.4 to <60.7below 56.4 (51.5)
27.2 + (36.4)20.4 to <27.216.2 to <20.4
12.7 to <16.2below 12.7 (10.4)
24.0 + (27.8)20.6 to <24.018.2 to <20.6
15.6 to <18.2below 15.6 (13.3)
2007 USRDS Annual Data ReportInfluenza vaccinations
5.39 Influenza vaccination rates, by age, race/ethnicity, & modality point prevalent ESRD patients 5.40 Influenza vaccination rates (%),
by HSA, 2005 point prevalent ESRD patients
Pneumococcal pneumonia vaccinations
5.41 Pneumococcal pneumonia vaccination rates, by age, race/ethnicity, & modality point prevalent ESRD patients 5.42 Pneumonia vaccination rates (%), by
HSA, 2004–2005 point prev. ESRD patients
Hepatitis B vaccinations
5.43 Hepatitis B vaccination rates, by age, race/ethnicity, & modality point prevalent ESRD patients 5.44 Hepatitis B vaccination rates (%),
by HSA, 2005 point prevalent ESRD patients
More on preventive care: 8.29–31 (pediatric patients), 10.44–49 (by provider).
133
5
Age
98 99 00 01 02 03 04
Perc
ent o
f pat
ien
ts
5
10
15
20
25 Gender
98 99 00 01 02 03 04 98 99 00 01 02 03 04
Race/ethnicity
98 99 00 01 02 03 04
Male
Female
Geographic location
20-44
45-64
65-74
75+ White Af AmN Am
Asian Hispanic
Urban
Rural
Age
98 99 00 01 02 03 04
Per
cen
t of
pat
ien
ts
30
40
50
60
7020-4445-6465-7475+
Gender
98 99 00 01 02 03 04 98 99 00 01 02 03 04
White Af AmN AmAsian Hispanic
Race/ethnicity
98 99 00 01 02 03 04
Urban Rural Male
Female
Geographic location
Age
98 99 00 01 02 03 04
Per
cen
t of
pat
ien
ts
0
20
40
60
20-4445-6465-7475+
Gender
98 99 00 01 02 03 04 98 99 00 01 02 03 04
Race/ethnicity
98 99 00 01 02 03 04
Urban Rural
Male
Female
Geographic location
White Af AmN Am
Asian Hispanic
clinical indicators & preventive health
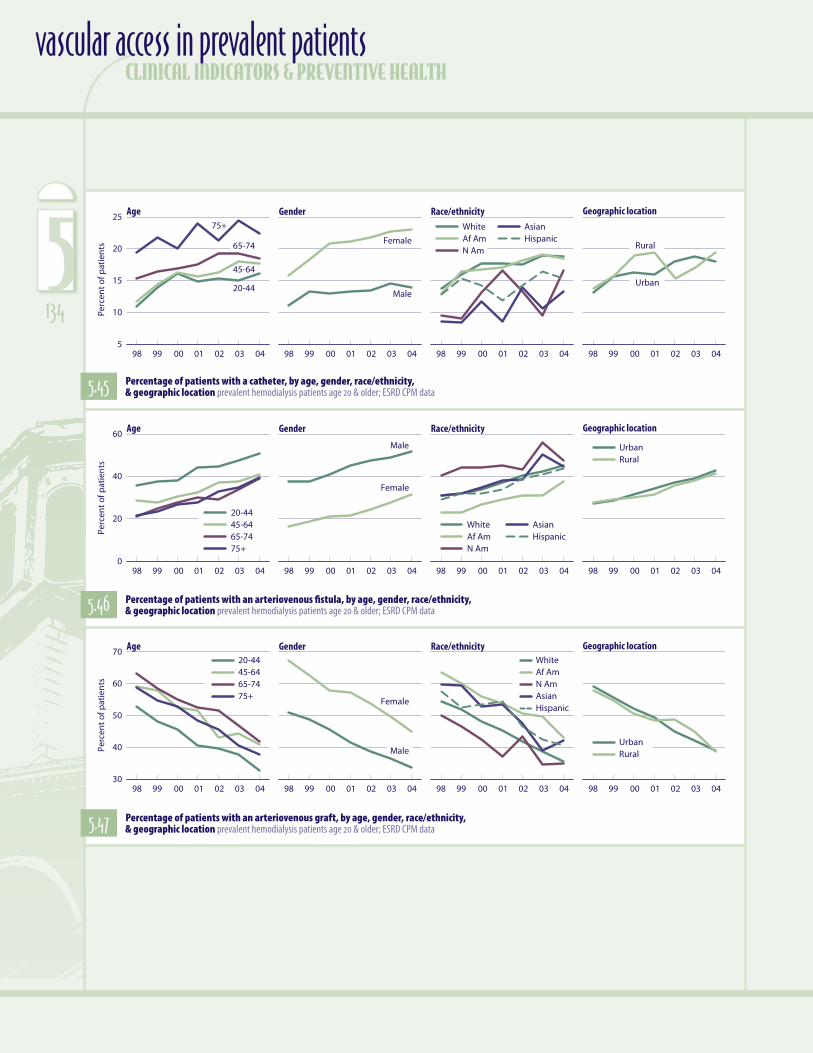
5.45 Percentage of patients with a catheter, by age, gender, race/ethnicity, & geographic location prevalent hemodialysis patients age 20 & older; ESRD CPM data
5.46 Percentage of patients with an arteriovenous fistula, by age, gender, race/ethnicity, & geographic location prevalent hemodialysis patients age 20 & older; ESRD CPM data
5.47 Percentage of patients with an arteriovenous graft, by age, gender, race/ethnicity, & geographic location prevalent hemodialysis patients age 20 & older; ESRD CPM data
vascular access in prevalent patients
134
5

98 99 00 01 02 03 04
Rate
per
pat
ien
t ye
ar
0
1
2
3Removal
Replace with catheter
Replace with internal device
98 99 00 01 02 03 04
Infection
Sepsis
Events Complications
98 99 00 01 02 03 04
Rate
per
pat
ien
t ye
ar
0.0
0.2
0.4
0.6
0.8Removal
Replace with fistula
Replace with catheter
Revision
98 99 00 01 02 03 04
Infection
Sepsis
Declot
Angioplasty
Events Complications
98 99 00 01 02 03 04
Rate
per
pat
ien
t ye
ar
0.0
0.2
0.4
0.6
0.8
1.0Replace with graft
Replace with catheter
Revision
98 99 00 01 02 03 04
Infection
Sepsis
Declot
Angioplasty
Events Complications
98 99 00 01 02 03 04
Rate
per
pat
ien
t ye
ar
0.0
0.5
1.0
1.5
2.0
2.5Removal
Replace with PD catheter
Replace with HD catheter
Replace with internal HD access
98 99 00 01 02 03 04
Infection (PD catheter)
Peritonitis
Sepsis
Events Complications
2007 USRDS Annual Data Report
5.49 Arteriovenous fistula events & complications prevalent hemodialysis patients age 20 & older, ESRD CPM & claims data5.48 Catheter events & complications prevalent
hemodialysis patients age 20 & older, ESRD CPM & claims data
5.51 Peritoneal dialysis catheter events & complications prevalent peritoneal dialysis patients age 20 & older5.50 Arteriovenous graft events & complications prevalent
hemodialysis patients age 20 & older, ESRD CPM & claims data
atheter use in patients younger than 65 has grown dramatically, rising 50 percent between 1998 and 2004 (Figure 5.45). Women tend to be placed on catheters more often than men, and their use of the access has increased more as well—46 com-pared to 27 percent. Asians were the least likely to have a catheter in 2004, at 13.3 percent, com-pared to 18.7, 18.5, 16.7, and 15.3, respectively, in whites, African Americans, Native Americans, and Hispanics. It is noteworthy, however, that catheter use has grown 75.8 and 53.9 percent in Native Americans and Asians since 1998. Use does not seem influenced by location, with cath-eters used in 17.9 percent of patients residing in an urban location and 19.4 percent of those liv-ing in rural areas.
Fifty-one percent of younger prevalent hemodialysis patients had an arteriovenous fistula as their primary access in 2004—approximately 10 percent more than among those age 45–64, 65–74, and 75 and older (Figure 5.46). The rate of increase in fis-tula use in patients 65 and older is double that found in younger patients. In 2004, 52 percent of males had fistulas compared to 31.7 percent of females, although the rate of increase in use since 1998 is much higher in women, at 90.5 versus 37.6 percent. By race/ethnicity, African Americans were the least likely to have a fistula in 2004, while Native Americans and whites were the most likely, at 47.5 and 45.3 percent, respectively. African Ameri-cans, however, demonstrate the highest percent increase since 1998, at 62.9 percent.
Not surprisingly, with catheter and fistula use on the rise, use of grafts is declining, since 1998 falling 31–38 percent across all age groups, 34 and 33 percent in men and women, 29–35 percent across racial and ethnic groups, and 33–34 percent in urban and rural locations (Figure 5.47).
Among prevalent hemodialysis patients, the most common access-related event is replacement of the access with a catheter, at 0.62 events per patient year in 2004 for those already using a catheter, 0.12 for those with a fistula, and 0.25 for those with a graft (Figures 5.48–50). While access complication rates for hemodialy-sis patients have varied over time, rates of sepsis events are gen-erally rising, reaching 2.0, 0.6, and 0.7 in patients with catheters, fistulas, and grafts, respectively.
Patients with arteriovenous accesses have experienced higher rates of angioplasties in recent years. Among those with fistu-las, rates have more than doubled since 1998, to 0.35 per patient year; rates in patients with grafts have increased 71 percent, to 0.8 per patient year. Rates for infection, on the other hand, have decreased, falling 15.3 and 21.6 percent, respectively.
Rates of most peritoneal dialysis catheter events have fallen slightly since 1998, but rates of peritonitis have not changed, remaining at 2.2 per patient year in 2004 (Figure 5.51). Sepsis rates are 0.51, compared to rates of 1.96, 0.60, and 0.66, respec-tively in patients using catheters, AV fistulas, and AV grafts. ½
figures 5.4�5–50� prevalent hemodialysis patients age 20 & older, ESRD CPM data; only includes patients who are also in the USRDS database. Year represents the prevalent year & the year the CPM data were collected. Access is that listed as
“current” on the CPM data collection form. figure 5.51 prevalent peritoneal dialysis patients, age 20 & older.
More on vascular access: p.11–13, ei.18–22, hp.11–13, 3.5–6, 8.18–21 (pediatric patients), 10.11 & 10.25–26 (by provider), 11.30–36 (costs).
C
135
5

clinical indicators & preventive health
anemia & anemia treatmentfigures 5.2–3 Between 1991 and 2005 the mean monthly hemoglobin in prevalent dialysis patients grew 2.4 g/dl, reaching 12 g/dl at the end of 2005. In the same period, weekly EPO doses rose three-fold, to over 19,000 units. figure 5.7 Claims for darbepoetin alfa use in hemodialysis patients have grown 250 percent since mid-2004, while EPO claims have remained relatively stable (DPO was introduced in 2001). figures 5.8 & 5.10� Mean hemoglobin levels in patients treated with DPO are slightly lower, and use of the drug is more common in hospital-based units.
overshooting of target hemoglobin levelsfigure 5.14� After reaching a hemoglobin level of 12 g/dl or higher, 54 percent of prevalent dialysis patients treated with EPO spend at least three months at this level. figure 5.15 Half of incident patients reach a hemoglobin of 12 g/dl by the end of the second month on hemodialysis treatment, and approximately 60 percent reach 13 g/dl by the end of month four; by the end of the first six months on dialysis, nearly 40 percent will reach 14+ g/dl.
diabetic preventive carefigure 5.21 Hemodialysis patients with diabetes are the most likely to receive an HbA1c test four or more times per year, at 56.5 percent, followed by peritoneal dialysis patients, at 48 percent. Fewer than 20 percent of transplant patients, in contrast, receive frequent testing. figure 5.24� Nearly half of diabetic ESRD patients receive two or more lipid tests in a year; nearly a third, however, receive no testing at all. figure 5.32 The proportion of patients receiving comprehensive diabetic testing, while increasing, remains disturbingly low, in 2004–2005 reaching only 12.4 percent.
general preventive carefigure 5.39 Rates of vaccination for influ-enza rose from 41.9 to 57.8 percent between 1996 and 2005, and have remained highest for patients age 75 and older—at 68.1 percent in 2005. Rates continue to be greatest in hemodialysis patients, at 62.7 percent compared to 55.8 and 40.4 percent in peritoneal dialysis and transplant patients, respectively. figure 5.4�3 By race and ethnicity, whites and Hispanics are the most likely to receive a hepatitis B vaccination, at 21.4 and 22.7 percent, and Asians the least likely, at 13.7 percent. Fewer than 2 percent of transplant patients received the vaccine in 2005.
vascular access in prevalent patientsfigure 5.4�5 Catheter use in patients younger than 65 has grown dra-matically, rising 50 percent between 1998 and 2004. Women tend to be placed on catheters more often than men, and their use of the access has increased more as well—46 compared to 27 percent. figure 5.4�6� The rate of increase in fistula use in patients 65 and older is double that found in younger patients. figures 5.4�8–50� Among preva-lent hemodialysis patients, the most common access-related event is replacement of the access with a catheter.
chapter summary
maps National means & patient populations for maps can be found in the Excel file for this chapter—on our website at www.usrds.org, & also on the CD-ROM included at the back of this book.
136
5