with the hubble space telescope jerome ...u.s. naval observatory, nautical almanac office,...
TRANSCRIPT

1993AJ....106.1330K
THE ASTRONOMICAL JOURNAL VOLUME 106, NUMBER 4
IMAGING OF THE GRAVITATIONAL LENS SYSTEM PG 1115+080 WITH THE HUBBLE SPACE TELESCOPE1
JEROME KRISTIAN
Observatories of the Carnegie Institution of Washington, 813 Santa Barbara St., Pasadena, California 91101 Electronic mail: [email protected]
EDWARD J. GROTH
Physics Department, Princeton University, P.O. Box 708, Princeton, New Jersey 08544 Electronic mail: groth@ pupgg. princeton.edu
EDWARD J. SHAYA
Department of Physics and Astronomy, University of Maryland, College Park, Maryland 20742 Electronic mail: umaip::shaya
DONALD P. SCHNEIDER
Institute for Advanced Studies, School of Natural Sciences, Olden Lane, Bldg. E, Princeton, New Jersey 08540 Electronic mail: [email protected]
JON A. HOLTZMAN
Lowell Observatory, 1400 W. Mars Hill Rd., Flagstaff, Arizona 86001 Electronic mail: holtz@ lowell.edu
WILLIAM A. BAUM
Astronomy Department, FM-20, University of Washington, Seattle, Washington 98195 Electronic mail: baum@ phast. phys. washington.edu
BEL CAMPBELL
OCTOBER 1993
Department of Physics and Astronomy, University of New Mexico, 800 Yale Blvd., N. E., Albuquerque, New Mexico 87131
ARTHUR CODE
Washburn Observatory, University of Wisconsin, 475 N. Charter St., Madison, Wisconsin 53706
Electronic mail: uwfpc::code
DOUGLAS G. CURRIE
Department of Physics and Astronomy, University of Maryland, College Park, Maryland 20742 Electronic mail: [email protected]
G. EDWARD DANIELSON
Division of Geological and Planetary Sciences, California Institute of Technology, Pasadena, California 91125
S. P. EWALD
Space Telescope Science Institute, 3700 San Martin Dr., Baltimore, Maryland 21218
J. JEFF HESTER
Department of Physics and Astronomy, Arizona State University, Tempe, Arizona 85287 Electronic mail: [email protected]
ROBERT M. LIGHT
Infrared Processing and Analysis Center, MS 100-22, California Institute of Technology, Pasadena, California 91125 Electronic mail: light@ ipac.caltech.edu
C. ROGER LYNDS AND EARL J. O'NEIL, JR.
National Optical Astronomy Observatories, P.O. Box 26732, Tucson, Arizona 85726
1330 Astron. J. 106 (4), October 1993 0004-6256/93/106(4)/1330/7/$0.90 © 1993 Am. Astron. Soc. 1330
© American Astronomical Society • Provided by the NASA Astrophysics Data System

1993AJ....106.1330K
1331 KRISTIAN ET AL: IMAGING PG 1115+080 1331
P. KENNETH SEIDELMANN
U.S. Naval Observatory, Nautical Almanac Office, Washington, DC 20392 Electronic mail: [email protected]
JAMES A. WESTPHAL
Division of Geological and Planetary Sciences, California Institute of Technology, Pasadena, California 91125 Electronic mail: sd1:~aw
Received 1993 May 26
ABSTRACT
This paper is the first of a series presenting observations of gravitational lenses and lens candidates, taken with the Wide Field/Planetary Camera (WFPC) of the Hubble Space Telescope (HST). We have resolved the gravitational lens system PG 1115 + 080 into four point sources and a red, extended object that is presumably the lens galaxy; we present accurate relative intensities, colors, and positions of the four images, and lower accuracy intensity and position of the lens galaxy, all at the epoch 1991.2. Comparison with earlier data shows no compelling evidence for relative intensity variations between the QSO components having so far been observed. The new data agree with earlier conclusions that the system is rather simple, and can be produced by the single observed galaxy. The absence of asymmetry in the HST images implies that the emitting region of the quasar itself has an angular radius smaller than about 10 milliarcsec (100 pc for H0 =50, q0 =0.5).
1. INTRODUCTION
PG 1115 + 080, the "triple quasar," was the second gravitational lens found. It was discovered by Weymann et al. ( 1980) to have three components with identical spectra, at a redshift of 1. 722. This discovery was confirmed by Young et a/. ( 1981), who also obtained direct images of the system, using a developmental CCD produced in the early days of the Wide Field/Planetary Camera (WFPC) program, and published exactly a decade before the Hubble Space Telescope (HST) observations reported here. Young et a/. investigated the possibility that the observed configuration could be produced by a single lens galaxy; as an example, they took a massive two-component (bulge plus disk) spiral at a redshift of 0.8. They found that fitting such a model to their data required that there be five images, with the brightest of the observed three components actually being a nearly degenerate, highly amplified close double, with a separation of about 0.5'', at a position angle of 20"-300. The lens galaxy in this model, as well as the fifth (very faint) QSO image, were located close to the center of the observed configuration. Their data, and independent data by Hege et a/. ( 1980), were consistent with this model, in that the brightest component was noted to be elongated by about the predicted amount in the correct direction.
Over the next six years, further details of the system were found in a remarkable series of observational tours de force, using speckle techniques and direct imaging in extremely good seeing. It was found that the brightest of the three components was indeed double; the lensing galaxy
1Based on observations with the NASA!ESA Hubble Space Telescope, obtained at the Space Telescope Science Institute, which is operated by AURA, Inc., under NASA Contract No. NAS 5-26555.
was detected (although there is some disagreement in the literature as to its location); and variability between components, on a time scale of months, was reported (Hege et al 1981; Vanderriest et al. 1983; Foy et al. 1985; Henry & Heasley 1986; Shaklan & Hege 1986; Christian et al. 1987). The picture which emerged was in general agreement with the model of Young et al. (1981).
The new HST data have confirmed in a dramatic way the results of the earlier ground-based observations, have removed their ambiguities and uncertainties, and have provided a clearer and more precise picture of the morphology of the system.
2. OBSERVATIONS
Observations were made with the WFPC operating in its longer focal length "planetary" configuration (the PC), which has a scale of 0.04389"/pixel (WFPC IDT 1992). Data were taken on 1991 March 3 and consisted of one 60 s exposure with the FS55W filter (extended Vband) and one 120 s and two 400 s exposures with the F785LP (/band) filter. Telescope pointing was within a few arcsec of nominal and the guiding was good but not excellent; the two identical long F78SLP exposures, for example, which were taken sequentially, had slightly different image shapes. This was consistent with different amounts of guiding "jitter" between exposures, as reported in the HST engineering data (20 and 40 milliarcsec).
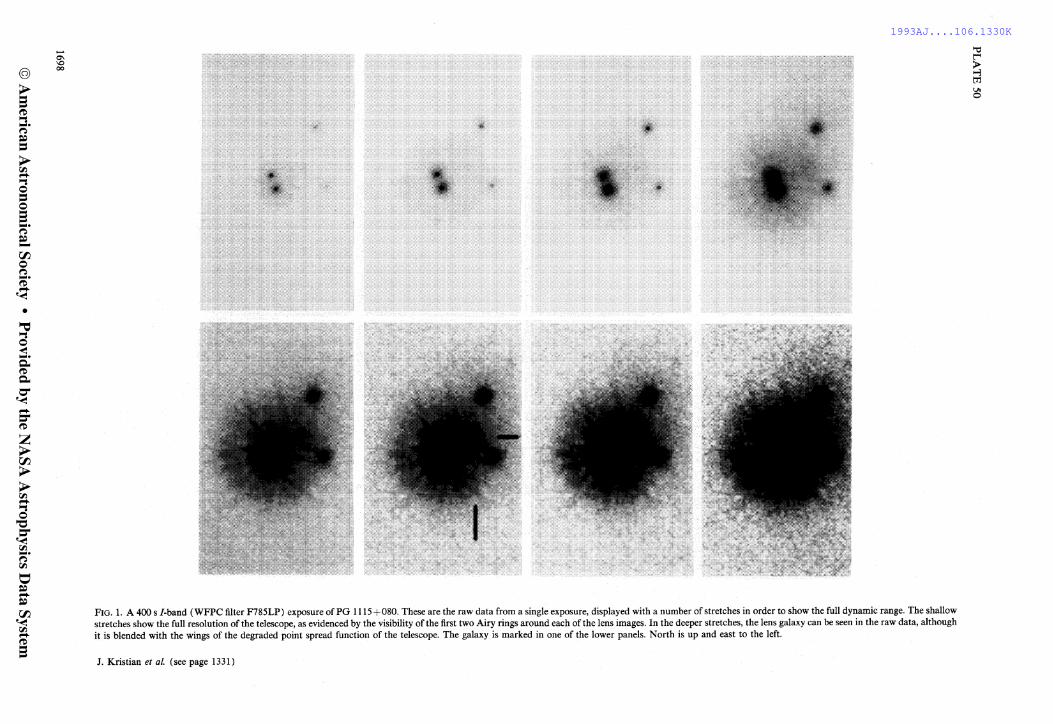
The morphology of the system was revealed unambiguously with the first WFPC images (Fig. 1; Plate 50). The system is well resolved, including the two bright components, and the lens galaxy can readily be seen in the raw data if one is familiar with the HST point spread function. The quality of the data and the ease of obtaining them compared with the limiting ground-based results, which
© American Astronomical Society • Provided by the NASA Astrophysics Data System

1993AJ....106.1330K
1332 KRISTIAN ET AL.: IMAGING PG 1115+080
are the product of formidable skill, expertise, dedication, and labor, are a striking example of the potential power of HST. To see this, the reader should compare Fig. 1 with the best ground-based images (Christian et al 1987).
2.1 Correction for the Effects of the Extended Point Spread Function
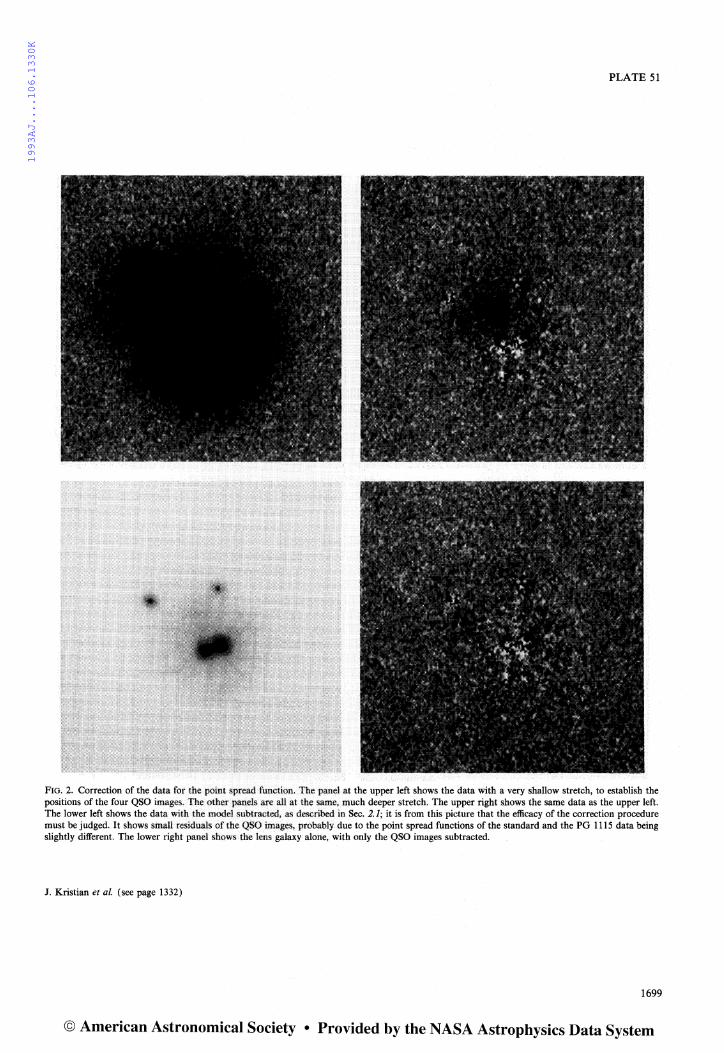
In order to examine the lens galaxy more closely, it was necessary to correct for the faint, extended wings of the QSO images, which overlap the galaxy image. This was done in several independent ways, with results that were consistent with one another but of differing quality. The best of these is shown in Fig. 2 (Plate 51); the procedure is described in detail in the remainder of this section. Other techniques produced results which were consistent with that of Fig. 2, but noisier or otherwise degraded. These included use of mathematical models of the point spread function (PSF) and of deconvolutions. In general, we have found that the best corrections to WFPC data are produced by subtraction of PSFs, with very high signal-tonoise ratio, taken at the same time as the observations.
The observations were first processed with our standard reduction algorithm (Lauer 1989; WFPC IDT 1992). This includes A-to-D correction, bias, dark, and preflash subtraction, and flat fielding. The largest uncertainty in this process is due to the flat fields used, from which we expect large scale photometric uncertainties of a few percent.
All of the /-band images were then combined into a weighted average image with cosmic rays removed using a standard "cosmic ray split" algorithm (WFPC IDT 1992). In addition, the two 400 s exposures, with cosmic rays removed, were analyzed independently in order to check on the reproducibility of the results.
In order to subtract the QSO images so that the lens may be clearly seen, a high accuracy, high signal-to-noise PSF is required (Groth et al. 1991). Unfortunately, none was available for these observations. Various experiments were tried. For example, an image of Q0957 + 561 taken at a different time was used as a PSF, but this did not have sufficient signal to noise and the result of the subtraction was to obscure the lens in noise. A calculated PSF was tried. Although the calculated PSFs are quite good, they are not sufficiently accurate at this level of detail. In this case, the lens was obscured by the systematic differences between the calculated PSF and the actual PSF.
Fortunately, observations of the BL Lac object AP Lib were obtained 16 h after the observations of PG 1115 +080. The weighted average /-band image of AP Lib is shown in Fig. 3 (Plate 52). AP Lib appears to be a very bright point source centered on a smooth, circularly symmetric galaxy. If we ignore the galaxy for the moment, then the AP Lib image is a PSF of high accuracy and high signal-to-noise ratio. It is of high accuracy because the data were acquired under essentially the same conditions and very close to the same location on the detector. It is of high signal-to-noise because it is well exposed. The central four pixels in two 500 s exposure images were saturated; these were filled in using a 30 s exposure. The underlying galaxy
1332
is non-negligible and must be removed in order to use the AP Lib image as a PSF. However, there is no independent information (i.e., a PSF!) with which to separate the point source and the galaxy. This led us to develop a procedure which simultaneously produced a point spread function for the telescope at the time of the observations, a profile of the galaxy underlying AP Lib, and an image of the PG 1115 lens system with the effects of the point spread function removed. As one might imagine, the details of this procedure are quite involved.
It was assumed that the AP Lib image contains a point source plus a smooth circularly symmetric galaxy. The galaxy was assumed to be sufficiently smooth near the center that the convolution of the HST PSF with the galaxy simply gives back the galaxy. In this case, the AP Lib image is a PSF plus a smooth circularly symmetric background. Of course, this assumption may be invalid. For example, the star distribution in AP Lib could have a cusp at the center. If this were the case, what appears to be the PSF of a point source would actually be a slightly smeared PSF. We will have additional comments on this issue below, after the results have been presented.
Given our assumption, we simply fit the AP Lib image to each QSO image, simultaneously determining the profile of the underlying galaxy, as described in detail below. Originally, we excluded a small region around the lens in order to keep the lens from biasing the fit. Inspection of the results showed that there was still significant signal from the lens under the QSO images, so a simple model for the lensing galaxy was later included in the fit.
The sky value and sky noise (including fixed noise sources such as read noise) in the PG 1115 + 080 image were computed in an annulus of radii 110 to 200 pixels, which is beyond the radius of about 100 pixels at which the azimuthal average becomes constant. The mean sky value is 0.565 data numbers (DN), and the rms deviation, asky•
is 1.535 DN. For purposes of error estimation a, the noise in the parts of the image containing signal, was assumed to be a quadratic combination of sky noise plus the square root of the net number of electrons, converted to DN; thus
(1)
where lis the net intensity (DN) in the pixel and gelf is the effective gain, in this case 17.25 electrons per data number.
The coordinates of each QSO and of AP Lib were first determined by smoothing the images with a Gaussian filter of 3.53 pixel FWHM (these smoothed images were used only in the coordinate determination step), then fitting to a two-dimensional Gaussian. Since the QSO coordinates determined in this way might be perturbed by the nearby QSO or lens images, the coordinates were recalculated after the complete fit was performed and everything but a single QSO image was subtracted from the data. The onedimensional rms change between the two measurements was only 0.06 pixels. To check for convergence, the entire procedure was iterated again, this time giving an rms difference of 0.0096 pixels. Systematic differences in the coordinates of up to a thirtieth of a pixel (0.0015") were found between the three data sets. This is well within the
© American Astronomical Society • Provided by the NASA Astrophysics Data System

1993AJ....106.1330K
1333 KRISTIAN ET AL.: IMAGING PG lll5+080 1333
TABLE 1. PG 1115+080 parameters.
Image
Parameter Stacked Frame 1 Frame 2
-r 48921 41507 44026 Degrees of Freedom 46524 46563 46545
A1 Peak Value (DN) 831.4 749.3 873.2 A1 Peak R.eeidual (DN) -35.4 62.1 -43.7
QA1 0.1162±0.00165 0.10375±0.00243 0.12531±0.00233 QAt (N orma.lized) 0.4 712±0.0067 0.4743±0.0111 0.4684±0.0087
A2 Peak Value (DN) 582.9 517.6 627.9 A2 Peak R.eeidua.l (DN) 38.7 48.7 47.9
QAz 0.08109±0.00114 0.07121±0.00164 0.08867±0.00163 Q A2 (N orma.lized) 0.3286±0.0046 0.3255±0.0075 0.3315±0.0061
B Peak Value (DN) 138.9 124.6 151.2 B Peak Residual (DN) -14.6 -13.7 -16.1
Qs 0.01907±0.00031 0.01695±0.00045 0.02081±0.00046 Qs (Normalized) 0.0773±0.0013 0.0775±0.0021 0.0778±0.0017
C Peak Value (DN) 177.2 168.1 185.7 C Peak Residual (DN) -15.0 -13.9 -14.0 Qc 0.03033±0.00045 0.02684±0.00065 0.03271±0.00064 Qc (Normalized) 0.1229±0.0018 0.1228±0.0030 0.1223±0.0024
Lens Peak Value (DN) 28.7 30.8 31.2 Lena Peak Residual (DN) 6.5 8.4 11.0 CL (DN) 6.52±0.35 6.58±0.50 6.37±0.50 a (pixela) 7.1±1.2 7.5±1.9 7.1±1.7
7 1.70±0.11 1.81±0.18 1.69±0.15
Note to TABLE 1
The effective gain is 17.25 electrons per data number in the stacked frame and 7.5 electrons per DN in the individual frames.
HST pointing stability. The one-dimensional rms was about a twentieth of a pixel and this is a good estimate of the relative accuracy of the coordinates.
Using a bicubic interpolation scheme and the coordinates determined above, the AP Lib image was then resampled four times so that it could be centered on each QSO image. Then the contents of the PG 1115 + 080 image were modeled as follows:
4
..ff(x;)= L Qj[d'j(x;-xj)-~( lx;-xji)] j=l
+CL(1+ lx;-xLI 2/a2)-Y12. (2)
In this expression ..ff(x;) is the modeled intensity, in DN, of the pixel at position X;, Q1 represents the amplitude of QSO image j relative to AP Lib, xi is the coordinate of the center of QSO j, x L is the coordinate of the center of the lens (estimated by eye), &" i is the AP Lib image resampled to the position of QSO j, ~ is the circularly symmetric profile of the galaxy in the AP Lib image, C L is the
central surface brightness (in DN per pixel) of the lens, a is a scale length for the lens, and r determines the profile of the lens at large distances. The lens model extends to 60 pixels from the center of the lens. This model for the lens is surely oversimplified, but the data will probably not allow fitting a more complicated model. The AP Lib galaxy profile, ~, was specified by its value at integral pixels: ~ (0), ~ ( 1 ), ... ,~ ( 100) and linear interpolation was used to find its value at fractional pixels. The model contains 108 parameters: the four QSO amplitudes, Qi, the three lens parameters, CL, a, andy, and the 101 AP Lib profile parameters. These parameters were determined by a weighted least squares fit which minimizes
x2 = 2: w;[f(x;> -..ff(x;> ] 2. i
(3)
Here, W;= llaf where a is defined in Eq. ( 1) and f(x;) is the value of the PG 1115 + 080 image at pixel X;. The sum extends over all pixels in the PG 1115 + 080 image which
© American Astronomical Society • Provided by the NASA Astrophysics Data System
1993AJ....106.1330K
1334 KRISTIAN ET AL.: IMAGING PG 1115+080
were within 100 pixels of the center of any QSO. This procedure was also applied to the individual400 s exposure frames in order to check the reproducibility of the results. Figure 2 shows the results. Numerical data are given in Table 1.
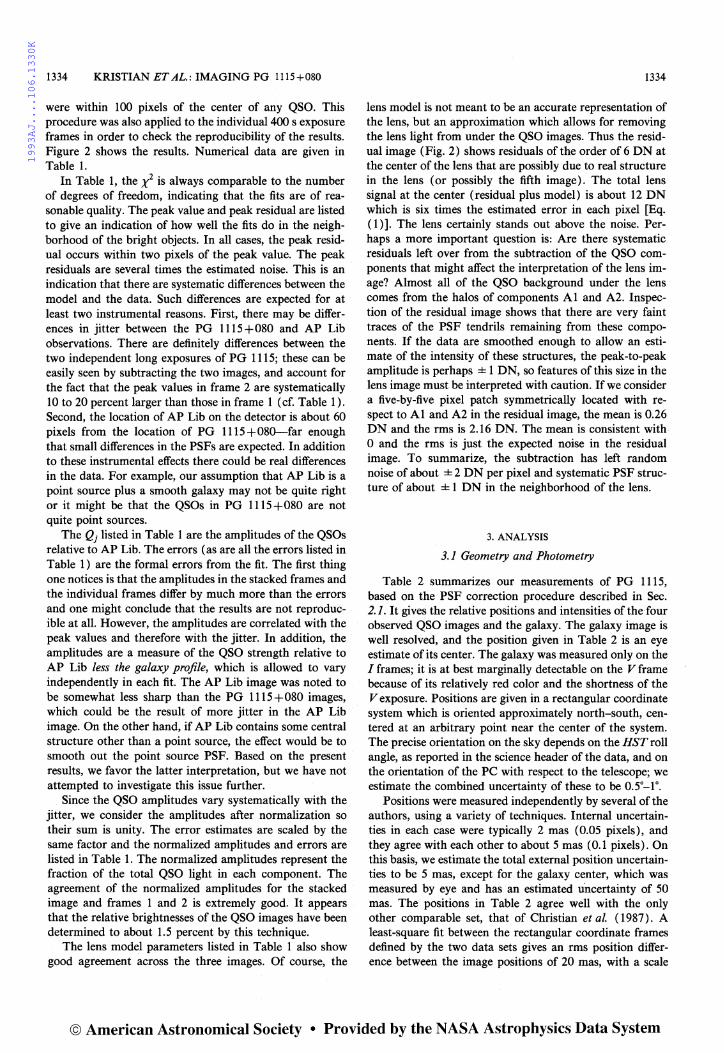
In Table 1, the x2 is always comparable to the number of degrees of freedom, indicating that the fits are of reasonable quality. The peak value and peak residual are listed to give an indication of how well the fits do in the neighborhood of the bright objects. In all cases, the peak residual occurs within two pixels of the peak value. The peak residuals are several times the estimated noise. This is an indication that there are systematic differences between the model and the data. Such differences are expected for at least two instrumental reasons. First, there may be differences in jitter between the PG 1115 + 080 and AP Lib observations. There are definitely differences between the two independent long exposures of PG 1115; these can be easily seen by subtracting the two images, and account for the fact that the peak values in frame 2 are systematically 10 to 20 percent larger than those in frame 1 ( cf. Table 1). Second, the location of AP Lib on the detector is about 60 pixels from the location of PG 1115 + 080--far enough that small differences in the PSFs are expected. In addition to these instrumental effects there could be real differences in the data. For example, our assumption that AP Lib is a point source plus a smooth galaxy may not be quite right or it might be that the QSOs in PG 1115 + 080 are not quite point sources.
The Qj listed in Table 1 are the amplitudes of the QSOs relative to AP Lib. The errors (as are all the errors listed in Table 1) are the formal errors from the fit. The first thing one notices is that the amplitudes in the stacked frames and the individual frames differ by much more than the errors and one might conclude that the results are not reproducible at all. However, the amplitudes are correlated with the peak values and therefore with the jitter. In addition, the amplitudes are a measure of the QSO strength relative to AP Lib less the galaxy profile, which is allowed to vary independently in each fit. The AP Lib image was noted to be somewhat less sharp than the PG 1115+080 images, which could be the result of more jitter in the AP Lib image. On the other hand, if AP Lib contains some central structure other than a point source, the effect would be to smooth out the point source PSF. Based on the present results, we favor the latter interpretation, but we have not attempted to investigate this issue further.
Since the QSO amplitudes vary systematically with the jitter, we consider the amplitudes after normalization so their sum is unity. The error estimates are scaled by the same factor and the normalized amplitudes and errors are listed in Table 1. The normalized amplitudes represent the fraction of the total QSO light in each component. The agreement of the normalized amplitudes for the stacked image and frames 1 and 2 is extremely good. It appears that the relative brightnesses of the QSO images have been determined to about 1.5 percent by this technique.
The lens model parameters listed in Table 1 also show good agreement across the three images. Of course, the
1334
lens model is not meant to be an accurate representation of the lens, but an approximation which allows for removing the lens light from under the QSO images. Thus the residual image (Fig. 2) shows residuals of the order of 6 DN at the center of the lens that are possibly due to real structure in the lens (or possibly the fifth image) . The total lens signal at the center (residual plus model) is about 12 DN which is six times the estimated error in each pixel [Eq. (1)]. The lens certainly stands out above the noise. Perhaps a more important question is: Are there systematic residuals left over from the subtraction of the QSO components that might affect the interpretation of the lens image? Almost all of the QSO background under the lens comes from the halos of components Al and A2. Inspection of the residual image shows that there are very faint traces of the PSF tendrils remaining from these components. If the data are smoothed enough to allow an estimate of the intensity of these structures, the peak-to-peak amplitude is perhaps ± 1 DN, so features of this size in the lens image must be interpreted with caution. If we consider a five-by-five pixel patch symmetrically located with respect to A1 and A2 in the residual image, the mean is 0.26 DN and the rms is 2.16 DN. The mean is consistent with 0 and the rms is just the expected noise in the residual image. To summarize, the subtraction has left random noise of about ± 2 DN per pixel and systematic PSF structure of about ± 1 DN in the neighborhood of the lens.
3. ANALYSIS
3.1 Geometry and Photometry
Table 2 summarizes our measurements of PG 1115, based on the PSF correction procedure described in Sec. 2.1. It gives the relative positions and intensities of the four observed QSO images and the galaxy. The galaxy image is well resolved, and the position given in Table 2 is an eye estimate of its center. The galaxy was measured only on the I frames; it is at best marginally detectable on the V frame because of its relatively red color and the shortness of the V exposure. Positions are given in a rectangular coordinate system which is oriented approximately north-south, centered at an arbitrary point near the center of the system. The precise orientation on the sky depends on the HST roll angle, as reported in the science header of the data, and on the orientation of the PC with respect to the telescope; we estimate the combined uncertainty of these to be OS-1°.
Positions were measured independently by several of the authors, using a variety of techniques. Internal uncertainties in each case were typically 2 mas (0.05 pixels), and they agree with each other to about 5 mas ( 0.1 pixels). On this basis, we estimate the total external position uncertainties to be 5 mas, except for the galaxy center, which was measured by eye and has an estimated uncertainty of 50 mas. The positions in Table 2 agree well with the only other comparable set, that of Christian et al. ( 1987). A least-square fit between the rectangular coordinate frames defined by the two data sets gives an rms position difference between the image positions of 20 mas, with a scale
© American Astronomical Society • Provided by the NASA Astrophysics Data System

1993AJ....106.1330K
1335 KRISTIAN ET AL.: IMAGING PG 1115+080
TABLE 2. Measurements of the QSO images of PG 1115.
Relative Positions• Relative lntensitiesb
arc sec y(N) x(W) F555W (V) F785LP (I)
A1 -0.699 -0.644 0.4800 0.4712 A2 -0.853 -0.190 0.3178 0.3286 B 0.957 -0.557 0.0781 0.0773
c 0.595 1.392 0.1241 0.1229 galaxy 0.24 0.07 0.06:
Notes to TABLE 2
•Positions are given in a rectangular coordinate system with x approximately west and y approximately north, centered at an arbitrary point near the geometric center of the four QSO images. Positions assume ( 1) position angle ofV3 axis=64.37•. (2) PC6 oriented along V3. (3) scale=0.04389" /pixel (WFPC IDT 1992). "Relative intensities are given in the instrumental filter system, normalized so that the sum of the four quasar images is unity. Estimated external errors for the QSO images are 1.5% (F785LP) and 3% (F555W). Note that the differences between V- and /-band measurements are negligible to within the errors ( 3% or less for all 4 images). Only relative intensities are given because of very great uncertainties ( 20%-30%) in the conversion to standard magnitudes. To within these uncertainties, the magnitude and color of the total system are V = 16.1 and V -1 =0.8. cNo galaxy intensity is given for the V band because the galaxy is too faint in this band and the exposure too short.
difference of 0.3% and a rotation of 0.4°, all of these being reasonable with respect to the uncertainties involved.
Intensities were measured independently by four of the authors, using several different techniques. The /-band values quoted in Table 2 are those produced by the PSF removal technique described in Sec. 2.1, which we judge to be the most accurate of these; the other measurements agreed to within 1.5%, which is our best estimate of the external uncertainty. The V-band measurements were not of sufficiently high quality to justify attempting a full PSF removal similar to that used for the I band. The quoted values were obtained by a simple PSF subtraction of all except one of the images in turn, to reduce the contamination from the other images, followed by aperture photometry of the bright central part of the remaining image.
The intensities in Table 2 are given in the natural system of the observations. Conversion to standard magnitudes is rather uncertain because of various unresolved difficulties with calibration of the instrument. Using the HST zero point given by Holtzman et a!. ( 1991) and the conversion to the UB V system given by Harris et a!. (1991) we find, for the magnitude and color of the total system, V = 16.1 mag, V-/=0.8 mag, with an uncertainty of 0.2 to 0.3 mag; this includes the estimated 6% contribution from the lens galaxy. To within the considerable uncertainty, these values are in agreement with earlier observations.
3.2 Comparison with Earlier Data: Limits on Observed Variations
We have compared our data in some detail with previous results, looking for significant differences which might
1335
indicate time variability. Time variations of gravitational lenses are of considerable interest because they are a tool, totally independent of classical methods, for estimating the Hubble Constant. Variations of PG 1115, both in total intensity and relative intensities between the images, have been reported from time to time in the literature. Our data are not very useful for total intensity variations (unless they are quite large-of order 0.5 mag), because of the uncertainties in absolute calibration. But they should be quite useful for relative intensity variations, where our accuracy is rather high (a few percent).
Comparison with earlier data is not simple; extstmg measurements are extremely heterogeneous, having been made by a number of observers over a number of years, using a variety of instruments, detectors, pass bands, and reduction techniques, with a wide range of quoted uncertainties, some of them rather optimistic. Nevertheless, because of the importance of the issue, we have reviewed the published photometric data and attempted to test various assumptions as to variability. Our general conclusion is that there is at present no compelling evidence for relative intensity variations between the QSO components having been seen in PG 1115.
The easiest variation to look for is a change in the fraction of the total light of the system contained in the sum of the two bright images (A 1 + A2); because this quantity is relatively easy to measure, the existing data are the most numerous and most accurate. In comparing data, we assumed in the first instance that the colors of all four of the known components are the same; this is the simplest hypothesis, and is consistent with the two data sets of highest accuracy-viz., the present paper (cf. Table 2, which shows constancy to 3%) and Christian et al. (1987), although it is marginally inconsistent with the results reported by Young et al (1981). Under this assumption, we were able to average 14 independent measurements (Hege et al. 1980; Young eta!. 1981; Vanderriest eta!. 1983; Shaklan & Hege 1986; Henry & Heasley 1986; Christian eta!. 1987). The result is that except for the first rough measurement in the discovery paper (Weymann et al. 1980), all of the data known to us are consistent with this fraction being constant, with a formal uncertainty of 2%-3%.
Other possible relative variations, e.g., of the ratio of the bright components (A 1/ A2), or of the fraction of the total light in B or C, are more difficult because there are few measurements in which A1 and A2 are resolved, and because B and C are so much fainter. Perhaps the strongest suggestion of a variation is a relative brightening of image A 1 of order 10% between 1986 (Christian et a!. 1987) and 1991 (the present work), followed by the color difference of component B suggested by Young et a!. ( 1981); but the effects are small and their statistical significance is marginal. Larger variations that have been suggested are generally associated with data which are of much lower accuracy or otherwise suspect.
This is not to argue that the system does not have brightness variations-merely that the meager data do not convincingly show variability at a few scattered epochs.
© American Astronomical Society • Provided by the NASA Astrophysics Data System

1993AJ....106.1330K
1336 K.RISTIAN ET AL.: IMAGING PG lllS+080
What is clearly needed is a systematic dedicated program to search for variability, especially on time scales of weeks to months, which are the delay times predicted by models ofPG 1115.
3.3 The Lens Galaxy, the Fifth Image, and Modeling
Although the detection of the lens galaxy is secure, the exposures are too short to obtain good quantitative data for it. Careful examination of the corrected image gives vague hints of possible features in the galaxy image, such as might be associated with a fifth image or spiral or other structure in the galaxy. A planned set of deeper exposures should provide more definite results, either positive or negative. About the only useful quantitative information given by the current data are ( 1 ) a limit for the intensity of a fifth image of 1%-2% of the intensity of AI, a result which is consistent with a wide range of plausible models; and ( 2) a more reliable position for the lens galaxy.
We approached the subject of matching the data to gravitational lensing theory from two rather different directions: (i) We explored a range of plausible analytic galaxy models which were consistent with the data, and (ii) we directly computed the lensing expected from the galaxy data in the corrected image of Fig. 2, assuming that the observed intensity distribution is a direct tracer of the projected mass of the lens galaxy. For case (i), there is a fairly wide range of simple one-galaxy models which adequately fit the data, including slightly modified versions of the original model of Young eta/. (1981). For case (ii), the current data do not appear to require lensing by anything other than the galaxy which is seen. Probably the most significant implication of these results at present is that the system looks rather simple, with imaging by a single galaxy whose structure is not very complex. In general, however, the present exposures are too short to define the morphology of the lens galaxy accurately enough to say much beyond that; the most useful piece of new information is its location.
Since the two images AI and A2 are greatly magnified and distorted (Young et a/. 1981 ) , their shape can be used to investigate the physical size of the emitting region. The simple fact that there are two distinct images rather than
1336
one already sets a limit of order 50 mas on the source size. A more stringent limit can be set from the lack of asymmetry in the individual images. Using the present data, and the models of Young et al ( 1981 ) , the absence of noticeable asymmetry in A 1 and A2 implies that the quasar has an angular radius smaller than -10 mas in the source plane (about 100 pc for H0=50, q0=0.5)
4. SUMMARY AND COMMENTS
Using the Hubble Space Telescope, we have resolved the gravitational lens system PG 1115+080, and have obtained accurate relative intensities, colors, and positions of the four known images, as well as less accurate intensity and position of the lens galaxy, at the epoch 1991.2. The data agree with earlier conclusions that the system is rather simple, and can be produced by the single observed galaxy. Comparison with earlier measurements shows no compelling evidence for relative intensity variations between the lensed images. The absence of asymmetry in the HST im- · ages implies that the emitting region of the quasar itself has an angular radius smaller than about 10 milliarcsec ( 100 pc for H0=50, q0=0.5).
PG 1115 + 080 may soon be one of the best understood gravitational lens systems, and is an excellent candidate for estimating the Hubble Constant from time delays of intensity changes between the several images. What is required for a better understanding of the system is an improved knowledge of the distance and the mass distribution of the lens galaxy, and the location and brightness of the expected fifth image. Planned HST observations should produce the second and perhaps the third and fourth of these data. The distance will have to await spectroscopy, perhaps with the FOS, but in the meantime, plausible and useful estimates can be made from the brightness and structure of the galaxy. Predicted time delay intervals are short, and the existence of four measureable images should considerably reduce the phase ambiguities in any changes that may be observed.
This research was conducted by the WFPC Investigation Definition Team, supported in part by NASA Grant No. NASS-1661.
REFERENCES
Christian, C. A., Crabtree, D., & Waddell, P. 1987, ApJ, 312, 45
Foy, R., Bonneau, D., & Blazit, A. 1985, A&A., 149, Ll3 Groth, E. J., et al. 1991, in The First Year of HST Observations, edited
by A. L. Kinney and J. C. Blades (Space Telescope Science Institute, Baltimore, Maryland)
Harris, H. C., Baum, W. A., Hunter, D. A., & Kreidl, T. J. 1991, AJ, 101, 677
Hege, E. K., Angel, J. R. P., Weymann, R. J., & Hubbard, E. N. 1980, Nature, 287, 416
Hege, E. K., Hubbard, E. N., Strittmatter, P. A., & Worden, S. P. 1981, ApJ, 248, L1
Henry, J. P., & Heasley, J. N. 1986, Nature, 321, 139 Holtzman, J. A., et al. 1991, ApJ, 369, L35
Lauer, T. R. 1989 PASP, 101, 445 Shaklan, S. B., & Hege, E. K. 1986, ApJ, 303, 605 Vanderriest, C., Wlerick, G., Tartag, A., Lelievre, G., Servan, B., &
Michet, D. 1983, in Quasars and Gravitational Lenses, 24th Liege Astrophysical Colloquium, lnstitut d' Astrophysique
Weymann, R. J., Latham, D., Angel, J. R. P, Green, R. F., Liebert, J. W., Tumshek, D. A., Tumshek, D. E., & Tyson, J. A. 1980, Nature, 285, 641
WFPC Investigation Definition Team 1992, Final Orbital/Science Verification Report, a report to the Space Telescope Science Institute, Baltimore, Maryland
Young, P. J., Deverill, R. S., Gunn, J. E., Westphal, J. A., & Kristian, J. 1981, ApJ, 244, 723
© American Astronomical Society • Provided by the NASA Astrophysics Data System
1993AJ....106.1330K
@
~ ~ ., .... ~ = = > Ill ..... ., Q
= a .... ~ = -00. Q ~ .... ~
~ •
""C ., Q < .... ~ Q..
'a' '< ..... ; z > 00. > > Ill
=t Q "0
~ Ill .... ~ ~ = S" 00. '< Ill ;;-a
-0\
"' 00
FIG. 1. A 400 s /-band (WFPC filter F785LP) exposure of PG 1115 + 080. These are the raw data from a single exposure, displayed with a number of stretches in order to show the full dynamic range. The shallow stretches show the full resolution of the telescope, as evidenced by the visibility of the first two Airy rings around each of the lens images. In the deeper stretches, the lens galaxy can be seen in the raw data, although it is blended with the wings of the degraded point spread function of the telescope. The galaxy is marked in one of the lower panels. North is up and east to the left.
J. Kristian eta/. (see page 1331)
"tl
~ Ul 0
1993AJ....106.1330K
PLATE 51
FIG. 2. Correction of the data for the point spread function. The panel at the upper left shows the data with a very shallow stretch, to establish the positions of the four QSO images. The other panels are all at the same, much deeper stretch. The upper right shows the same data as the upper left. The lower left shows the data with the model subtracted, as described. in Sec. 2.1; it is from this picture that the efficacy of the correction procedure must be judged. It shows small residuals of the QSO images, probably due to the point spread functions of the standard and the PG 1115 data being slightly different. The lower right panel shows the lens galaxy alone, with only the QSO images subtracted.
J. Kristian eta/. (see page 1332)
1699
© American Astronomical Society • Provided by the NASA Astrophysics Data System

1993AJ....106.1330K
@
> a ~ ., .... ~ = = > Ill ..... ., Q
= Q a .... ~ = -00. Q ~ .... ~
~ •
""C a < .... ~ Q..
'a' '< ..... =-~ z > 00. > > Ill
=t Q "0
~ Ill .... ~ ~ = ..... = 00. '< Ill
[
..... -...1
8
FIG. 3. The image of AP Lib which was used to remove the effects of the point spread function, as described in Sec. 2.1. This is a single exposure, shown at a number of stretches in order to cover the dynamic range. The stretches approximately match those in Fig. 1, and the orientation of the point spread function is the same as Fig. 1.
J. Kristian eta!. (see page 1332)
"C
~ VI N