wjec as/a level in biology
TRANSCRIPT

GCE AS/A LEVEL
ACCREDITED BY WELSH GOVERNMENT
WJEC AS/A LEVEL in
BIOLOGY
This Welsh Government regulated qualification is not available to centres in England.
Teaching from 2015
SPECIMEN ASSESSMENTMATERIALS


GCE AS and A LEVEL BIOLOGY Specimen Assessment Materials 1
© WJEC CBAC Ltd.

GCE AS and A LEVEL BIOLOGY Specimen Assessment Materials 3
© WJEC CBAC Ltd.

GCE AS and A LEVEL BIOLOGY Specimen Assessment Materials 5
© WJEC CBAC Ltd.
Candidate Name Centre Number Candidate Number
0
ADDITIONAL MATERIALS In addition to this examination paper, you will require a calculator and a ruler. INSTRUCTIONS TO CANDIDATES Use black ink or black ball-point pen. Do not use gel pen. Do not use correction fluid. Write your name, centre number and candidate number in the spaces at the top of this page. Answer all questions. Write your answers in the spaces provided in this booklet. INFORMATION FOR CANDIDATES The number of marks is given in brackets at the end of each question or part-question. The assessment of the quality of extended response (QER) will take place in question 8.
AS BIOLOGY UNIT 1 Basic Biochemistry and Cell Organisation SPECIMEN PAPER 1 hour 30 minutes 80 marks For Examiner’s use only
Question
Maximum Mark
Mark Awarded
1. 8
2. 13
3. 7
4. 12
5. 8
6. 9
7. 14
8. 9
Total 80

GCE AS and A LEVEL BIOLOGY Specimen Assessment Materials 6
© WJEC CBAC Ltd.
Answer all questions
1. Palmitoyl tripeptide-1 is made of three amino acids bonded to a molecule of palmitic
acid, a component of one form of a triglyceride. It is used in anti-ageing creams to stimulate collagen repair in skin.
The diagram below shows the structure of palmitoyl tripeptide-1.
The structural formulae of the amino acids present in this tripeptide are shown below.
(a) (i) Name the bond labelled X on the diagram. [1] …………………..................……………… (ii) Use the diagrams of the individual amino acids to identify the primary
structure of this tripeptide. [2] palmitic acid – ………………… - ……………… -………………………
palmitic acid
histidine lysine
glycine
X
GCE AS and A LEVEL BIOLOGY Specimen Assessment Materials 7
© WJEC CBAC Ltd.
(iii) The molecule is claimed to be better at penetrating skin due to it having
hydrophilic and hydrophobic properties. Name the part of the molecule which is hydrophobic. [1]
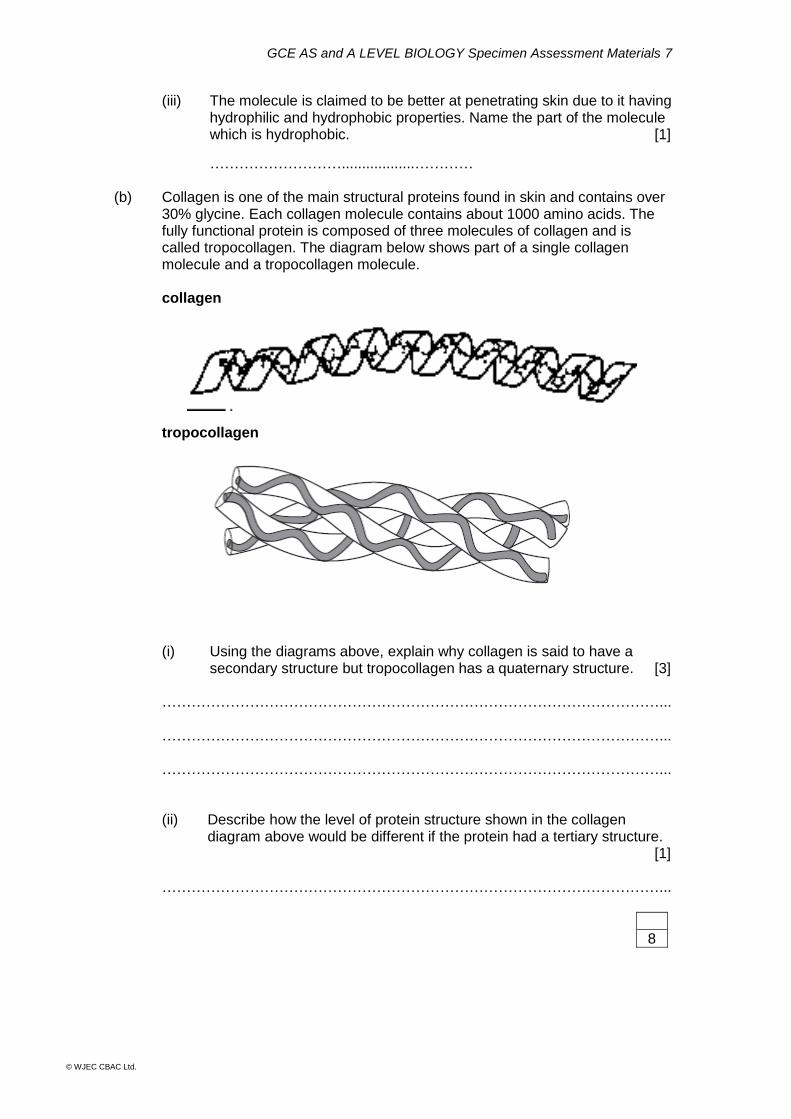
………………………..................………… (b) Collagen is one of the main structural proteins found in skin and contains over
30% glycine. Each collagen molecule contains about 1000 amino acids. The fully functional protein is composed of three molecules of collagen and is called tropocollagen. The diagram below shows part of a single collagen molecule and a tropocollagen molecule.
collagen tropocollagen
(i) Using the diagrams above, explain why collagen is said to have a
secondary structure but tropocollagen has a quaternary structure. [3] …………………………………………………………………………………………... …………………………………………………………………………………………...
…………………………………………………………………………………………...
(ii) Describe how the level of protein structure shown in the collagen diagram above would be different if the protein had a tertiary structure. [1]
…………………………………………………………………………………………...
8

GCE AS and A LEVEL BIOLOGY Specimen Assessment Materials 8
© WJEC CBAC Ltd.
2. In 1961 a group of scientists demonstrated that the genetic code for a protein
contained within DNA uses a triplet code of three bases for each amino acid. (a) (i) How many different types of amino acid are used in protein synthesis? [1] ………………………………… (ii) Explain why there must be three bases in each code. [2]
…………………………………………………………………………………………... …………………………………………………………………………………………... …………………………………………………………………………………………...
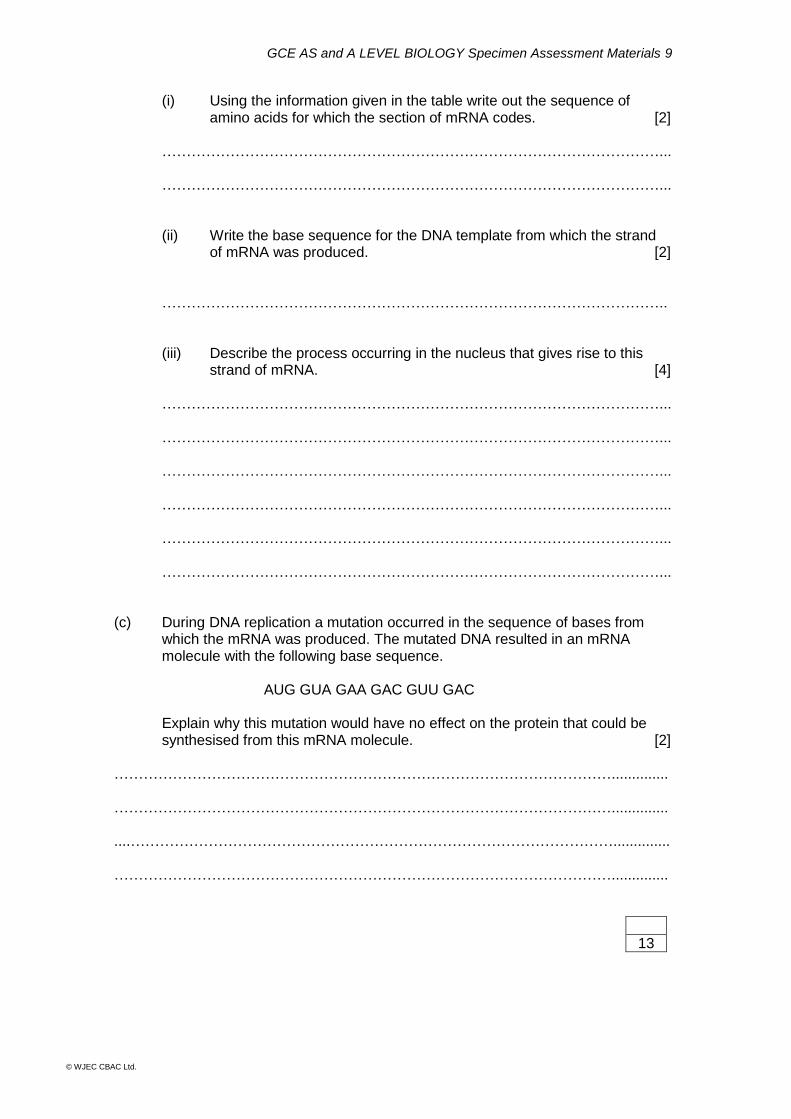
(b) The table shows some of the base sequences of mRNA together with their corresponding amino acids.
A section of mRNA produced in the nucleus of a cell is shown below.
A U G G U U G A A G A U G U U G A C
GCE AS and A LEVEL BIOLOGY Specimen Assessment Materials 9
© WJEC CBAC Ltd.
(i) Using the information given in the table write out the sequence of
amino acids for which the section of mRNA codes. [2] …………………………………………………………………………………………... …………………………………………………………………………………………... (ii) Write the base sequence for the DNA template from which the strand
of mRNA was produced. [2] ………………………………………………………………………………………….. (iii) Describe the process occurring in the nucleus that gives rise to this
strand of mRNA. [4] …………………………………………………………………………………………... …………………………………………………………………………………………... …………………………………………………………………………………………... …………………………………………………………………………………………... …………………………………………………………………………………………... …………………………………………………………………………………………... (c) During DNA replication a mutation occurred in the sequence of bases from
which the mRNA was produced. The mutated DNA resulted in an mRNA molecule with the following base sequence.
AUG GUA GAA GAC GUU GAC
Explain why this mutation would have no effect on the protein that could be
synthesised from this mRNA molecule. [2] ………………………………………………………………………………………….............. ………………………………………………………………………………………….............. ....……………………………………………………………………………………….............. …………………………………………………………………………………………..............
13
GCE AS and A LEVEL BIOLOGY Specimen Assessment Materials 10
© WJEC CBAC Ltd.
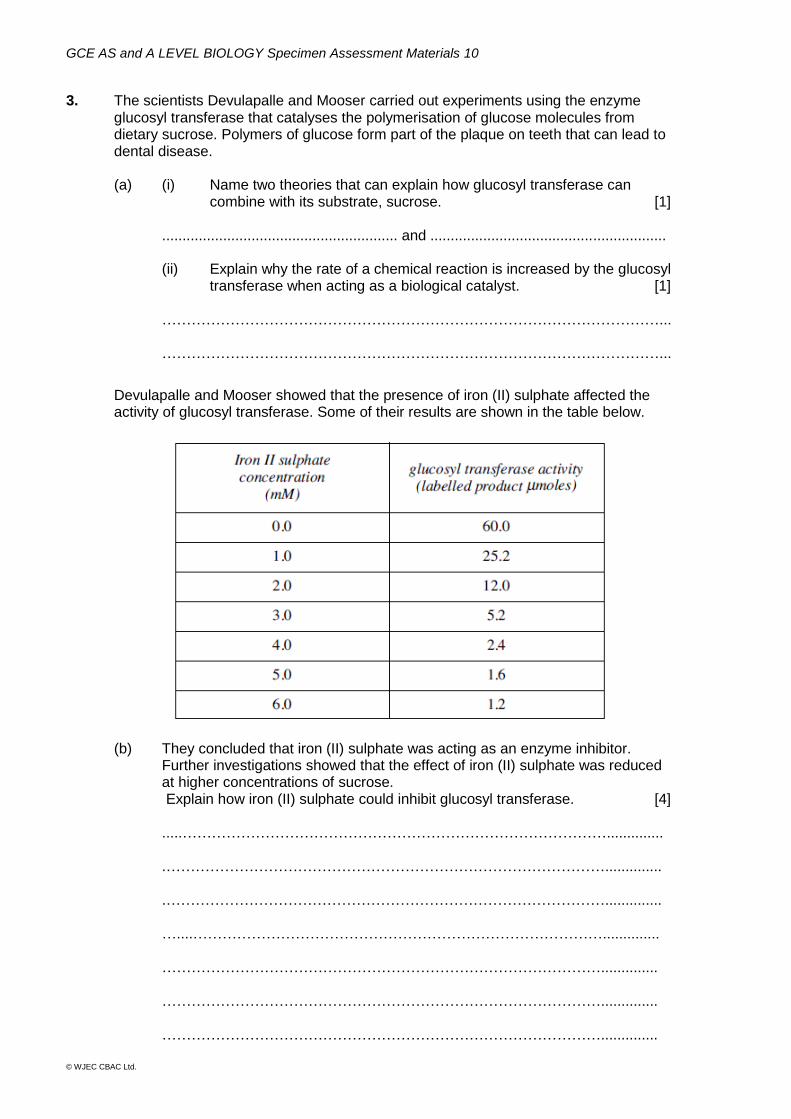
3. The scientists Devulapalle and Mooser carried out experiments using the enzyme
glucosyl transferase that catalyses the polymerisation of glucose molecules from dietary sucrose. Polymers of glucose form part of the plaque on teeth that can lead to dental disease.
(a) (i) Name two theories that can explain how glucosyl transferase can
combine with its substrate, sucrose. [1] .......................................................... and .......................................................... (ii) Explain why the rate of a chemical reaction is increased by the glucosyl
transferase when acting as a biological catalyst. [1] …………………………………………………………………………………………... …………………………………………………………………………………………...
Devulapalle and Mooser showed that the presence of iron (II) sulphate affected the activity of glucosyl transferase. Some of their results are shown in the table below. (b) They concluded that iron (II) sulphate was acting as an enzyme inhibitor.
Further investigations showed that the effect of iron (II) sulphate was reduced at higher concentrations of sucrose.
Explain how iron (II) sulphate could inhibit glucosyl transferase. [4]
.....…………………………………………………………………………….............. .………………………………………………………………………………..............
.……………………………………………………………………………….............. …....………………………………………………………………………….............. ………………………………………………………………………………..............
……………………………………………………………………………….............. ………………………………………………………………………………..............

GCE AS and A LEVEL BIOLOGY Specimen Assessment Materials 11
© WJEC CBAC Ltd.
(c) Suggest a possible use of Devulapalle and Mooser’s findings. [1] ……………………………………………………………………………….............. ……………………………………………………………………………….............. ........…………………………………………………………………………..............
7
GCE AS and A LEVEL BIOLOGY Specimen Assessment Materials 12
© WJEC CBAC Ltd.
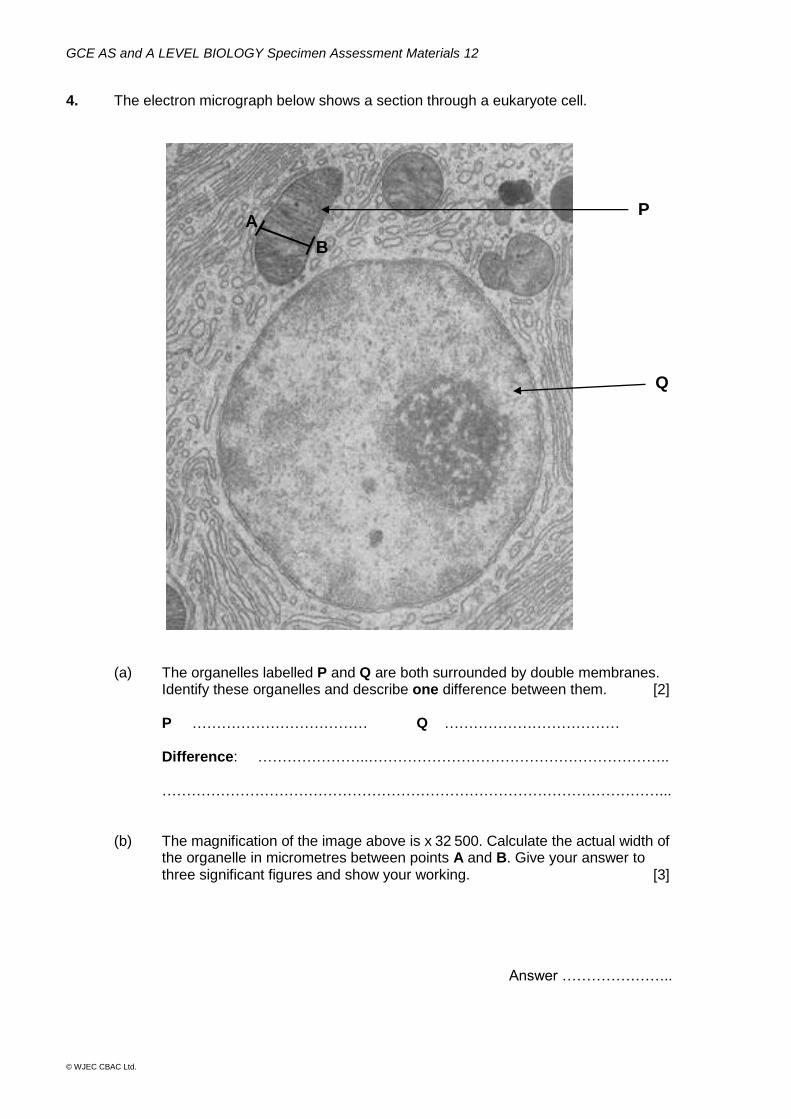
4. The electron micrograph below shows a section through a eukaryote cell.
(a) The organelles labelled P and Q are both surrounded by double membranes. Identify these organelles and describe one difference between them. [2] P ……………………………… Q ……………………………… Difference: …………………..…………………………………………………….. …………………………………………………………………………………………...
(b) The magnification of the image above is x 32 500. Calculate the actual width of the organelle in micrometres between points A and B. Give your answer to three significant figures and show your working. [3]
Answer …………………..
P
Q
A
B

GCE AS and A LEVEL BIOLOGY Specimen Assessment Materials 13
© WJEC CBAC Ltd.
(c) The surface area of the organelle shown can be estimated by using the
formula: surface area = 2πr (l + r ) where: length (l) of the organelle = 9.8 μm, π = 3.14 average diameter = 1.2 μm.
(i) Estimate the surface area of the organelle shown. Show your working. [3]
Answer ………………….. μm
2
(ii) The surface area of a spherical organelle with the same volume is
23.9μm2. Scientists have concluded from the results from experiments
that there are significant advantages to the cell if these organelles have a cylindrical shape. Evaluate this statement. [4]
…………………………………………………………………………………………... …………………………………………………………………………………………... …………………………………………………………………………………………... …………………………………………………………………………………………... …………………………………………………………………………………………... …………………………………………………………………………………………...
12
GCE AS and A LEVEL BIOLOGY Specimen Assessment Materials 14
© WJEC CBAC Ltd.
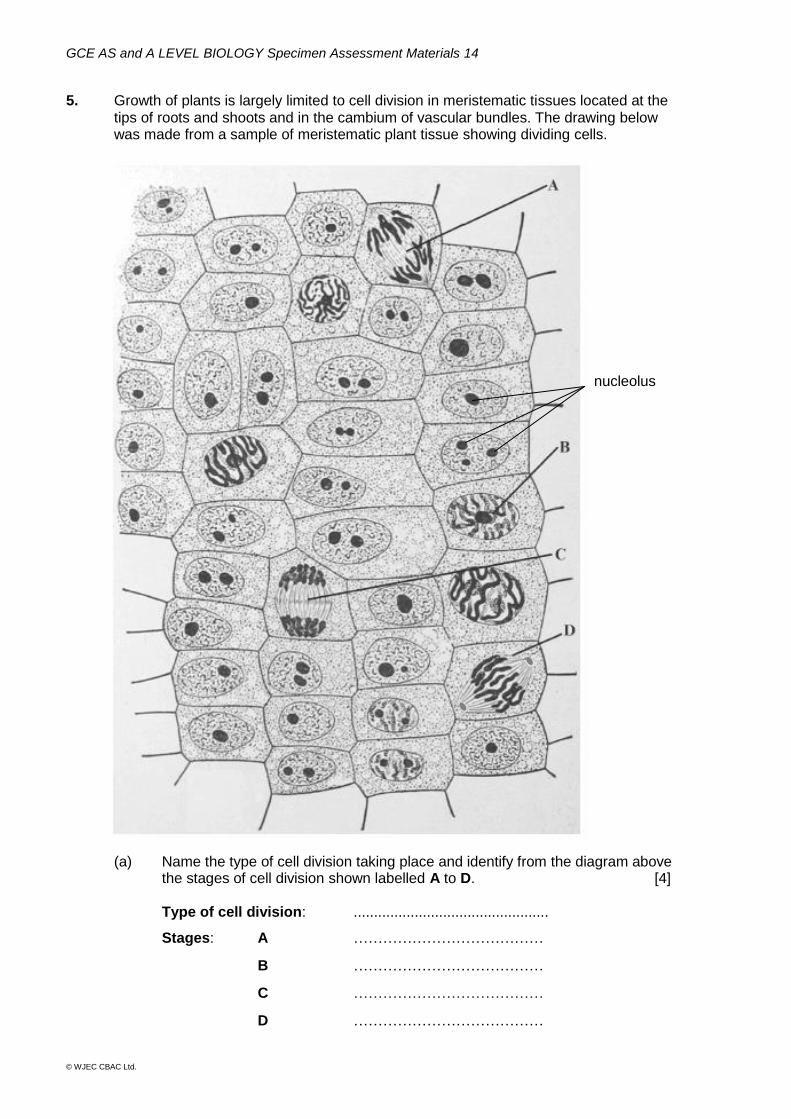
5. Growth of plants is largely limited to cell division in meristematic tissues located at the
tips of roots and shoots and in the cambium of vascular bundles. The drawing below was made from a sample of meristematic plant tissue showing dividing cells.
(a) Name the type of cell division taking place and identify from the diagram above the stages of cell division shown labelled A to D. [4]
Type of cell division: ................................................
Stages: A …………………………………
B …………………………………
C …………………………………
D …………………………………
nucleolus
GCE AS and A LEVEL BIOLOGY Specimen Assessment Materials 15
© WJEC CBAC Ltd.
(b) One stage of the cell cycle shown on the diagram is present in greater
numbers than the others. (i) Name this stage and explain what this suggests about the relative
length of this stage? [2]
…………………………………………………………………………………………... …………………………………………………………………………………………...
(ii) Describe how you could improve your confidence in your conclusion. [2]
…………………………………………………………………………………………... …………………………………………………………………………………………...
8
GCE AS and A LEVEL BIOLOGY Specimen Assessment Materials 16
© WJEC CBAC Ltd.
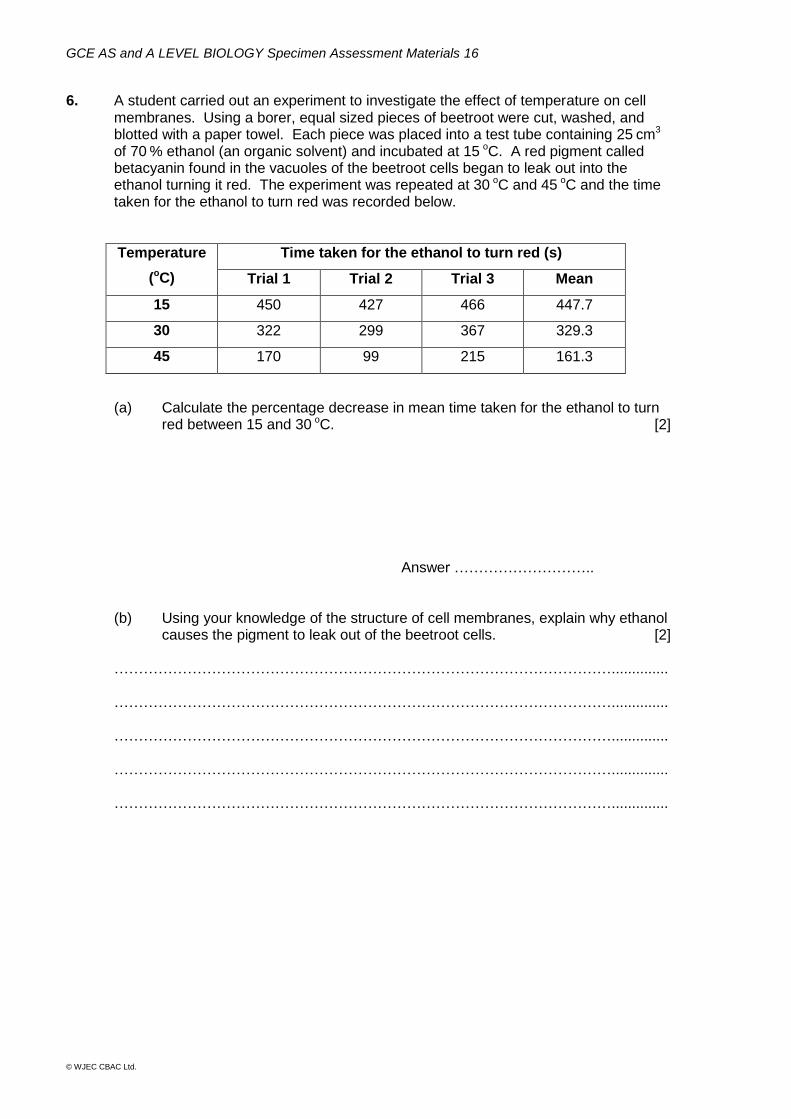
6. A student carried out an experiment to investigate the effect of temperature on cell
membranes. Using a borer, equal sized pieces of beetroot were cut, washed, and blotted with a paper towel. Each piece was placed into a test tube containing 25 cm3 of 70 % ethanol (an organic solvent) and incubated at 15
oC. A red pigment called betacyanin found in the vacuoles of the beetroot cells began to leak out into the ethanol turning it red. The experiment was repeated at 30
oC and 45 oC and the time
taken for the ethanol to turn red was recorded below.
Temperature
(oC)
Time taken for the ethanol to turn red (s)
Trial 1 Trial 2 Trial 3 Mean
15 450 427 466 447.7
30 322 299 367 329.3
45 170 99 215 161.3
(a) Calculate the percentage decrease in mean time taken for the ethanol to turn red between 15 and 30
oC. [2]
Answer ………………………..
(b) Using your knowledge of the structure of cell membranes, explain why ethanol causes the pigment to leak out of the beetroot cells. [2]
…………………………………………………………………………………………..............
………………………………………………………………………………………….............. …………………………………………………………………………………………..............
…………………………………………………………………………………………..............
…………………………………………………………………………………………..............
GCE AS and A LEVEL BIOLOGY Specimen Assessment Materials 17
© WJEC CBAC Ltd.
(c) What conclusions could be drawn from this experiment regarding the effect of
temperature on cell membranes? [3] …………………………………………………………………………………………..............
…………………………………………………………………………………………..............
…………………………………………………………………………………………..............
(d) Comment on the validity of your conclusion. [2] …………………………………………………………………………………………..............
………………………………………………………………………………………….............. …………………………………………………………………………………………..............
9

GCE AS and A LEVEL BIOLOGY Specimen Assessment Materials 18
© WJEC CBAC Ltd.
7. Pectin is a structural polysaccharide found in plant cell walls and in the middle lamella
between cells, where it acts to bind cells together. Pectinases are enzymes that are used routinely in industry to increase the volume and clarity of fruit juice extracted from apples. The enzyme is immobilised and then placed inside a column. Apple pulp is added at the top, and juice is collected at the bottom. The process is shown in the diagram below.
(a) Explain why reducing the flow rate of material through the column would result in increased juice collected. [2]
…………………………………………………………………………………………..............
………………………………………………………………………………………….............. …………………………………………………………………………………………..............
immobilised pectinase
GCE AS and A LEVEL BIOLOGY Specimen Assessment Materials 19
© WJEC CBAC Ltd.
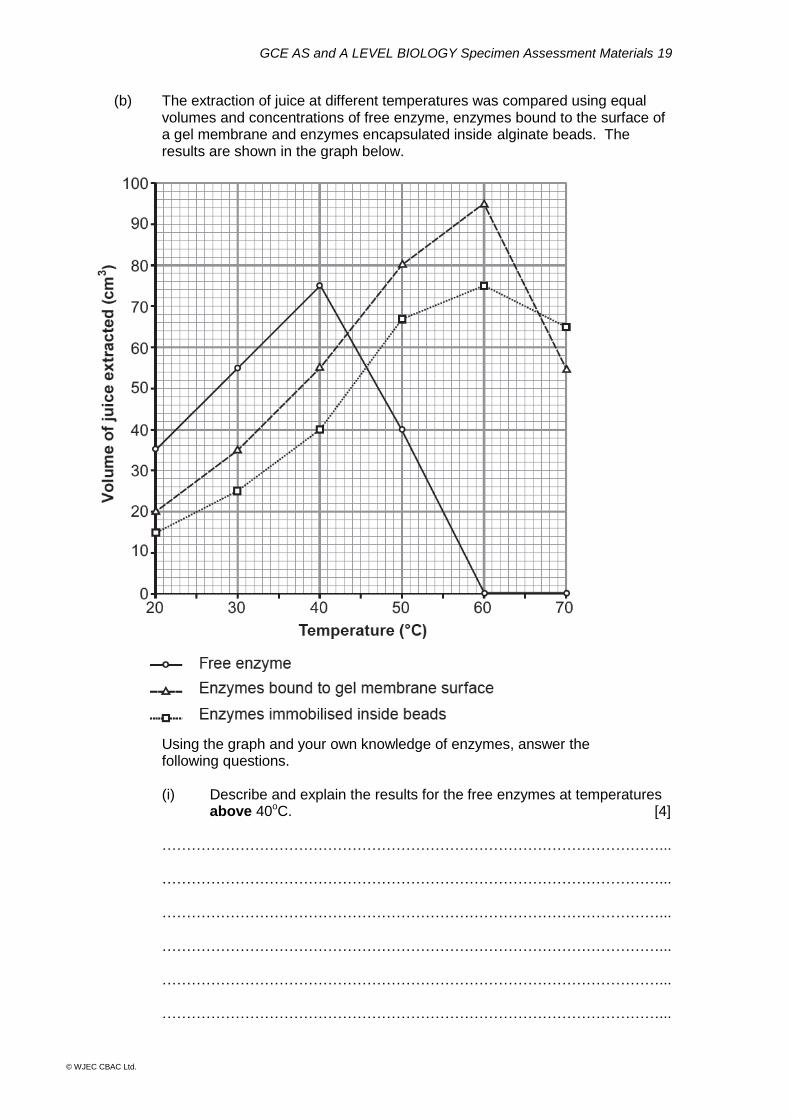
(b) The extraction of juice at different temperatures was compared using equal
volumes and concentrations of free enzyme, enzymes bound to the surface of a gel membrane and enzymes encapsulated inside alginate beads. The results are shown in the graph below.
Using the graph and your own knowledge of enzymes, answer the following questions.
(i) Describe and explain the results for the free enzymes at temperatures above 40oC. [4]
…………………………………………………………………………………………... …………………………………………………………………………………………...
…………………………………………………………………………………………... …………………………………………………………………………………………...
…………………………………………………………………………………………... …………………………………………………………………………………………...
GCE AS and A LEVEL BIOLOGY Specimen Assessment Materials 20
© WJEC CBAC Ltd.
(ii) Explain why a higher yield of juice was obtained when using free enzymes between temperatures of 20oC and 40oC than when using either kind of immobilised enzyme. [2]
…………………………………………………………………………………………...
…………………………………………………………………………………………...
…………………………………………………………………………………………...
…………………………………………………………………………………………...
(iii) Explain the differences seen in the results for the enzymes bound to the gel membrane surface with those immobilised inside the beads, between temperatures of 20oC and 60oC. [2]
…………………………………………………………………………………………...
…………………………………………………………………………………………... …………………………………………………………………………………………...
…………………………………………………………………………………………...
(iv) A Welsh apple juice producer wishes to increase their yield of apple juice. Use the information given to outline how they could adapt the basic method shown to extract a higher volume of apple juice. Explain the recommended modifications. [4]
…………………………………………………………………………………………... …………………………………………………………………………………………... …………………………………………………………………………………………... …………………………………………………………………………………………... …………………………………………………………………………………………... …………………………………………………………………………………………... …………………………………………………………………………………………...
14

GCE AS and A LEVEL BIOLOGY Specimen Assessment Materials 21
© WJEC CBAC Ltd.
8. It was once suggested that ‘proteins are produced by ribosomes which translate a
messenger RNA molecule produced by transcription of a single gene’. With reference to your knowledge and understanding of protein structure and
synthesis, explain why the statement above does not fully describe how functional proteins are produced and secreted by eukaryotic cells.
(The quality of your extended response will be assessed in this question.) [9QER] ………………………………………………………………………………………….............. ………………………………………………………………………………………….............. ………………………………………………………………………………………….............. ………………………………………………………………………………………….............. ………………………………………………………………………………………….............. ………………………………………………………………………………………….............. ………………………………………………………………………………………….............. ………………………………………………………………………………………….............. ………………………………………………………………………………………….............. ………………………………………………………………………………………….............. ………………………………………………………………………………………….............. ………………………………………………………………………………………….............. ………………………………………………………………………………………….............. ………………………………………………………………………………………….............. ………………………………………………………………………………………….............. ………………………………………………………………………………………….............. ………………………………………………………………………………………….............. ………………………………………………………………………………………….............. ………………………………………………………………………………………….............. ………………………………………………………………………………………….............. ………………………………………………………………………………………….............. ………………………………………………………………………………………….............. ………………………………………………………………………………………….............. …………………………………………………………………………………………..............

GCE AS and A LEVEL BIOLOGY Specimen Assessment Materials 22
© WJEC CBAC Ltd.
………………………………………………………………………………………….............. ………………………………………………………………………………………….............. ………………………………………………………………………………………….............. ………………………………………………………………………………………….............. ………………………………………………………………………………………….............. ………………………………………………………………………………………….............. ………………………………………………………………………………………….............. ………………………………………………………………………………………….............. ………………………………………………………………………………………….............. ………………………………………………………………………………………….............. ………………………………………………………………………………………….............. ………………………………………………………………………………………….............. ………………………………………………………………………………………….............. ………………………………………………………………………………………….............. ………………………………………………………………………………………….............. ………………………………………………………………………………………….............. ………………………………………………………………………………………….............. ………………………………………………………………………………………….............. ………………………………………………………………………………………….............. ………………………………………………………………………………………….............. ………………………………………………………………………………………….............. ………………………………………………………………………………………….............. ………………………………………………………………………………………….............. ………………………………………………………………………………………….............. ………………………………………………………………………………………….............. ………………………………………………………………………………………….............. ………………………………………………………………………………………….............. …………………………………………………………………………………………..............

GCE AS and A LEVEL BIOLOGY Specimen Assessment Materials 23
© WJEC CBAC Ltd.
………………………………………………………………………………………….............. ………………………………………………………………………………………….............. ………………………………………………………………………………………….............. ………………………………………………………………………………………….............. ………………………………………………………………………………………….............. ………………………………………………………………………………………….............. ………………………………………………………………………………………….............. ………………………………………………………………………………………….............. ………………………………………………………………………………………….............. ………………………………………………………………………………………….............. ………………………………………………………………………………………….............. ………………………………………………………………………………………….............. ………………………………………………………………………………………….............. ………………………………………………………………………………………….............. ………………………………………………………………………………………….............. ………………………………………………………………………………………….............. ………………………………………………………………………………………….............. ………………………………………………………………………………………….............. ………………………………………………………………………………………….............. ………………………………………………………………………………………….............. ………………………………………………………………………………………….............. ………………………………………………………………………………………….............. ………………………………………………………………………………………….............. ………………………………………………………………………………………….............. ………………………………………………………………………………………….............. ………………………………………………………………………………………….............. …………………………………………………………………………………………..............
9

GCE AS and A LEVEL BIOLOGY Specimen Assessment Materials 25
© WJEC CBAC Ltd.
Candidate Name Centre Number Candidate Number
0
INFORMATION FOR CANDIDATES The number of marks is given in brackets at the end of each question or part-question. The assessment of the quality of extended response (QER) will take place in question 7.
AS BIOLOGY UNIT 2 Biodiversity and Physiology of Body Systems SPECIMEN PAPER (1 hour 30 minutes) 80 marks
For Examiner’s use only
Question
Maximum Mark
Mark Awarded
1. 11
2. 14
3. 11
4. 11
5. 16
6. 8
7. 9
Total 80
ADDITIONAL MATERIALS In addition to this examination paper, you will require a calculator and a ruler. INSTRUCTIONS TO CANDIDATES Use black ink or black ball-point pen. Do not use gel pen. Do not use correction fluid. Write your name, centre number and candidate number in the spaces at the top of this page. Answer all questions. Write your answers in the spaces provided in this booklet.

GCE AS and A LEVEL BIOLOGY Specimen Assessment Materials 26
© WJEC CBAC Ltd.
Answer all questions 1. Biological classification is based on the evolution of organisms from their most recent
common ancestor. Consequently, the characteristics used in classification are homologous. However, it is often difficult to distinguish between homologous and analogous structures that have evolved through convergent evolution.
(a) Explain the difference between homologous and analogous characteristics.
[2]
…………………………………………………………………………………...................... …………………………………………………………………………………...................... …………………………………………………………………………………...................... (b) Traditional classification systems grouped organisms into five kingdoms. Bacteria and Archaea were grouped into the kingdom Prokaryotae while the
eukaryotes were grouped into four different kingdoms. Complete the table below by giving the names of these kingdoms. [2]
Kingdom
…………………..
…………………..
…………………..
…………………..
Ch
ara
cte
ristic
main component of cell wall
none present chitin cellulose cellulose if
present
chloroplast x x present in some
species
shows tissue differentiation
x
method of nutrition
heterotrophic heterotrophic autotrophic some
heterotrophic, some autotrophic
GCE AS and A LEVEL BIOLOGY Specimen Assessment Materials 27
© WJEC CBAC Ltd.
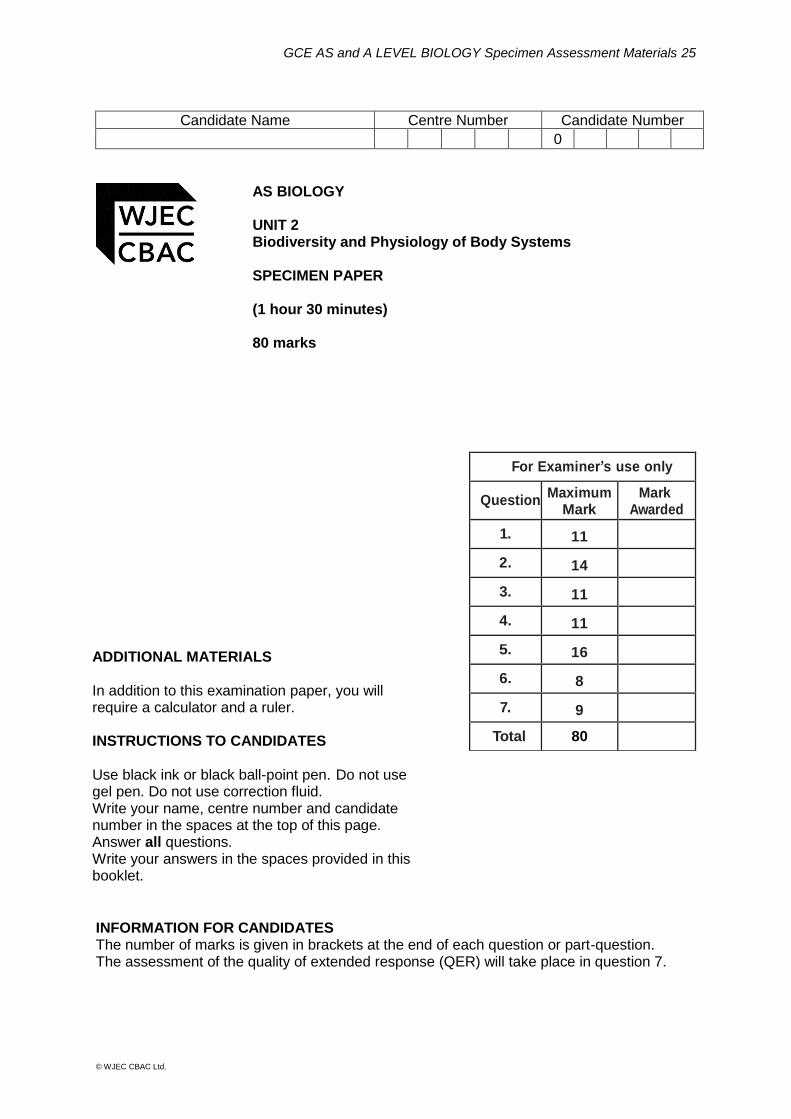
(c) A more modern classification system proposes the evolutionary relationships between organisms as shown in the diagram below.
(i) What is the name given to this type of diagram? [1] ………………………………………………………. (ii) What name is given to this theory of classification? [1] …………………………………………………………… (d) Classification of living organisms into bacteria, archaea and eukaryota has
been largely based on analysis of the gene coding for a ribosomal subunit. Describe and explain how analysis of this gene can provide evidence for this
modern theory of classification. [2]
…………………………………………………………………………………………......... ……………………………………………………………………………………………….. ………………………………………………………………………………………….........

GCE AS and A LEVEL BIOLOGY Specimen Assessment Materials 28
© WJEC CBAC Ltd.
(e) Many archaea are called ‘extremophiles’ and are found living in hot springs and water with very high or low pH. All living cells are surrounded by a cell membrane composed of phospholipids. The fatty acid and glycerol components of the phospholipid can be joined together by two different bonds as shown in the diagram below.
The ether bond is more resistant to hydrolysis in both acid and alkaline conditions than the ester bond and is also less reactive at high temperatures. Fatty acids found in phospholipids can be straight-chained or branched. Membranes containing branched phospholipid molecules are less fluid than those containing straight chain phospholipids and are less affected by high temperatures.
Use the information above to predict the structures and bonds present in the cell membranes of archaea giving reasons for your prediction. [3]
…………………………………………………………………………………………………
…………………………………………………………………………………………………
…………………………………………………………………………………………………
…………………………………………………………………………………………………
…………………………………………………………………………………………………
…………………………………………………………………………………………………
…………………………………………………………………………………………………
11
ester bond ether bond
GCE AS and A LEVEL BIOLOGY Specimen Assessment Materials 29
© WJEC CBAC Ltd.
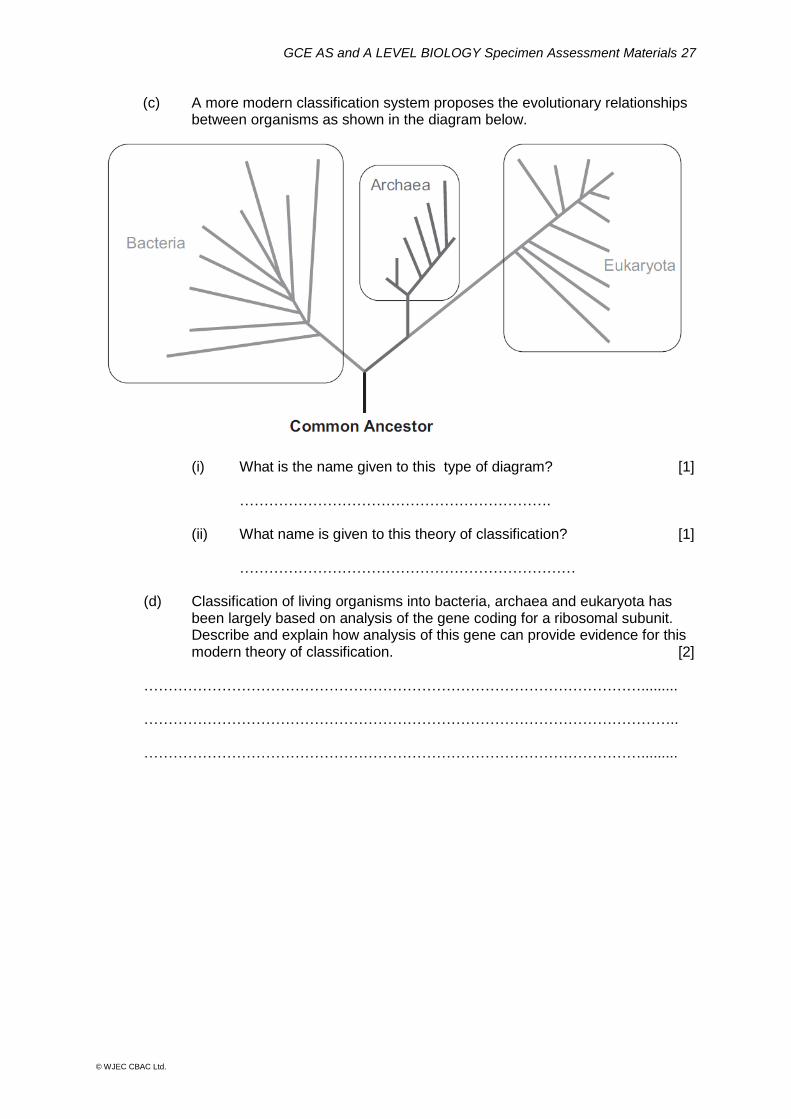
2. Fusicoccum amygdali is a parasitic fungus of peach trees and related species. The
hyphae grow in the air spaces of plant tissues and enter through wounds or open stomata. The stomata in leaves are essential for gas exchange in plants. The guard cells can open or close stomata to control water loss from the plant.
The picture below shows the appearance of these cells when the stoma is open.
(a) The maximum length of the cells at line X-XI is 65 μm. Calculate the
magnification of the image. Show your working and give your answer to three significant figures. [3]
Magnification of image = ……………….
(b) The fungus produces a toxin called fusicoccin that causes cells to increase
their uptake of potassium ions. (i) Explain how fusicoccin could affect the guard cells of stomata. [2] …………………………………………………………………………………………. …………………………………………………………………………………………. ………………………………………………………………………………………….
inner wall of cell
chloroplasts
X
Xl

GCE AS and A LEVEL BIOLOGY Specimen Assessment Materials 30
© WJEC CBAC Ltd.
(ii) Explain the biological advantage to the fungus of secreting this toxin? [2] …………………………………………………………………………………………. …………………………………………………………………………………………. …………………………………………………………………………………………. ………………………………………………………………………………………….
(c) Students were asked to set up an experiment to investigate water loss by a plant. The instructions are given below.
a. cut two leafy shoots
b. cover the leaves of one shoot with petroleum jelly (Vaseline)
c. place the shoots in separate
beakers of water and cover surface of water with oil
d. record the total mass of each
experimental setup
e. expose the shoots to light and weigh them again at 30 minute intervals for 5 hours.
The students observed that the mass of the shoot with petroleum jelly on its leaves lost less water than the shoot with no petroleum jelly.
(i) The students concluded that the mass of water lost from the shoot
was equal to the mass of water absorbed by the shoot. Explain why the pupils would be incorrect in reaching this conclusion.
[2] …………………………………………………………………………………………. …………………………………………………………………………………………. ………………………………………………………………………………………….

GCE AS and A LEVEL BIOLOGY Specimen Assessment Materials 31
© WJEC CBAC Ltd.
(ii) Describe how you could adapt this method to identify which surface of the leaves has the highest density of stomata and explain how you would use the results of your experiment to reach your conclusion.
[5] ………………………………………………………………………………………….
………………………………………………………………………………………….
………………………………………………………………………………………….
………………………………………………………………………………………….
………………………………………………………………………………………….
………………………………………………………………………………………….
………………………………………………………………………………………….
………………………………………………………………………………………….
………………………………………………………………………………………….
…………………………………………………………………………………………
14
GCE AS and A LEVEL BIOLOGY Specimen Assessment Materials 32
© WJEC CBAC Ltd.
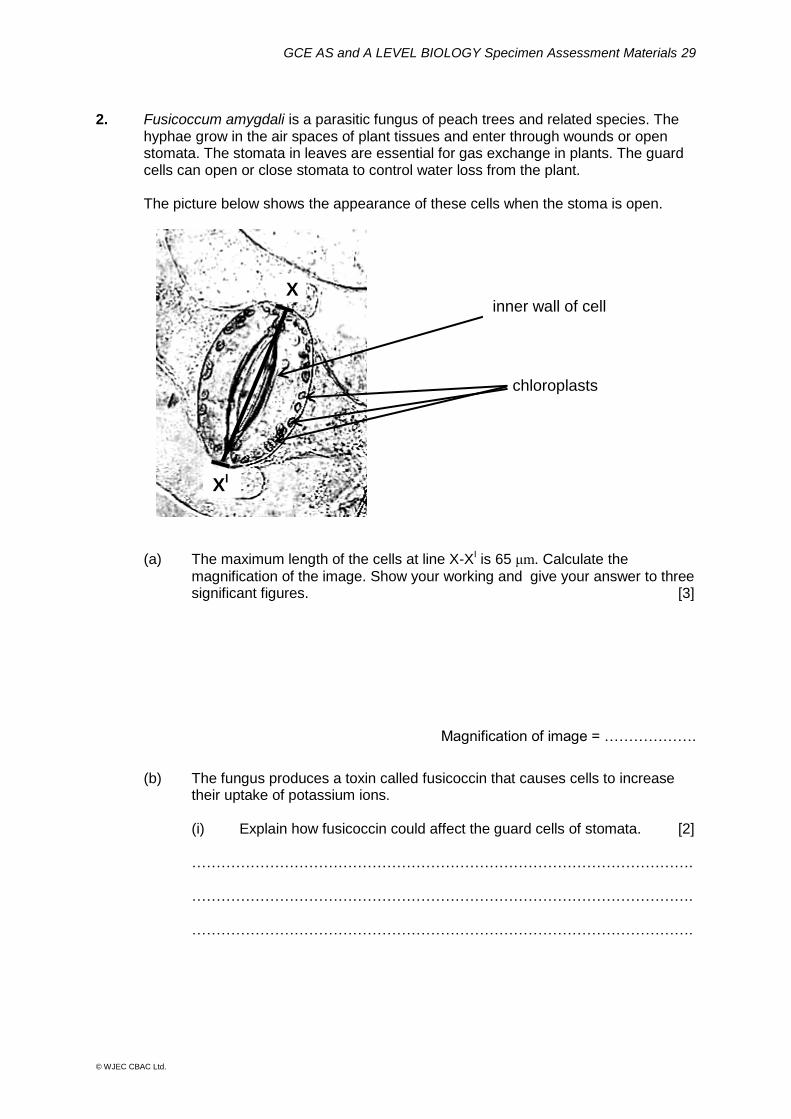
3. Coeliac disease is a common digestive condition where a person has an adverse reaction to gliadin, a component of the protein gluten, which is found in wheat. Most proteins are digested by a range of protease enzymes into short peptides made of only two to three amino acids. Gliadin is digested by both pepsin and trypsin but results in longer peptide chains than usual and it is believed that these trigger coeliac disease. Symptoms of coeliac disease include weight loss and fatigue in adults and poor growth rates in children. These symptoms are related to the effects of coeliac disease on the lining of the ileum. The photomicrographs below show sections through the ileum of a person without
coeliac disease and a person suffering from coeliac disease. Person without coeliac disease Person with coeliac disease (a) Pepsin and trypsin are enzymes involved in the digestion of proteins into
short chain peptides. (i) Explain how pepsin and trypsin digest proteins into short chain
peptides. [2] …………………………………………………………………………………………. …………………………………………………………………………………………. …………………………………………………………………………………………. (ii) Explain why pepsin and trypsin are secreted as precursor molecules
and state how they are activated. [3] …………………………………………………………………………………………. ………………………………………………………………………………………….
villus

GCE AS and A LEVEL BIOLOGY Specimen Assessment Materials 33
© WJEC CBAC Ltd.
(b) Explain how coeliac disease can cause fatigue in adults and poor growth
rates in children suffering from this disease. [4] ………………………………………………………………………………………………….. ………………………………………………………………………………………………….. ………………………………………………………………………………………………….. ………………………………………………………………………………………………….. ………………………………………………………………………………………………….. ………………………………………………………………………………………………….. ………………………………………………………………………………………………….. ………………………………………………………………………………………………….. (c) Coeliac disease can also lead to osteoporosis (brittle bones). Dairy products
are good natural sources of calcium. Teenage boys have a recommended calcium intake of 1050 mg per day.
Drinking 200 cm3 of milk would provide a teenage boy with 24% of his recommended daily allowance.
Calculate the volume of milk he would need to drink each day to reach his
recommended daily allowance of calcium, if this was his only source of calcium. [2]
Volume of milk = ......................................
11
GCE AS and A LEVEL BIOLOGY Specimen Assessment Materials 34
© WJEC CBAC Ltd.
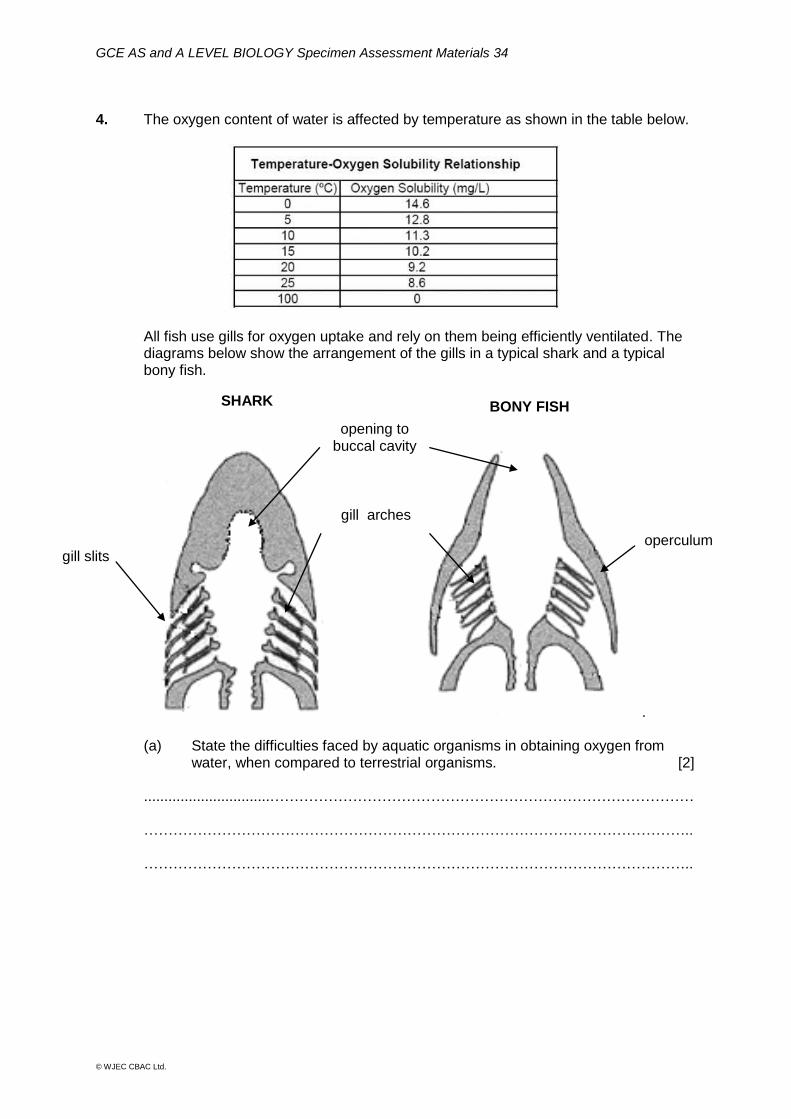
4. The oxygen content of water is affected by temperature as shown in the table below.
All fish use gills for oxygen uptake and rely on them being efficiently ventilated. The diagrams below show the arrangement of the gills in a typical shark and a typical bony fish.
. (a) State the difficulties faced by aquatic organisms in obtaining oxygen from
water, when compared to terrestrial organisms. [2] ...............................…………………………………………………………………………… ………………………………………………………………………………………………….. …………………………………………………………………………………………………..
opening to buccal cavity
gill arches
SHARK BONY FISH
operculum gill slits

GCE AS and A LEVEL BIOLOGY Specimen Assessment Materials 35
© WJEC CBAC Ltd.
(b) (i) In cartilaginous fish, such as sharks, a parallel flow system operates in the gills and in bony fish such as mackerel a counter current flow system is found.
Explain what is meant by the terms parallel flow and counter current flow and state why the counter current system is more efficient. [3]
Parallel flow ...............................…………………………………………………………
...............................…………………………………………………………
...............................…………………………………………………………
Counter current flow ...............................…………………………………………………………
...............................…………………………………………………………
...............................…………………………………………………………
Reason why counter current flow is more efficient ...............................…………………………………………………………
...............................…………………………………………………………
...............................…………………………………………………………
(ii) Some sharks will die if they are trapped in a net and cannot swim. Suggest how these sharks would normally ventilate their gills. [1] ………………………………………………………………………………………… …………………………………………………………………………………………
GCE AS and A LEVEL BIOLOGY Specimen Assessment Materials 36
© WJEC CBAC Ltd.
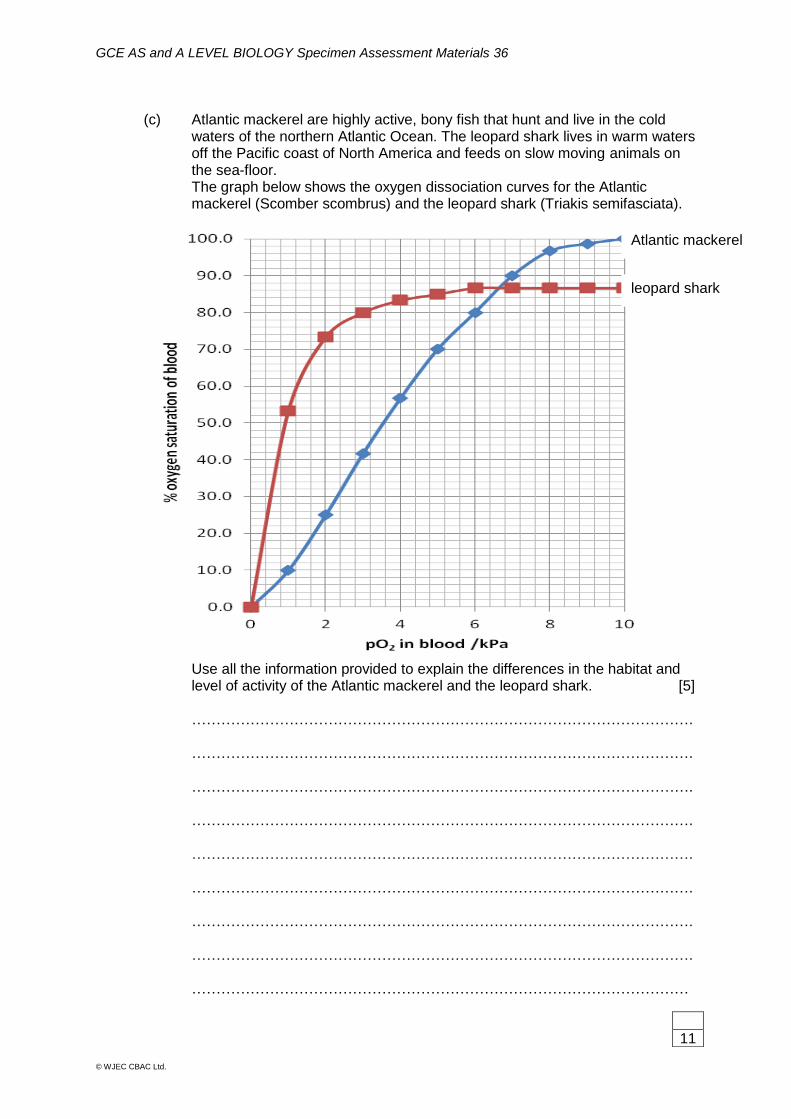
(c) Atlantic mackerel are highly active, bony fish that hunt and live in the cold
waters of the northern Atlantic Ocean. The leopard shark lives in warm waters off the Pacific coast of North America and feeds on slow moving animals on the sea-floor. The graph below shows the oxygen dissociation curves for the Atlantic mackerel (Scomber scombrus) and the leopard shark (Triakis semifasciata).
Use all the information provided to explain the differences in the habitat and level of activity of the Atlantic mackerel and the leopard shark. [5]
…………………………………………………………………………………………. …………………………………………………………………………………………. …………………………………………………………………………………………. …………………………………………………………………………………………. …………………………………………………………………………………………. ………………………………………………………………………………………….
…………………………………………………………………………………………. …………………………………………………………………………………………. …………………………………………………………………………………………
11
Atlantic mackerel
leopard shark
GCE AS and A LEVEL BIOLOGY Specimen Assessment Materials 37
© WJEC CBAC Ltd.
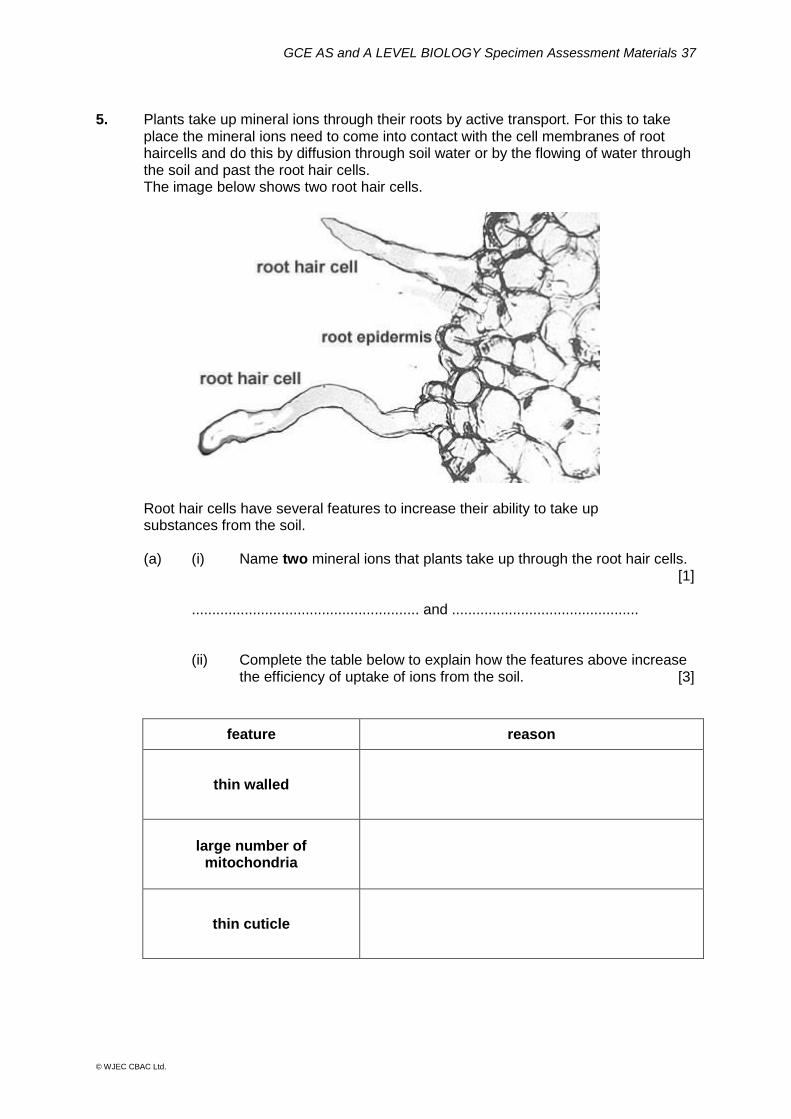
5. Plants take up mineral ions through their roots by active transport. For this to take
place the mineral ions need to come into contact with the cell membranes of root haircells and do this by diffusion through soil water or by the flowing of water through the soil and past the root hair cells.
The image below shows two root hair cells.
Root hair cells have several features to increase their ability to take up substances from the soil.
(a) (i) Name two mineral ions that plants take up through the root hair cells. [1]
........................................................ and .............................................. (ii) Complete the table below to explain how the features above increase
the efficiency of uptake of ions from the soil. [3]
feature reason
thin walled
large number of mitochondria
thin cuticle
GCE AS and A LEVEL BIOLOGY Specimen Assessment Materials 38
© WJEC CBAC Ltd.
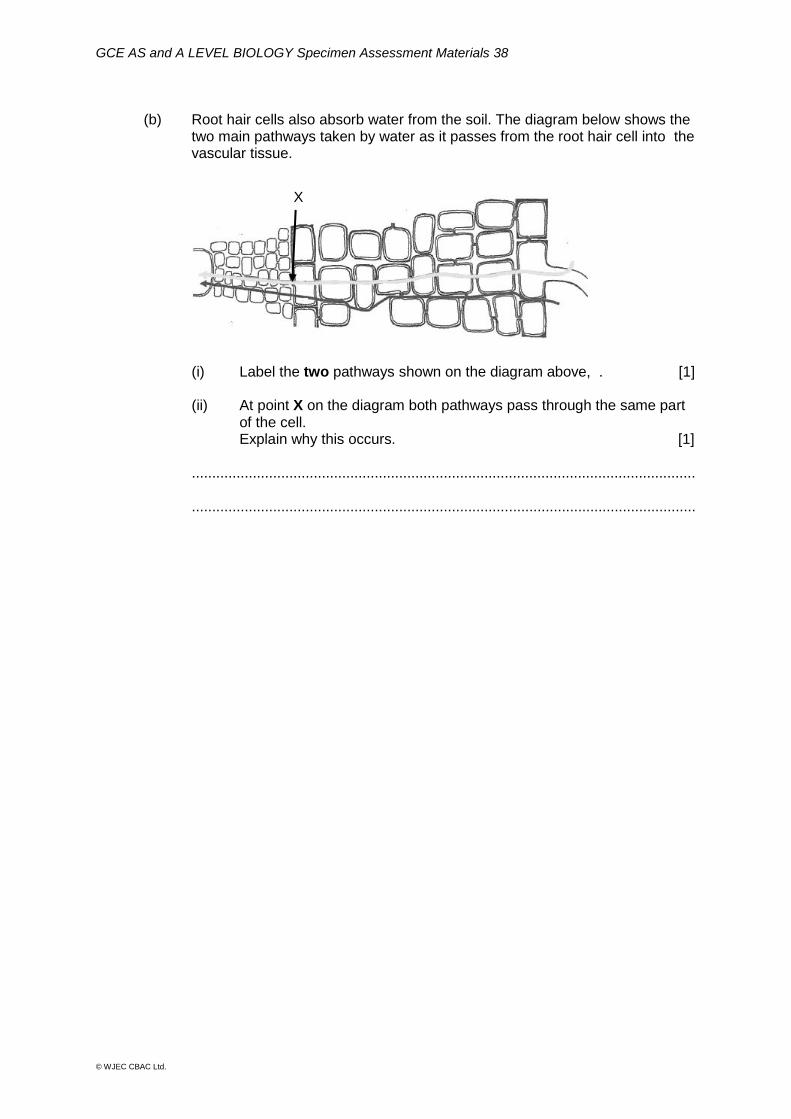
(b) Root hair cells also absorb water from the soil. The diagram below shows the
two main pathways taken by water as it passes from the root hair cell into the vascular tissue.
(i) Label the two pathways shown on the diagram above, . [1] (ii) At point X on the diagram both pathways pass through the same part
of the cell. Explain why this occurs. [1] ............................................................................................................................
............................................................................................................................
X
GCE AS and A LEVEL BIOLOGY Specimen Assessment Materials 39
© WJEC CBAC Ltd.
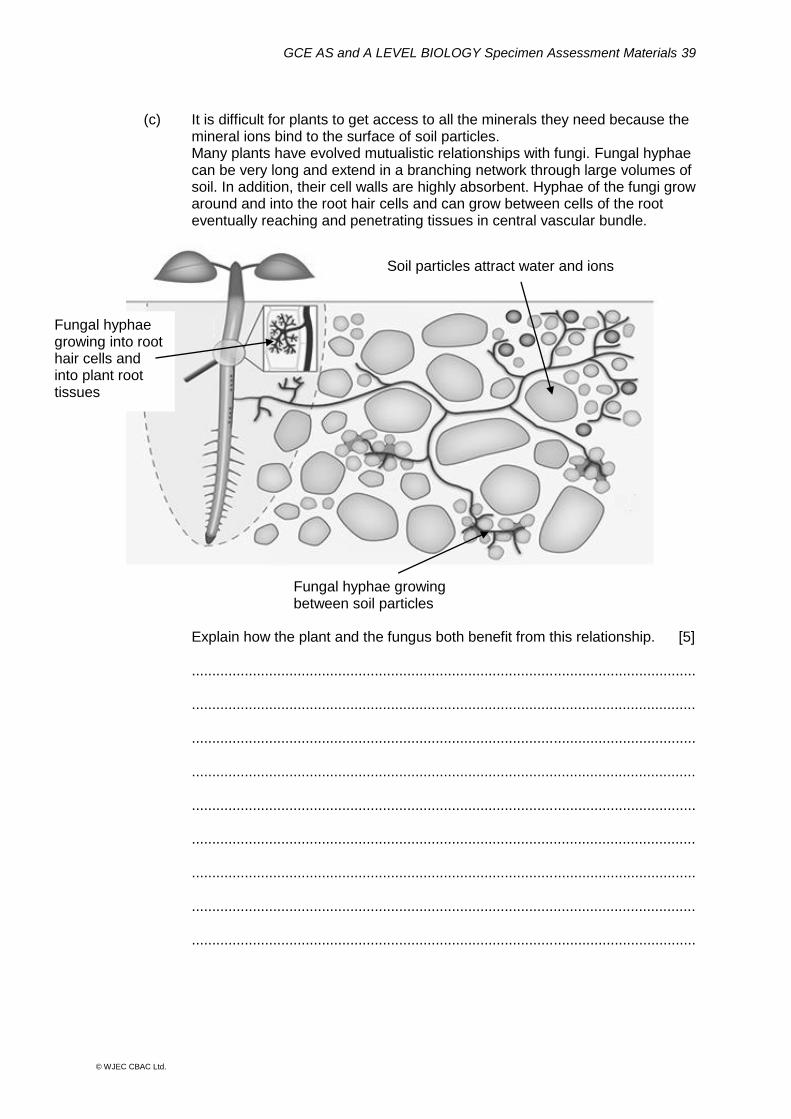
(c) It is difficult for plants to get access to all the minerals they need because the
mineral ions bind to the surface of soil particles. Many plants have evolved mutualistic relationships with fungi. Fungal hyphae
can be very long and extend in a branching network through large volumes of soil. In addition, their cell walls are highly absorbent. Hyphae of the fungi grow around and into the root hair cells and can grow between cells of the root eventually reaching and penetrating tissues in central vascular bundle.
Explain how the plant and the fungus both benefit from this relationship. [5] ............................................................................................................................
............................................................................................................................
............................................................................................................................
............................................................................................................................
............................................................................................................................
............................................................................................................................
............................................................................................................................
............................................................................................................................
............................................................................................................................
Soil particles attract water and ions
Fungal hyphae growing between soil particles
Fungal hyphae growing into root hair cells and into plant root tissues
GCE AS and A LEVEL BIOLOGY Specimen Assessment Materials 40
© WJEC CBAC Ltd.
(d) Some scientists have concluded that the relationship between fungi and plants could be classed as a form of parasitism. On what basis could this conclusion be reached? [1]
............................................................................................................................
............................................................................................................................ (e) Lichens are organisms that are an association of unicellular plants called
algae, and hyphae of a fungus. They grow on rocks or trees and are found on all continents. The following observations were made on cultures of fungi and algal components isolated from lichens.
● the fungal component grows slowly on nutrient media
● some fungal components of tree lichens have been found to secrete cellulase enzymes and some that grow on rocks secrete a weak acid
● most fungal components are deficient in the vitamin thiamine
● the algal component grows well on glucose rich culture media
● the algae can grow in the dark as long as glucose is provided
● most algae isolated from lichens have been found to secrete vitamins, including thiamine, into the culture medium
Identify the modes of nutrition shown by the algal and fungal components of a lichen giving reasons for your answers. [4]
Algal component ................................................................................................
............................................................................................................................
Fungal component .............................................................................................
............................................................................................................................
16
GCE AS and A LEVEL BIOLOGY Specimen Assessment Materials 41
© WJEC CBAC Ltd.
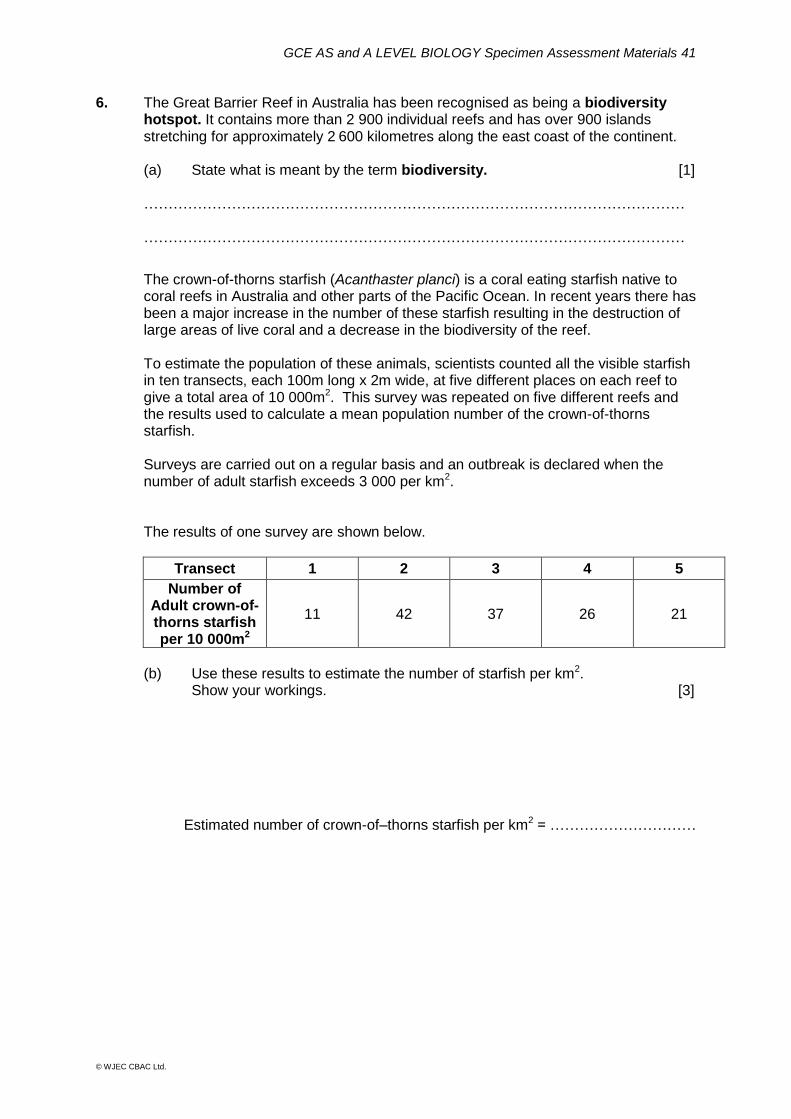
6. The Great Barrier Reef in Australia has been recognised as being a biodiversity hotspot. It contains more than 2 900 individual reefs and has over 900 islands stretching for approximately 2 600 kilometres along the east coast of the continent. (a) State what is meant by the term biodiversity. [1]
………………………………………………………………………………………………… …………………………………………………………………………………………………
The crown-of-thorns starfish (Acanthaster planci) is a coral eating starfish native to coral reefs in Australia and other parts of the Pacific Ocean. In recent years there has been a major increase in the number of these starfish resulting in the destruction of large areas of live coral and a decrease in the biodiversity of the reef.
To estimate the population of these animals, scientists counted all the visible starfish in ten transects, each 100m long x 2m wide, at five different places on each reef to give a total area of 10 000m2. This survey was repeated on five different reefs and the results used to calculate a mean population number of the crown-of-thorns starfish.
Surveys are carried out on a regular basis and an outbreak is declared when the
number of adult starfish exceeds 3 000 per km2. The results of one survey are shown below.
Transect 1 2 3 4 5
Number of Adult crown-of-thorns starfish per 10 000m2
11 42 37 26 21
(b) Use these results to estimate the number of starfish per km2.
Show your workings. [3]
Estimated number of crown-of–thorns starfish per km2 = …………………………
GCE AS and A LEVEL BIOLOGY Specimen Assessment Materials 42
© WJEC CBAC Ltd.
(c) Based on these results, the scientists concluded that they were not facing an outbreak of the crown-of-thorns starfish. Evaluate the strength of their evidence and hence the validity of their conclusion. [4]
…………………………………………………………………………………………………………… …………………………………………………………………………………………………………… …………………………………………………………………………………………………………… …………………………………………………………………………………………………………… …………………………………………………………………………………………………………… ……………………………………………………………………………………………………………
8
GCE AS and A LEVEL BIOLOGY Specimen Assessment Materials 43
© WJEC CBAC Ltd.
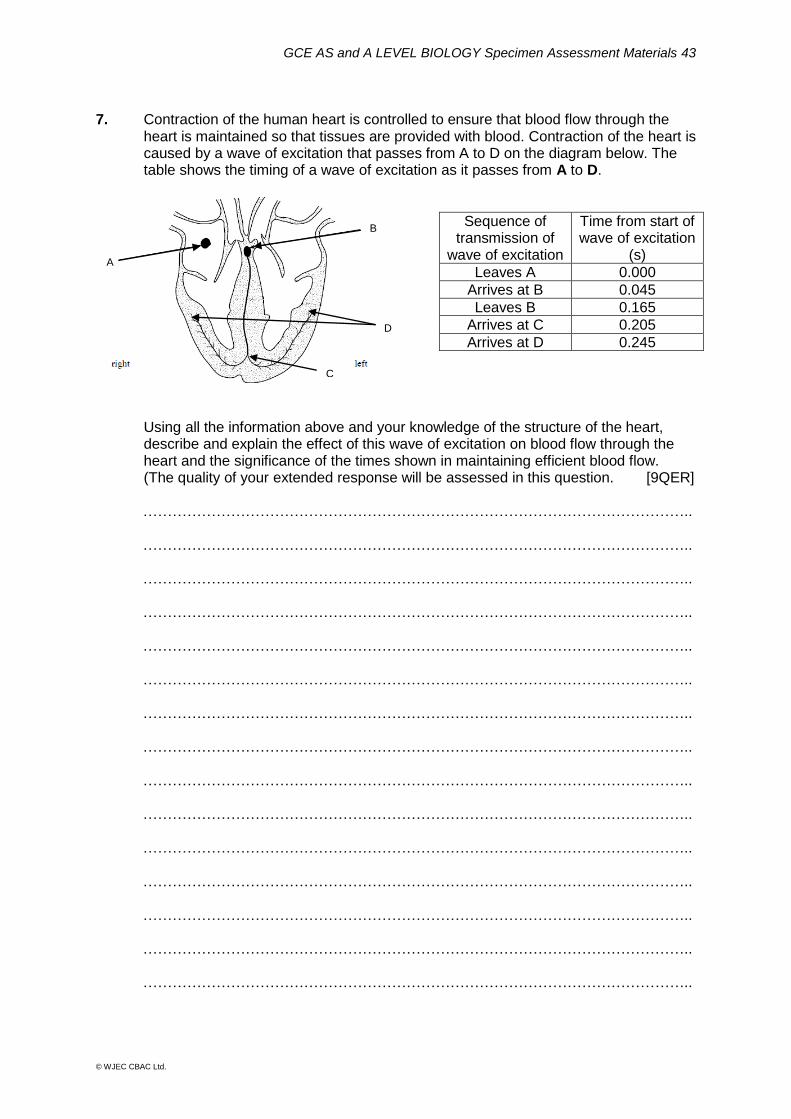
7. Contraction of the human heart is controlled to ensure that blood flow through the heart is maintained so that tissues are provided with blood. Contraction of the heart is caused by a wave of excitation that passes from A to D on the diagram below. The table shows the timing of a wave of excitation as it passes from A to D.
Sequence of transmission of
wave of excitation
Time from start of wave of excitation
(s)
Leaves A 0.000
Arrives at B 0.045
Leaves B 0.165
Arrives at C 0.205
Arrives at D 0.245
Using all the information above and your knowledge of the structure of the heart, describe and explain the effect of this wave of excitation on blood flow through the heart and the significance of the times shown in maintaining efficient blood flow. (The quality of your extended response will be assessed in this question. [9QER] ………………………………………………………………………………………………….. ………………………………………………………………………………………………….. ………………………………………………………………………………………………….. ………………………………………………………………………………………………….. ………………………………………………………………………………………………….. ………………………………………………………………………………………………….. ………………………………………………………………………………………………….. ………………………………………………………………………………………………….. ………………………………………………………………………………………………….. ………………………………………………………………………………………………….. ………………………………………………………………………………………………….. ………………………………………………………………………………………………….. ………………………………………………………………………………………………….. ………………………………………………………………………………………………….. …………………………………………………………………………………………………..
C
D
A
B

GCE AS and A LEVEL BIOLOGY Specimen Assessment Materials 44
© WJEC CBAC Ltd.
………………………………………………………………………………………………….. ………………………………………………………………………………………………….. ………………………………………………………………………………………………….. ………………………………………………………………………………………………….. ………………………………………………………………………………………………….. ………………………………………………………………………………………………….. ………………………………………………………………………………………………….. ………………………………………………………………………………………………….. ………………………………………………………………………………………………….. ………………………………………………………………………………………………….. ………………………………………………………………………………………………….. ………………………………………………………………………………………………….. ………………………………………………………………………………………………….. ………………………………………………………………………………………………….. ………………………………………………………………………………………………….. ………………………………………………………………………………………………….. ………………………………………………………………………………………………….. ………………………………………………………………………………………………….. ………………………………………………………………………………………………….. ………………………………………………………………………………………………….. ………………………………………………………………………………………………….. ………………………………………………………………………………………………….. ………………………………………………………………………………………………….. ………………………………………………………………………………………………….. ………………………………………………………………………………………………….. ………………………………………………………………………………………………….. …………………………………………………………………………………………………..

GCE AS and A LEVEL BIOLOGY Specimen Assessment Materials 45
© WJEC CBAC Ltd.
………………………………………………………………………………………………….. ………………………………………………………………………………………………….. ………………………………………………………………………………………………….. ………………………………………………………………………………………………….. ………………………………………………………………………………………………….. ………………………………………………………………………………………………….. ………………………………………………………………………………………………….. ………………………………………………………………………………………………….. ………………………………………………………………………………………………….. ………………………………………………………………………………………………….. ………………………………………………………………………………………………….. ………………………………………………………………………………………………….. ………………………………………………………………………………………………….. ………………………………………………………………………………………………….. ………………………………………………………………………………………………….. ………………………………………………………………………………………………….. ………………………………………………………………………………………………….. ………………………………………………………………………………………………….. ………………………………………………………………………………………………….. ………………………………………………………………………………………………….. ………………………………………………………………………………………………….. ………………………………………………………………………………………………….. ………………………………………………………………………………………………….. …………………………………………………………………………………………………..
9


GCE AS and A LEVEL BIOLOGY Specimen Assessment Materials 47
© WJEC CBAC Ltd.
Candidate Name Centre Number Candidate Number
0
INFORMATION FOR CANDIDATES The number of marks is given in brackets at the end of each question or part-question. The assessment of the quality of extended response (QER) will take place in question 7.
A LEVEL BIOLOGY UNIT 3 Energy, Homeostasis and the Environment SPECIMEN PAPER (2 hours) 90 marks
For Examiner’s use only
Question
Maximum Mark
Mark Awarded
1 16
2 11
3 11
4 17
5 10
6 16
7 9
TOTAL 90
ADDITIONAL MATERIALS In addition to this examination paper, you will require a calculator and a ruler. INSTRUCTIONS TO CANDIDATES Use black ink or black ball-point pen. Do not use gel pen. Do not use correction fluid. Write your name, centre number and candidate number in the spaces at the top of this page. Answer all questions. Write your answers in the spaces provided in this booklet.

GCE AS and A LEVEL BIOLOGY Specimen Assessment Materials 48
© WJEC CBAC Ltd.
1. Diabetes is a medical condition in which a person is unable to control their blood
glucose levels. Phlorizin is a naturally occurring substance found in some plant tissues. Due to its effect on the reabsorption of glucose by nephrons it has been considered as a possible treatment for Type II diabetes, which is caused mainly by lifestyle choices such as a high sugar diet.
The photomicrograph below shows part of the glomerulus at a magnification of
X 6 900.
(a) Explain how the structures shown in the micrograph are adapted for the process of ultrafiltration. [3]
………………………………………………………………………………………………….. .…………………………………………………………………………. ……………………... ………………………………………………………………………….………………………. ………………………………………………………………………………………………….. .…………………………………………………………………………. ……………………... ………………………………………………………………………….……………………….
‘feet‘ of podocyte
endothelium
basement membrane
GCE AS and A LEVEL BIOLOGY Specimen Assessment Materials 49
© WJEC CBAC Ltd.
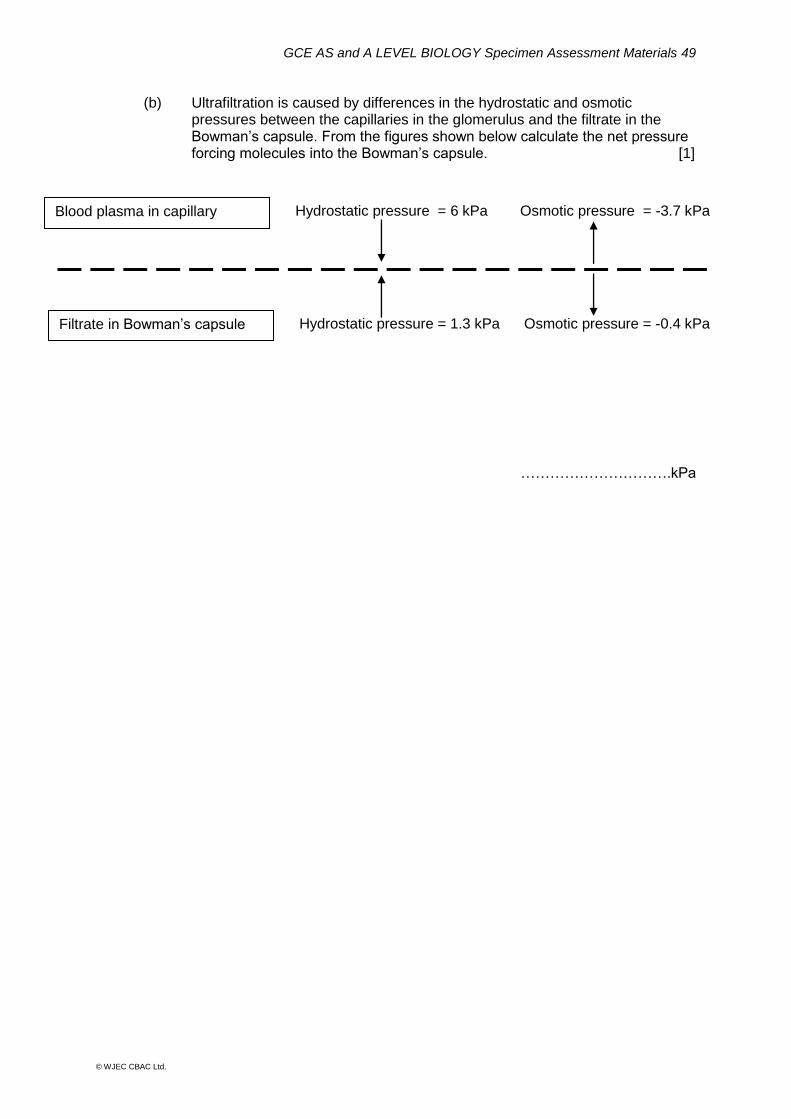
(b) Ultrafiltration is caused by differences in the hydrostatic and osmotic pressures between the capillaries in the glomerulus and the filtrate in the Bowman’s capsule. From the figures shown below calculate the net pressure forcing molecules into the Bowman’s capsule. [1]
………………………….kPa
Blood plasma in capillary
Filtrate in Bowman’s capsule
Hydrostatic pressure = 6 kPa
Hydrostatic pressure = 1.3 kPa
Osmotic pressure = -3.7 kPa
Osmotic pressure = -0.4 kPa

GCE AS and A LEVEL BIOLOGY Specimen Assessment Materials 50
© WJEC CBAC Ltd.
(c) The proximal convoluted tubule of the kidney nephron selectively reabsorbs glucose and sodium ions into the surrounding blood capillaries. The uptake of glucose from the lumen of the tubule can be prevented completely by introducing a chemical called phlorizin.
The graph below shows the concentration of glucose as the filtrate passes along the tubule.
(i) Calculate the % increase of glucose in the tubule from 0 to 4mm in the nephron treated with phlorizin. [2]
Answer = --------------------- %
(ii) Research has shown that phlorizin stops ATP synthesis and binds to membrane proteins. Explain how phlorizin could prevent glucose reabsorption from the filtrate. [5] …………………………………………………………………………………………. .………………………………………………………………………….……………... ………………………………………………………………………….……………… …………………………………………………………………………..……………...
…………………………………………………………………………..……………...

GCE AS and A LEVEL BIOLOGY Specimen Assessment Materials 51
© WJEC CBAC Ltd.
(d) Type I diabetes is an inherited condition that has been linked to the
inheritance of alleles of genes involved in the control of the immune response. Some genotypes have been found to increase the risk of developing Type I diabetes, while others appear to reduce this risk.
The table below shows information on some alleles that affect the risk of
developing Type I diabetes. In a heterozygous individual both alleles are expressed in the phenotype.
Allele Effect on risk of developing
Type I diabetes
DR 2 Reduces risk
DR 3 Medium risk
DR 4 Medium risk
Genetic counselling was given to a couple. The woman had Type 1 diabetes and was homozygous for the DR3 allele while her partner did not have diabetes and was found to have DR2 and DR4 alleles in his genotype. Identify the possible genotypes of their children and conclude their risk of developing Type 1 diabetes. [5] …………………………………………………………………………………………. .…………………………………………………………………………. …………….. ………………………………………………………………………….……………… …………………………………………………………………………..……………...
…………………………………………………………………………..……………... …………………………………………………………………………..……………...
16
GCE AS and A LEVEL BIOLOGY Specimen Assessment Materials 52
© WJEC CBAC Ltd.
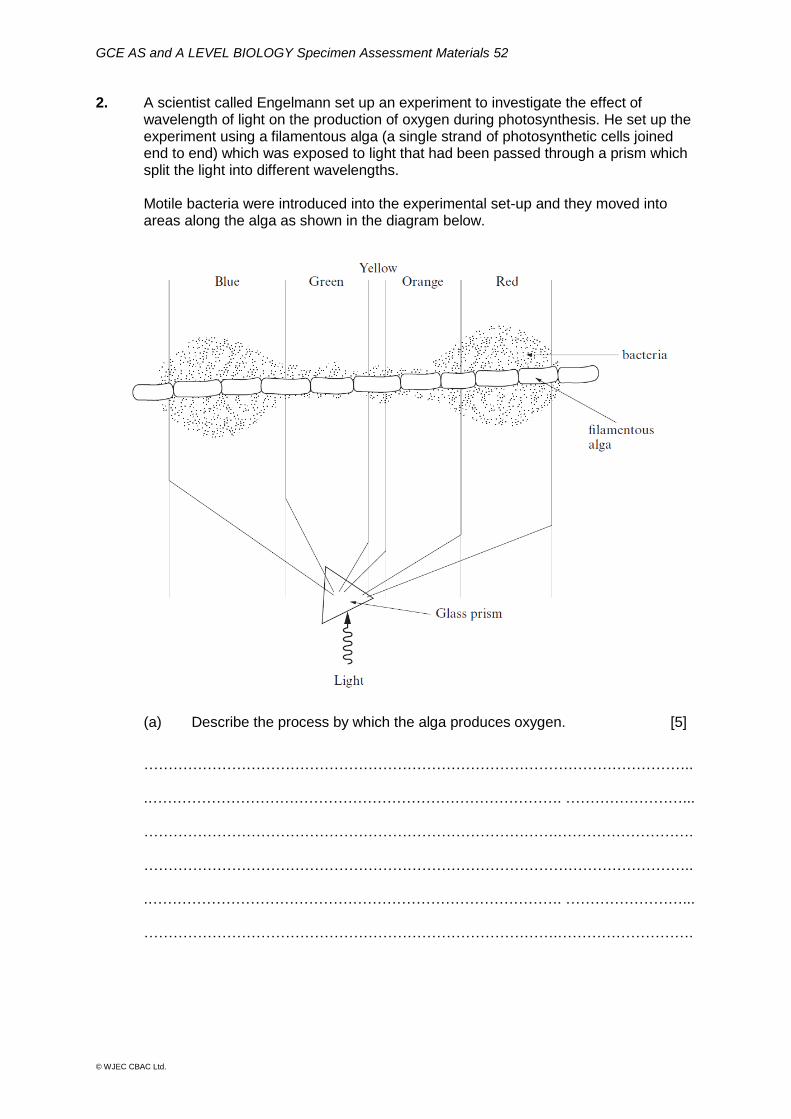
2. A scientist called Engelmann set up an experiment to investigate the effect of wavelength of light on the production of oxygen during photosynthesis. He set up the experiment using a filamentous alga (a single strand of photosynthetic cells joined end to end) which was exposed to light that had been passed through a prism which split the light into different wavelengths.
Motile bacteria were introduced into the experimental set-up and they moved into
areas along the alga as shown in the diagram below.
(a) Describe the process by which the alga produces oxygen. [5]
………………………………………………………………………………………………….. .…………………………………………………………………………. ……………………... ………………………………………………………………………….………………………. ………………………………………………………………………………………………….. .…………………………………………………………………………. ……………………... ………………………………………………………………………….……………………….
GCE AS and A LEVEL BIOLOGY Specimen Assessment Materials 53
© WJEC CBAC Ltd.
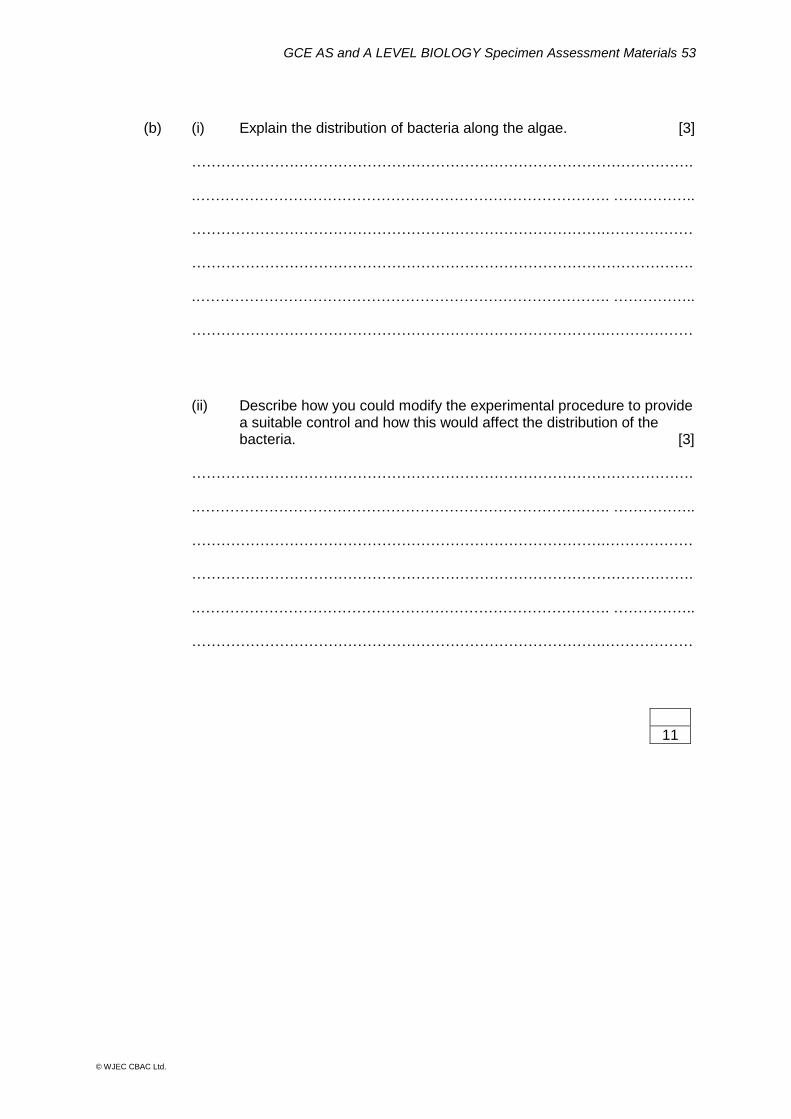
(b) (i) Explain the distribution of bacteria along the algae. [3] …………………………………………………………………………………………. .…………………………………………………………………………. …………….. ………………………………………………………………………….……………… …………………………………………………………………………………………. .…………………………………………………………………………. …………….. ………………………………………………………………………….………………
(ii) Describe how you could modify the experimental procedure to provide
a suitable control and how this would affect the distribution of the bacteria. [3]
…………………………………………………………………………………………. .…………………………………………………………………………. …………….. ………………………………………………………………………….……………… …………………………………………………………………………………………. .…………………………………………………………………………. …………….. ………………………………………………………………………….………………
11

GCE AS and A LEVEL BIOLOGY Specimen Assessment Materials 54
© WJEC CBAC Ltd.
3. A pharmaceutical company uses genetically modified bacteria to produce human insulin. It is important that they can monitor the numbers of bacteria in their culture vessels to ensure optimum production of the human protein. The graph shows the growth of a colony of bacteria in the laboratory.
At each time interval, using aseptic technique, a sample was taken from the culture and serially diluted before counting the bacteria under a microscope.
(a) (i) Describe how a serial dilution is carried out and why it is necessary.
[4] …………………………………………………………………………………………. .…………………………………………………………………………. …………….. ………………………………………………………………………….……………… …………………………………………………………………………………………. .…………………………………………………………………………. …………….. ………………………………………………………………………….………………
GCE AS and A LEVEL BIOLOGY Specimen Assessment Materials 55
© WJEC CBAC Ltd.
(ii) The concentration of bacteria counted in a sample after four tenfold dilutions was 85 in 1cm3. Calculate the total number of bacteria in the original culture if its volume was 20 cm3. Show your working and express your answer in standard form. [3]
Number of bacteria = ………………………………….. (iii) What is the difference between a viable count and a total count? [1] …………………………………………………………………………………………. .………………………………………………………………………….……………...
(b) In order to establish a new culture of these bacteria, a laboratory technician transferred a sample of the bacteria to a fresh culture medium.
The technician decided to take the sample from phase B. Justify the decision
to take the sample from this phase and not the other phases. [3]
…………………………………………………………………………………………. .…………………………………………………………………………..…………….. ………………………………………………………………………….……………… …………………………………………………………………………………………. .………………………………………………………………………….……………... ………………………………………………………………………….……………...
11
GCE AS and A LEVEL BIOLOGY Specimen Assessment Materials 56
© WJEC CBAC Ltd.
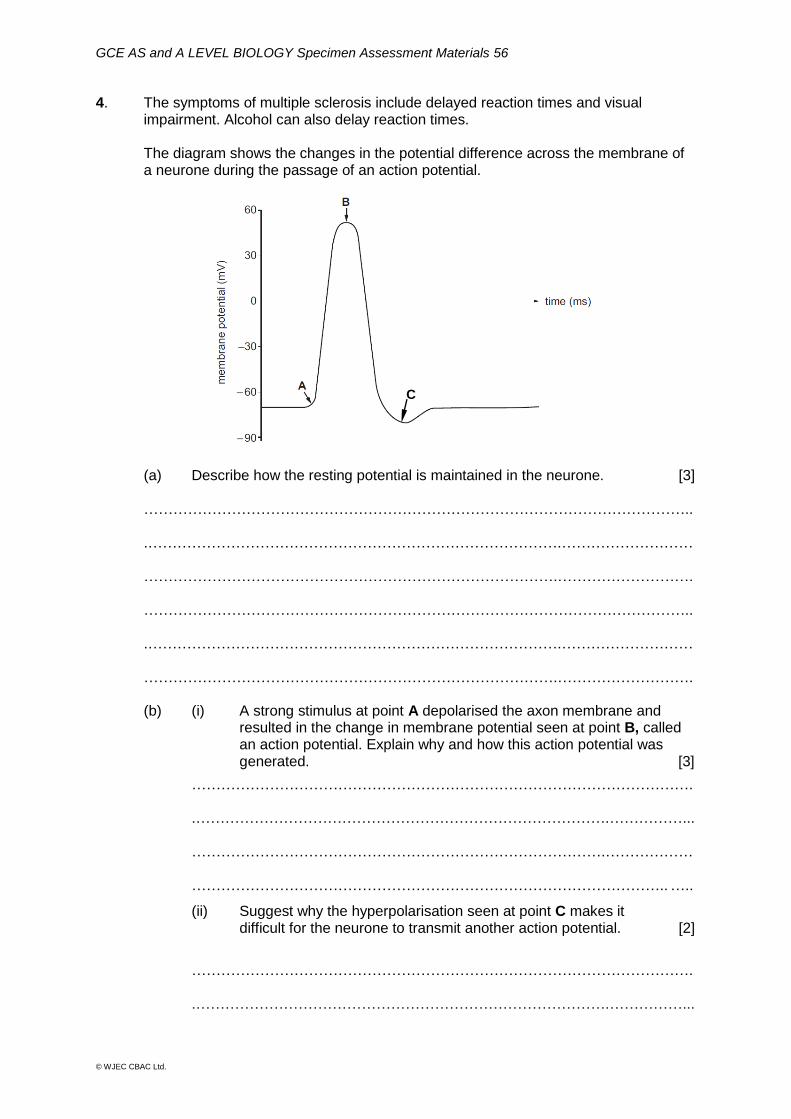
4. The symptoms of multiple sclerosis include delayed reaction times and visual impairment. Alcohol can also delay reaction times. The diagram shows the changes in the potential difference across the membrane of a neurone during the passage of an action potential.
(a) Describe how the resting potential is maintained in the neurone. [3] ………………………………………………………………………………………………….. .………………………………………………………………………….……………………… ………………………………………………………………………….………………………. ………………………………………………………………………………………………….. .………………………………………………………………………….……………………… ………………………………………………………………………….……………………….
(b) (i) A strong stimulus at point A depolarised the axon membrane and resulted in the change in membrane potential seen at point B, called an action potential. Explain why and how this action potential was generated. [3]
…………………………………………………………………………………………. .………………………………………………………………………….……………... ………………………………………………………………………….……………… …………………………………………………………………………………….. …..
(ii) Suggest why the hyperpolarisation seen at point C makes it difficult for the neurone to transmit another action potential. [2]
…………………………………………………………………………………………. .………………………………………………………………………….……………...
C

GCE AS and A LEVEL BIOLOGY Specimen Assessment Materials 57
© WJEC CBAC Ltd.
(c) Nerve impulses travel along different types of neurons at different speeds as shown in the table.
Type of neurone Speed of transmission of impulse (m ms-1)
sensory 0.08
motor 0.12
The diagram below shows how a receptor cell is connected via neurones to a muscle.
The receptor is 0.9m from the spinal cord. There is a delay at each synapse/ neuromuscular junction of 2 ms. Calculate how long it would take for an impulse to be transmitted along a sensory neurone from this receptor and back along the same length motor neurone to a muscle. Show your working. [3]
Answer = ………………………..ms
muscle = synapse
sensory neurone 0.9 m
receptor
motor neurone
spinal cord
= neuromuscular junction

GCE AS and A LEVEL BIOLOGY Specimen Assessment Materials 58
© WJEC CBAC Ltd.
(d) Multiple sclerosis is caused by the immune system destroying the myelin
sheath of neurones and can lead to delayed reaction times. Suggest why this condition leads to a slowing down of the transmission of a nerve impulse. [4]
………………………………………………………………………………………………….. .………………………………………………………………………….……………………… ………………………………………………………………………….………………………. ………………………………………………………………………………………………….. .………………………………………………………………………….……………………… ………………………………………………………………………….………………………. ………………………………………………………………………………………………….. .………………………………………………………………………….……………………… ………………………………………………………………………….……………………….
(e) Alcohol has an inhibitory effect on synaptic transmission. Suggest two ways in which alcohol consumption could decrease the speed of transmission across a synapse.
[2]
I …………………………………………………………….……………………… ……………………………………………………………….…………………………
II …………………………………………………………….…………………….. ……………………………………………………………….…………………………
17
GCE AS and A LEVEL BIOLOGY Specimen Assessment Materials 59
© WJEC CBAC Ltd.
5. Some farmers in the developing countries of Southeast Asia use an agricultural
system known as “shifting cultivation”. This involves felling and burning a plot of forest to provide ash in which to grow food crops. After one to three years, as weeds flourish and fertility declines, the plot is abandoned for a fallow period of about 20 years.
However recently, where the human population density is high, fallow periods have
been reduced and food yields have dropped significantly. In some places the cultivation pattern has been replaced with permanent agriculture, such as rubber plantations.
(a) Explain the advantage to these farmers of burning felled trees to produce ash
before cultivation? [2] ………………………………………………………………………………………………….. .………………………………………………………………………….……………………… ………………………………………………………………………….……………………….
(b) ‘Where the human population density is high, fallow periods have been reduced and food yields have dropped significantly.’
Explain why the food yields have decreased. [3] ………………………………………………………………………………………………….. .………………………………………………………………………….……………………… ………………………………………………………………………….……………………….

GCE AS and A LEVEL BIOLOGY Specimen Assessment Materials 60
© WJEC CBAC Ltd.
A study was carried out in three areas of forest that had different types of agriculture. The number of species of five types of plant (trees, climbers, epiphytes, shrubs and herbaceous plants) were counted in:
● an area of undisturbed primary forest; ● an area that was used for traditional agroforest (shifting cultivation);
● a rubber plantation.
The results are shown below.
GCE AS and A LEVEL BIOLOGY Specimen Assessment Materials 61
© WJEC CBAC Ltd.
(c) It is often stated that any cultivation of the rainforest is totally destructive.
Evaluate the validity of this statement. [5] ………………………………………………………………………………………………….. .………………………………………………………………………….……………………… ………………………………………………………………………….………………………. ………………………………………………………………………………………………….. .………………………………………………………………………….……………………… ………………………………………………………………………….………………………. ………………………………………………………………………………………………….. .………………………………………………………………………….………………………
10
GCE AS and A LEVEL BIOLOGY Specimen Assessment Materials 62
© WJEC CBAC Ltd.
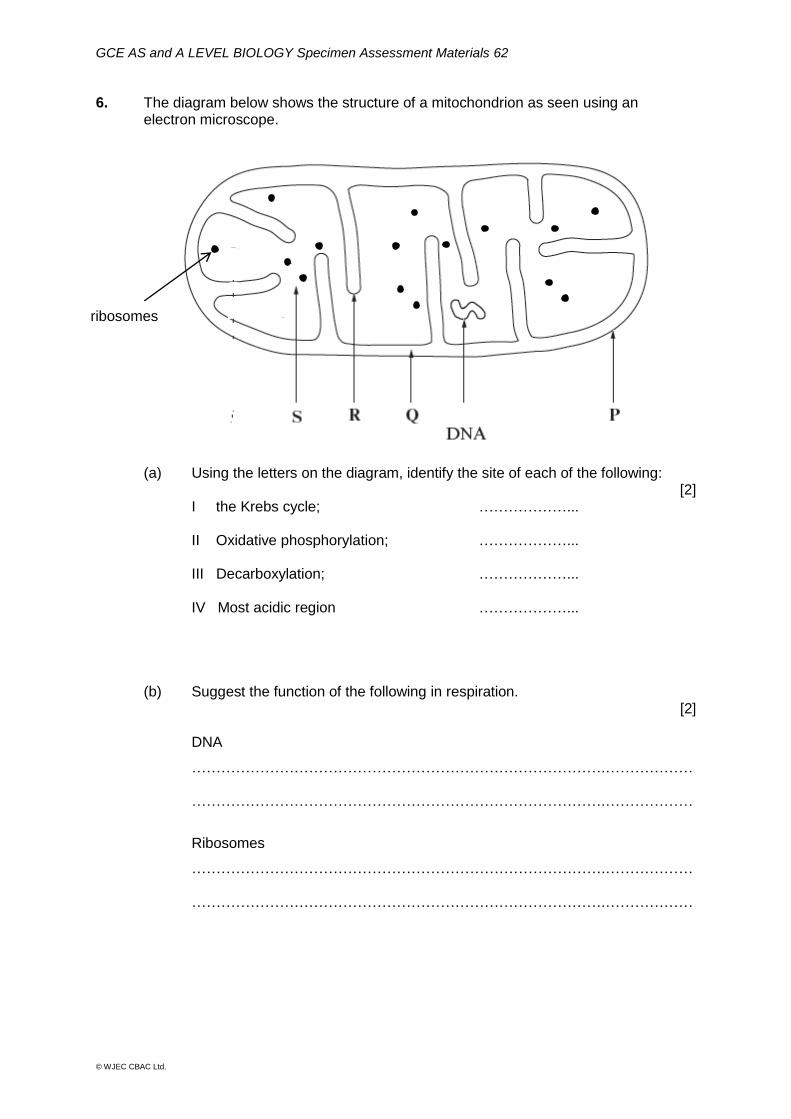
6. The diagram below shows the structure of a mitochondrion as seen using an electron microscope.
(a) Using the letters on the diagram, identify the site of each of the following:
[2] I the Krebs cycle; ………………... II Oxidative phosphorylation; ………………... III Decarboxylation; ………………...
IV Most acidic region ………………... (b) Suggest the function of the following in respiration.
[2]
DNA
………………………………………………………………………….……………… ………………………………………………………………………….………………
Ribosomes
………………………………………………………………………….……………… ………………………………………………………………………….………………
ribosomes

GCE AS and A LEVEL BIOLOGY Specimen Assessment Materials 63
© WJEC CBAC Ltd.
(c) The detailed diagram below shows the link reaction and the Krebs cycle. Most of the intermediates involved are named.
Using the diagram above, and your own knowledge, determine how many carbons there are in the following Krebs cycle intermediates. [1]
citrate ………………………………………… α – ketoglutarate ………………………………………… succinate …………………………………………
X
GCE AS and A LEVEL BIOLOGY Specimen Assessment Materials 64
© WJEC CBAC Ltd.
(d) The incidence of mitochondrial disorders in the population of Wales is 1:8500. These disorders can be diagnosed in patients by taking a minimally invasive tissue biopsy to examine mitochondrial function, freezing the sample immediately after collection.
In addition to activity measurements of individual enzymes, analysis of
mitochondrial respiration and ATP production rates are performed. This includes the measurement of mitochondrial oxygen consumption in the presence of different substrates, such as pyruvate and α-ketoglutarate.
Analysis may show increased levels of a Krebs cycle intermediate, such as malate and succinate. Defects in mitochondrial ATP synthesis may lead to high lactate levels in blood.
(i) Suggest a suitable tissue to examine mitochondrial function and
explain why you have chosen this tissue with respect to patient safety. [2] ………………………………………………………………………………… .………………………………………………………………………….…….. ………………………………………………………………………….……...
(ii) What explanations could be given for the following observations: I the oxygen consumption was low with the pyruvate as a substrate but high with α-ketoglutarate as a substrate? [3]
………………………………………………………………………………… .………………………………………………………………………….……..
………………………………………………………………………….……...
………………………………………………………………………….……...
II there was a build up of any one of the Krebs cycle intermediates? [2] ………………………………………………………………………….……...
………………………………………………………………………….……...

GCE AS and A LEVEL BIOLOGY Specimen Assessment Materials 65
© WJEC CBAC Ltd.
(e) The endosymbiotic theory suggests that mitochondria have evolved from bacteria that had been engulfed by the other cells. Using your knowledge of the structure of bacteria and mitochondria, justify this theory. [4]
………………………………………………………………………………………………….. .………………………………………………………………………….……………………… ………………………………………………………………………….………………………. ………………………………………………………………………………………………….. .………………………………………………………………………….……………………… ………………………………………………………………………….………………………. …………………………………………………………………………………………………..
16

GCE AS and A LEVEL BIOLOGY Specimen Assessment Materials 66
© WJEC CBAC Ltd.
7. In recent years, human impact on the Earth has begun to be assessed in terms of living within or exceeding planetary boundaries. These are global processes that are being affected in different ways by human activities.
The table below shows the “planetary boundaries” for a number of global processes.
Global Process
Variable Units of measurement Boundary Recent
data
Biodiversity loss
Extinction rate species becoming extinct per
million species per year 10
100-1 000
Climate change
Atmospheric carbon dioxide
ppm (parts per million)
350 390
Nitrogen cycle
Nitrogen removed from atmosphere
(mainly for fertilisers) million tonnes per year 35 120
Land use Land used for crops % 15 12
Adapted from Rockstrom et al (2009) and from Lynas (2011) With reference to the information provided and your own knowledge, explain why it is essential that humans reduce their impact on the planet. (The quality of your extended response will be assessed in this question.) [9QER]
………………………………………………………………………………………………….. ………………………………………………………………………………………………….. ………………………………………………………………………………………………….. ………………………………………………………………………………………………….. ………………………………………………………………………………………………….. ………………………………………………………………………………………………….. ………………………………………………………………………………………………….. ………………………………………………………………………………………………….. ………………………………………………………………………………………………….. ………………………………………………………………………………………………….. ………………………………………………………………………………………………….. ………………………………………………………………………………………………….. ………………………………………………………………………………………………….. …………………………………………………………………………………………………..

GCE AS and A LEVEL BIOLOGY Specimen Assessment Materials 67
© WJEC CBAC Ltd.
………………………………………………………………………………………………….. ………………………………………………………………………………………………….. ………………………………………………………………………………………………….. ………………………………………………………………………………………………….. ………………………………………………………………………………………………….. ………………………………………………………………………………………………….. ………………………………………………………………………………………………….. ………………………………………………………………………………………………….. ………………………………………………………………………………………………….. ………………………………………………………………………………………………….. ………………………………………………………………………………………………….. ………………………………………………………………………………………………….. ………………………………………………………………………………………………….. ………………………………………………………………………………………………….. ………………………………………………………………………………………………….. ………………………………………………………………………………………………….. ………………………………………………………………………………………………….. ………………………………………………………………………………………………….. ………………………………………………………………………………………………….. ………………………………………………………………………………………………….. ………………………………………………………………………………………………….. ………………………………………………………………………………………………….. ………………………………………………………………………………………………….. ………………………………………………………………………………………………….. ………………………………………………………………………………………………….. ………………………………………………………………………………………………….. …………………………………………………………………………………………………..

GCE AS and A LEVEL BIOLOGY Specimen Assessment Materials 68
© WJEC CBAC Ltd.
………………………………………………………………………………………………….. ………………………………………………………………………………………………….. ………………………………………………………………………………………………….. ………………………………………………………………………………………………….. ………………………………………………………………………………………………….. ………………………………………………………………………………………………….. ………………………………………………………………………………………………….. ………………………………………………………………………………………………….. ………………………………………………………………………………………………….. ………………………………………………………………………………………………….. ………………………………………………………………………………………………….. ………………………………………………………………………………………………….. ………………………………………………………………………………………………….. ………………………………………………………………………………………………….. ………………………………………………………………………………………………….. ………………………………………………………………………………………………….. ………………………………………………………………………………………………….. ………………………………………………………………………………………………….. ………………………………………………………………………………………………….. ………………………………………………………………………………………………….. ………………………………………………………………………………………………….. ………………………………………………………………………………………………….. ………………………………………………………………………………………………….. ………………………………………………………………………………………………….. ………………………………………………………………………………………………….. …………………………………………………………………………………………………..
9

GCE AS and A LEVEL BIOLOGY Specimen Assessment Materials 69
© WJEC CBAC Ltd.
Candidate Name Centre Number Candidate Number
0
INFORMATION FOR CANDIDATES This paper is in 2 sections, A and B. Section A: 70 marks. Answer all questions. You are advised to spend about 1 hour 30 minutes on this section. Section B: 20 marks; Options. Answer one option only. You are advised to spend about 20 minutes on this section. The number of marks is given in brackets at the end of each question or part-question. The assessment of the quality of extended response (QER) will take place in question 6.
A LEVEL BIOLOGY UNIT 4 Variation, Inheritance and Options SPECIMEN PAPER (2 hours) 90 marks
For Examiner’s use only
Question
Maximum Mark
Mark Awarded
Section A
1. 12
2. 12
3. 14
4. 15
5. 8
6. 9
Section B Option 20
Total 90
ADDITIONAL MATERIALS In addition to this examination paper, you will require a calculator and a ruler. INSTRUCTIONS TO CANDIDATES Use black ink or black ball-point pen. Do not use gel pen. Do not use correction fluid. Write your name, centre number and candidate number in the spaces at the top of this page. Answer all questions. Write your answers in the spaces provided in this booklet.

GCE AS and A LEVEL BIOLOGY Specimen Assessment Materials 70
© WJEC CBAC Ltd.
1. Spermatogenesis in humans is controlled by a number of hormones. Attempts to
develop a male contraceptive pill have focussed on disrupting the sequence of processes involved in the release of the male hormones.
(a) The photomicrograph below shows a section through the seminiferous tubule of a mammal.
Use the letters on the diagram to identify the following. [2]
I. a cell that secretes testosterone …………
II. a gamete …………
III. a cell that will divide by mitosis …………
IV. a cell that must differentiate to become functional …………
J K
M
P O
L

GCE AS and A LEVEL BIOLOGY Specimen Assessment Materials 71
© WJEC CBAC Ltd.
(b) The flow-chart below shows how sperm production in humans is controlled by hormones. Follicle stimulating hormone (FSH) stimulates Sertoli cells to initiate spermatogenesis and luteinising hormone (LH) stimulates the production of testosterone, which is involved in controlling the formation of spermatids and spermatozoa.
Metronidazole is an antibacterial drug that has been shown to have negative effects on spermatogenesis. A study in rats on the effect of the drug on hormone levels produced the following results.
mass of drug administered
mg / kg
mean plasma concentrations /arbitrary units
FSH LH testosterone
0 12.07 9.87 6.12
200 7.81 6.93 3.51
400 6.32 5.43 2.62
(i) What was the mean percentage decrease in FSH plasma
concentration when 200 mg/kg of drug was administered? [1]
……………………………………….%
GCE AS and A LEVEL BIOLOGY Specimen Assessment Materials 72
© WJEC CBAC Ltd.
(ii) Calculate the mass of drug that would have to be administered to a rat
with a mass of 550g in order to achieve a relative dose of 200 mg/kg. [1]
……………………..
The scientists carrying out the study concluded that the metronidazole was most likely to have been acting on a part of the brain.
(iii) Use the information given to explain why the scientists may have
reached this conclusion. [4]
………………………………………………………………………………................
………………………………………………………………………………................
………………………………………………………………………………................
………………………………………………………………………………................ ………………………………………………………………………………................
………………………………………………………………………………................
………………………………………………………………………………................
………………………………………………………………………………................
(iv) Based on the evidence given, suggest two other sites where the metronidazole may have been acting, giving reasons for your answers. [4]
………………………………………………………………………………................
………………………………………………………………………………................
………………………………………………………………………………................
………………………………………………………………………………................
12

GCE AS and A LEVEL BIOLOGY Specimen Assessment Materials 73
© WJEC CBAC Ltd.
2. Arum maculatum is a spring-flowering plant found in Welsh woodland. The following observations were made on the structure of its flower through dissection.
The flowers are enclosed in a green, leaf-like structure called a spadix, with a ring of female flowers at the bottom and a ring of male flowers above them. A ring of hairs above the male flowers prevents insects that enter the spadix from leaving until fertilisation has occurred. The male flowers then ripen and the hairs wither. The spadix secretes a faecal odour and the temperature within the spadix can be up to 15oC warmer than the temperature of the surroundings. Once pollinated, the spadix dies, exposing the developing fruits, that turn a bright red colour as they ripen.
(a) Describe the sequence of events that take place during double fertilisation. [4] …………………………………………………………………………………………………..
.………………………………………………………………………….……………………… ………………………………………………………………………….………………………. …………………………………………………………………………………………………..
(b) What conclusions can you make regarding the types of pollination used by Arum maculatum to ensure fertilisation of its ovules? [5]
………………………………………………………………………………………………….. .………………………………………………………………………….……………………… ………………………………………………………………………….………………………. ………………………………………………………………………………………………….. ………………………………………………………………………………………………….. .………………………………………………………………………….……………………… ………………………………………………………………………….……………………….
hairs
male flowers
female flowers
Note: front of spadix has been removed
spadix

GCE AS and A LEVEL BIOLOGY Specimen Assessment Materials 74
© WJEC CBAC Ltd.
(c) The graphs below show the growing season of Arum maculatum and the
relative light intensity reaching the ground in the woodlands where this plant
grows. The table gives the mean monthly temperature in these woodlands.
Month J F M A M J J A S O N D
Mean temperature
(oC) 5 4 8 10 12 13 15 16 10 8 5 4
Using your knowledge of photosynthesis explain how limiting factors affect the growth of Arum maculatum in April , July and November. [3] ………………………………………………………………………………................
………………………………………………………………………………................
………………………………………………………………………………................
12
GCE AS and A LEVEL BIOLOGY Specimen Assessment Materials 75
© WJEC CBAC Ltd.
3. Dietary ethanol can be broken down by cells in the human body into ethanal which can then be converted into a two carbon molecule which is fed into the Krebs Cycle. Some people have mutations in the enzyme that catalyses this reaction and they are unable to metabolise ethanol.
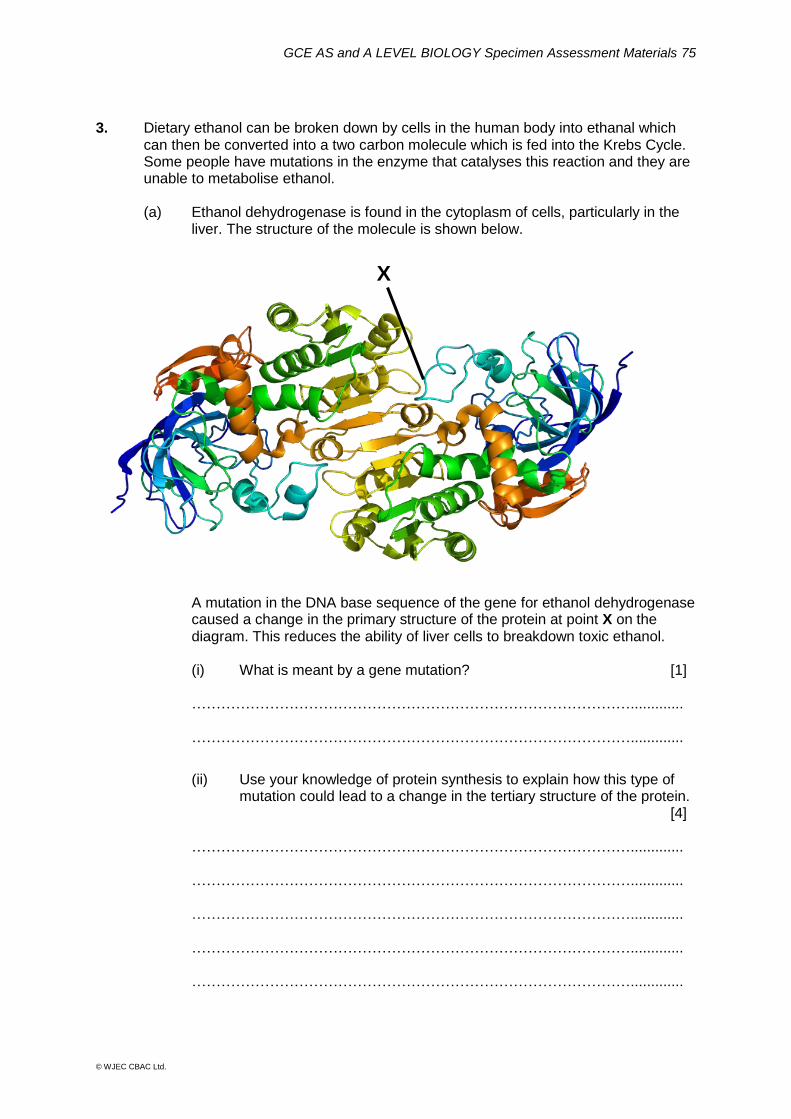
(a) Ethanol dehydrogenase is found in the cytoplasm of cells, particularly in the
liver. The structure of the molecule is shown below.
A mutation in the DNA base sequence of the gene for ethanol dehydrogenase
caused a change in the primary structure of the protein at point X on the diagram. This reduces the ability of liver cells to breakdown toxic ethanol.
(i) What is meant by a gene mutation? [1]
……………………………………………………………………………….............
……………………………………………………………………………….............
(ii) Use your knowledge of protein synthesis to explain how this type of mutation could lead to a change in the tertiary structure of the protein. [4]
……………………………………………………………………………….............
……………………………………………………………………………….............
……………………………………………………………………………….............
……………………………………………………………………………….............
……………………………………………………………………………….............
X

GCE AS and A LEVEL BIOLOGY Specimen Assessment Materials 76
© WJEC CBAC Ltd.
(iii) During the conversion of ethanol into ethanal hydrogen atoms are
removed. Name a molecule that could accept these hydrogens. [1] ……………………………………………………………
(iv) Suggest how this conversion could increase ATP production. [1]
……………………………………………………………………………….............
……………………………………………………………………………….............
……………………………………………………………………………….............
(b) The All Wales Medical Genetics Service (AWMGS) provides specialist genetic services to individual patients and families with, or concerned about, rare genetic conditions.
DNA was extracted from two patients suffering from a defect in their ability to metabolise ethanol. Enzymes were used to cut samples of their DNA and the fragments were then separated using gel electrophoresis. The table below shows some of the enzymes available to cut DNA in this analytical technique. The arrows indicate where the enzymes cut the DNA.
Enzyme Recognition Site
AluI AGCT
BamHI GGATCC
EcoRI GAATTC
HaeIII GGCC
HindIII AAGCTT
NotI GCGGCCGC
Pst1 CTGCAG
Taq1 TCGA
(i) Name the type of enzyme used to cut the DNA. [1]
………………………………………………………
GCE AS and A LEVEL BIOLOGY Specimen Assessment Materials 77
© WJEC CBAC Ltd.
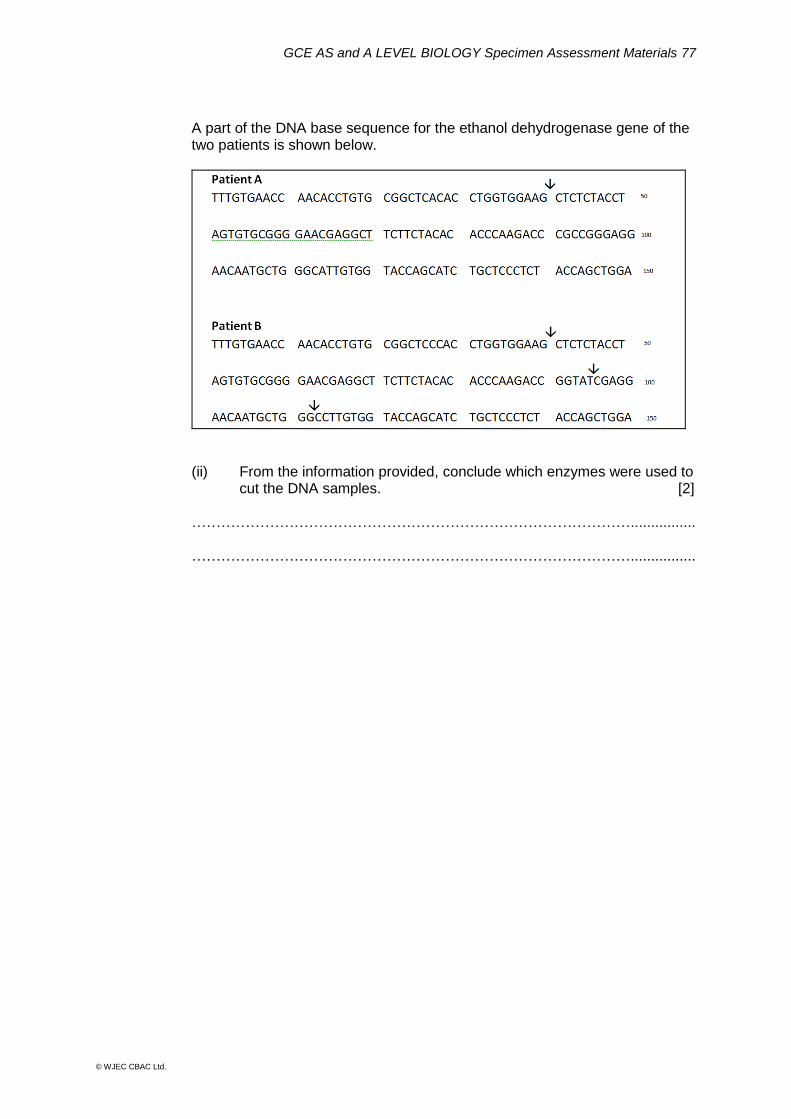
A part of the DNA base sequence for the ethanol dehydrogenase gene of the two patients is shown below.
(ii) From the information provided, conclude which enzymes were used to
cut the DNA samples. [2]
………………………………………………………………………………................
………………………………………………………………………………................

GCE AS and A LEVEL BIOLOGY Specimen Assessment Materials 78
© WJEC CBAC Ltd.
Gel electrophoresis of the fragments obtained for Patient A resulted in the bands shown below.
(iii) Draw lines on the graph to show the position of the fragments
obtained for Patient B. [2] (iv) Explain why the DNA fragments can be separated in this way. [2]
………………………………………………………………………………................
………………………………………………………………………………................
………………………………………………………………………………................
………………………………………………………………………………................
14
120
100
80
60
40
20
0
Patient A
Patient B
Nu
mb
er
of
ba
ses
Wells where samples were loaded

GCE AS and A LEVEL BIOLOGY Specimen Assessment Materials 79
© WJEC CBAC Ltd.
4. The common primrose has flowers that vary in the position of their anthers and the length of their styles. These characteristics are controlled by single genes as shown below:
Low anther position A Long style T High anther position a Short style t
Plants, pure breeding for long style and low anther position, were crossed with plants that were homozygous recessive for both characteristics. All the F1 produced flowers that had low anther positions and long styles. Some of the F1 offspring were then crossed together.
(a) Complete the diagram below to show the expected genotypes, phenotypes
and phenotype ratio of the F2 if inheritance of these characteristics follows standard Mendelian dihybrid inheritance. [5]
Parent phenotypes Long style, low anther x Short style, high anther
Parent genotypes ……………………… x …………………………
Parent gametes ……………………… x …………………………
F1 genotype ……………………… x …………………………
F1 phenotype Long style, low anther x Long style, low anther
F1 gametes …… …… …… …… x …… …… …… ……
F2 phenotypes
…………………………………………………………………………………………………
F2 genotypes
…………………………………………………………………………………………………
…………………………………………………………………………………………………
F2 phenotype ratio
………………………………………………………………………………………………
GCE AS and A LEVEL BIOLOGY Specimen Assessment Materials 80
© WJEC CBAC Ltd.
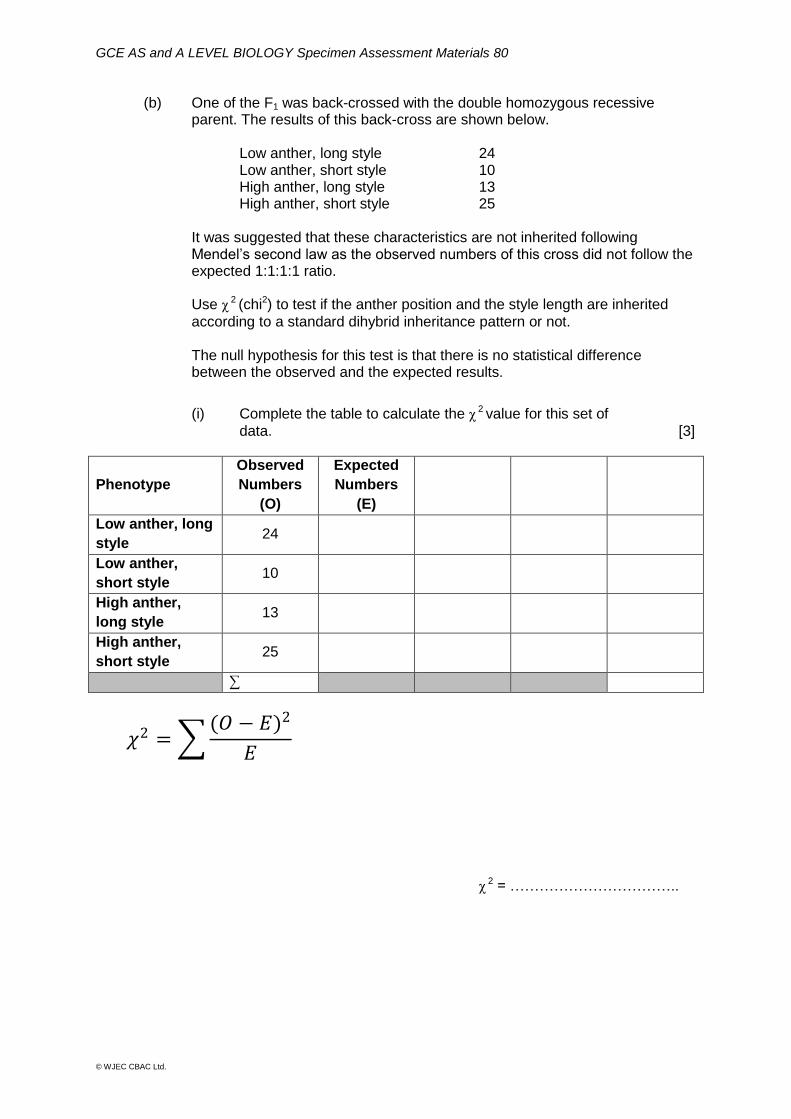
(b) One of the F1 was back-crossed with the double homozygous recessive parent. The results of this back-cross are shown below.
Low anther, long style 24 Low anther, short style 10 High anther, long style 13 High anther, short style 25
It was suggested that these characteristics are not inherited following Mendel’s second law as the observed numbers of this cross did not follow the expected 1:1:1:1 ratio.
Use χ 2 (chi2) to test if the anther position and the style length are inherited
according to a standard dihybrid inheritance pattern or not. The null hypothesis for this test is that there is no statistical difference between the observed and the expected results.
(i) Complete the table to calculate the χ 2 value for this set of
data. [3]
Phenotype
Observed
Numbers
(O)
Expected
Numbers
(E)
Low anther, long
style 24
Low anther,
short style 10
High anther,
long style 13
High anther,
short style 25
∑
𝜒2 =�(𝑂 − 𝐸)2
𝐸
χ
2 = ……………………………..

GCE AS and A LEVEL BIOLOGY Specimen Assessment Materials 81
© WJEC CBAC Ltd.
(ii) Use your calculations and the probability table below to conclude whether to accept or reject the null hypothesis giving a reason for your answer. [4]
………………………………………………………………………………………….
…………………………………………………………………………………………. …………………………………………………………………………………………. …………………………………………………………………………………………. ………………………………………………………………………………………….
Probability Table for χ 2 Test
Degrees of
freedom
0.90
90%
0.80
80%
0.70
70%
0.50
50%
0.30
30%
0.20
20%
0.10
10%
0.05
5%
0.02
2%
0.01
1%
1 0.026 0.06 0.15 0.46 1.07 1.64 2.71 3.84 5.41 6.64
2 0.21 0.45 0.71 1.39 2.41 3.22 4.61 5.99 7.82 9.21
3 0.58 1.01 1.42 2.37 3.67 4.64 6.25 7.82 9.84 11.34
4 1.61 2.34 3.00 4.35 6.06 7.29 9.24 11.07 13.39 15.09
(c) One explanation for the deviation shown between the observed and expected
results was that the alleles for these characteristics are carried on the same chromosome.
With the use of annotated diagrams, explain how the F1 plant could give rise to four different gametes if the alleles show linkage.
[3]
15

GCE AS and A LEVEL BIOLOGY Specimen Assessment Materials 82
© WJEC CBAC Ltd.
5. Pregnancy testing involves detecting changes in the concentration of the hormones progesterone or human chorionic gonadotrophin (HCG) in blood or urine.
The graph shows how plasma concentration of these hormones changes during pregnancy.
(a) (i) Identify each of the two hormones shown in the graph and explain
which one would provide the best indication of pregnancy in the early stages. [3]
…………………………………………………………………………………………. ………………………………………………………………………..........................
………………………………………………………………………………………….
B
A
(weeks)

GCE AS and A LEVEL BIOLOGY Specimen Assessment Materials 83
© WJEC CBAC Ltd.
(ii) Describe the role of each of these hormones in the early stages of pregnancy.
I Hormone A: [1]
…………………………………………………………………………………
………………………………………………………………………............... …………………………………………………………………………………
II Hormone B. [2]
…………………………………………………………………………………
………………………………………………………………………............... …………………………………………………………………………………
(b) Pregnancy testing kits were developed in the early 1980s to detect one of
these hormones in urine.
The diagram shows the results of pregnancy testing in a sample of 1200 women at 5 and 21 days following ovulation. All women in the sample were subsequently shown to have conceived at the time of testing.
85.0
Percentage of women in sample (%)

GCE AS and A LEVEL BIOLOGY Specimen Assessment Materials 84
© WJEC CBAC Ltd.
(i) Explain why the negative results were treated as false negatives. [1]
………………………………………………………………………............... …………………………………………………………………………………
(ii) Calculate the number of women in the study who were given a positive result at 5 days post ovulation.
[1]
Number of women = ……………..
8
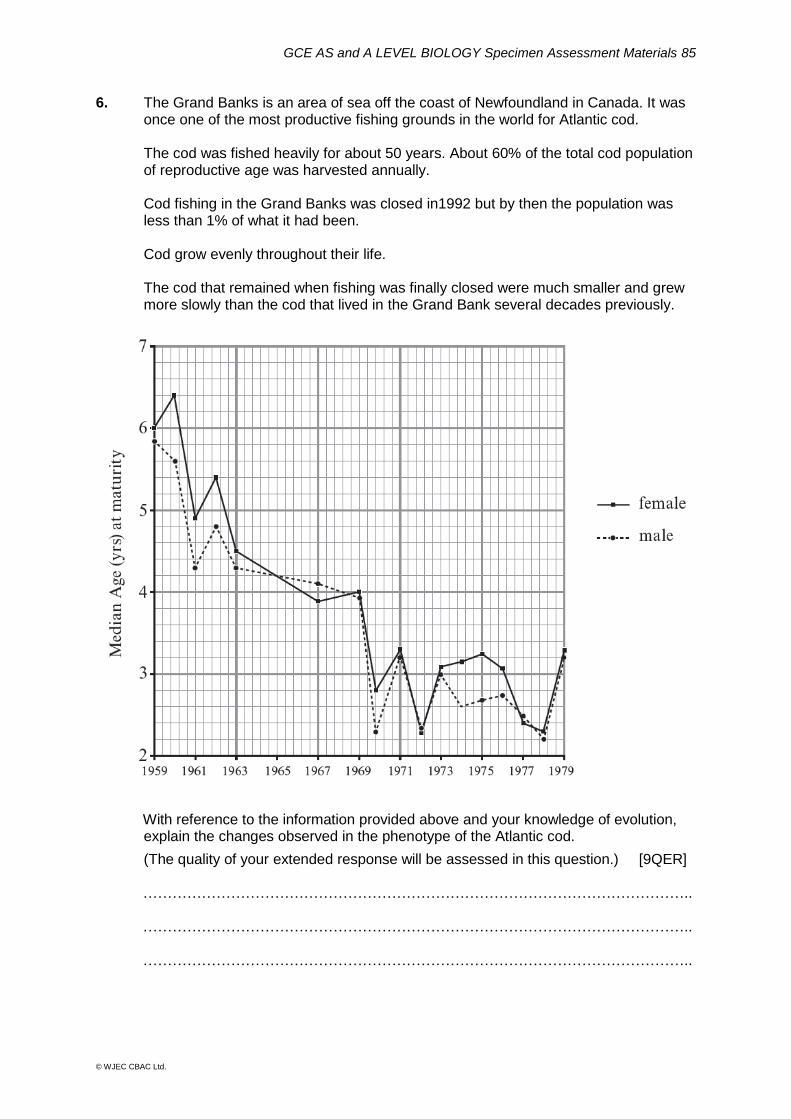
GCE AS and A LEVEL BIOLOGY Specimen Assessment Materials 85
© WJEC CBAC Ltd.
6. The Grand Banks is an area of sea off the coast of Newfoundland in Canada. It was once one of the most productive fishing grounds in the world for Atlantic cod.
The cod was fished heavily for about 50 years. About 60% of the total cod population
of reproductive age was harvested annually. Cod fishing in the Grand Banks was closed in1992 but by then the population was
less than 1% of what it had been. Cod grow evenly throughout their life.
The cod that remained when fishing was finally closed were much smaller and grew more slowly than the cod that lived in the Grand Bank several decades previously.
With reference to the information provided above and your knowledge of evolution, explain the changes observed in the phenotype of the Atlantic cod.
(The quality of your extended response will be assessed in this question.) [9QER] ………………………………………………………………………………………………….. ………………………………………………………………………………………………….. …………………………………………………………………………………………………..

GCE AS and A LEVEL BIOLOGY Specimen Assessment Materials 86
© WJEC CBAC Ltd.
………………………………………………………………………………………………….. ………………………………………………………………………………………………….. ………………………………………………………………………………………………….. ………………………………………………………………………………………………….. ………………………………………………………………………………………………….. ………………………………………………………………………………………………….. ………………………………………………………………………………………………….. ………………………………………………………………………………………………….. ………………………………………………………………………………………………….. ………………………………………………………………………………………………….. ………………………………………………………………………………………………….. ………………………………………………………………………………………………….. ………………………………………………………………………………………………….. ………………………………………………………………………………………………….. ………………………………………………………………………………………………….. ………………………………………………………………………………………………….. ………………………………………………………………………………………………….. ………………………………………………………………………………………………….. ………………………………………………………………………………………………….. ………………………………………………………………………………………………….. ………………………………………………………………………………………………….. ………………………………………………………………………………………………….. ………………………………………………………………………………………………….. ………………………………………………………………………………………………….. ………………………………………………………………………………………………….. ………………………………………………………………………………………………….. …………………………………………………………………………………………………..

GCE AS and A LEVEL BIOLOGY Specimen Assessment Materials 87
© WJEC CBAC Ltd.
………………………………………………………………………………………………….. ………………………………………………………………………………………………….. ………………………………………………………………………………………………….. ………………………………………………………………………………………………….. ………………………………………………………………………………………………….. ………………………………………………………………………………………………….. ………………………………………………………………………………………………….. ………………………………………………………………………………………………….. ………………………………………………………………………………………………….. ………………………………………………………………………………………………….. ………………………………………………………………………………………………….. ………………………………………………………………………………………………….. ………………………………………………………………………………………………….. ………………………………………………………………………………………………….. ………………………………………………………………………………………………….. ………………………………………………………………………………………………….. ………………………………………………………………………………………………….. ………………………………………………………………………………………………….. ………………………………………………………………………………………………….. ………………………………………………………………………………………………….. ………………………………………………………………………………………………….. ………………………………………………………………………………………………….. ………………………………………………………………………………………………….. ………………………………………………………………………………………………….. ………………………………………………………………………………………………….. ………………………………………………………………………………………………….. …………………………………………………………………………………………………..

GCE AS and A LEVEL BIOLOGY Specimen Assessment Materials 88
© WJEC CBAC Ltd.
………………………………………………………………………………………………….. ………………………………………………………………………………………………….. ………………………………………………………………………………………………….. ………………………………………………………………………………………………….. ………………………………………………………………………………………………….. ………………………………………………………………………………………………….. ………………………………………………………………………………………………….. ………………………………………………………………………………………………….. ………………………………………………………………………………………………….. ………………………………………………………………………………………………….. ………………………………………………………………………………………………….. ………………………………………………………………………………………………….. ………………………………………………………………………………………………….. ………………………………………………………………………………………………….. ………………………………………………………………………………………………….. ………………………………………………………………………………………………….. ………………………………………………………………………………………………….. ………………………………………………………………………………………………….. ………………………………………………………………………………………………….. ………………………………………………………………………………………………….. ………………………………………………………………………………………………….. ………………………………………………………………………………………………….. ………………………………………………………………………………………………….. …………………………………………………………………………………………………..
9

GCE AS and A LEVEL BIOLOGY Specimen Assessment Materials 89
© WJEC CBAC Ltd.
SECTION B: OPTIONAL TOPICS
Option A: Immunology and Disease
Option B: Human Musculoskeletal Anatomy
Option C: Neurobiology and Behaviour
Answer the question on one topic only. Place a tick () in one of the boxes above, to show which topic you are answering. You are advised to spend about 20 minutes on this section.
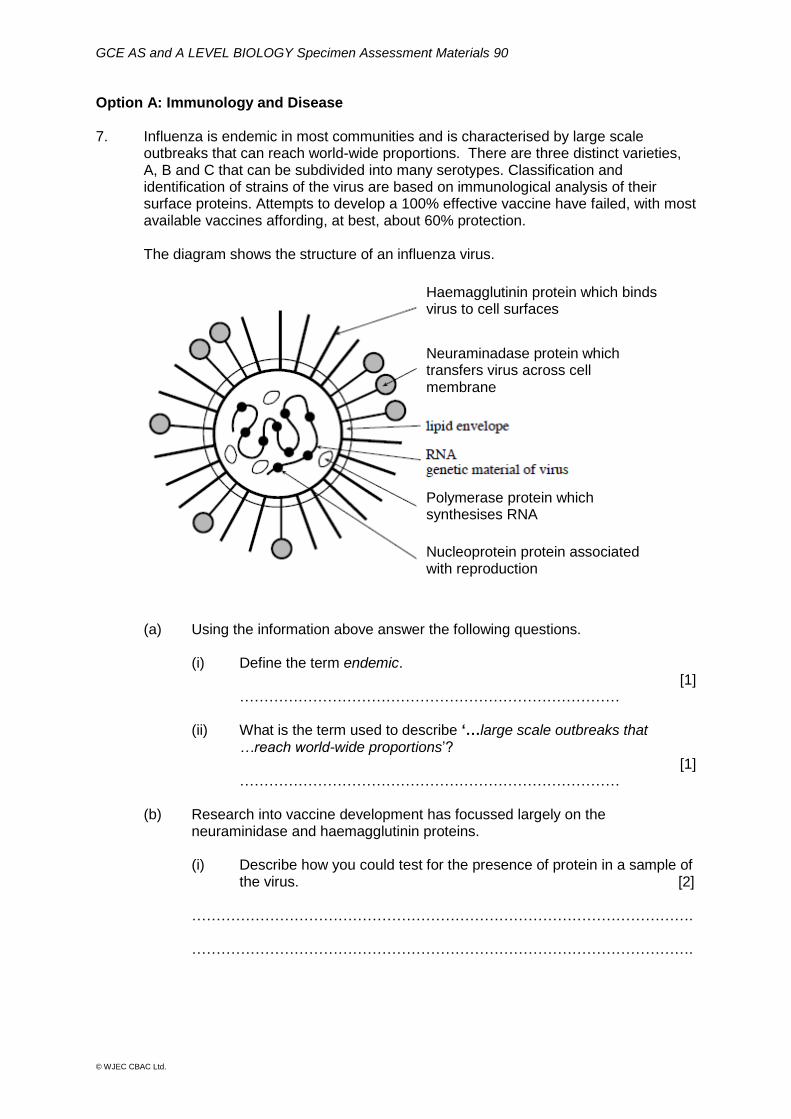
GCE AS and A LEVEL BIOLOGY Specimen Assessment Materials 90
© WJEC CBAC Ltd.
Option A: Immunology and Disease 7. Influenza is endemic in most communities and is characterised by large scale
outbreaks that can reach world-wide proportions. There are three distinct varieties, A, B and C that can be subdivided into many serotypes. Classification and identification of strains of the virus are based on immunological analysis of their surface proteins. Attempts to develop a 100% effective vaccine have failed, with most available vaccines affording, at best, about 60% protection.
The diagram shows the structure of an influenza virus.
(a) Using the information above answer the following questions. (i) Define the term endemic.
[1] ……………………………………………………………………
(ii) What is the term used to describe ‘…large scale outbreaks that …reach world-wide proportions’?
[1] ……………………………………………………………………
(b) Research into vaccine development has focussed largely on the neuraminidase and haemagglutinin proteins.
(i) Describe how you could test for the presence of protein in a sample of
the virus. [2]
…………………………………………………………………………………………. ………………………………………………………………………………………….
Haemagglutinin protein which binds virus to cell surfaces
Neuraminadase protein which transfers virus across cell membrane
Polymerase protein which synthesises RNA
Nucleoprotein protein associated with reproduction

GCE AS and A LEVEL BIOLOGY Specimen Assessment Materials 91
© WJEC CBAC Ltd.
(ii) Explain why research into influenza vaccines has focussed on these proteins. [2] ………………………………………………………………………..........................
………………………………………………………………………………………….
………………………………………………………………………..........................
………………………………………………………………………………………….
………………………………………………………………………………………….
(iii) It has been found that the haemagglutinin protein stimulates a strong
immune response but shows a high degree of antigenic variation over time while the neuraminidase protein is less immunologically active but shows far less variation between strains and over time.
Evaluate the choice of neuraminidase as the better option for
research into developing a vaccine that would provide effective, long-term immunity against the influenza virus. [3]
……………………………………………………………………….......................... ………………………………………………………………………………………….
………………………………………………………………………..........................
………………………………………………………………………………………….
………………………………………………………………………………………….

GCE AS and A LEVEL BIOLOGY Specimen Assessment Materials 92
© WJEC CBAC Ltd.
(c) The graph shows how blood antibody concentration against Rubella changed in a 12 month old child following injection with Rubella antigen at day 0 followed by a booster injection at day 40.
(i) Following the first injection with Rubella antigen the concentration of antibodies against the virus remained low for several days.
State the time taken for a protective level of antibody to be produced following the first injection.
[1] …………………………………
(ii) Explain why the time taken to produce the antibody level required for immunity was much shorter following the booster injection. [2]
………………………………………………………………………………………….
………………………………………………………………………..........................
………………………………………………………………………………………….
………………………………………………………………………………………….
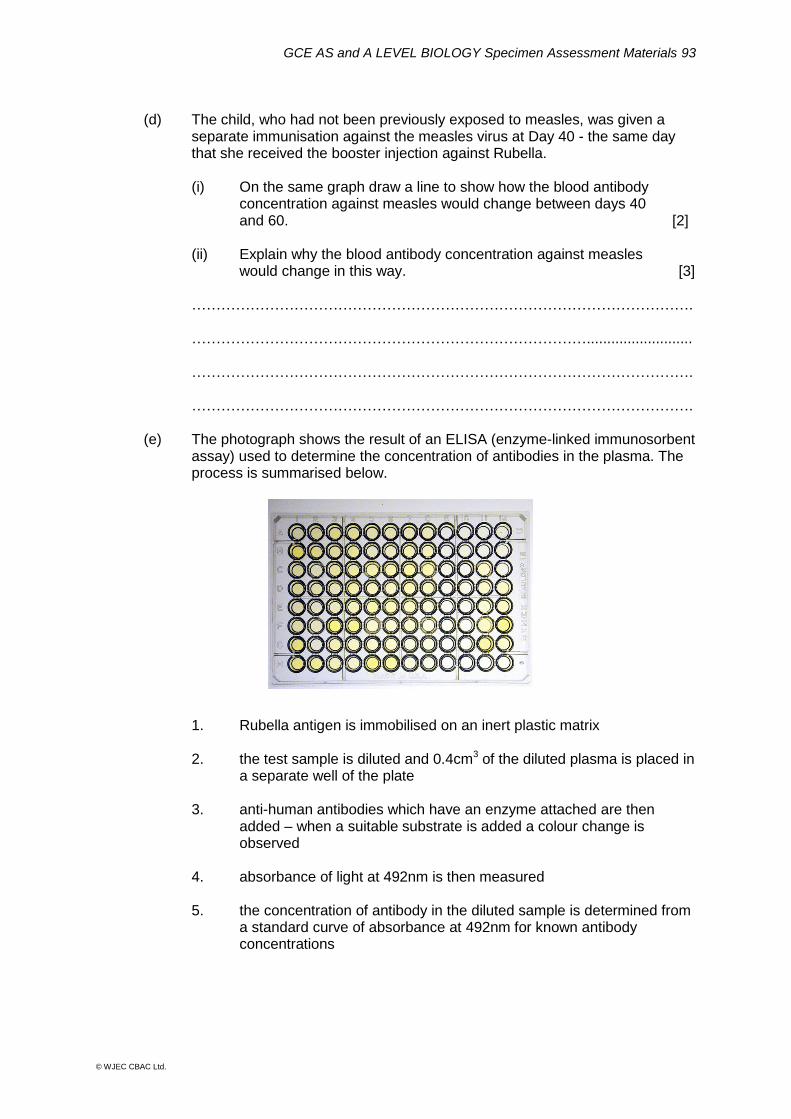
GCE AS and A LEVEL BIOLOGY Specimen Assessment Materials 93
© WJEC CBAC Ltd.
(d) The child, who had not been previously exposed to measles, was given a
separate immunisation against the measles virus at Day 40 - the same day that she received the booster injection against Rubella.
(i) On the same graph draw a line to show how the blood antibody
concentration against measles would change between days 40 and 60. [2]
(ii) Explain why the blood antibody concentration against measles
would change in this way. [3]
………………………………………………………………………………………….
………………………………………………………………………..........................
………………………………………………………………………………………….
………………………………………………………………………………………….
(e) The photograph shows the result of an ELISA (enzyme-linked immunosorbent assay) used to determine the concentration of antibodies in the plasma. The process is summarised below. 1. Rubella antigen is immobilised on an inert plastic matrix 2. the test sample is diluted and 0.4cm3 of the diluted plasma is placed in a separate well of the plate 3. anti-human antibodies which have an enzyme attached are then added – when a suitable substrate is added a colour change is observed 4. absorbance of light at 492nm is then measured 5. the concentration of antibody in the diluted sample is determined from a standard curve of absorbance at 492nm for known antibody concentrations

GCE AS and A LEVEL BIOLOGY Specimen Assessment Materials 94
© WJEC CBAC Ltd.
A 0.4cm3 sample of plasma from a person infected with Rubella was diluted by a factor of 10-3 from its original concentration. It was found to have a mean absorbance of 0.24 at 492nm. Using the standard curve of the absorbance of light at 492nm of known antibody concentrations shown below, calculate the mass of antibody present in 1cm3 of the original sample of plasma. Give your answer in mg cm-3. [3]
Antibody concentration: ………………………mg cm-3 of plasma.
20
Concentration of antibody / ng cm3
Ab
so
rba
nce
of lig
ht
at 4
92n
m /a
.u.

GCE AS and A LEVEL BIOLOGY Specimen Assessment Materials 95
© WJEC CBAC Ltd.
Option B: Human Musculoskeletal Anatomy
8. The photomicrograph shows a section of compact bone.
(a) (i) Complete the table below by giving the function of the two types of cell which could be found in the lacuna. [1]
Name of cell Function
Osteoblast
Osteoclast
(ii) Name two structures other than nerve fibres which are found
in the Haversian canal. [1]
...............................................
...............................................
Haversian canal Haversian canal
Lacuna

GCE AS and A LEVEL BIOLOGY Specimen Assessment Materials 96
© WJEC CBAC Ltd.
(iii) (iii) The photographs below show human vertebrae. Identify which image
shows a cervical vertebra and use the photograph to describe how its structure is adapted to its function in the vertebral column. [2]
A B C
Cervical vertebra …………………………………… Adaptations to function ……………………………………………………….
………………………………………………………………………………………….
………………………………………………………………………………………….
………………………………………………………………………………………….
(b) Health workers in Wales have observed a rise in the number of cases of rickets in some parts of the country. It has been suggested that a reduction in outdoor play and the consumption of fewer dairy products could be contributing towards this.
Explain how these lifestyle changes could result in the development of rickets in young children. [5]
………………………………………………………………………………………………….. ………………………………………………………………………………………………….. ………………………………………………………………………………………………….. ………………………………………………………………………………………………….. …………………………………………………………………………………………………..
………………………………………………………………………………………………….. ………………………………………………………………………………………………….. …………………………………………………………………………………………………..

GCE AS and A LEVEL BIOLOGY Specimen Assessment Materials 97
© WJEC CBAC Ltd.
(c) The electron micrograph shows a section of muscle.
Micrograph 1 Micrograph 2
(i) Name the molecules labelled A and B in the micrograph above. [2]
A …………………………………….................. B ……………………………………..................
(ii) Identify the type of section shown in the micrographs above. [1] ................................................................................................................ (iii) Micrograph 2 above shows a section taken through the outside of the
A band of the sarcomeres. Draw a labelled diagram below to represent a similar section taken
through the I band of the sarcomere. [1]
A
B
GCE AS and A LEVEL BIOLOGY Specimen Assessment Materials 98
© WJEC CBAC Ltd.
(d) The length of the A band in human muscle is 1.85 μm. 0.25 μm at the centre of the myosin filament does not have myosin heads. There are 6 myosin heads in 40 nm of myosin filament.
Calculate how many myosin heads there are in each myosin filament. Show your working. [3]
Number of myosin heads = ……………..
(e) Doctors examined a patient suffering from weak, uncoordinated muscular contraction. Tests showed that the patient had lower than normal blood calcium levels. Doctors concluded that this was a possible cause of the symptoms observed.
Explain why the low calcium levels could have resulted in the symptoms observed. [4] ……………………………………………………………….................................................
……………………………………………………………….................................................
……………………………………………………………….................................................
……………………………………………………………….................................................
……………………………………………………………….................................................
……………………………………………………………….................................................
……………………………………………………………….................................................
……………………………………………………………….................................................
……………………………………………………………….................................................
……………………………………………………………….................................................
……………………………………………………………….................................................
……………………………………………………………….................................................
20
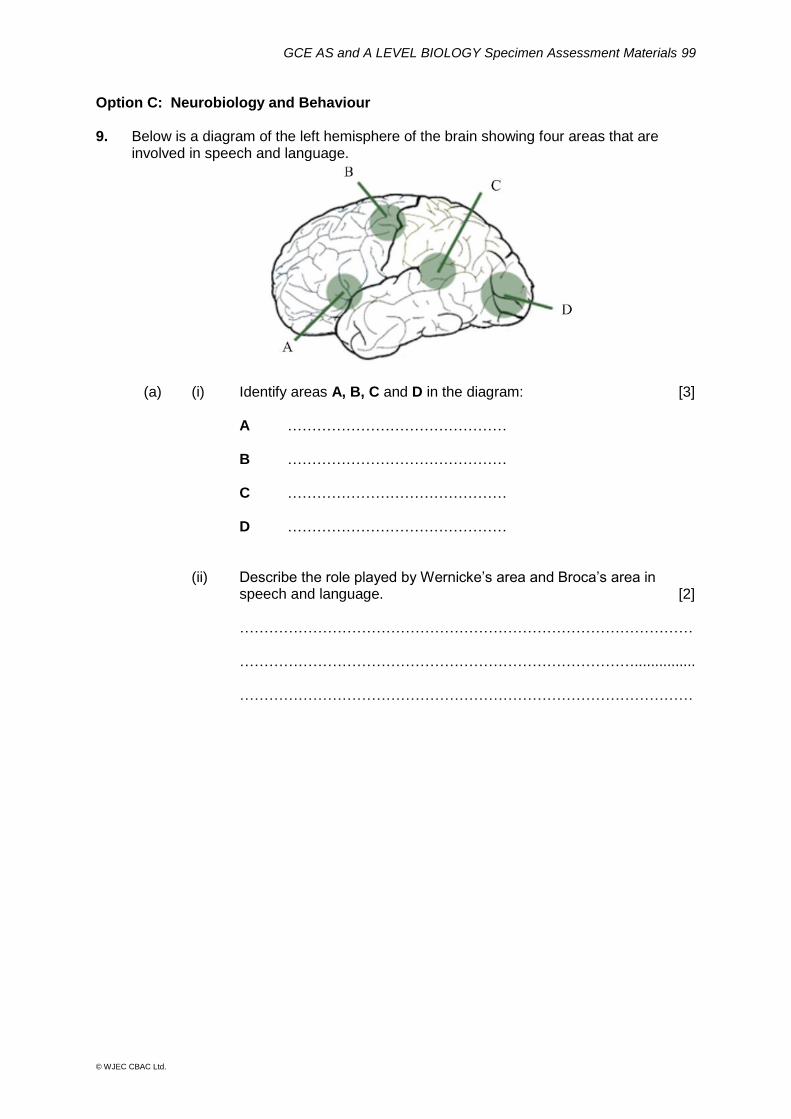
GCE AS and A LEVEL BIOLOGY Specimen Assessment Materials 99
© WJEC CBAC Ltd.
Option C: Neurobiology and Behaviour 9. Below is a diagram of the left hemisphere of the brain showing four areas that are
involved in speech and language.
(a) (i) Identify areas A, B, C and D in the diagram: [3] A ……………………………………… B ……………………………………… C ……………………………………… D ………………………………………
(ii) Describe the role played by Wernicke’s area and Broca’s area in speech and language. [2]
…………………………………………………………………………………
………………………………………………………………………............... …………………………………………………………………………………

GCE AS and A LEVEL BIOLOGY Specimen Assessment Materials 100
© WJEC CBAC Ltd.
(b) Functional Magnetic Resonance Imaging (fMRI) is a technique for examining activity of the brain. During investigations, the subjects were given a book to read while their brain activity was monitored. The images produced were then examined and the results shown on the table below.
Individual Brightest areas of brain
A B C D
1
2
The scientists concluded that individual 2 was reading silently. What
conclusions should be reached regarding the activities of individual 1?
Explain your answer. [1]
……………………………………………………………….....................................
……………………………………………………………….....................................
……………………………………………………………….....................................
……………………………………………………………….....................................

GCE AS and A LEVEL BIOLOGY Specimen Assessment Materials 101
© WJEC CBAC Ltd.
(c) The control of ventilation is brought about by the autonomic nervous system and is shown in the diagram below. Within the medulla are the inspiratory and expiratory centres, which send nerve impulses to the intercostal muscles and diaphragm. When the expiratory centre is stimulated it ‘switches off’ the inspiratory centre.
(i) Use the diagram and your knowledge of ventilation to describe how inspiration is initiated. [2]
…………………………………………………………………………………………. …………………………………………………………………………………………. ………………………………………………………………………………………….
carotid bodies
expiratory centre
common carotid arteries either side of neck
aortic bodies in aortic arch
heart
carotid bodies
internal intercostal nerve to internal intercostal muscles
phrenic nerve to diaphragm
vagus nerve from stretch receptors in bronchi and bronchioles
external intercostal nerve to external intercostal muscles
inspiratory centre
medulla

GCE AS and A LEVEL BIOLOGY Specimen Assessment Materials 102
© WJEC CBAC Ltd.
(ii) Use the diagram and your knowledge to explain the mechanism by which the ventilation rate is increased during exercise. [4]
…………………………………………………………………………………………. …………………………………………………………………………………………. …………………………………………………………………………………………. …………………………………………………………………………………………. ………………………………………………………………………………………….
(d) A student set up an experiment to investigate the effectiveness of different types of insect repellent. The diagram below shows the apparatus that she used.
The insect repellent was sprayed into the branch of the glass tube labelled E
and then 20 mosquitoes were introduced to the bottom of the tube. The student recorded the number of mosquitoes that entered the branch of the tube labelled F in two minutes. The student repeated the experiment and the apparatus was rinsed with water after each trial. The same volume and concentration of insecticide was sprayed in each trial. The data obtained is shown below.
(i) Suggest how the apparatus was set up for the control experiment. [1] ………………………………………………………………………………………….
Repellent Number of mosquitoes entering branch F
Trial 1 Trial 2 Trial 3 Trial 4 Trial 5 mean Standard deviation
Control 10 9 8 12 11 10.0 1.41
Brand A 11 14 12 13 11 12.0 1.17
Brand B 16 17 19 18 17 17.4 1.02
Brand C 19 16 13 10 9 13.4
stimulus to attract mosquitoes
E F
Glass tubing
Mosquitoes introduced here

GCE AS and A LEVEL BIOLOGY Specimen Assessment Materials 103
© WJEC CBAC Ltd.
(ii) What type of behaviour is being exhibited by the mosquitoes in
response to the repellent? [1] ………………………………………………………………………………………….
(iii) Calculate the standard deviation for brand C by completing the table below and using the formula given. [3]
x x x 2
x x
19 5.6 31.36
16 2.6 6.76
13 -0.4 0.16
10 -3.4 11.56
9 -4.4 19.36
=
The formula for standard deviation is:
2( )x x
N
Where x = individual trial results for Brand C
x = mean results for Brand C
N = number of trials for Brand C
= sum of
Standard deviation for Brand C = …………………………
(iv) What conclusion could be reached regarding the effectiveness of the different types of insect repellent? Comment on the strength of evidence for this conclusion. [3]
………………………………………………………………………………………… ………………………………………………………………………………………… …………………………………………………………………………………………
20


GCE AS and A LEVEL BIOLOGY Specimen Assessment Materials 105
© WJEC CBAC Ltd.
A LEVEL
BIOLOGY UNIT 5 Practical Examination Experimental Task TESTS 1 and 2 INSTRUCTIONS TO TEACHERS / EXAMS OFFICERS SPECIMEN PAPER Confidential To be opened on receipt for immediate use by TEACHERS / EXAMS OFFICERS
This document should be stored securely by the exams officer when not in use by the teacher. Its contents should not be divulged except to those concerned with the preparation of the assessment.

GCE AS and A LEVEL BIOLOGY Specimen Assessment Materials 106
© WJEC CBAC Ltd.
A. General Instructions
1. The Experimental Task will consist of one session of 120 minutes duration. Two versions of the test will be set for use on dates specified by WJEC as follows:
Test 1 - …………………………… (date) Test 2 - …………………………… (date)
An individual candidate may undertake only one of these tests. Where all the candidates can be accommodated in a single session, centres are advised to use Test 1 as early as is convenient on the first day. Where centres require more than one session, they may choose to use additional sessions on day 1 and/or day 2. Where more than one session is used on a single day, centres should ensure that learners in later sessions have no opportunity to communicate with those who have already taken the test.
2. The test should be supervised at all times by a member of staff responsible for teaching A level Biology. Centres may use additional laboratories, provided that a subject teacher is available to supervise all groups at all times.
3. Teachers should ensure that each learner has adequate working space and
that the candidates are set a reasonable distance apart. Each candidate requires uninterrupted access to the allocated apparatus – one set of apparatus per candidate (except where indicated).
4. Centres will receive sufficient copies of the papers for Tests 1 and 2.
Teachers may open the “Setting up Instructions” document 1 week before Test 1 (i.e. date). This is for the purpose of ensuring that the apparatus functions well enough for the candidates to complete the assessment fully. Teachers are encouraged to try out the task, whilst preserving the confidentiality of the assessment. The full version of the examination paper will not be available until the day of the examination (i.e. date).
5. Candidates should write their answers in the spaces provided on the question
paper. Should there be a need for additional space then a standard extension/answer booklet should be provided.
6. Teachers need to ensure that the teacher assessed marks are recorded on
each candidate’s paper. Guidance on the awarding of these marks will be provided in the “Setting up Instructions” document.
7. After the assessments have taken place, the completed examination papers
must be securely stored by the exams officer before they are sent to the examiner by ……………… at the latest. Teachers should not be given access to the completed examination papers after the assessments have taken place.
8. The examination papers will be externally marked by a WJEC examiner. The
name and address of the examiner will be issued to centres by the end of April.
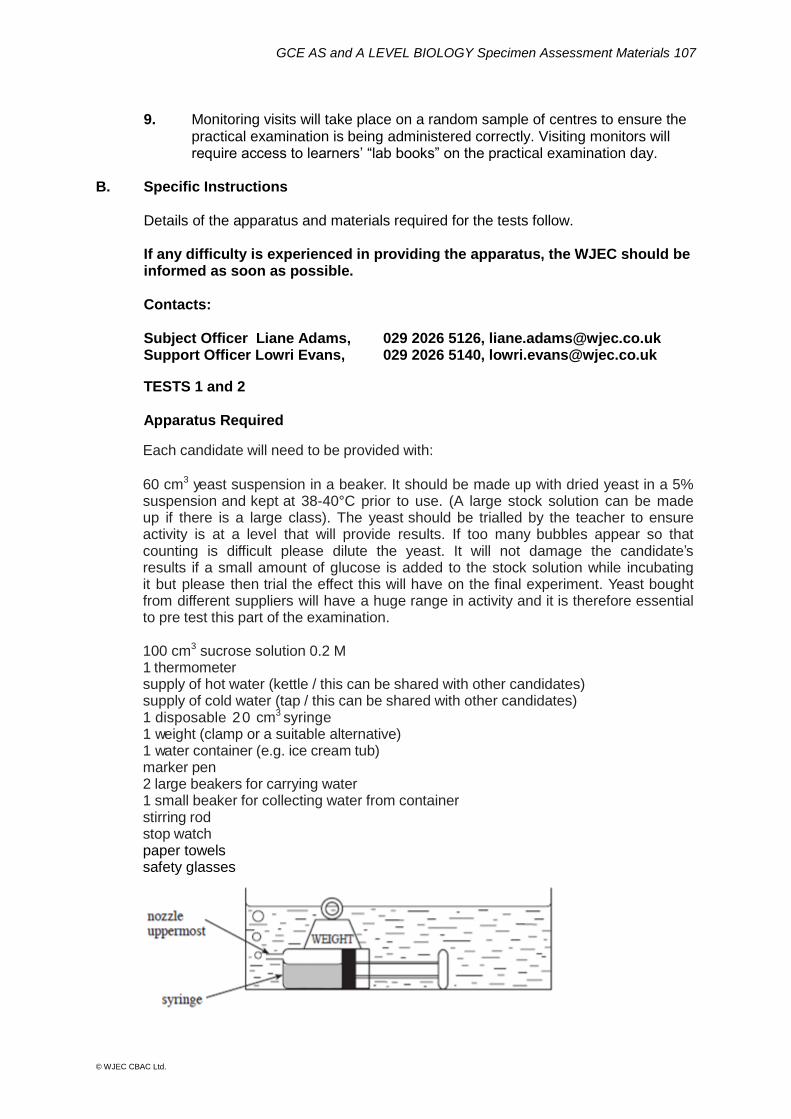
GCE AS and A LEVEL BIOLOGY Specimen Assessment Materials 107
© WJEC CBAC Ltd.
9. Monitoring visits will take place on a random sample of centres to ensure the
practical examination is being administered correctly. Visiting monitors will require access to learners’ “lab books” on the practical examination day.
B. Specific Instructions Details of the apparatus and materials required for the tests follow.
If any difficulty is experienced in providing the apparatus, the WJEC should be informed as soon as possible.
Contacts: Subject Officer Liane Adams, 029 2026 5126, [email protected] Support Officer Lowri Evans, 029 2026 5140, [email protected] TESTS 1 and 2 Apparatus Required
Each candidate will need to be provided with:
60 cm3 yeast suspension in a beaker. It should be made up with dried yeast in a 5% suspension and kept at 38-40°C prior to use. (A large stock solution can be made up if there is a large class). The yeast should be trialled by the teacher to ensure activity is at a level that will provide results. If too many bubbles appear so that counting is difficult please dilute the yeast. It will not damage the candidate’s results if a small amount of glucose is added to the stock solution while incubating it but please then trial the effect this will have on the final experiment. Yeast bought from different suppliers will have a huge range in activity and it is therefore essential to pre test this part of the examination. 100 cm3 sucrose solution 0.2 M 1 thermometer supply of hot water (kettle / this can be shared with other candidates) supply of cold water (tap / this can be shared with other candidates) 1 disposable 20 cm3 syringe 1 weight (clamp or a suitable alternative) 1 water container (e.g. ice cream tub) marker pen 2 large beakers for carrying water 1 small beaker for collecting water from container stirring rod stop watch paper towels safety glasses


GCE AS and A LEVEL BIOLOGY Specimen Assessment Materials 109
© WJEC CBAC Ltd.
A LEVEL
BIOLOGY
UNIT 5 Practical Examination Experimental Task SETTING UP INSTRUCTIONS SPECIMEN PAPER Confidential To be opened on …………………… by TEACHERS
This document should be stored securely by the exams officer when not in use by the teacher. Its contents should not be divulged except to those concerned with the preparation of the assessment.

GCE AS and A LEVEL BIOLOGY Specimen Assessment Materials 110
© WJEC CBAC Ltd.
TEST 1 1. Yeast is a unicellular organism, which respires producing carbon dioxide. Respiration
is controlled by enzymes. The rate at which carbon dioxide is produced can be used to measure the rate of respiration of yeast. In the following investigation the effect of temperature on the rate of carbon dioxide production will be determined.
Follow these instructions carefully You are provided with: yeast suspension sucrose solution 1 thermometer access to a supply of hot water access to a supply of cold water 20 cm3 syringe 1 weight 1 water container marker pen 2 large beakers for carrying water 1 small beaker for collecting water from container stirring rod stop watch paper towels
safety glasses (i) Add a mixture of hot and cold water to the water container to achieve a
temperature of 55C. You will need to maintain the temperature of the water
container to within +/- 1 C throughout the investigation by adding hot or cold water.
(ii) Label the starting depth of the water with a line. If water is added then a
similar volume of water should also be removed. (iii) Stir the yeast solution with the stirring rod and draw 5cm3 into a syringe. (iv) Wash the outside of the syringe under a running tap. (v) Draw 10cm3 of sucrose solution into the same syringe. (vi) Pull the plunger back to almost the end of the barrel and shake the syringe
gently. (vii) Place the syringe into the water container. The nozzle of the syringe is not
central, so when you lay the syringe down in the water, ensure that the nozzle remains uppermost. Place a weight on the syringe to keep it in place. (See diagram)
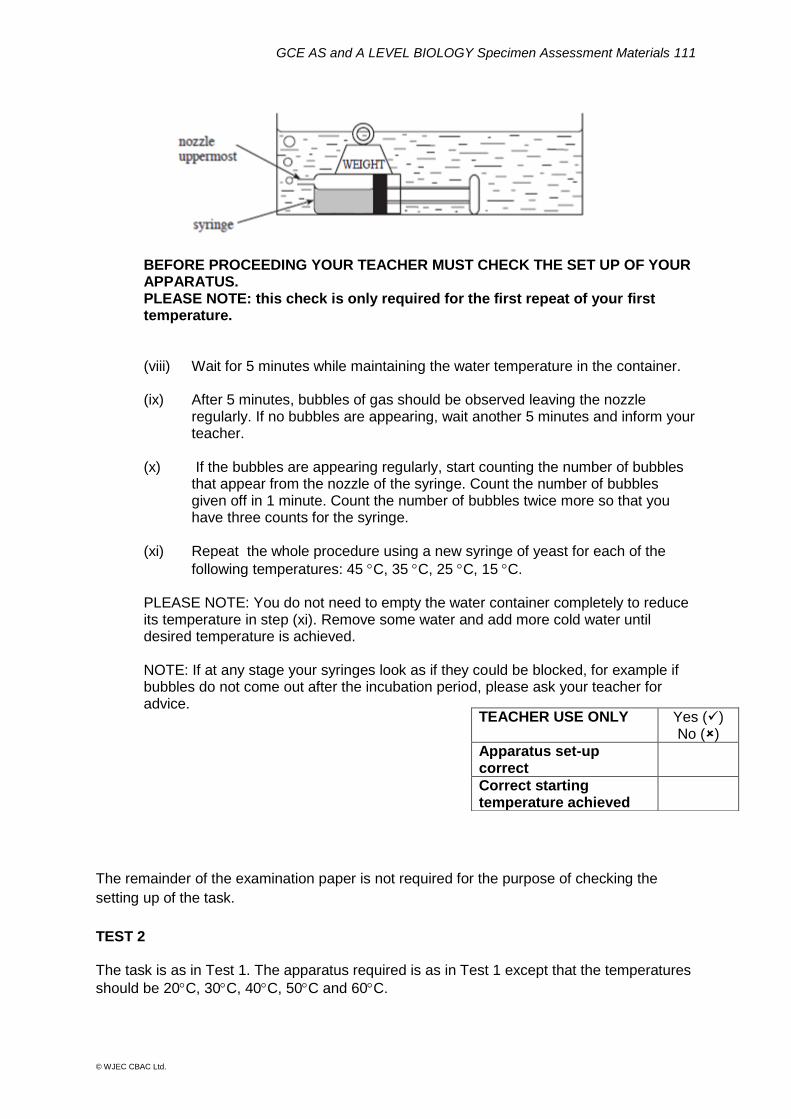
GCE AS and A LEVEL BIOLOGY Specimen Assessment Materials 111
© WJEC CBAC Ltd.
BEFORE PROCEEDING YOUR TEACHER MUST CHECK THE SET UP OF YOUR APPARATUS. PLEASE NOTE: this check is only required for the first repeat of your first temperature.
(viii) Wait for 5 minutes while maintaining the water temperature in the container. (ix) After 5 minutes, bubbles of gas should be observed leaving the nozzle
regularly. If no bubbles are appearing, wait another 5 minutes and inform your teacher.
(x) If the bubbles are appearing regularly, start counting the number of bubbles
that appear from the nozzle of the syringe. Count the number of bubbles given off in 1 minute. Count the number of bubbles twice more so that you have three counts for the syringe.
(xi) Repeat the whole procedure using a new syringe of yeast for each of the
following temperatures: 45 C, 35 C, 25 C, 15 C. PLEASE NOTE: You do not need to empty the water container completely to reduce its temperature in step (xi). Remove some water and add more cold water until desired temperature is achieved.
NOTE: If at any stage your syringes look as if they could be blocked, for example if bubbles do not come out after the incubation period, please ask your teacher for advice.
The remainder of the examination paper is not required for the purpose of checking the
setting up of the task.
TEST 2 The task is as in Test 1. The apparatus required is as in Test 1 except that the temperatures
should be 20C, 30C, 40C, 50C and 60C.
TEACHER USE ONLY Yes () No ()
Apparatus set-up correct
Correct starting temperature achieved

GCE AS and A LEVEL BIOLOGY Specimen Assessment Materials 112
© WJEC CBAC Ltd.
Candidates should not be informed of any adjustments made by the centre to the yeast suspension as this will only confuse the instructions and place them at a disadvantage. If a scum forms on the yeast sugar mixture during the practical and prevents exit of bubbles from the syringe, candidates should be instructed to start again and appropriate time should be allowed for this. Because of time constraints there is no need to use new yeast at each repeat for each temperature. It is recognised that this would be necessary in order to provide a true repeat. In exceptional circumstances, where an individual has been unable to generate any data, the teacher could provide data in an unstructured format for analysis. The work should be annotated to this effect. Teachers should use the 5 minute equilibration time at step(viii) to check candidates apparatus set up and water container temperature for the ‘Teacher Assessed Marks’. Please ensure that the “Information required from centres” sheet on page 111 is
completed and given to the exams officer to be sent to the examiner with the
completed examination papers.
Awarding of teacher assessed marks
Apparatus set-up correct
Award 1 mark if no help is needed in setting up the apparatus correctly, including the nozzle of the syringe pointing upwards
Correct starting temperature achieved
Award 1 mark if a starting temperature of 55C (test 1)/ 60C
(test 2) is achieved (tolerance +/-1C)
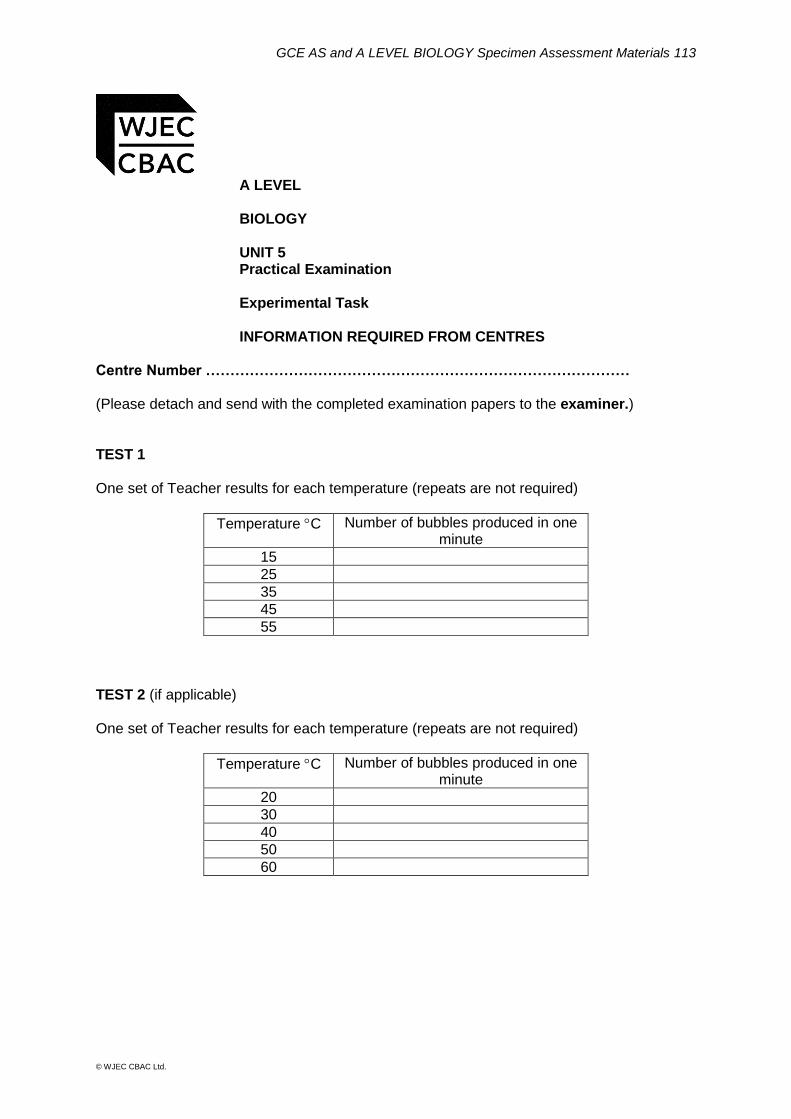
GCE AS and A LEVEL BIOLOGY Specimen Assessment Materials 113
© WJEC CBAC Ltd.
A LEVEL
BIOLOGY UNIT 5 Practical Examination Experimental Task INFORMATION REQUIRED FROM CENTRES
Centre Number ……………………………………………………………………………
(Please detach and send with the completed examination papers to the examiner.) TEST 1 One set of Teacher results for each temperature (repeats are not required)
Temperature C Number of bubbles produced in one minute
15
25
35
45
55
TEST 2 (if applicable) One set of Teacher results for each temperature (repeats are not required)
Temperature C Number of bubbles produced in one minute
20
30
40
50
60

GCE AS and A LEVEL BIOLOGY Specimen Assessment Materials 115
© WJEC CBAC Ltd.
Candidate Name Centre Number Candidate Number
0
A LEVEL BIOLOGY UNIT 5 Practical Examination Experimental Task TEST 1 SPECIMEN PAPER (2 hours)
For Examiner’s use only
Question Maximum Mark
Mark Awarded
Total 20
INFORMATION FOR CANDIDATES The total number of marks available for this task is 20. The number of marks is given in brackets at the end of each question or part-question.
ADDITIONAL MATERIALS In addition to this paper you will require a calculator and a ruler. INSTRUCTIONS TO CANDIDATES Use black ink or black ball-point pen. Answer all questions. Write your name, centre number and candidate number in the spaces at the top of this page. Write your answers in the spaces provided in this booklet.
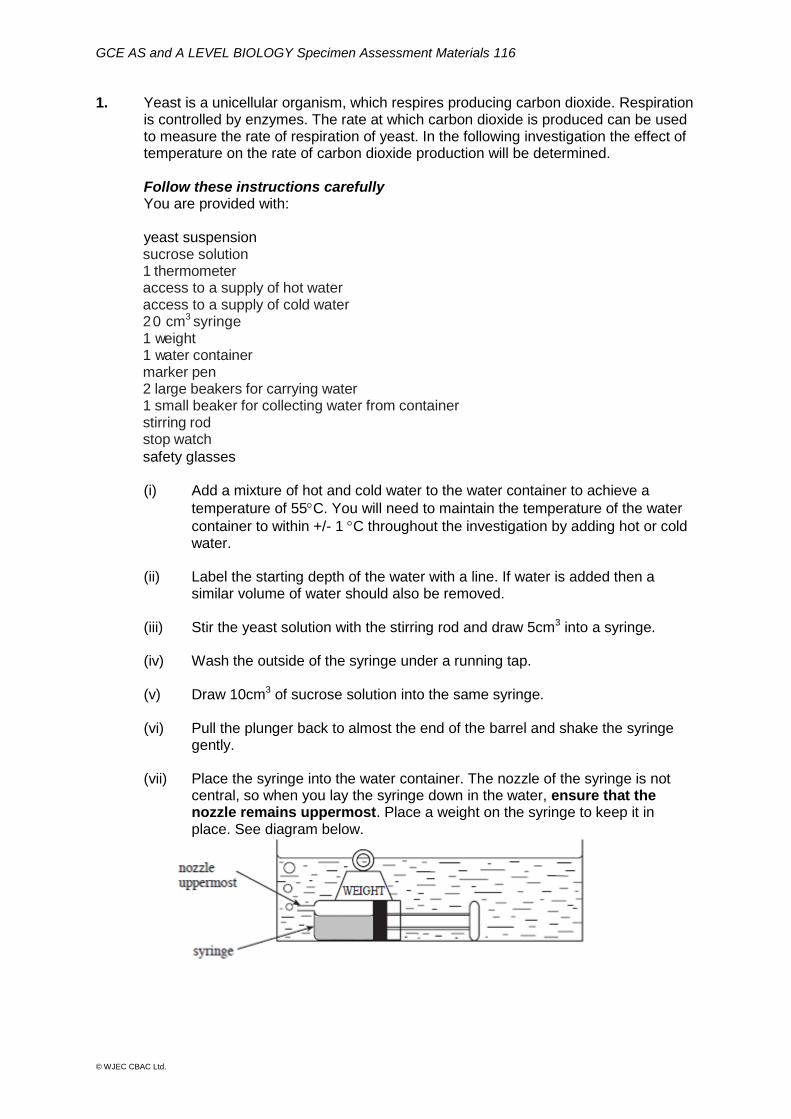
GCE AS and A LEVEL BIOLOGY Specimen Assessment Materials 116
© WJEC CBAC Ltd.
1. Yeast is a unicellular organism, which respires producing carbon dioxide. Respiration is controlled by enzymes. The rate at which carbon dioxide is produced can be used to measure the rate of respiration of yeast. In the following investigation the effect of temperature on the rate of carbon dioxide production will be determined.
Follow these instructions carefully You are provided with: yeast suspension sucrose solution 1 thermometer access to a supply of hot water access to a supply of cold water 20 cm3 syringe 1 weight 1 water container marker pen 2 large beakers for carrying water 1 small beaker for collecting water from container stirring rod stop watch
safety glasses (i) Add a mixture of hot and cold water to the water container to achieve a
temperature of 55C. You will need to maintain the temperature of the water
container to within +/- 1 C throughout the investigation by adding hot or cold water.
(ii) Label the starting depth of the water with a line. If water is added then a
similar volume of water should also be removed. (iii) Stir the yeast solution with the stirring rod and draw 5cm3 into a syringe. (iv) Wash the outside of the syringe under a running tap. (v) Draw 10cm3 of sucrose solution into the same syringe. (vi) Pull the plunger back to almost the end of the barrel and shake the syringe
gently. (vii) Place the syringe into the water container. The nozzle of the syringe is not
central, so when you lay the syringe down in the water, ensure that the nozzle remains uppermost. Place a weight on the syringe to keep it in place. See diagram below.

GCE AS and A LEVEL BIOLOGY Specimen Assessment Materials 117
© WJEC CBAC Ltd.
BEFORE PROCEEDING YOUR TEACHER MUST CHECK THE SET UP OF YOUR APPARATUS. PLEASE NOTE: this check is only required for the first repeat of your first temperature.
(viii) Wait for 5 minutes while maintaining the water temperature in the container. (ix) After 5 minutes bubbles of gas should be observed leaving the nozzle
regularly. If no bubbles are appearing, wait another 5 minutes and inform your teacher.
(x) If the bubbles are appearing regularly start counting the number of bubbles
that appear from the nozzle of the syringe. Count the number of bubbles given off in 1 minute. Count the number of bubbles produced in 1 minute twice more so that you have three counts for the syringe.
(xi) Repeat the whole procedure using a new syringe of yeast for each of the
following temperatures: 45 C, 35 C, 25 C, 15 C. PLEASE NOTE: You do not need to empty the water container completely to reduce its temperature in step(xi). Remove some water and add more cold water until desired temperature is achieved. NOTE: If at any stage your syringes look as if they could be blocked, for example if bubbles do not come out after the incubation period, please ask your teacher for advice.
SPACE BELOW FOR ROUGH RESULTS – THESE WILL NOT BE ASSESSED.
TEACHER USE ONLY Yes () No ()
Apparatus set-up correct
Correct starting temperature achieved

GCE AS and A LEVEL BIOLOGY Specimen Assessment Materials 118
© WJEC CBAC Ltd.
(a) Construct a suitable table below and record your results. This table should include your raw data and your mean for each temperature. [5]

GCE AS and A LEVEL BIOLOGY Specimen Assessment Materials 119
© WJEC CBAC Ltd.
(b) On the grid below plot a graph of your mean results, including range bars. [9]
GCE AS and A LEVEL BIOLOGY Specimen Assessment Materials 120
© WJEC CBAC Ltd.
(c) Explain what the range bars you have plotted tell you about your results for
this experiment. [2]
......................................................................................................................................
......................................................................................................................................
......................................................................................................................................
......................................................................................................................................
(d) Suggest two sources of inaccuracy in this investigation and an improvement
for each. [2] ......................................................................................................................................
......................................................................................................................................
......................................................................................................................................
......................................................................................................................................
......................................................................................................................................
......................................................................................................................................
(e) Suggest how the technique which you have used could be modified to investigate the effect of pH on respiration in yeast. [2]
.......................................................................................................................................
.......................................................................................................................................
.......................................................................................................................................
.......................................................................................................................................
20

GCE AS and A LEVEL BIOLOGY Specimen Assessment Materials 121
© WJEC CBAC Ltd.
Candidate Name Centre Number Candidate Number
0
A LEVEL BIOLOGY UNIT 5 Practical Examination Experimental Task TEST 2 SPECIMEN PAPER (2 hours)
For Examiner’s use only
Question Maximum Mark
Mark Awarded
Total 20
INFORMATION FOR CANDIDATES The total number of marks available for this task is 20. The number of marks is given in brackets at the end of each question or part-question. You are reminded of the need for good English and orderly, clear presentation in your answers.
ADDITIONAL MATERIALS In addition to this paper you will require a calculator and a ruler. INSTRUCTIONS TO CANDIDATES Use black ink or black ball-point pen. Answer all questions. Write your name, centre number and candidate number in the spaces at the top of this page. Write your answers in the spaces provided in this booklet.

GCE AS and A LEVEL BIOLOGY Specimen Assessment Materials 122
© WJEC CBAC Ltd.
1. Yeast is a unicellular organism, which respires producing carbon dioxide. Respiration is controlled by enzymes. The rate at which carbon dioxide is produced can be used to measure the rate of respiration of yeast. In the following investigation the effect of temperature on the rate of carbon dioxide production will be determined.
Follow these instructions carefully You are provided with: yeast suspension sucrose solution 1 thermometer access to a supply of hot water access to a supply of cold water 20 cm3 syringe 1 weight 1 water container marker pen 2 large beakers for carrying water 1 small beaker for collecting water from container stirring rod stop watch safety glasses (i) Add a mixture of hot and cold water to the water container to achieve a
temperature of 60C. You will need to maintain the temperature of the water
container to within +/- 1 C throughout the investigation by adding hot or cold water.
(ii) Label the starting depth of the water with a line. If water is added then a
similar volume of water should also be removed. (iii) Stir the yeast solution with the stirring rod and draw 5cm3 into a syringe. (iv) Wash the outside of the syringe under a running tap. (v) Draw 10cm3 of sucrose solution into the same syringe. (vi) Pull the plunger back to almost the end of the barrel and shake the syringe
gently. (vii) Place the syringe into the water container. The nozzle of the syringe is not
central, so when you lay the syringe down in the water, ensure that the nozzle remains uppermost. Place a weight on the syringe to keep it in place. See diagram below.

GCE AS and A LEVEL BIOLOGY Specimen Assessment Materials 123
© WJEC CBAC Ltd.
BEFORE PROCEEDING YOUR TEACHER MUST CHECK THE SET UP OF YOUR APPARATUS. PLEASE NOTE: this check is only required for the first repeat of your first temperature.
(viii) Wait for 5 minutes while maintaining the water temperature in the container. (ix) After 5 minutes bubbles of gas should be observed leaving the nozzle
regularly. If no bubbles are appearing, wait another 5 minutes and inform your teacher.
(x) If the bubbles are appearing regularly start counting the number of bubbles
that appear from the nozzle of the syringe. Count the number of bubbles given off in 1 minute. Count the number of bubbles produced in 1 minute twice more so that you have three counts for the syringe.
(xi) Repeat the whole procedure using a new syringe of yeast for each of the
following temperatures: 50 C, 40 C, 30 C, 20 C. PLEASE NOTE: you do not need to empty the water container completely to reduce its temperature in step(xi). Remove some water and add more cold water until desired temperature is achieved.
NOTE: If at any stage your syringes look as if they could be blocked, for example if bubbles do not come out after the incubation period, please ask your teacher for advice.
SPACE BELOW FOR ROUGH RESULTS – THESE WILL NOT BE ASSESSED.
TEACHER USE ONLY Yes () No ()
Apparatus set-up correct
Correct starting temperature achieved

GCE AS and A LEVEL BIOLOGY Specimen Assessment Materials 124
© WJEC CBAC Ltd.
(a) Construct a suitable table below and record your results. This table should
include your raw data and your mean for each temperature. [5]
GCE AS and A LEVEL BIOLOGY Specimen Assessment Materials 125
© WJEC CBAC Ltd.
(b) On the grid below plot a graph of your mean results, including range bars. [9]

GCE AS and A LEVEL BIOLOGY Specimen Assessment Materials 126
© WJEC CBAC Ltd.
(c) Explain what the range bars you have plotted tell you about your results for
this experiment. [2]
......................................................................................................................................
......................................................................................................................................
......................................................................................................................................
......................................................................................................................................
(d) Suggest two sources of inaccuracy in this investigation and an improvement
for each. [2] ......................................................................................................................................
......................................................................................................................................
......................................................................................................................................
......................................................................................................................................
......................................................................................................................................
......................................................................................................................................
(e) Suggest how the technique which you have used could be modified to investigate the effect of sucrose concentration on respiration in yeast. [2]
.......................................................................................................................................
.......................................................................................................................................
.......................................................................................................................................
.......................................................................................................................................
20

GCE AS and A LEVEL BIOLOGY Specimen Assessment Materials 127
© WJEC CBAC Ltd.
Candidate Name Centre Number Candidate Number
0
A LEVEL BIOLOGY UNIT 5 Practical Examination Practical Analysis Task SPECIMEN PAPER (1 hour)
For Examiner’s use only
Question Maximum Mark
Mark Awarded
1. 20
2. 10
Total 30
INFORMATION FOR CANDIDATES The total number of marks available for this task is 30. The number of marks is given in brackets at the end of each question or part-question.
ADDITIONAL MATERIALS In addition to this paper you will require a calculator and a ruler. INSTRUCTIONS TO CANDIDATES Use black ink or black ball-point pen. Answer all questions. Write your name, centre number and candidate number in the spaces at the top of this page. Write your answers in the spaces provided in this booklet.

GCE AS and A LEVEL BIOLOGY Specimen Assessment Materials 128
© WJEC CBAC Ltd.
1. DCPIP (2,6-dichlorophenol indophenol) is a blue dye and is an electron acceptor.
DCPIP turns colourless when reduced. Chloroplasts were isolated by grinding spinach leaves in a cold medium of suitable osmotic and ionic strength in a buffer at pH 7.0. Solutions and apparatus were kept cold during the isolation procedure and storage of the chloroplasts prior to use. The time taken for the chloroplast extract to decolourise DCPIP in the presence of blue light (wavelength 440 nm) was recorded. The experiment was then carried out in the presence of red light (wavelength 680 nm). Each experiment was carried out a total of ten times. (a) (i) Suggest a suitable control for the above experiment. [1]
............................................................................................................................
............................................................................................................................
(ii) State why the chloroplasts were extracted using ‘a cold medium of suitable osmotic and ionic strength in a buffer of pH7’ and kept cold at all times. [3]
............................................................................................................................
............................................................................................................................
............................................................................................................................
............................................................................................................................
(iii) A tube containing the chloroplast extract, but without the DCPIP was retained for use in the experiment. Suggest what this sample was used for. [1]
............................................................................................................................
............................................................................................................................
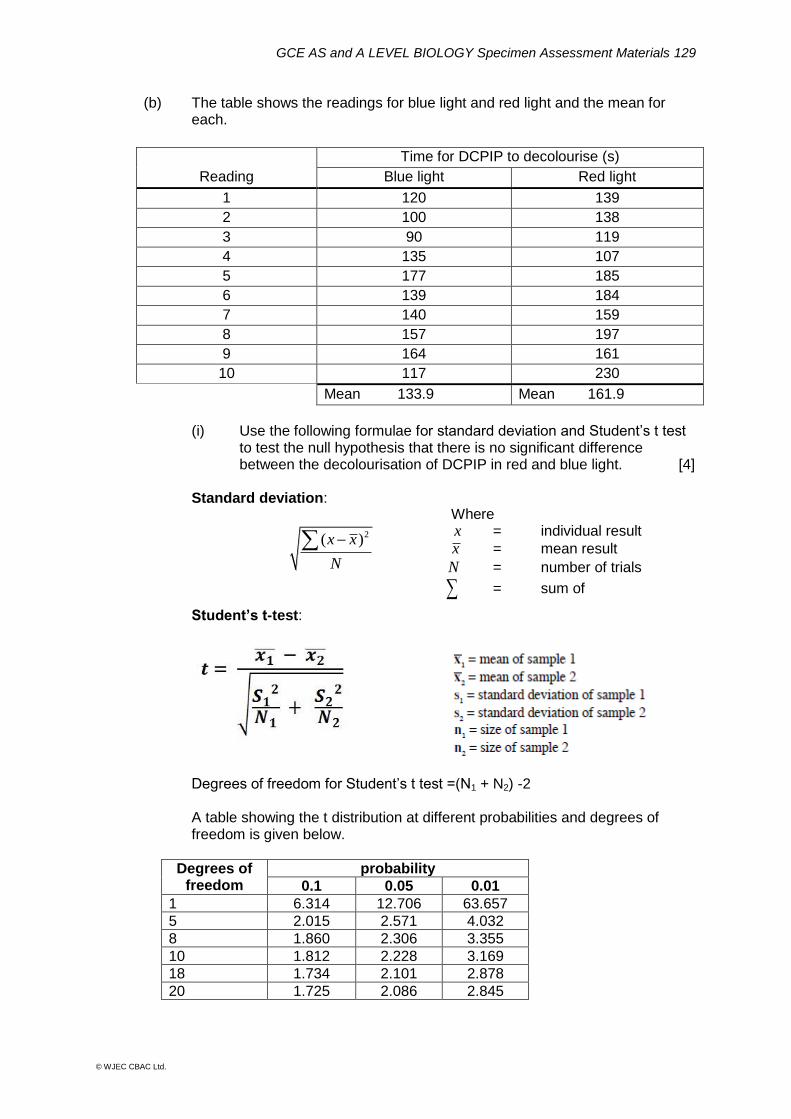
GCE AS and A LEVEL BIOLOGY Specimen Assessment Materials 129
© WJEC CBAC Ltd.
(b) The table shows the readings for blue light and red light and the mean for each.
Reading
Time for DCPIP to decolourise (s)
Blue light Red light
1 120 139
2 100 138
3 90 119
4 135 107
5 177 185
6 139 184
7 140 159
8 157 197
9 164 161
10 117 230
Mean 133.9 Mean 161.9
(i) Use the following formulae for standard deviation and Student’s t test
to test the null hypothesis that there is no significant difference between the decolourisation of DCPIP in red and blue light. [4]
Standard deviation:
2( )x x
N
Student’s t-test: Degrees of freedom for Student’s t test =(N1 + N2) -2 A table showing the t distribution at different probabilities and degrees of freedom is given below.
Degrees of freedom
probability
0.1 0.05 0.01
1 6.314 12.706 63.657
5 2.015 2.571 4.032
8 1.860 2.306 3.355
10 1.812 2.228 3.169
18 1.734 2.101 2.878
20 1.725 2.086 2.845
Where x = individual result
x = mean result
N = number of trials
= sum of
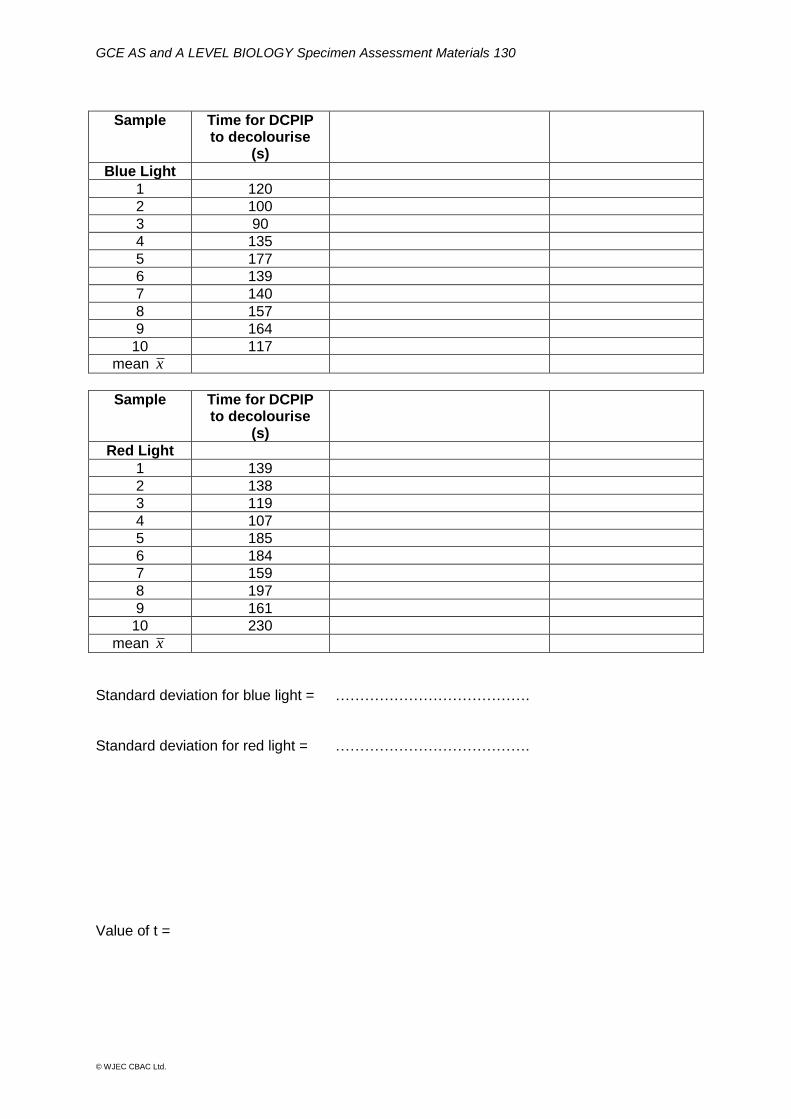
GCE AS and A LEVEL BIOLOGY Specimen Assessment Materials 130
© WJEC CBAC Ltd.
Sample Time for DCPIP to decolourise
(s)
Blue Light
1 120
2 100
3 90
4 135
5 177
6 139
7 140
8 157
9 164
10 117
mean x
Sample Time for DCPIP to decolourise
(s)
Red Light
1 139
2 138
3 119
4 107
5 185
6 184
7 159
8 197
9 161
10 230
mean x
Standard deviation for blue light = …………………………………. Standard deviation for red light = …………………………………. Value of t =

GCE AS and A LEVEL BIOLOGY Specimen Assessment Materials 131
© WJEC CBAC Ltd.
(ii) Using your value of t and the degrees of freedom for this data set
conclude if you would accept or reject the null hypothesis for this
experiment at a suitable level of probability. Give a reason for your
choice. [2]
............................................................................................................................
............................................................................................................................
(iii) Describe how chloroplasts produce electrons that result in the decolourisation of DCPIP and suggest a biological explanation for the difference in time taken for DCPIP to decolourise in red and blue light. [5]
............................................................................................................................
............................................................................................................................
............................................................................................................................
............................................................................................................................
............................................................................................................................
............................................................................................................................
............................................................................................................................
(iv) Suggest how you could use a colorimeter to produce more accurate
results than those obtained. [2]
............................................................................................................................
............................................................................................................................
(c) The experiment was repeated at 550nm. What would you expect to happen to the time taken to decolourise DCPIP at
this wavelength? Give reasons for your answer. [2]
.......................................................................................................................................
.......................................................................................................................................
20
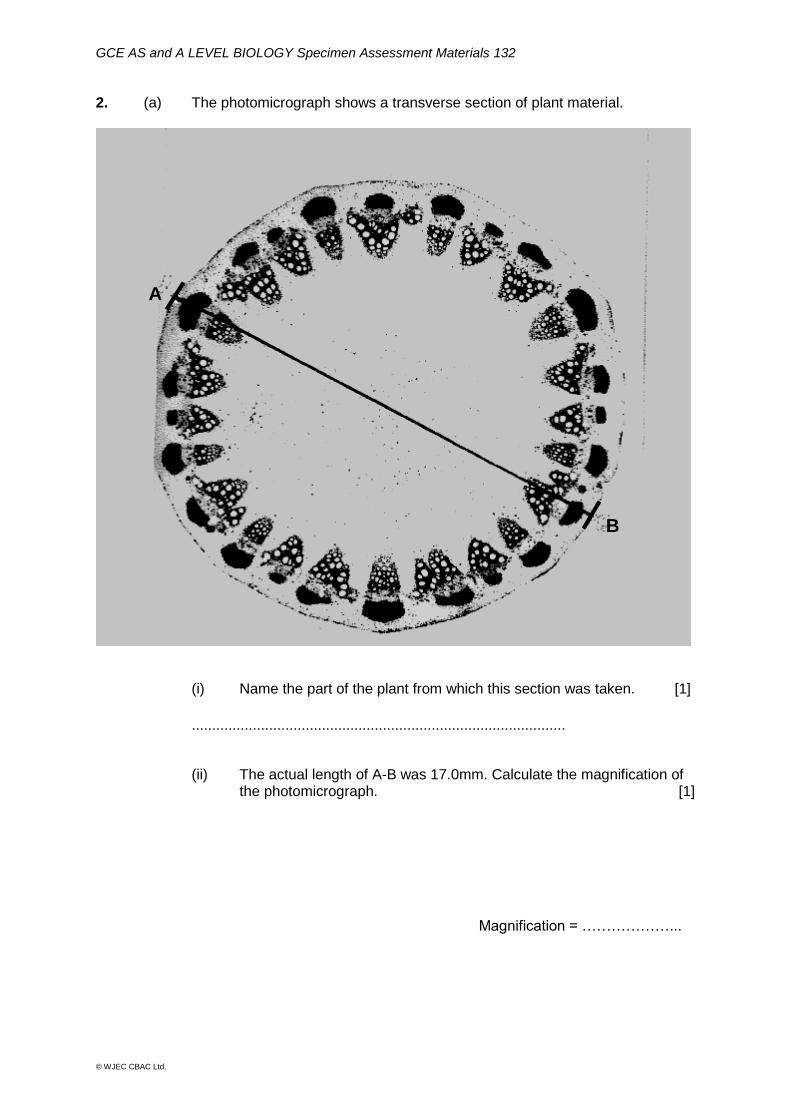
GCE AS and A LEVEL BIOLOGY Specimen Assessment Materials 132
© WJEC CBAC Ltd.
2. (a) The photomicrograph shows a transverse section of plant material.
(i) Name the part of the plant from which this section was taken. [1]
............................................................................................
(ii) The actual length of A-B was 17.0mm. Calculate the magnification of
the photomicrograph. [1] Magnification = ………………...
A
B

GCE AS and A LEVEL BIOLOGY Specimen Assessment Materials 133
© WJEC CBAC Ltd.
(b) The drawing is a plan showing the tissue layers in the section.
(i) Identify tissues C, D and E [3]
C ...............................................................
D ..............................................................
E ...............................................................
(ii) Conclude why the cells in the region labelled F and the cells in region
C are both stained the same colour with a biological stain during the
preparation of the slide, unlike regions D and E. [1]
............................................................................................................................
...........................................................................................................................
(iii) Give one other structural difference between the cells found and C
and D. [1]
............................................................................................................................
...........................................................................................................................
X - Y = 15.3 epu P - R = 1.5 epu epu = eye piece units
D
E
C
F
Y
X
GCE AS and A LEVEL BIOLOGY Specimen Assessment Materials 134
© WJEC CBAC Ltd.
(iv) The structures containing tissues C, D and F have not been drawn in
the correct proportion to the diameter of the section.
Use the information given to calculate the length that line P-R should
measure on the drawing and explain your reasoning [3]
Length = ………………………..mm
Reasoning
…………………………………………………………………………………………
…………………………………………………………………………………………
10
GCE AS and A LEVEL BIOLOGY Specimen Assessment Materials 135
© WJEC CBAC Ltd.
UNIT 1 – BASIC BIOCHEMISTRY AND CELL ORGANISATION
MARK SCHEME
GENERAL INSTRUCTIONS Recording of marks
Examiners must mark in red ink.
One tick must equate to one mark.
Question totals should be written in the box at the end of the question.
Question totals should be entered onto the grid on the front cover and these should be added to give the script total for each candidate.
Marking rules
All work should be seen to have been marked.
Marking schemes will indicate when explicit working is deemed to be a necessary part of a correct answer.
Crossed out responses not replaced should be marked.
Credit will be given for correct relevant alternative responses which are not recorded in the mark scheme.
Extended response question A level of response mark scheme is used. Before applying the mark scheme please read through the whole answer from start to finish. Firstly, decide which level descriptor matches best with the candidate’s response: remember that you should be considering the overall quality of the response. Then decide which mark to award within the level. Award the higher mark in the level if there is a good match with both the content statements and the communication statement. Award the middle mark in the level if most of the content statements are given and the communication statement is partially met. Award the lower mark if only the content statements are matched.

GCE AS and A LEVEL BIOLOGY Specimen Assessment Materials 136
© WJEC CBAC Ltd.
Marking abbreviations
The following may be used in marking schemes or in the marking of scripts to indicate reasons for the marks awarded.
cao = correct answer only
ecf = error carried forward
bod = benefit of doubt

GCE AS and A LEVEL BIOLOGY Specimen Assessment Materials 137
© WJEC CBAC Ltd.
Question Marking details
Marks available
AO1 AO2 AO3 Total Maths Prac
1 (a) (i) peptide bond (1) 1 1
(ii) Palmitic acid – glycine - histidine - lysine (2) Any two in correct order (1)
2 2
(iii) palmitic acid (1) 1 1
(b) (i) collagen is a single polypeptide chain (1) which has been coiled into an alpha helix (1) tropocollagen is composed of {three / 2 or more} polypeptide chains bonded together (1)
3 3
(ii) folding of molecule into a globular shape due to bonding/ interactions between R groups(1)
1 1
Question 1 total 6 2 0 8 0 0
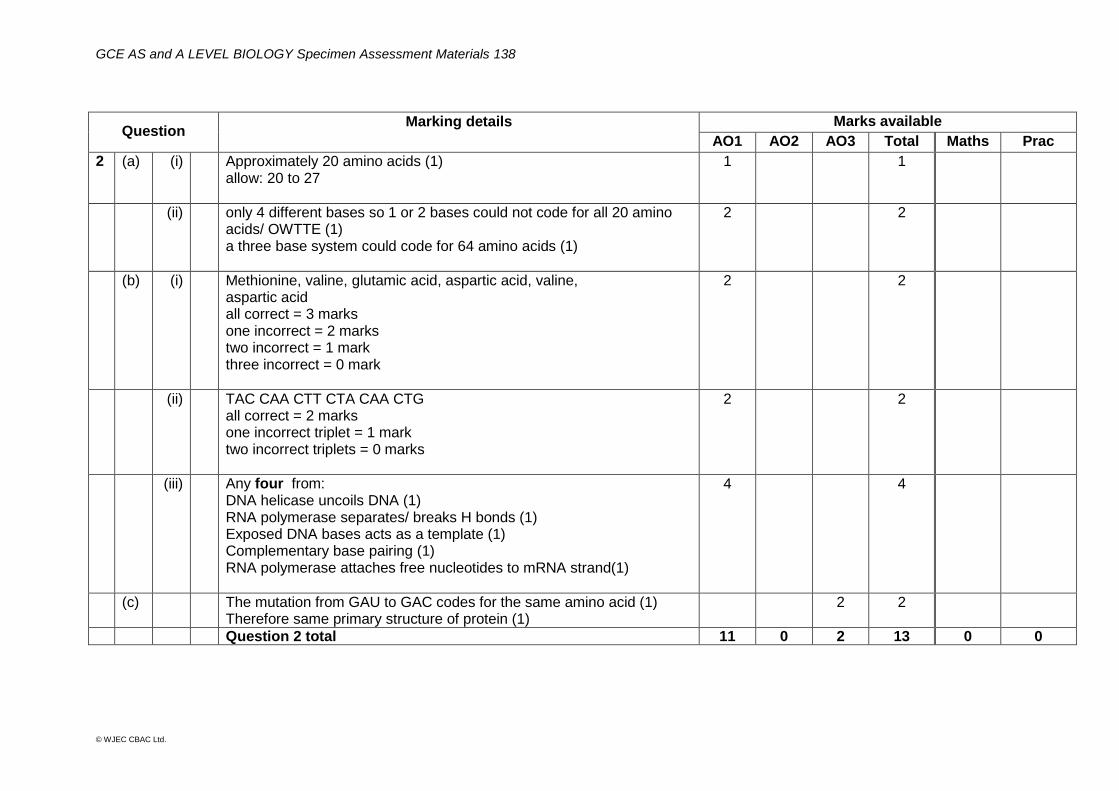
GCE AS and A LEVEL BIOLOGY Specimen Assessment Materials 138
© WJEC CBAC Ltd.
Question Marking details
Marks available
AO1 AO2 AO3 Total Maths Prac
2 (a) (i) Approximately 20 amino acids (1) allow: 20 to 27
1 1
(ii) only 4 different bases so 1 or 2 bases could not code for all 20 amino acids/ OWTTE (1) a three base system could code for 64 amino acids (1)
2 2
(b) (i) Methionine, valine, glutamic acid, aspartic acid, valine, aspartic acid all correct = 3 marks one incorrect = 2 marks two incorrect = 1 mark three incorrect = 0 mark
2 2
(ii) TAC CAA CTT CTA CAA CTG all correct = 2 marks one incorrect triplet = 1 mark two incorrect triplets = 0 marks
2 2
(iii) Any four from: DNA helicase uncoils DNA (1) RNA polymerase separates/ breaks H bonds (1) Exposed DNA bases acts as a template (1) Complementary base pairing (1) RNA polymerase attaches free nucleotides to mRNA strand(1)
4 4
(c) The mutation from GAU to GAC codes for the same amino acid (1) Therefore same primary structure of protein (1)
2 2
Question 2 total 11 0 2 13 0 0

GCE AS and A LEVEL BIOLOGY Specimen Assessment Materials 139
© WJEC CBAC Ltd.
Question Marking details
Marks available
AO1 AO2 AO3 Total Maths Prac
3 (a) (i) Lock and key and induced fit (1) 1 1
(ii) Lower the activation energy/eq (1) 1 1
(b) competitive inhibition (1) iron sulphate could have a shape similar to the substrate/complementary to the active site of glucosyl transferase (1) Fit/ bind into the active site (1) Prevent the {substrate molecule/ sucrose} entering the active site/blocks the active site (1)
2 2 4
(c) (Add iron sulphate to toothpaste / mouthwash / sugary drinks.) to prevent formation of plaque / tooth decay. (1)
1 1
Question 3 total 4 3 0 7 0 0
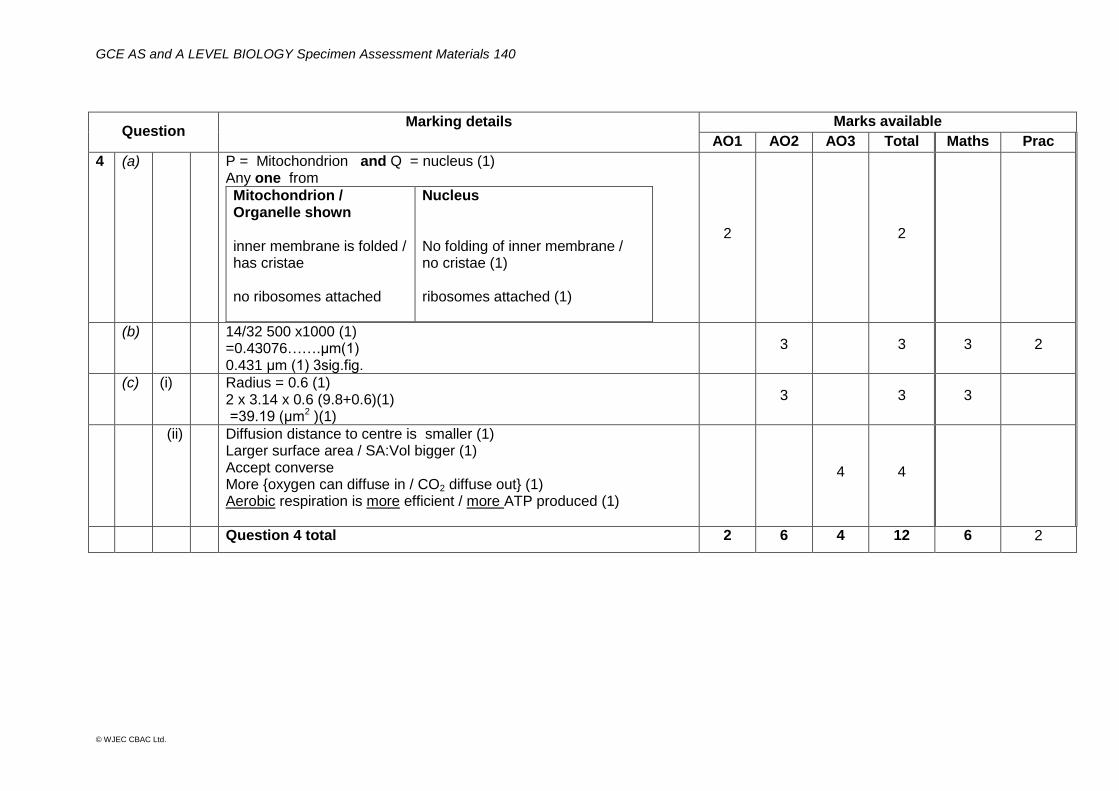
GCE AS and A LEVEL BIOLOGY Specimen Assessment Materials 140
© WJEC CBAC Ltd.
Question Marking details
Marks available
AO1 AO2 AO3 Total Maths Prac
4 (a) P = Mitochondrion and Q = nucleus (1) Any one from
Mitochondrion / Organelle shown inner membrane is folded / has cristae no ribosomes attached
Nucleus No folding of inner membrane / no cristae (1) ribosomes attached (1)
2 2
(b) 14/32 500 x1000 (1) =0.43076…….μm(1) 0.431 μm (1) 3sig.fig.
3 3 3 2
(c) (i) Radius = 0.6 (1) 2 x 3.14 x 0.6 (9.8+0.6)(1) =39.19 (μm2 )(1)
3 3 3
(ii) Diffusion distance to centre is smaller (1) Larger surface area / SA:Vol bigger (1) Accept converse More {oxygen can diffuse in / CO2 diffuse out} (1) Aerobic respiration is more efficient / more ATP produced (1)
4 4
Question 4 total 2 6 4 12 6 2
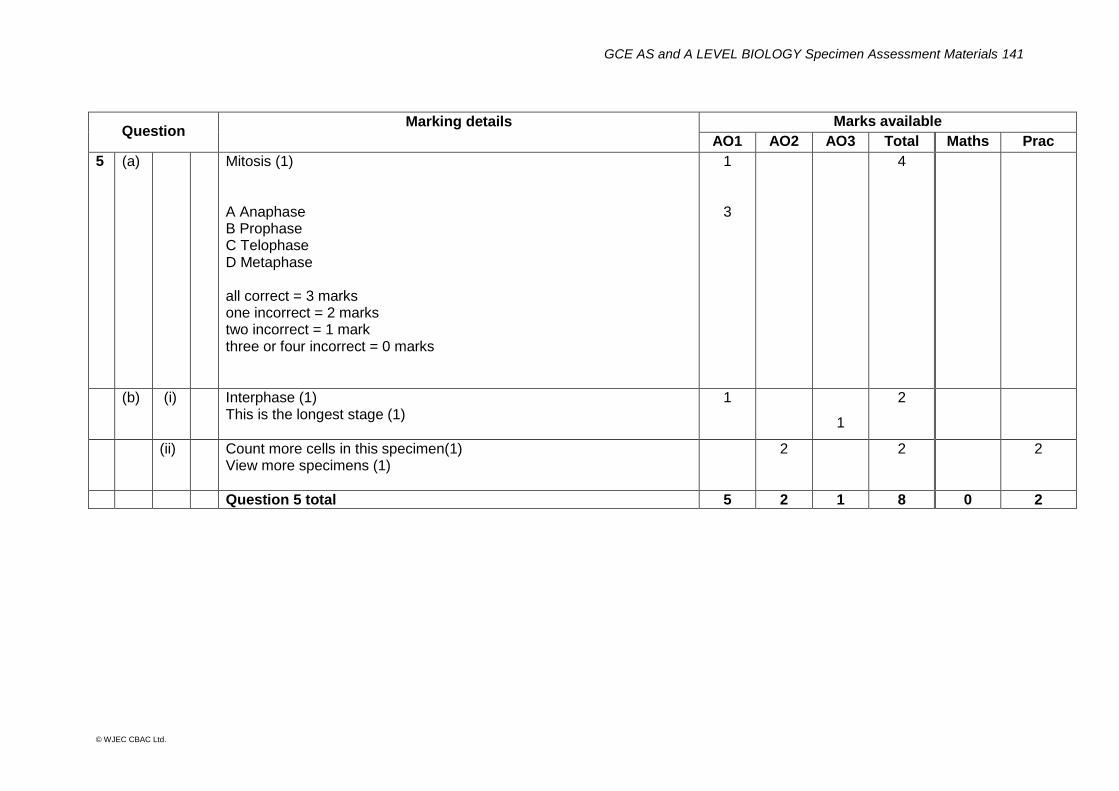
GCE AS and A LEVEL BIOLOGY Specimen Assessment Materials 141
© WJEC CBAC Ltd.
Question Marking details
Marks available
AO1 AO2 AO3 Total Maths Prac
5 (a) Mitosis (1) A Anaphase B Prophase C Telophase D Metaphase all correct = 3 marks one incorrect = 2 marks two incorrect = 1 mark three or four incorrect = 0 marks
1
3
4
(b) (i) Interphase (1) This is the longest stage (1)
1
1
2
(ii) Count more cells in this specimen(1) View more specimens (1)
2 2 2
Question 5 total 5 2 1 8 0 2
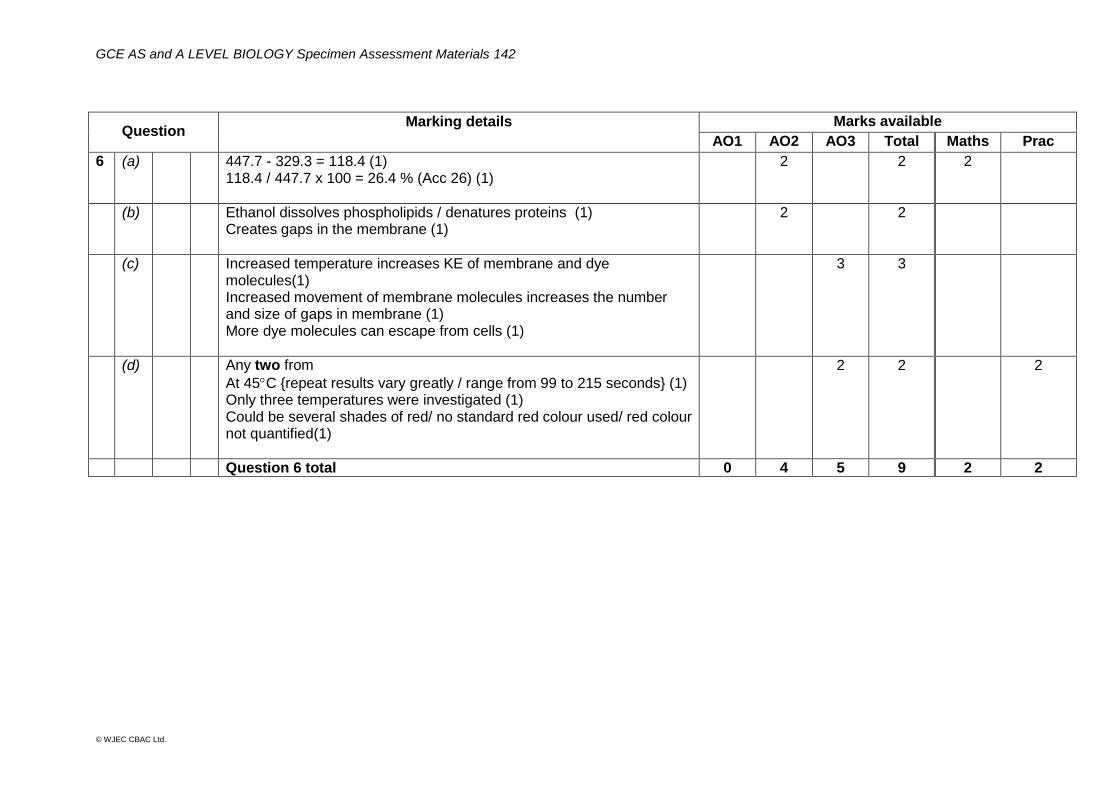
GCE AS and A LEVEL BIOLOGY Specimen Assessment Materials 142
© WJEC CBAC Ltd.
Question Marking details
Marks available
AO1 AO2 AO3 Total Maths Prac
6 (a) 447.7 - 329.3 = 118.4 (1) 118.4 / 447.7 x 100 = 26.4 % (Acc 26) (1)
2 2 2
(b) Ethanol dissolves phospholipids / denatures proteins (1) Creates gaps in the membrane (1)
2 2
(c) Increased temperature increases KE of membrane and dye molecules(1) Increased movement of membrane molecules increases the number and size of gaps in membrane (1) More dye molecules can escape from cells (1)
3 3
(d) Any two from
At 45C {repeat results vary greatly / range from 99 to 215 seconds} (1) Only three temperatures were investigated (1) Could be several shades of red/ no standard red colour used/ red colour not quantified(1)
2 2 2
Question 6 total 0 4 5 9 2 2
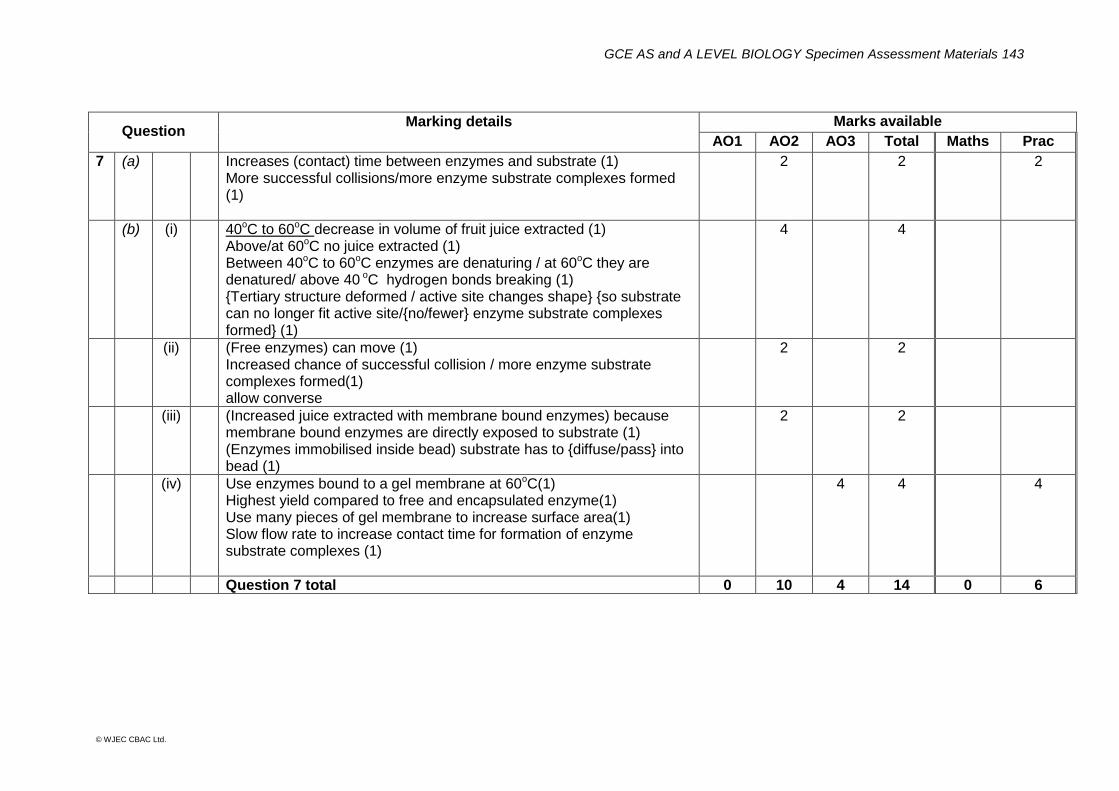
GCE AS and A LEVEL BIOLOGY Specimen Assessment Materials 143
© WJEC CBAC Ltd.
Question Marking details
Marks available
AO1 AO2 AO3 Total Maths Prac
7 (a) Increases (contact) time between enzymes and substrate (1) More successful collisions/more enzyme substrate complexes formed (1)
2 2 2
(b) (i) 40oC to 60oC decrease in volume of fruit juice extracted (1) Above/at 60oC no juice extracted (1) Between 40oC to 60oC enzymes are denaturing / at 60oC they are denatured/ above 40 oC hydrogen bonds breaking (1) {Tertiary structure deformed / active site changes shape} {so substrate can no longer fit active site/{no/fewer} enzyme substrate complexes formed} (1)
4 4
(ii) (Free enzymes) can move (1) Increased chance of successful collision / more enzyme substrate complexes formed(1) allow converse
2 2
(iii) (Increased juice extracted with membrane bound enzymes) because membrane bound enzymes are directly exposed to substrate (1) (Enzymes immobilised inside bead) substrate has to {diffuse/pass} into bead (1)
2 2
(iv) Use enzymes bound to a gel membrane at 60oC(1) Highest yield compared to free and encapsulated enzyme(1) Use many pieces of gel membrane to increase surface area(1) Slow flow rate to increase contact time for formation of enzyme substrate complexes (1)
4 4 4
Question 7 total 0 10 4 14 0 6
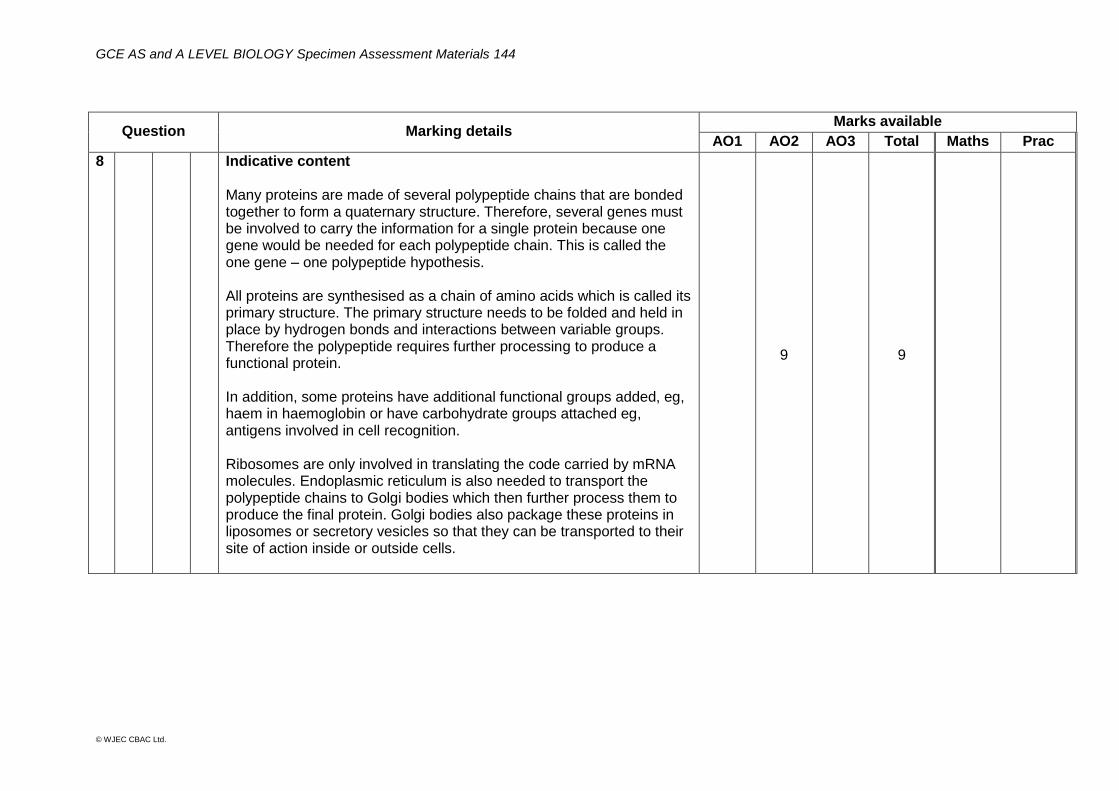
GCE AS and A LEVEL BIOLOGY Specimen Assessment Materials 144
© WJEC CBAC Ltd.
Question Marking details Marks available
AO1 AO2 AO3 Total Maths Prac
8 Indicative content Many proteins are made of several polypeptide chains that are bonded together to form a quaternary structure. Therefore, several genes must be involved to carry the information for a single protein because one gene would be needed for each polypeptide chain. This is called the one gene – one polypeptide hypothesis. All proteins are synthesised as a chain of amino acids which is called its primary structure. The primary structure needs to be folded and held in place by hydrogen bonds and interactions between variable groups. Therefore the polypeptide requires further processing to produce a functional protein. In addition, some proteins have additional functional groups added, eg, haem in haemoglobin or have carbohydrate groups attached eg, antigens involved in cell recognition. Ribosomes are only involved in translating the code carried by mRNA molecules. Endoplasmic reticulum is also needed to transport the polypeptide chains to Golgi bodies which then further process them to produce the final protein. Golgi bodies also package these proteins in liposomes or secretory vesicles so that they can be transported to their site of action inside or outside cells.
9
9
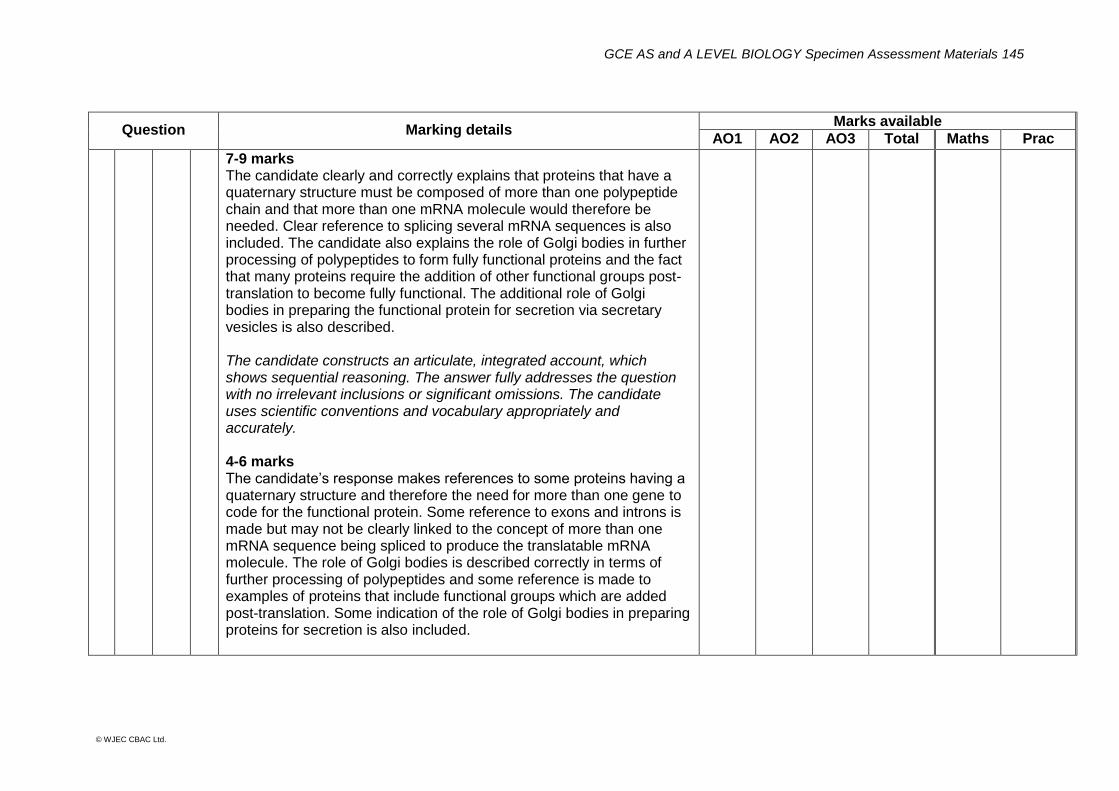
GCE AS and A LEVEL BIOLOGY Specimen Assessment Materials 145
© WJEC CBAC Ltd.
Question Marking details Marks available
AO1 AO2 AO3 Total Maths Prac
7-9 marks The candidate clearly and correctly explains that proteins that have a quaternary structure must be composed of more than one polypeptide chain and that more than one mRNA molecule would therefore be needed. Clear reference to splicing several mRNA sequences is also included. The candidate also explains the role of Golgi bodies in further processing of polypeptides to form fully functional proteins and the fact that many proteins require the addition of other functional groups post-translation to become fully functional. The additional role of Golgi bodies in preparing the functional protein for secretion via secretary vesicles is also described. The candidate constructs an articulate, integrated account, which shows sequential reasoning. The answer fully addresses the question with no irrelevant inclusions or significant omissions. The candidate uses scientific conventions and vocabulary appropriately and accurately. 4-6 marks The candidate’s response makes references to some proteins having a quaternary structure and therefore the need for more than one gene to code for the functional protein. Some reference to exons and introns is made but may not be clearly linked to the concept of more than one mRNA sequence being spliced to produce the translatable mRNA molecule. The role of Golgi bodies is described correctly in terms of further processing of polypeptides and some reference is made to examples of proteins that include functional groups which are added post-translation. Some indication of the role of Golgi bodies in preparing proteins for secretion is also included.
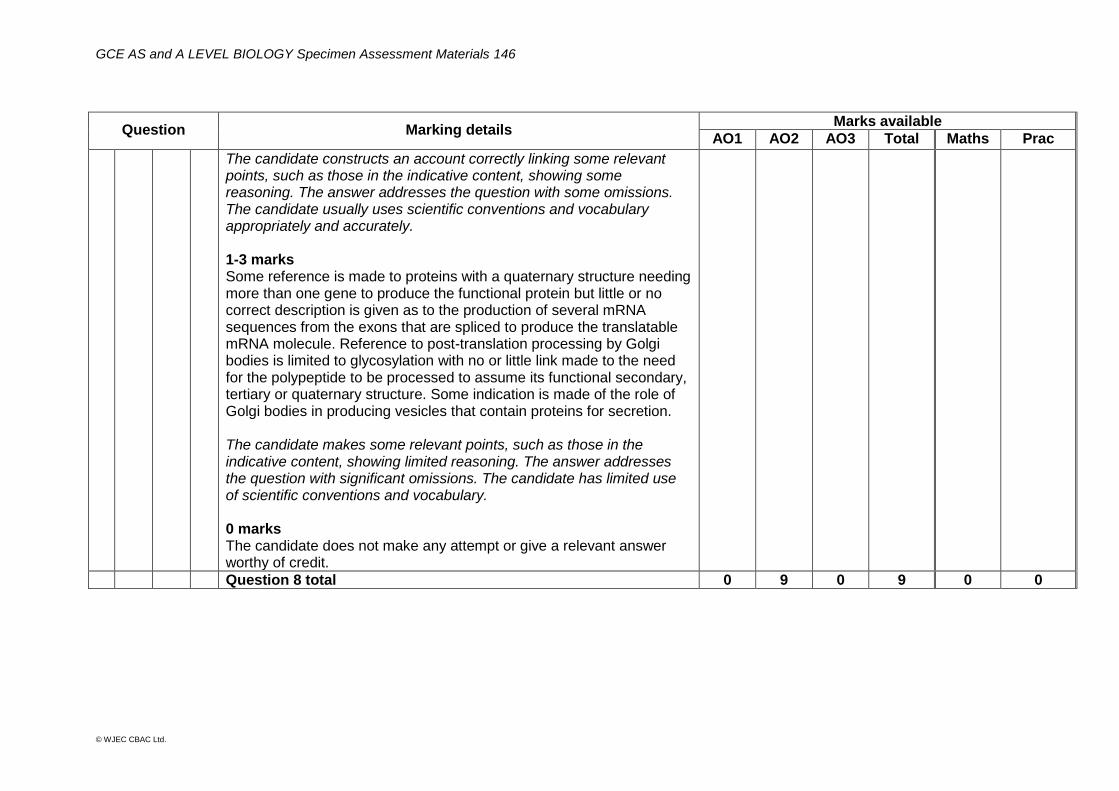
GCE AS and A LEVEL BIOLOGY Specimen Assessment Materials 146
© WJEC CBAC Ltd.
Question Marking details Marks available
AO1 AO2 AO3 Total Maths Prac
The candidate constructs an account correctly linking some relevant points, such as those in the indicative content, showing some reasoning. The answer addresses the question with some omissions. The candidate usually uses scientific conventions and vocabulary appropriately and accurately. 1-3 marks Some reference is made to proteins with a quaternary structure needing more than one gene to produce the functional protein but little or no correct description is given as to the production of several mRNA sequences from the exons that are spliced to produce the translatable mRNA molecule. Reference to post-translation processing by Golgi bodies is limited to glycosylation with no or little link made to the need for the polypeptide to be processed to assume its functional secondary, tertiary or quaternary structure. Some indication is made of the role of Golgi bodies in producing vesicles that contain proteins for secretion. The candidate makes some relevant points, such as those in the indicative content, showing limited reasoning. The answer addresses the question with significant omissions. The candidate has limited use of scientific conventions and vocabulary. 0 marks The candidate does not make any attempt or give a relevant answer worthy of credit.
Question 8 total 0 9 0 9 0 0
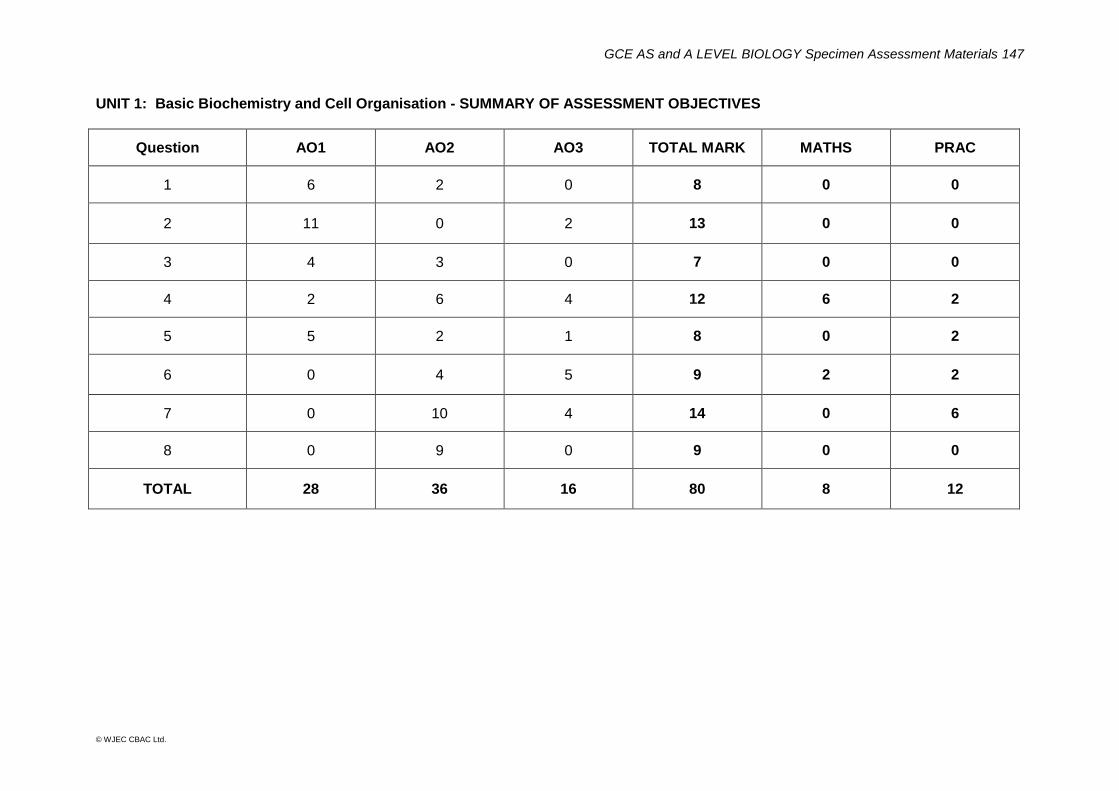
GCE AS and A LEVEL BIOLOGY Specimen Assessment Materials 147
© WJEC CBAC Ltd.
UNIT 1: Basic Biochemistry and Cell Organisation - SUMMARY OF ASSESSMENT OBJECTIVES
Question AO1 AO2 AO3 TOTAL MARK MATHS PRAC
1 6 2 0 8 0 0
2 11 0 2 13 0 0
3 4 3 0 7 0 0
4 2 6 4 12 6 2
5 5 2 1 8 0 2
6 0 4 5 9 2 2
7 0 10 4 14 0 6
8 0 9 0 9 0 0
TOTAL 28 36 16 80 8 12
GCE AS and A LEVEL BIOLOGY Specimen Assessment Materials 148
© WJEC CBAC Ltd.
UNIT 2 – BIODIVERSITY AND PHYSIOLOGY OF BODY SYSTEMS
MARK SCHEME
GENERAL INSTRUCTIONS Recording of marks
Examiners must mark in red ink.
One tick must equate to one mark.
Question totals should be written in the box at the end of the question.
Question totals should be entered onto the grid on the front cover and these should be added to give the script total for each candidate.
Marking rules
All work should be seen to have been marked.
Marking schemes will indicate when explicit working is deemed to be a necessary part of a correct answer.
Crossed out responses not replaced should be marked.
Credit will be given for correct relevant alternative responses which are not recorded in the mark scheme.
Extended response question A level of response mark scheme is used. Before applying the mark scheme please read through the whole answer from start to finish. Firstly, decide which level descriptor matches best with the candidate’s response: remember that you should be considering the overall quality of the response. Then decide which mark to award within the level. Award the higher mark in the level if there is a good match with both the content statements and the communication statement. Award the middle mark in the level if most of the content statements are given and the communication statement is partially met. Award the lower mark if only the content statements are matched.

GCE AS and A LEVEL BIOLOGY Specimen Assessment Materials 149
© WJEC CBAC Ltd.
Marking abbreviations
The following may be used in marking schemes or in the marking of scripts to indicate reasons for the marks awarded.
cao = correct answer only
ecf = error carried forward
bod = benefit of doubt
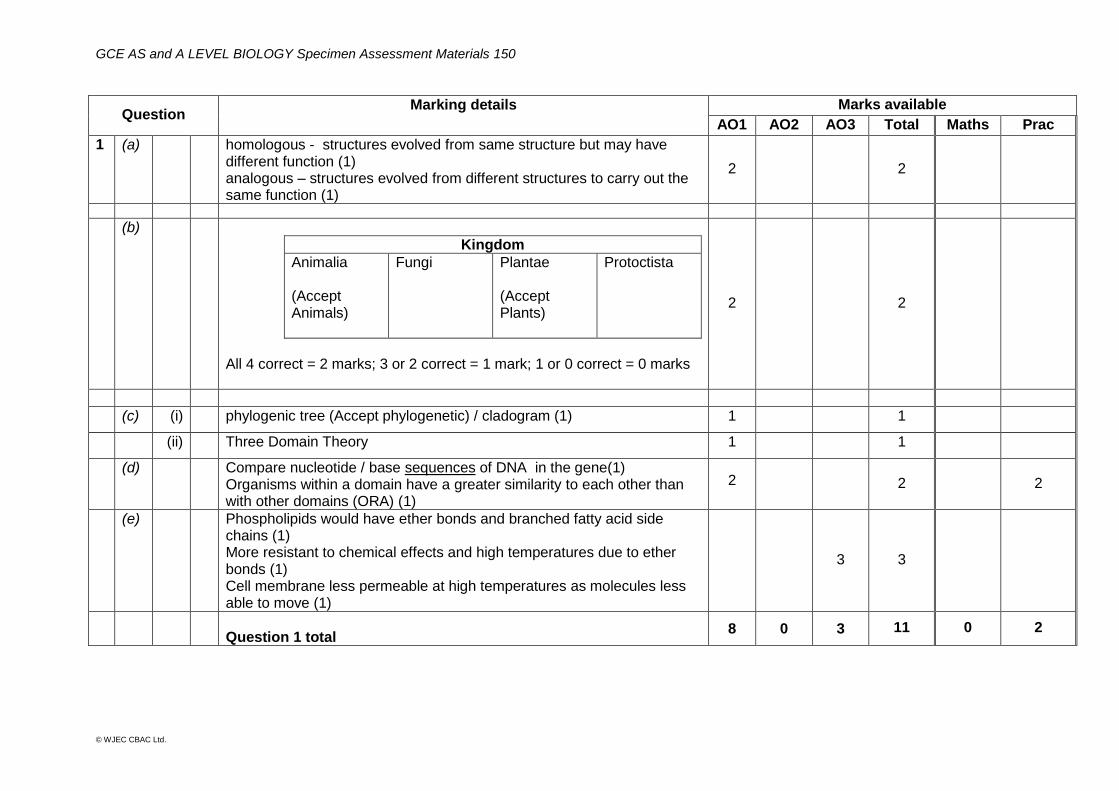
GCE AS and A LEVEL BIOLOGY Specimen Assessment Materials 150
© WJEC CBAC Ltd.
Question Marking details
Marks available
AO1 AO2 AO3 Total Maths Prac
1 (a) homologous - structures evolved from same structure but may have different function (1) analogous – structures evolved from different structures to carry out the same function (1)
2 2
(b)
Kingdom
Animalia (Accept Animals)
Fungi
Plantae (Accept Plants)
Protoctista
All 4 correct = 2 marks; 3 or 2 correct = 1 mark; 1 or 0 correct = 0 marks
2 2
(c) (i) phylogenic tree (Accept phylogenetic) / cladogram (1) 1 1
(ii) Three Domain Theory 1 1
(d)
Compare nucleotide / base sequences of DNA in the gene(1) Organisms within a domain have a greater similarity to each other than with other domains (ORA) (1)
2
2 2
(e) Phospholipids would have ether bonds and branched fatty acid side chains (1) More resistant to chemical effects and high temperatures due to ether bonds (1) Cell membrane less permeable at high temperatures as molecules less able to move (1)
3 3
Question 1 total
8 0 3 11 0 2

GCE AS and A LEVEL BIOLOGY Specimen Assessment Materials 151
© WJEC CBAC Ltd.
Question Marking details
Marks available
AO1 AO2 AO3 Total Maths Prac
2 (a) Measure length and convert to μm (1) Divide by actual size (1) Record answer with 3 sig figs (1) Max 2 if not given as 3 sig figs. length = 43mm x 1000 = 43 000 / 65 = 661.54 = x 662
3 3 3 3
(b) (i) Lower water potential in guard cells so water moves in by osmosis (1) Cells become turgid and open stomata (1)
2 2
(ii) Stomata stay open for entry of fungal hyphae (1) Increases chance of fungus being able to infect the plant(1)
2 2
(c) (i)
Any 2 from Some water absorbed is used for photosynthesis (1) Some water is used to maintain turgidity(1) Some water produced in respiration(1)
2 2
(ii) Adapting method: Cover different surfaces of leaves with Vaseline(1) Measure reduction in mass over same period of time(1) Calculate % decrease in mass(1) Reaching conclusions: Compare (%) decrease in mass from shoots treated in different ways(1) Covered surface that has lowest (%) decrease in mass has lost least water therefore has most stomata(1) Allow ecf if % decrease in mass not calculated
5 5 5
Question 2 total 0 9 5 14 3 8
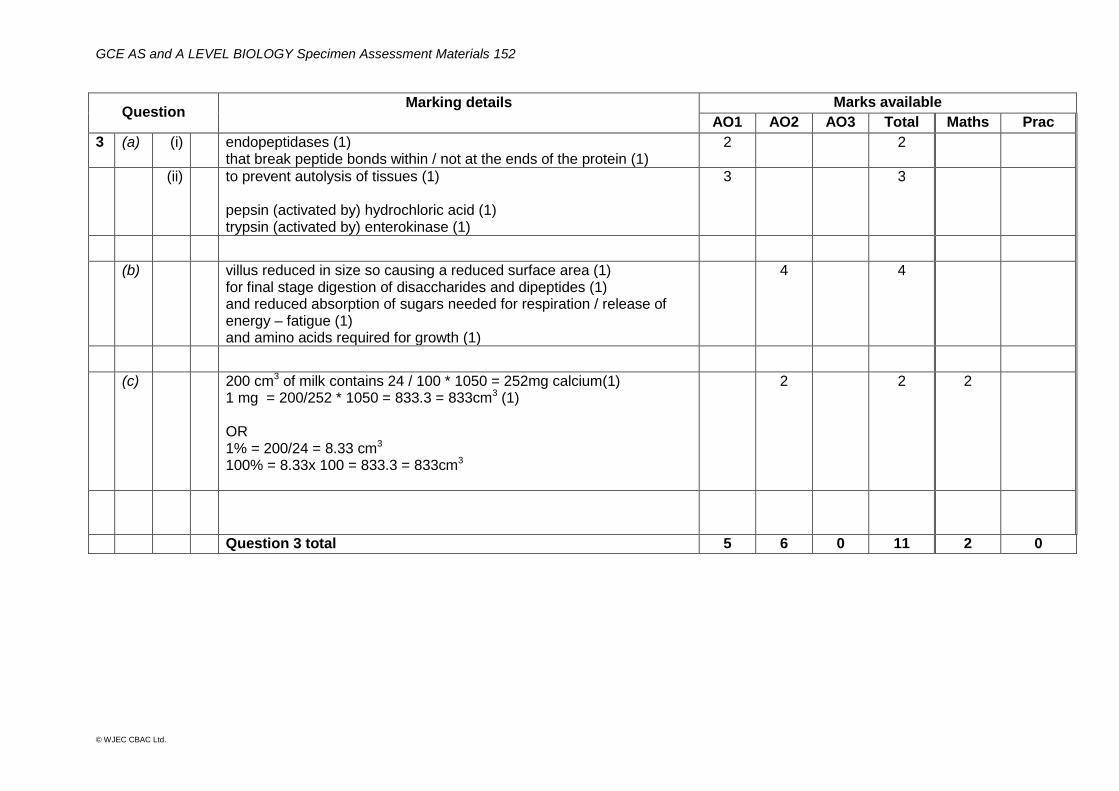
GCE AS and A LEVEL BIOLOGY Specimen Assessment Materials 152
© WJEC CBAC Ltd.
Question Marking details
Marks available
AO1 AO2 AO3 Total Maths Prac
3 (a) (i) endopeptidases (1) that break peptide bonds within / not at the ends of the protein (1)
2 2
(ii) to prevent autolysis of tissues (1) pepsin (activated by) hydrochloric acid (1) trypsin (activated by) enterokinase (1)
3 3
(b)
villus reduced in size so causing a reduced surface area (1) for final stage digestion of disaccharides and dipeptides (1) and reduced absorption of sugars needed for respiration / release of energy – fatigue (1) and amino acids required for growth (1)
4
4
(c) 200 cm3 of milk contains 24 / 100 * 1050 = 252mg calcium(1) 1 mg = 200/252 * 1050 = 833.3 = 833cm3 (1) OR 1% = 200/24 = 8.33 cm3
100% = 8.33x 100 = 833.3 = 833cm3
2 2 2
Question 3 total 5 6 0 11 2 0
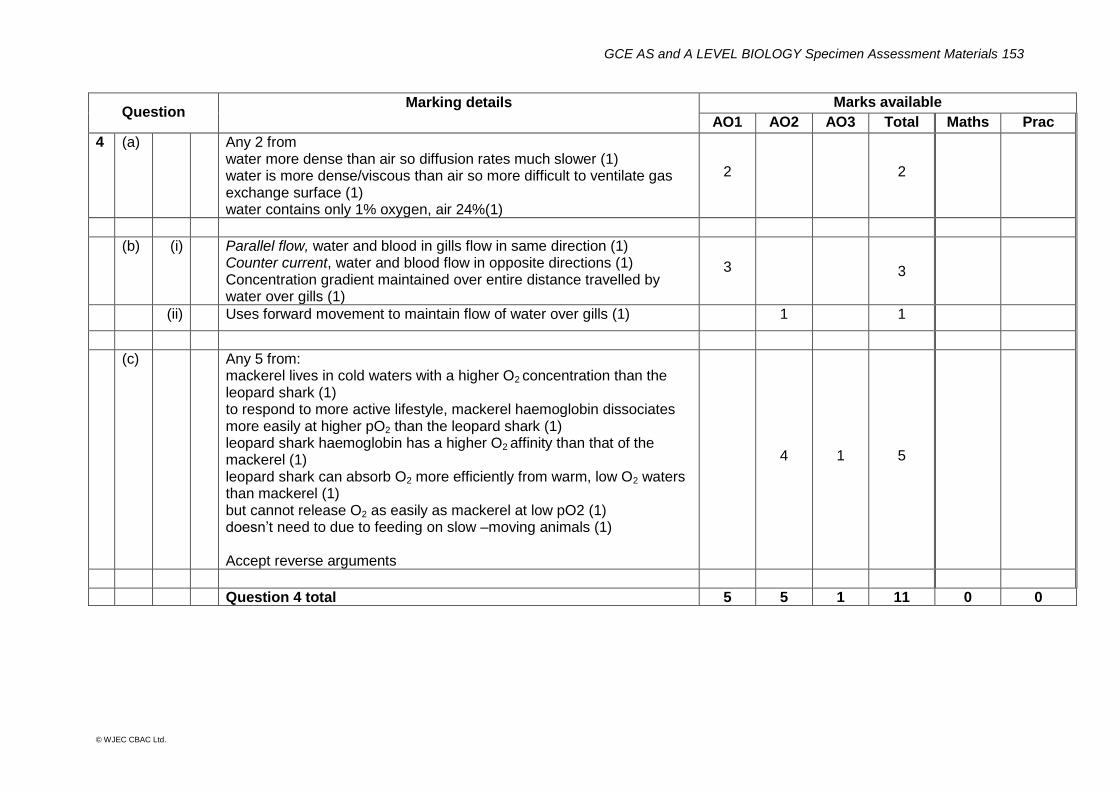
GCE AS and A LEVEL BIOLOGY Specimen Assessment Materials 153
© WJEC CBAC Ltd.
Question Marking details
Marks available
AO1 AO2 AO3 Total Maths Prac
4 (a) Any 2 from water more dense than air so diffusion rates much slower (1) water is more dense/viscous than air so more difficult to ventilate gas exchange surface (1) water contains only 1% oxygen, air 24%(1)
2 2
(b) (i) Parallel flow, water and blood in gills flow in same direction (1) Counter current, water and blood flow in opposite directions (1) Concentration gradient maintained over entire distance travelled by water over gills (1)
3 3
(ii) Uses forward movement to maintain flow of water over gills (1) 1 1
(c) Any 5 from: mackerel lives in cold waters with a higher O2 concentration than the leopard shark (1) to respond to more active lifestyle, mackerel haemoglobin dissociates more easily at higher pO2 than the leopard shark (1) leopard shark haemoglobin has a higher O2 affinity than that of the mackerel (1) leopard shark can absorb O2 more efficiently from warm, low O2 waters than mackerel (1) but cannot release O2 as easily as mackerel at low pO2 (1) doesn’t need to due to feeding on slow –moving animals (1) Accept reverse arguments
4 1 5
Question 4 total 5 5 1 11 0 0
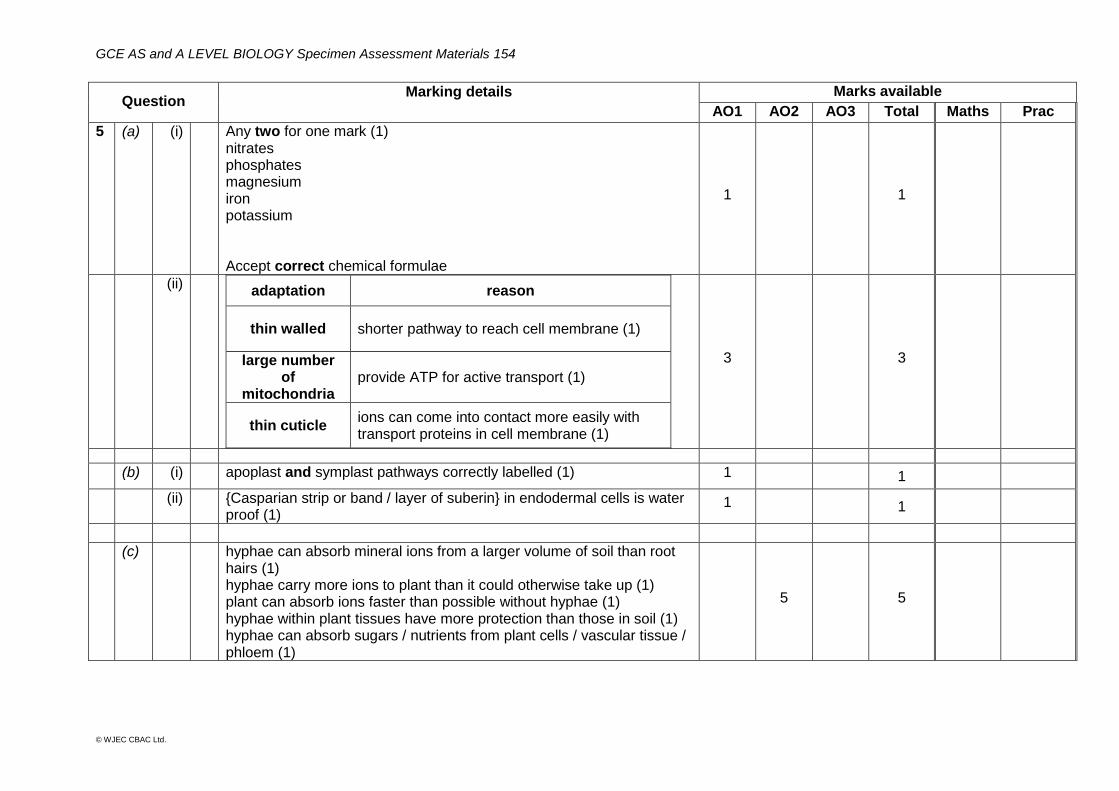
GCE AS and A LEVEL BIOLOGY Specimen Assessment Materials 154
© WJEC CBAC Ltd.
Question Marking details
Marks available
AO1 AO2 AO3 Total Maths Prac
5 (a) (i) Any two for one mark (1) nitrates phosphates magnesium iron potassium Accept correct chemical formulae
1 1
(ii) adaptation reason
thin walled shorter pathway to reach cell membrane (1)
large number of
mitochondria provide ATP for active transport (1)
thin cuticle ions can come into contact more easily with transport proteins in cell membrane (1)
3 3
(b) (i) apoplast and symplast pathways correctly labelled (1) 1 1
(ii) {Casparian strip or band / layer of suberin} in endodermal cells is water proof (1)
1 1
(c) hyphae can absorb mineral ions from a larger volume of soil than root hairs (1) hyphae carry more ions to plant than it could otherwise take up (1) plant can absorb ions faster than possible without hyphae (1) hyphae within plant tissues have more protection than those in soil (1) hyphae can absorb sugars / nutrients from plant cells / vascular tissue / phloem (1)
5 5
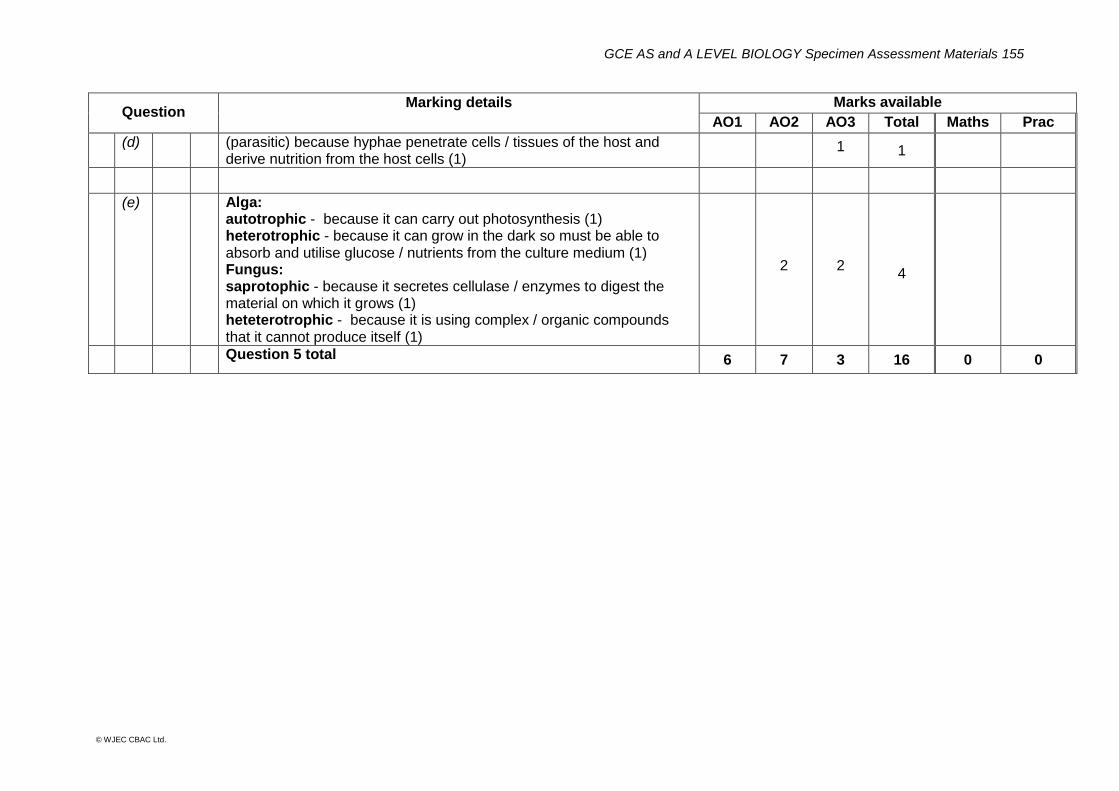
GCE AS and A LEVEL BIOLOGY Specimen Assessment Materials 155
© WJEC CBAC Ltd.
Question Marking details
Marks available
AO1 AO2 AO3 Total Maths Prac
(d) (parasitic) because hyphae penetrate cells / tissues of the host and derive nutrition from the host cells (1)
1 1
(e) Alga: autotrophic - because it can carry out photosynthesis (1) heterotrophic - because it can grow in the dark so must be able to absorb and utilise glucose / nutrients from the culture medium (1) Fungus: saprotophic - because it secretes cellulase / enzymes to digest the material on which it grows (1) heteterotrophic - because it is using complex / organic compounds that it cannot produce itself (1)
2 2
4
Question 5 total 6 7 3 16 0 0
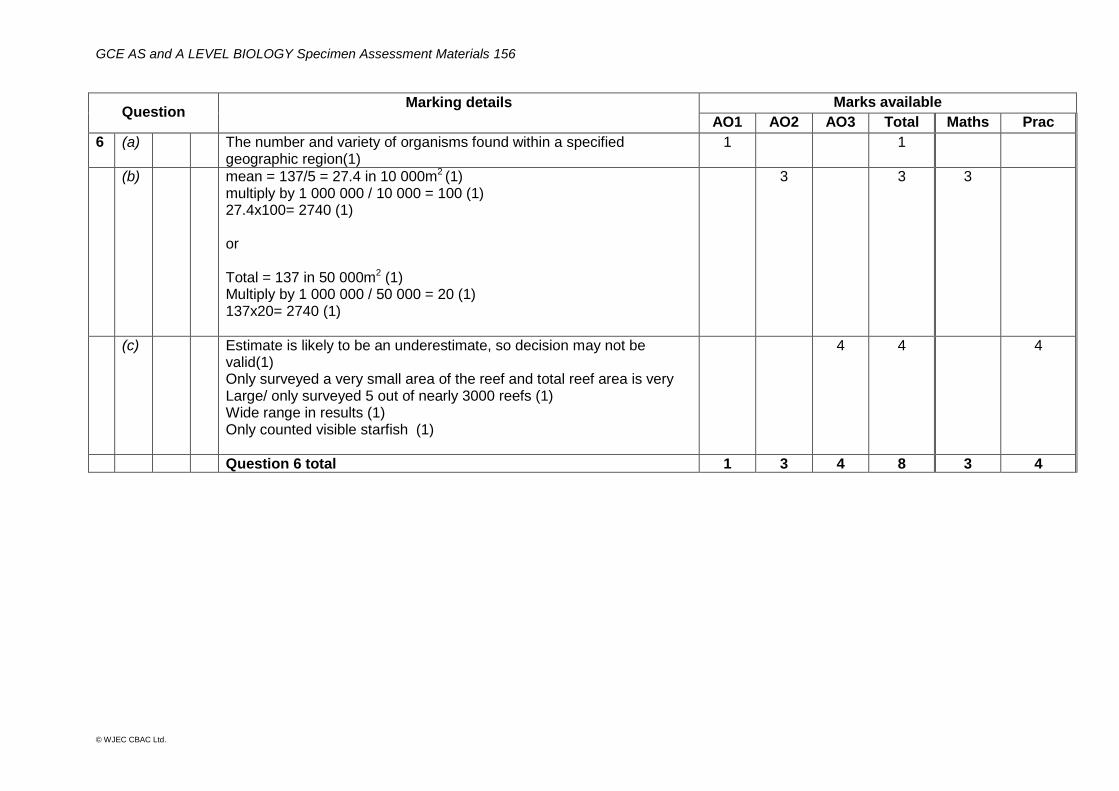
GCE AS and A LEVEL BIOLOGY Specimen Assessment Materials 156
© WJEC CBAC Ltd.
Question Marking details
Marks available
AO1 AO2 AO3 Total Maths Prac
6 (a) The number and variety of organisms found within a specified geographic region(1)
1 1
(b) mean = 137/5 = 27.4 in 10 000m2 (1) multiply by 1 000 000 / 10 000 = 100 (1) 27.4x100= 2740 (1) or Total = 137 in 50 000m2 (1) Multiply by 1 000 000 / 50 000 = 20 (1) 137x20= 2740 (1)
3 3 3
(c) Estimate is likely to be an underestimate, so decision may not be valid(1) Only surveyed a very small area of the reef and total reef area is very Large/ only surveyed 5 out of nearly 3000 reefs (1) Wide range in results (1) Only counted visible starfish (1)
4 4 4
Question 6 total 1 3 4 8 3 4

GCE AS and A LEVEL BIOLOGY Specimen Assessment Materials 157
© WJEC CBAC Ltd.
Question Marking details
Marks available
AO1 AO2 AO3 Total Maths Prac
7 Indicative content Cardiac muscle is myogenic and can contract without external stimulation. Structure A is the sino-atrial node, that acts as a natural pacemaker to control the rate of contraction. It does this by generating an electrical impulse that is transmitted across the atria. As the impulse travels across the atria it causes them to contract more or less simultaneously forcing the atrio-ventricular valves to open and to move blood into the ventricles. After 0.045s the impulse arrives at structure B which is the atrio ventricular node. There is a layer of connective tissue between the atria and the ventricles that prevents the impulse from travelling directly to the ventricles. There is a delay of 0.12s between the impulse arriving and leaving the AVN. This allows the atria to contract completely and the ventricles to fill with blood before they contract. It takes 0.04s for the impulse to be transmitted down the Bundle of His/ Purkinje fibres to structure C, the base of the ventricles and then another 0.04s to be transmitted to structure D the top of the ventricles. This causes the ventricles to contract from the base upwards to ensure that blood is forced upwards into the arteries. At the same time this closes the atrioventricular valves to ensure the blood flows in only one direction through the heart.
3 6 9
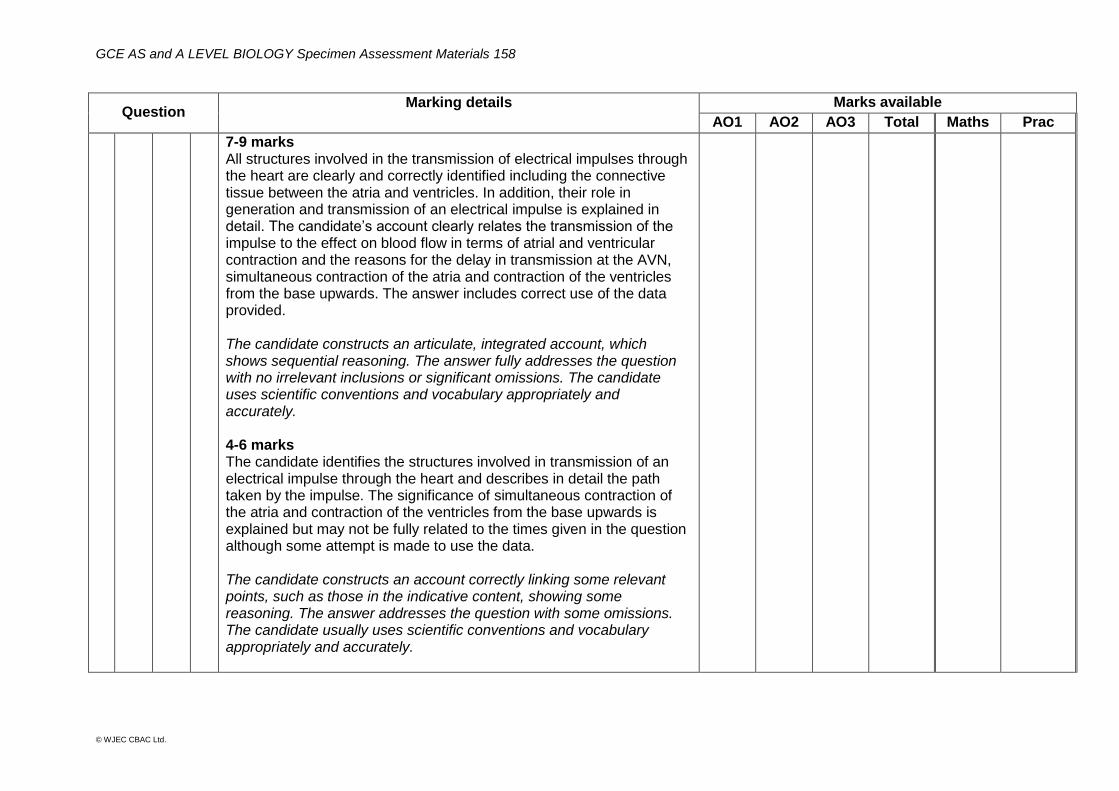
GCE AS and A LEVEL BIOLOGY Specimen Assessment Materials 158
© WJEC CBAC Ltd.
Question Marking details
Marks available
AO1 AO2 AO3 Total Maths Prac
7-9 marks All structures involved in the transmission of electrical impulses through the heart are clearly and correctly identified including the connective tissue between the atria and ventricles. In addition, their role in generation and transmission of an electrical impulse is explained in detail. The candidate’s account clearly relates the transmission of the impulse to the effect on blood flow in terms of atrial and ventricular contraction and the reasons for the delay in transmission at the AVN, simultaneous contraction of the atria and contraction of the ventricles from the base upwards. The answer includes correct use of the data provided. The candidate constructs an articulate, integrated account, which shows sequential reasoning. The answer fully addresses the question with no irrelevant inclusions or significant omissions. The candidate uses scientific conventions and vocabulary appropriately and accurately. 4-6 marks The candidate identifies the structures involved in transmission of an electrical impulse through the heart and describes in detail the path taken by the impulse. The significance of simultaneous contraction of the atria and contraction of the ventricles from the base upwards is explained but may not be fully related to the times given in the question although some attempt is made to use the data. The candidate constructs an account correctly linking some relevant points, such as those in the indicative content, showing some reasoning. The answer addresses the question with some omissions. The candidate usually uses scientific conventions and vocabulary appropriately and accurately.

GCE AS and A LEVEL BIOLOGY Specimen Assessment Materials 159
© WJEC CBAC Ltd.
Question Marking details
Marks available
AO1 AO2 AO3 Total Maths Prac
1-3 marks Structures A to D are identified correctly and some attempt is made at describing their role in the transmission of an electrical impulse through the heart. Some indication is made as to how blood flows through the atria and ventricles but little or no use is made of the data to explain the significance of the delay at the AVN or the reasons for simultaneous contraction of the atria and / or contraction of the ventricles from the base upwards. The candidate makes some relevant points, such as those in the indicative content, showing limited reasoning. The answer addresses the question with significant omissions. The candidate has limited use of scientific conventions and vocabulary. 0 marks The candidate does not make any attempt or give a relevant answer worthy of credit.
Question 7 total 3 6 0 9 0 0
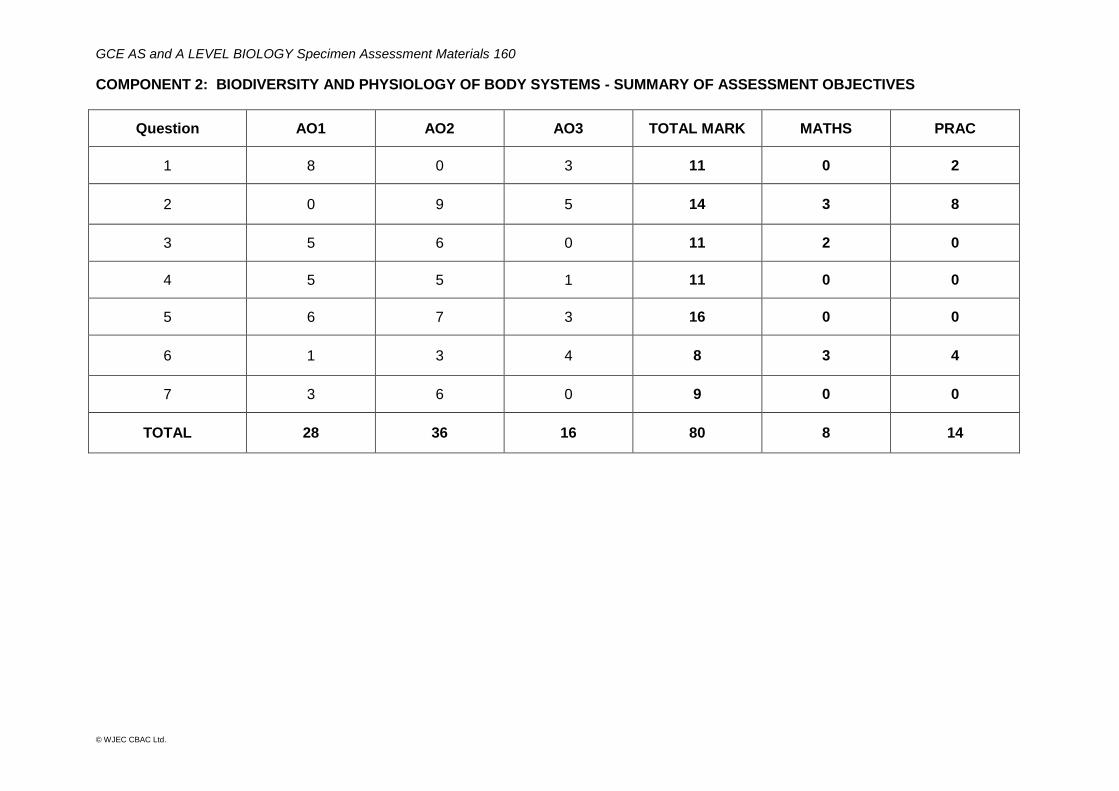
GCE AS and A LEVEL BIOLOGY Specimen Assessment Materials 160
© WJEC CBAC Ltd.
COMPONENT 2: BIODIVERSITY AND PHYSIOLOGY OF BODY SYSTEMS - SUMMARY OF ASSESSMENT OBJECTIVES
Question AO1 AO2 AO3 TOTAL MARK MATHS PRAC
1 8 0 3 11 0 2
2 0 9 5 14 3 8
3 5 6 0 11 2 0
4 5 5 1 11 0 0
5 6 7 3 16 0 0
6 1 3 4 8 3 4
7 3 6 0 9 0 0
TOTAL 28 36 16 80 8 14

GCE AS and A LEVEL BIOLOGY Specimen Assessment Materials 161
© WJEC CBAC Ltd.
UNIT 3 – ENERGY, HOMEOSTASIS AND THE ENVIRONMENT
MARK SCHEME
GENERAL INSTRUCTIONS Recording of marks
Examiners must mark in red ink.
One tick must equate to one mark.
Question totals should be written in the box at the end of the question.
Question totals should be entered onto the grid on the front cover and these should be added to give the script total for each candidate.
Marking rules
All work should be seen to have been marked.
Marking schemes will indicate when explicit working is deemed to be a necessary part of a correct answer.
Crossed out responses not replaced should be marked.
Credit will be given for correct relevant alternative responses which are not recorded in the mark scheme.
Extended response question A level of response mark scheme is used. Before applying the mark scheme please read through the whole answer from start to finish. Firstly, decide which level descriptor matches best with the candidate’s response: remember that you should be considering the overall quality of the response. Then decide which mark to award within the level. Award the higher mark in the level if there is a good match with both the content statements and the communication statement. Award the middle mark in the level if most of the content statements are given and the communication statement is partially met. Award the lower mark if only the content statements are matched.

GCE AS and A LEVEL BIOLOGY Specimen Assessment Materials 162
© WJEC CBAC Ltd.
Marking abbreviations
The following may be used in marking schemes or in the marking of scripts to indicate reasons for the marks awarded.
cao = correct answer only
ecf = error carried forward
bod = benefit of doubt
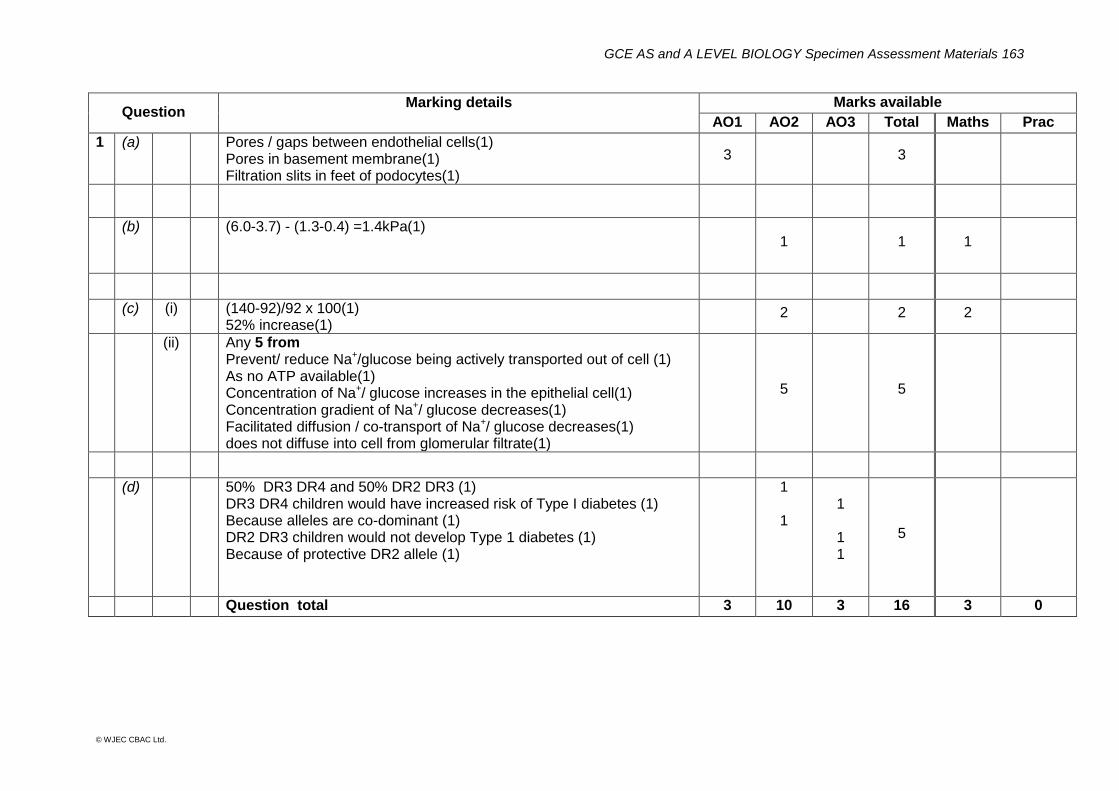
GCE AS and A LEVEL BIOLOGY Specimen Assessment Materials 163
© WJEC CBAC Ltd.
Question Marking details
Marks available
AO1 AO2 AO3 Total Maths Prac
1 (a) Pores / gaps between endothelial cells(1) Pores in basement membrane(1) Filtration slits in feet of podocytes(1)
3 3
(b) (6.0-3.7) - (1.3-0.4) =1.4kPa(1) 1 1 1
(c) (i) (140-92)/92 x 100(1) 52% increase(1)
2 2 2
(ii) Any 5 from Prevent/ reduce Na+/glucose being actively transported out of cell (1) As no ATP available(1) Concentration of Na+/ glucose increases in the epithelial cell(1) Concentration gradient of Na+/ glucose decreases(1) Facilitated diffusion / co-transport of Na+/ glucose decreases(1) does not diffuse into cell from glomerular filtrate(1)
5 5
(d) 50% DR3 DR4 and 50% DR2 DR3 (1) DR3 DR4 children would have increased risk of Type I diabetes (1) Because alleles are co-dominant (1) DR2 DR3 children would not develop Type 1 diabetes (1) Because of protective DR2 allele (1)
1
1
1 1 1
5
Question total 3 10 3 16 3 0
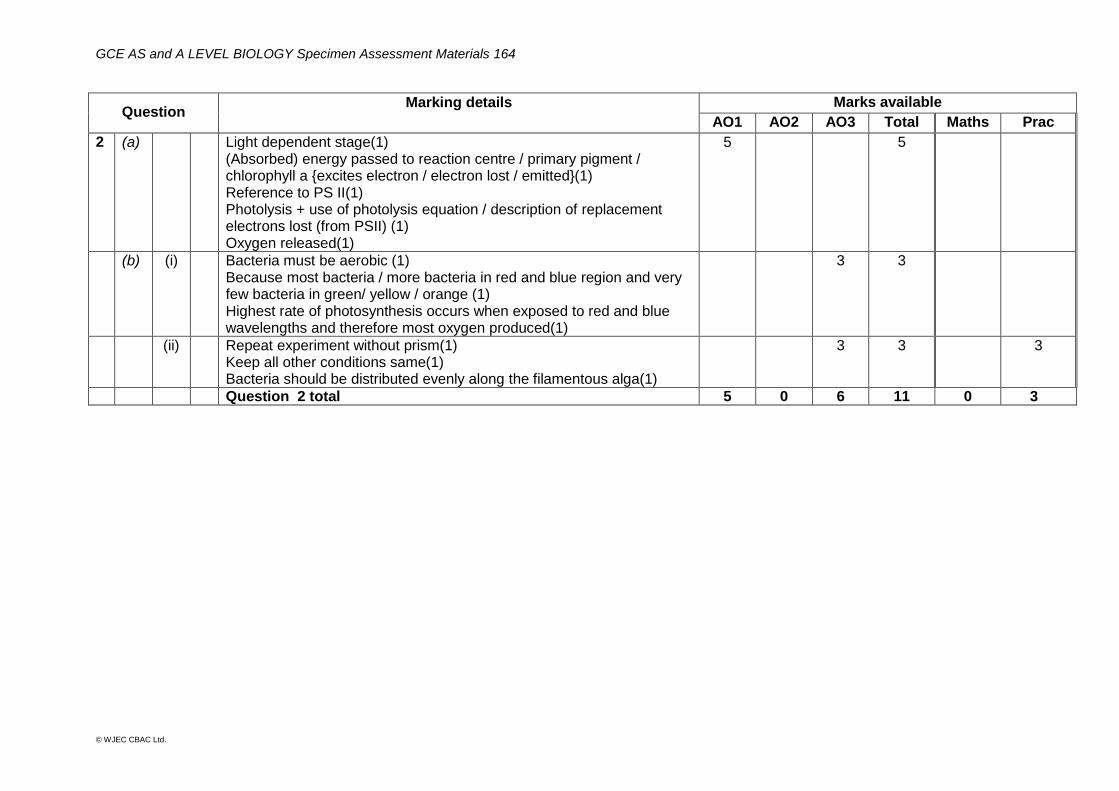
GCE AS and A LEVEL BIOLOGY Specimen Assessment Materials 164
© WJEC CBAC Ltd.
Question Marking details
Marks available
AO1 AO2 AO3 Total Maths Prac
2 (a) Light dependent stage(1) (Absorbed) energy passed to reaction centre / primary pigment / chlorophyll a {excites electron / electron lost / emitted}(1) Reference to PS II(1) Photolysis + use of photolysis equation / description of replacement electrons lost (from PSII) (1) Oxygen released(1)
5 5
(b) (i) Bacteria must be aerobic (1) Because most bacteria / more bacteria in red and blue region and very few bacteria in green/ yellow / orange (1) Highest rate of photosynthesis occurs when exposed to red and blue wavelengths and therefore most oxygen produced(1)
3 3
(ii) Repeat experiment without prism(1) Keep all other conditions same(1) Bacteria should be distributed evenly along the filamentous alga(1)
3 3 3
Question 2 total 5 0 6 11 0 3

GCE AS and A LEVEL BIOLOGY Specimen Assessment Materials 165
© WJEC CBAC Ltd.
Question Marking details
Marks available
AO1 AO2 AO3 Total Maths Prac
3 (a) (i) Mix well and transfer 1cm3 into 9 cm3 of water/ medium(1) To give a 1 in 10 dilution(1) Repeat to give a series of dilutions(1) Too many bacteria to count in original sample / colonies touch each other/ confluent(1)
4 4 4
(ii) 85 x 10 000 x 20(1) 17 000000 (1) 1.7 X 10⁷(1)
3 3 3
(iii) Viable count indication of number of live bacteria + Total live and dead(1)
1 1
(b) In phase B (nearly) all cells are viable(1) Any 2 from Phase A : slow cell division would result in the slow production of a viable culture(1) Phase C : slow cell division/ many non-viable cells + Phase D: most cells are dying/ non-viable(1)
3 3
Question total 5 3 3 11 3 4
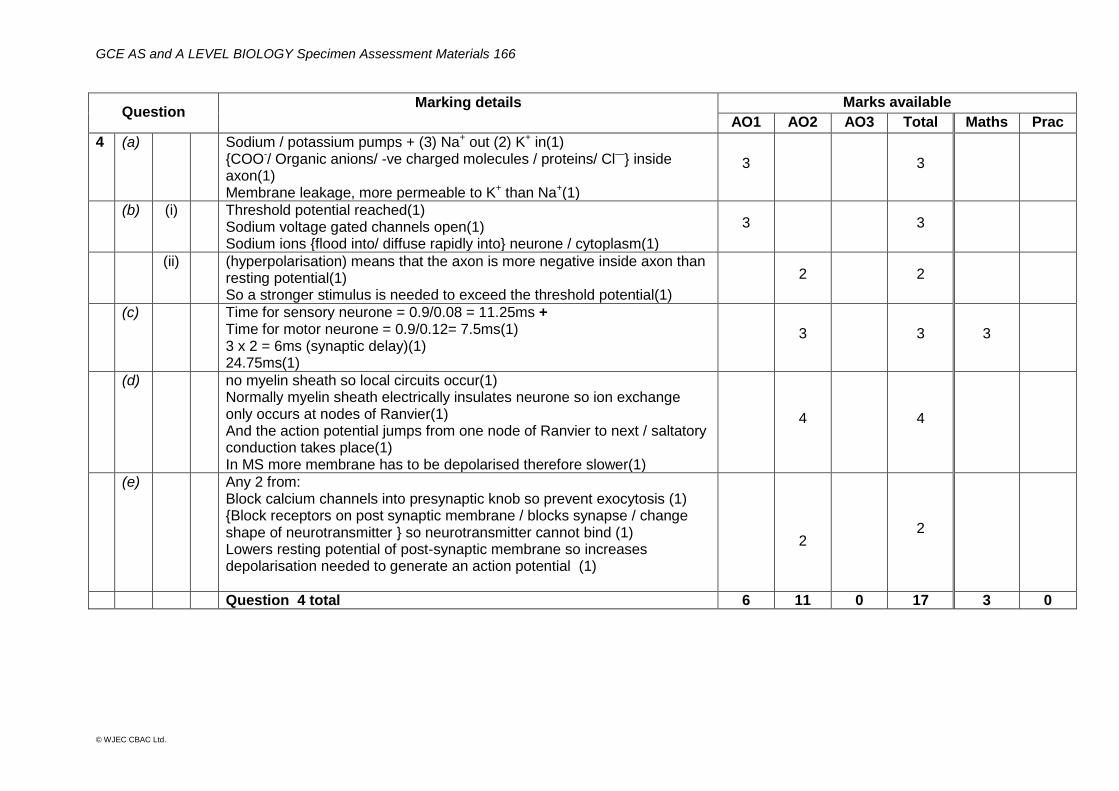
GCE AS and A LEVEL BIOLOGY Specimen Assessment Materials 166
© WJEC CBAC Ltd.
Question Marking details
Marks available
AO1 AO2 AO3 Total Maths Prac
4 (a) Sodium / potassium pumps + (3) Na+ out (2) K+ in(1) {COO-/ Organic anions/ -ve charged molecules / proteins/ Cl—} inside axon(1) Membrane leakage, more permeable to K+ than Na+(1)
3 3
(b) (i) Threshold potential reached(1) Sodium voltage gated channels open(1) Sodium ions {flood into/ diffuse rapidly into} neurone / cytoplasm(1)
3 3
(ii) (hyperpolarisation) means that the axon is more negative inside axon than resting potential(1) So a stronger stimulus is needed to exceed the threshold potential(1)
2 2
(c) Time for sensory neurone = 0.9/0.08 = 11.25ms + Time for motor neurone = 0.9/0.12= 7.5ms(1) 3 x 2 = 6ms (synaptic delay)(1) 24.75ms(1)
3 3 3
(d) no myelin sheath so local circuits occur(1) Normally myelin sheath electrically insulates neurone so ion exchange only occurs at nodes of Ranvier(1) And the action potential jumps from one node of Ranvier to next / saltatory conduction takes place(1) In MS more membrane has to be depolarised therefore slower(1)
4 4
(e)
Any 2 from: Block calcium channels into presynaptic knob so prevent exocytosis (1) {Block receptors on post synaptic membrane / blocks synapse / change shape of neurotransmitter } so neurotransmitter cannot bind (1) Lowers resting potential of post-synaptic membrane so increases depolarisation needed to generate an action potential (1)
2 2
Question 4 total 6 11 0 17 3 0

GCE AS and A LEVEL BIOLOGY Specimen Assessment Materials 167
© WJEC CBAC Ltd.
Question Marking details
Marks available
AO1 AO2 AO3 Total Maths Prac
5 (a) Any 2 from: No need to buy fertilisers(1) Ash provides a source of plant nutrients therefore increases soil fertility(1) Increase yield from food crops (1)
2 2
(b) Increased growth of crops(to meet increased demand for food) removes more minerals from soil(1) Crops are removed so do not decompose to replace minerals in the soil(1) So soil minerals are depleted/ soil becomes less fertile(1)
3 3
(c) Statement not completely valid as only plantation/ monoculture results in almost complete destruction(1) No shrubs, climbers or epiphytes and 60% less herbaceous plants / 154% less trees (use of data to exemplify effect on biodiversity)(1) Traditional agroforest decreases overall number of species(1) But does reduce biodiversity(1) Approx. 47% decrease in epiphytes/ 45% decrease in trees/ 22% shrubs/ 100% increase in herbaceous plants/ no change in climbers(use of data)(1)
5 5
Question 5 total 0 5 5 10 0 0
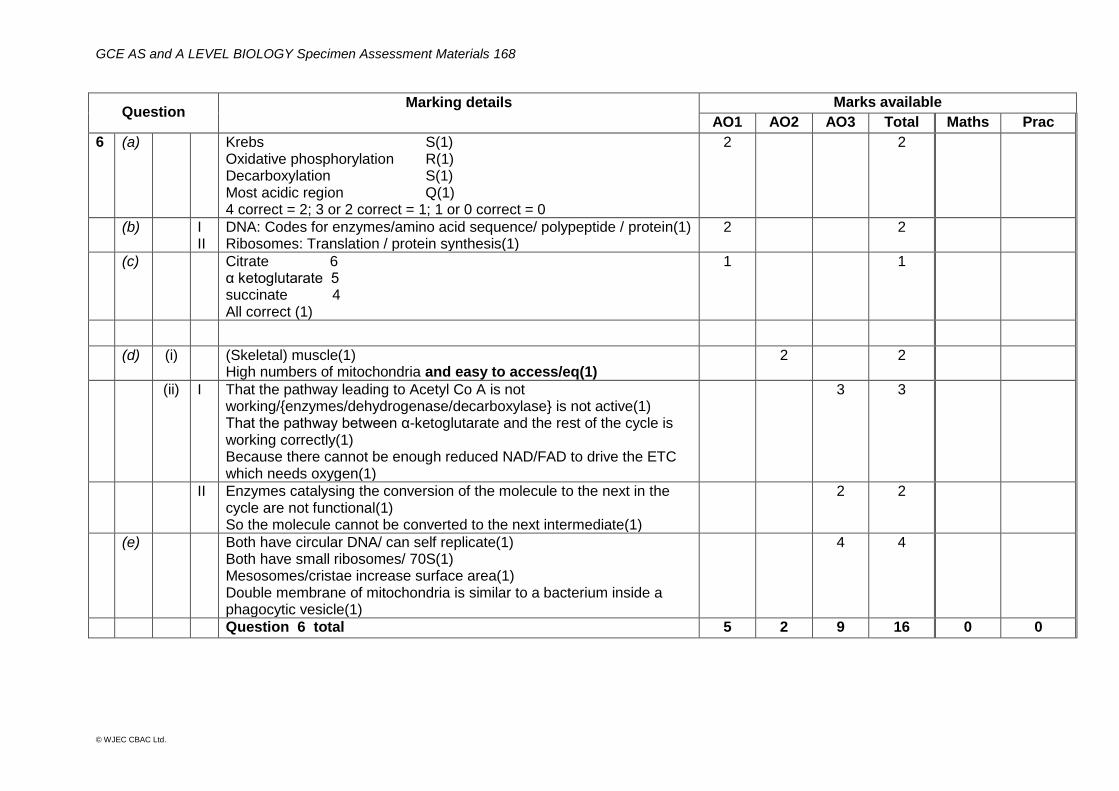
GCE AS and A LEVEL BIOLOGY Specimen Assessment Materials 168
© WJEC CBAC Ltd.
Question Marking details
Marks available
AO1 AO2 AO3 Total Maths Prac
6 (a) Krebs S(1) Oxidative phosphorylation R(1) Decarboxylation S(1) Most acidic region Q(1) 4 correct = 2; 3 or 2 correct = 1; 1 or 0 correct = 0
2 2
(b) I II
DNA: Codes for enzymes/amino acid sequence/ polypeptide / protein(1) Ribosomes: Translation / protein synthesis(1)
2 2
(c) Citrate 6 α ketoglutarate 5 succinate 4 All correct (1)
1 1
(d) (i) (Skeletal) muscle(1) High numbers of mitochondria and easy to access/eq(1)
2 2
(ii) I That the pathway leading to Acetyl Co A is not working/{enzymes/dehydrogenase/decarboxylase} is not active(1) That the pathway between α-ketoglutarate and the rest of the cycle is working correctly(1) Because there cannot be enough reduced NAD/FAD to drive the ETC which needs oxygen(1)
3 3
II Enzymes catalysing the conversion of the molecule to the next in the cycle are not functional(1) So the molecule cannot be converted to the next intermediate(1)
2 2
(e) Both have circular DNA/ can self replicate(1) Both have small ribosomes/ 70S(1) Mesosomes/cristae increase surface area(1) Double membrane of mitochondria is similar to a bacterium inside a phagocytic vesicle(1)
4 4
Question 6 total 5 2 9 16 0 0

GCE AS and A LEVEL BIOLOGY Specimen Assessment Materials 169
© WJEC CBAC Ltd.
Question Marking details
Marks available
AO1 AO2 AO3 Total Maths Prac
7
Indicative content The increasing human population is increasing the use of fossil fuels and resulting in our exceeding the boundary for CO2. As this is an indicator of climate change, unless CO2 levels are reduced to below the boundary, there will be significant changes to the climate due to global warming. This will affect weather patterns and the loss of habitat. This is already having an effect on biodiversity as the extinction rate is already ten to hundred times higher than the boundary. The loss of species could result in a loss of useful genes and unknown species that could be potential sources of food or have medical/ industrial uses. In addition, the increased demand for food is resulting in a large increase in percentage of the Earth’s surface used for food production. However, we have not as yet exceeded the planetary boundary but we can only use a further 3% of the Earth’s surface before the boundary is exceeded. Deforestation to provide more land for food production is contributing to both an increase in atmospheric CO2 (due to a decrease in photosynthesis) and a decrease in biodiversity. The use of nitrogen for fertilisers has exceeded the planetary boundary by 85 million tonnes per year. While this has enabled humans to increase food production without exceeding the planetary boundary for land use, it is likely that much of the nitrogenous fertiliser will have been washed into waterways and caused eutrophication.
9
9
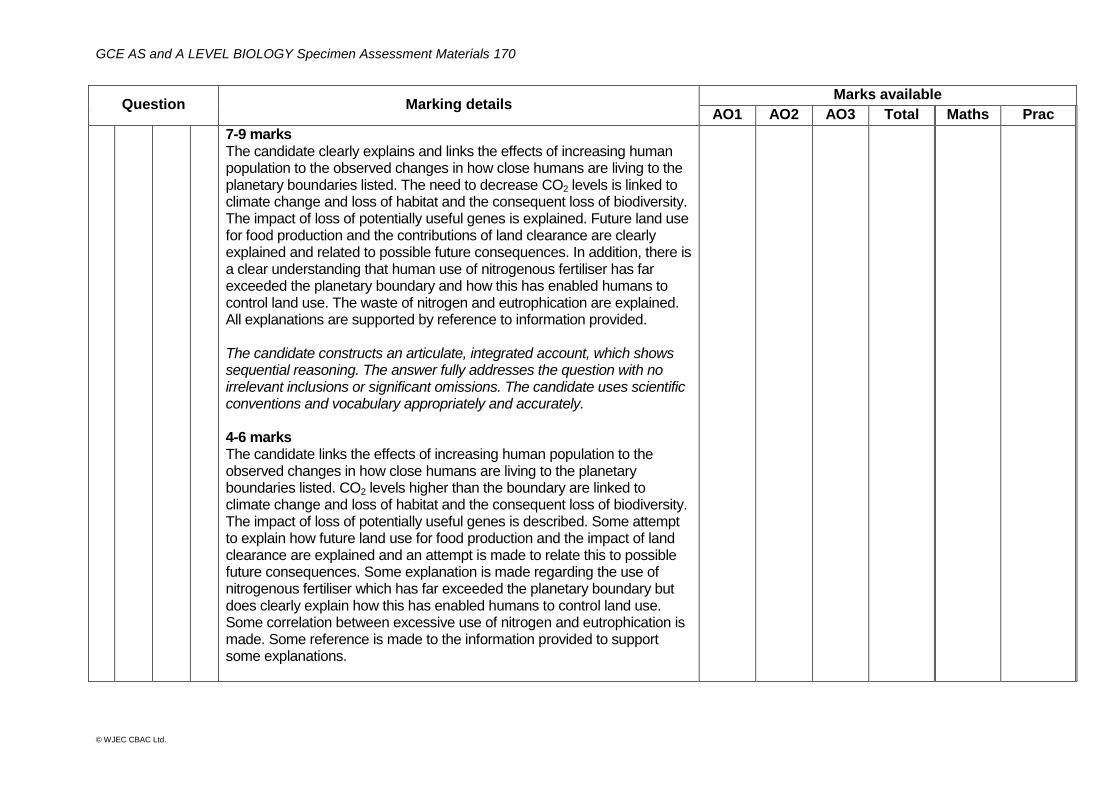
GCE AS and A LEVEL BIOLOGY Specimen Assessment Materials 170
© WJEC CBAC Ltd.
Question Marking details Marks available
AO1 AO2 AO3 Total Maths Prac
7-9 marks The candidate clearly explains and links the effects of increasing human population to the observed changes in how close humans are living to the planetary boundaries listed. The need to decrease CO2 levels is linked to climate change and loss of habitat and the consequent loss of biodiversity. The impact of loss of potentially useful genes is explained. Future land use for food production and the contributions of land clearance are clearly explained and related to possible future consequences. In addition, there is a clear understanding that human use of nitrogenous fertiliser has far exceeded the planetary boundary and how this has enabled humans to control land use. The waste of nitrogen and eutrophication are explained. All explanations are supported by reference to information provided. The candidate constructs an articulate, integrated account, which shows sequential reasoning. The answer fully addresses the question with no irrelevant inclusions or significant omissions. The candidate uses scientific conventions and vocabulary appropriately and accurately. 4-6 marks The candidate links the effects of increasing human population to the observed changes in how close humans are living to the planetary boundaries listed. CO2 levels higher than the boundary are linked to climate change and loss of habitat and the consequent loss of biodiversity. The impact of loss of potentially useful genes is described. Some attempt to explain how future land use for food production and the impact of land clearance are explained and an attempt is made to relate this to possible future consequences. Some explanation is made regarding the use of nitrogenous fertiliser which has far exceeded the planetary boundary but does clearly explain how this has enabled humans to control land use. Some correlation between excessive use of nitrogen and eutrophication is made. Some reference is made to the information provided to support some explanations.

GCE AS and A LEVEL BIOLOGY Specimen Assessment Materials 171
© WJEC CBAC Ltd.
The candidate constructs an account correctly linking some relevant points, such as those in the indicative content, showing some reasoning. The answer addresses the question with some omissions. The candidate usually uses scientific conventions and vocabulary appropriately and accurately. 1-3 marks The candidate links some of the effects of increasing human population to the observed changes in how close humans are living to the planetary boundaries listed. A link is made between increasing CO2 levels and global warming and consequently climate change and loss of habitat. Some understanding of the impact of land use and the loss of biodiversity is conveyed. The impact of loss of potentially useful genes is described. There is no clear understanding of how humans need to control future land use for food production. A reference is made to the use of nitrogenous fertiliser but does explain how this has enabled humans to control land use. Limited reference is made to the information provided. The candidate makes some relevant points, such as those in the indicative content, showing limited reasoning. The answer addresses the question with significant omissions. The candidate has limited use of scientific conventions and vocabulary. 0 marks The candidate does not make any attempt or give a relevant answer worthy of credit.
Question 7 total 0 9 0 9 0 0

GCE AS and A LEVEL BIOLOGY Specimen Assessment Materials 172
© WJEC CBAC Ltd.
COMPONENT 3: ENERGY, HOMEOSTASIS AND THE ENVIRONMENT - SUMMARY OF ASSESSMENT OBJECTIVES
Question AO1 AO2 AO3 TOTAL MARK MATHS PRAC
1 3 10 3 16 3 0
2 5 0 6 11 0 3
3 5 3 3 11 3 4
4 6 11 0 17 3 0
5 0 5 5 10 0 0
6 5 2 9 16 0 1
7 0 9 0 9 0 0
TOTAL 24 40 26 90 9 8
GCE AS and A LEVEL BIOLOGY Specimen Assessment Materials 173
© WJEC CBAC Ltd.
UNIT 4 – VARIATION, INHERITANCE AND OPTIONS
MARK SCHEME
GENERAL INSTRUCTIONS Recording of marks
Examiners must mark in red ink.
One tick must equate to one mark.
Question totals should be written in the box at the end of the question.
Question totals should be entered onto the grid on the front cover and these should be added to give the script total for each candidate.
Marking rules
All work should be seen to have been marked.
Marking schemes will indicate when explicit working is deemed to be a necessary part of a correct answer.
Crossed out responses not replaced should be marked.
Credit will be given for correct relevant alternative responses which are not recorded in the mark scheme.
Extended response question A level of response mark scheme is used. Before applying the mark scheme please read through the whole answer from start to finish. Firstly, decide which level descriptor matches best with the candidate’s response: remember that you should be considering the overall quality of the response. Then decide which mark to award within the level. Award the higher mark in the level if there is a good match with both the content statements and the communication statement. Award the middle mark in the level if most of the content statements are given and the communication statement is partially met. Award the lower mark if only the content statements are matched.

GCE AS and A LEVEL BIOLOGY Specimen Assessment Materials 174
© WJEC CBAC Ltd.
Marking abbreviations
The following may be used in marking schemes or in the marking of scripts to indicate reasons for the marks awarded.
cao = correct answer only
ecf = error carried forward
bod = benefit of doubt
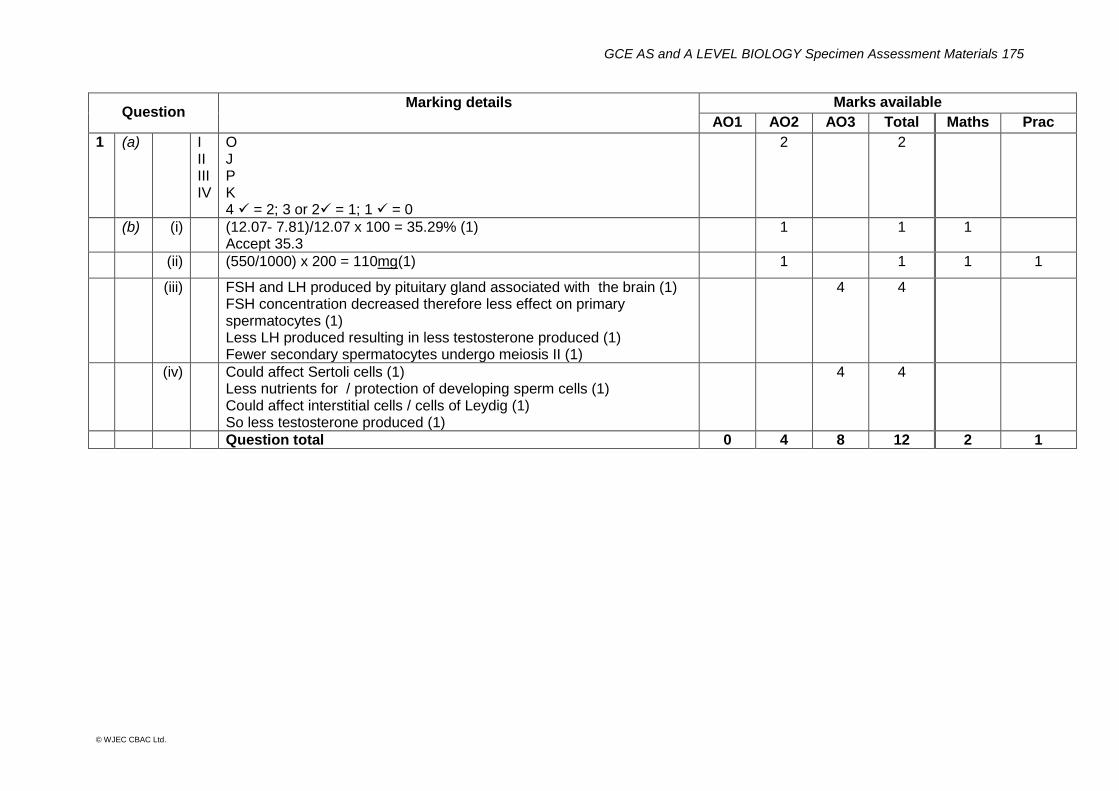
GCE AS and A LEVEL BIOLOGY Specimen Assessment Materials 175
© WJEC CBAC Ltd.
Question Marking details
Marks available
AO1 AO2 AO3 Total Maths Prac
1 (a) I II III IV
O J P K 4 = 2; 3 or 2 = 1; 1 = 0
2 2
(b) (i) (12.07- 7.81)/12.07 x 100 = 35.29% (1) Accept 35.3
1 1 1
(ii) (550/1000) x 200 = 110mg(1) 1 1 1 1
(iii) FSH and LH produced by pituitary gland associated with the brain (1) FSH concentration decreased therefore less effect on primary spermatocytes (1) Less LH produced resulting in less testosterone produced (1) Fewer secondary spermatocytes undergo meiosis II (1)
4 4
(iv) Could affect Sertoli cells (1) Less nutrients for / protection of developing sperm cells (1) Could affect interstitial cells / cells of Leydig (1) So less testosterone produced (1)
4 4
Question total 0 4 8 12 2 1

GCE AS and A LEVEL BIOLOGY Specimen Assessment Materials 176
© WJEC CBAC Ltd.
Question Marking details
Marks available
AO1 AO2 AO3 Total Maths Prac
2 (a) Pollen tube grows controlled by the pollen tube nucleus(1) Enzymes digest a path through the style to the micropyle(1) One male nucleus enters the embryo sac and fuses with the female gamete to form the zygote(1) Second male nucleus fuses with the two polar nuclei to form the primary endosperm nucleus(1)
4 4
(b) Insect-pollinated (1) Attracts insects: using faecal {odour / smell}/warmer temperature inside spadix (1) Insects prevented from leaving spadix by hairs (1) Cross-pollinated - separate male and female flowers (1) Cannot be self-pollinated as male flowers ripen after fertilisation has occurred(1)
5 5
(c) April,– highest light intensity and increasing temperature so neither limiting rate of photosynthesis (1) July – light intensity lowest while temperature high so light acting as limiting factor (1) November – light intensity increasing but temperature low so temperature acting as limiting factor (1)
3 3
Question total 4 0 8 12 0 0

GCE AS and A LEVEL BIOLOGY Specimen Assessment Materials 177
© WJEC CBAC Ltd.
Question Marking details
Marks available
AO1 AO2 AO3 Total Maths Prac
3 (a) (i) Change to the base sequence of a single gene (1)
1 1
(ii) Change to mRNA base sequence/ codons of mRNA are changed / different (1) Different tRNA / brings different amino acid (1) Primary structure / amino acid sequence different (1) Different variable groups on amino acids cause polypeptide to fold differently / form different tertiary structure / bonds formed between different amino acids (1)
4 4
(iii) NAD (accept FAD) (1) 1 1
(iv) Reduced NAD / FAD can act a hydrogen donor to the electron transport chain (1) 2 carbon molecule / acetate can enter the Krebs cycle (1)
1 1
(b) (i) restriction endonuclease (1)
1 1 1
(ii) Alu1 TaqI HaeIII all 3 = 2; 2 = 1; 1 or 0 = 0
2 2
(iii) lines at 17,38,40 and 55 (2) all 4 = 2; 3 or 2 = 1; 1 = 0
2 2 2
(iv) DNA fragments attracted to positive electrode due to negative charge on phosphate groups(1) Smaller fragments travel further as its easier to pass through pores in the gel(1)
2 2 0 2
Question total 9 5 0 14 0 5
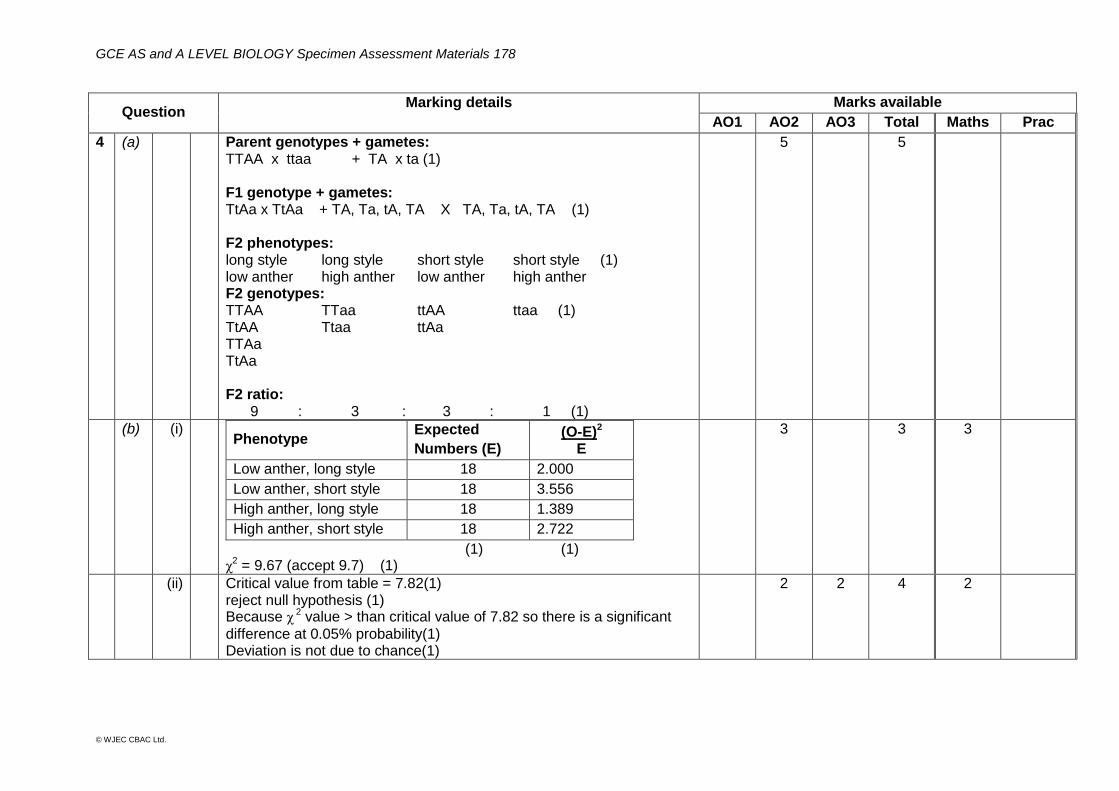
GCE AS and A LEVEL BIOLOGY Specimen Assessment Materials 178
© WJEC CBAC Ltd.
Question Marking details
Marks available
AO1 AO2 AO3 Total Maths Prac
4 (a) Parent genotypes + gametes: TTAA x ttaa + TA x ta (1) F1 genotype + gametes: TtAa x TtAa + TA, Ta, tA, TA X TA, Ta, tA, TA (1) F2 phenotypes: long style long style short style short style (1) low anther high anther low anther high anther F2 genotypes: TTAA TTaa ttAA ttaa (1) TtAA Ttaa ttAa TTAa TtAa F2 ratio: 9 : 3 : 3 : 1 (1)
5 5
(b) (i) Phenotype
Expected
Numbers (E) (O-E)2
E
Low anther, long style 18 2.000
Low anther, short style 18 3.556
High anther, long style 18 1.389
High anther, short style 18 2.722
(1) (1) χ
2 = 9.67 (accept 9.7) (1)
3 3 3
(ii) Critical value from table = 7.82(1) reject null hypothesis (1) Because χ 2 value > than critical value of 7.82 so there is a significant
difference at 0.05% probability(1) Deviation is not due to chance(1)
2 2 4 2
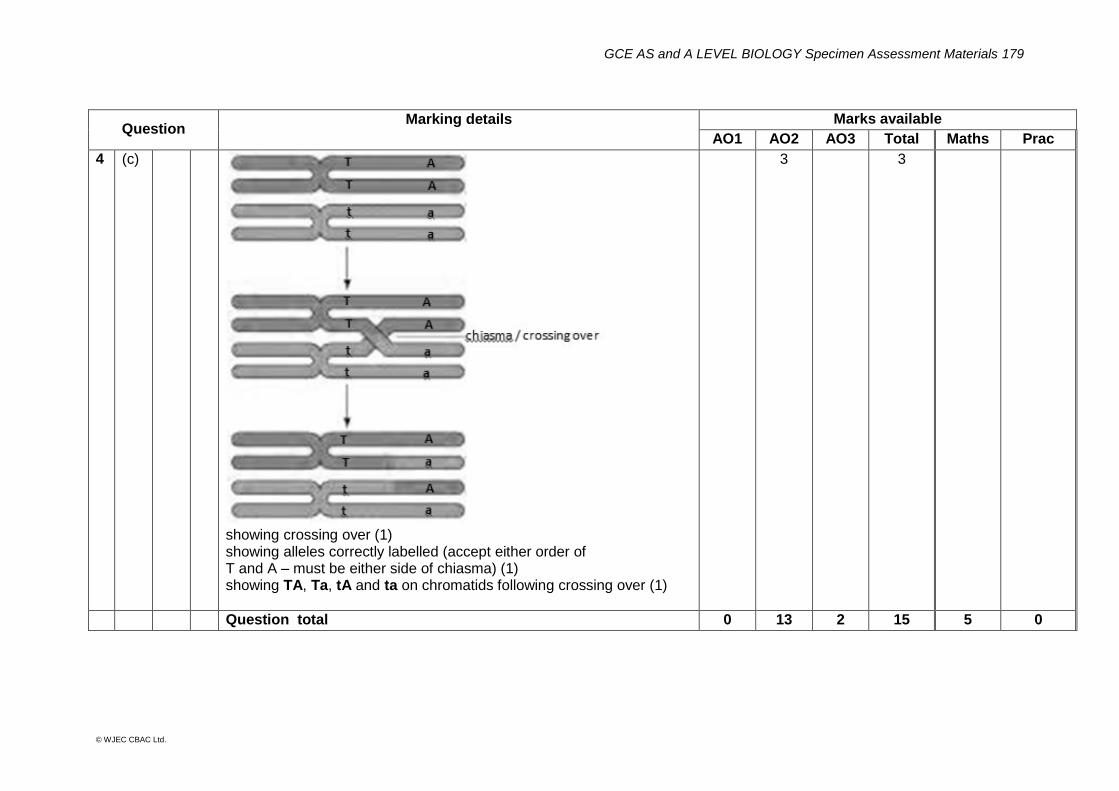
GCE AS and A LEVEL BIOLOGY Specimen Assessment Materials 179
© WJEC CBAC Ltd.
Question Marking details
Marks available
AO1 AO2 AO3 Total Maths Prac
4 (c)
showing crossing over (1) showing alleles correctly labelled (accept either order of T and A – must be either side of chiasma) (1) showing TA, Ta, tA and ta on chromatids following crossing over (1)
3 3
Question total 0 13 2 15 5 0
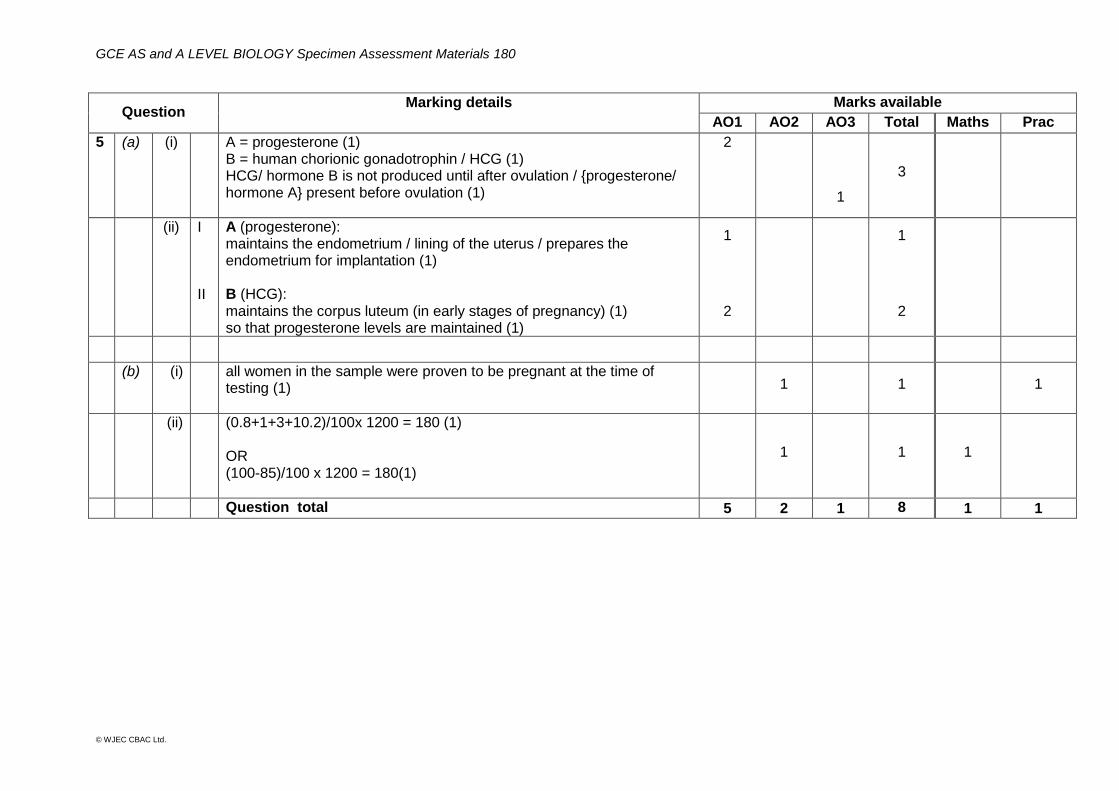
GCE AS and A LEVEL BIOLOGY Specimen Assessment Materials 180
© WJEC CBAC Ltd.
Question Marking details
Marks available
AO1 AO2 AO3 Total Maths Prac
5 (a) (i) A = progesterone (1) B = human chorionic gonadotrophin / HCG (1) HCG/ hormone B is not produced until after ovulation / {progesterone/ hormone A} present before ovulation (1)
2
1
3
(ii) I II
A (progesterone): maintains the endometrium / lining of the uterus / prepares the endometrium for implantation (1) B (HCG): maintains the corpus luteum (in early stages of pregnancy) (1) so that progesterone levels are maintained (1)
1
2
1
2
(b) (i) all women in the sample were proven to be pregnant at the time of testing (1)
1 1 1
(ii) (0.8+1+3+10.2)/100x 1200 = 180 (1) OR (100-85)/100 x 1200 = 180(1)
1 1 1
Question total 5 2 1 8 1 1
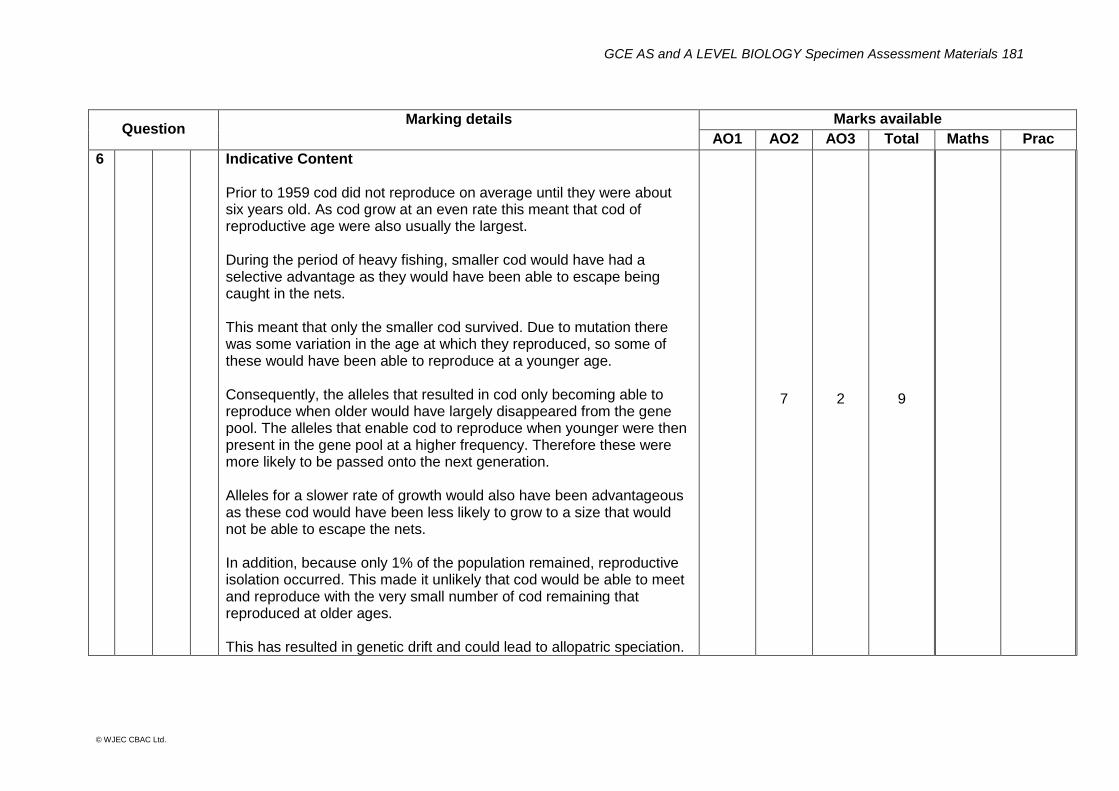
GCE AS and A LEVEL BIOLOGY Specimen Assessment Materials 181
© WJEC CBAC Ltd.
Question Marking details
Marks available
AO1 AO2 AO3 Total Maths Prac
6 Indicative Content Prior to 1959 cod did not reproduce on average until they were about six years old. As cod grow at an even rate this meant that cod of reproductive age were also usually the largest. During the period of heavy fishing, smaller cod would have had a selective advantage as they would have been able to escape being caught in the nets. This meant that only the smaller cod survived. Due to mutation there was some variation in the age at which they reproduced, so some of these would have been able to reproduce at a younger age. Consequently, the alleles that resulted in cod only becoming able to reproduce when older would have largely disappeared from the gene pool. The alleles that enable cod to reproduce when younger were then present in the gene pool at a higher frequency. Therefore these were more likely to be passed onto the next generation. Alleles for a slower rate of growth would also have been advantageous as these cod would have been less likely to grow to a size that would not be able to escape the nets. In addition, because only 1% of the population remained, reproductive isolation occurred. This made it unlikely that cod would be able to meet and reproduce with the very small number of cod remaining that reproduced at older ages. This has resulted in genetic drift and could lead to allopatric speciation.
7 2 9
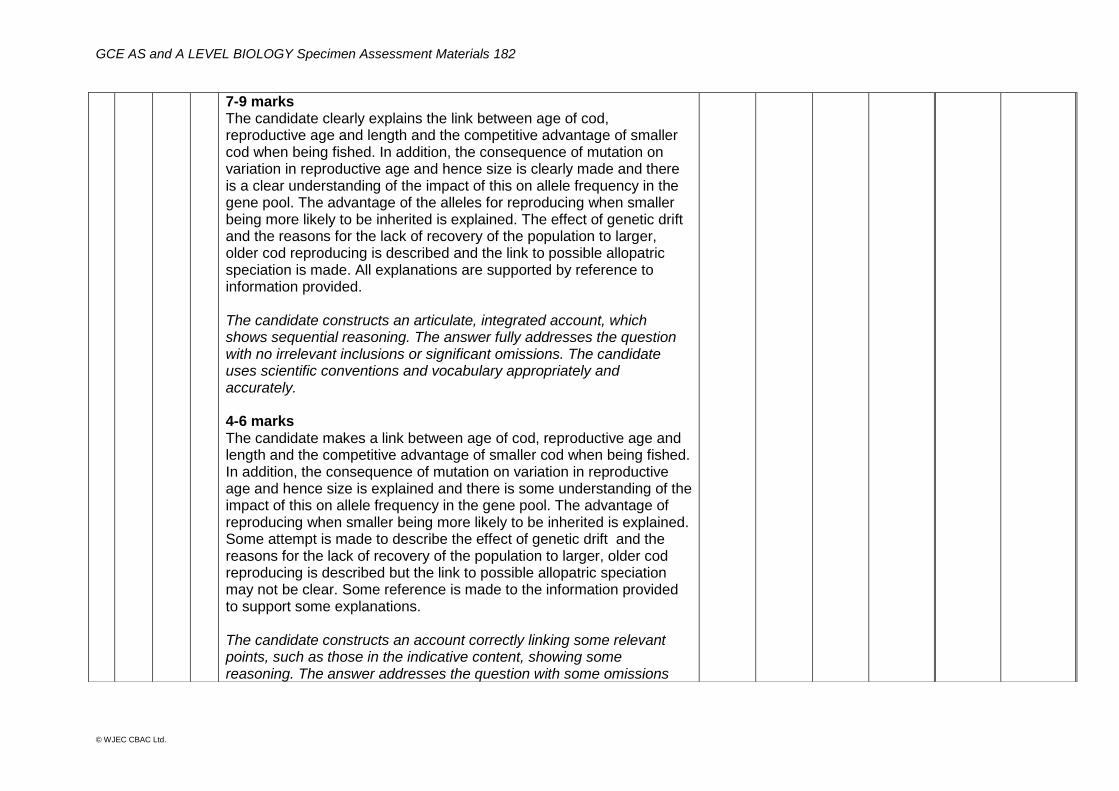
GCE AS and A LEVEL BIOLOGY Specimen Assessment Materials 182
© WJEC CBAC Ltd.
7-9 marks The candidate clearly explains the link between age of cod, reproductive age and length and the competitive advantage of smaller cod when being fished. In addition, the consequence of mutation on variation in reproductive age and hence size is clearly made and there is a clear understanding of the impact of this on allele frequency in the gene pool. The advantage of the alleles for reproducing when smaller being more likely to be inherited is explained. The effect of genetic drift and the reasons for the lack of recovery of the population to larger, older cod reproducing is described and the link to possible allopatric speciation is made. All explanations are supported by reference to information provided. The candidate constructs an articulate, integrated account, which shows sequential reasoning. The answer fully addresses the question with no irrelevant inclusions or significant omissions. The candidate uses scientific conventions and vocabulary appropriately and accurately. 4-6 marks The candidate makes a link between age of cod, reproductive age and length and the competitive advantage of smaller cod when being fished. In addition, the consequence of mutation on variation in reproductive age and hence size is explained and there is some understanding of the impact of this on allele frequency in the gene pool. The advantage of reproducing when smaller being more likely to be inherited is explained. Some attempt is made to describe the effect of genetic drift and the reasons for the lack of recovery of the population to larger, older cod reproducing is described but the link to possible allopatric speciation may not be clear. Some reference is made to the information provided to support some explanations. The candidate constructs an account correctly linking some relevant points, such as those in the indicative content, showing some reasoning. The answer addresses the question with some omissions
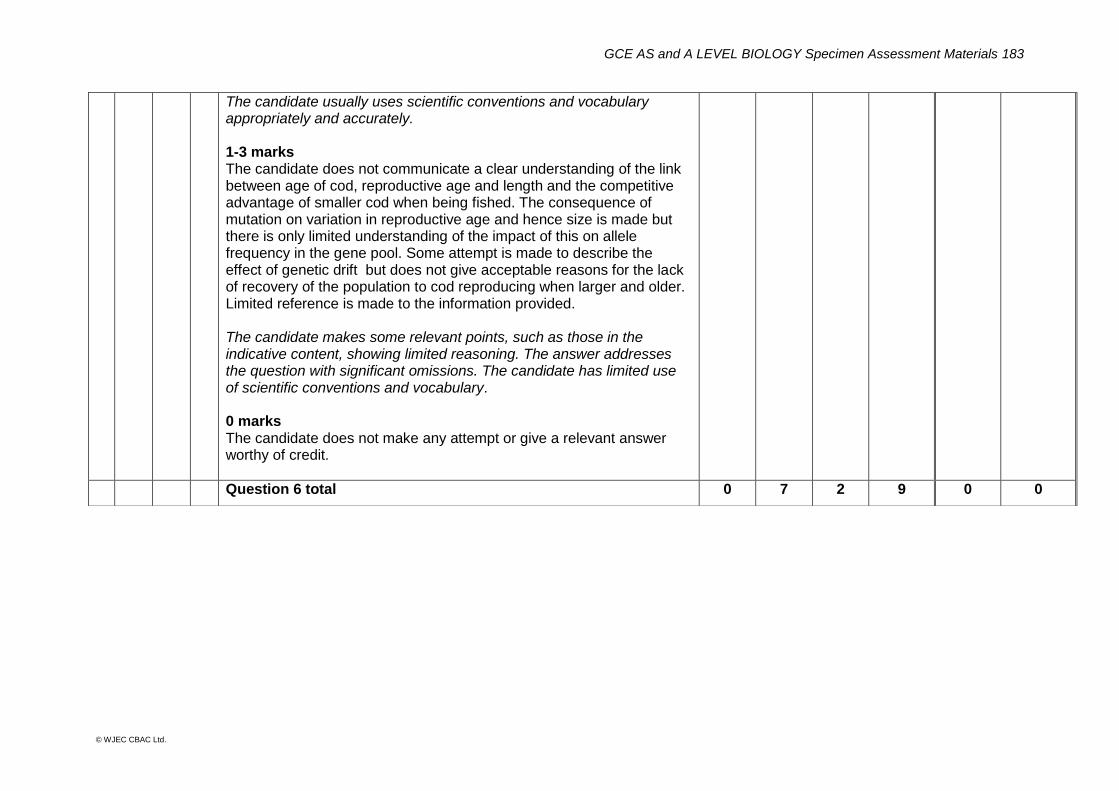
GCE AS and A LEVEL BIOLOGY Specimen Assessment Materials 183
© WJEC CBAC Ltd.
The candidate usually uses scientific conventions and vocabulary appropriately and accurately. 1-3 marks The candidate does not communicate a clear understanding of the link between age of cod, reproductive age and length and the competitive advantage of smaller cod when being fished. The consequence of mutation on variation in reproductive age and hence size is made but there is only limited understanding of the impact of this on allele frequency in the gene pool. Some attempt is made to describe the effect of genetic drift but does not give acceptable reasons for the lack of recovery of the population to cod reproducing when larger and older. Limited reference is made to the information provided. The candidate makes some relevant points, such as those in the indicative content, showing limited reasoning. The answer addresses the question with significant omissions. The candidate has limited use of scientific conventions and vocabulary. 0 marks The candidate does not make any attempt or give a relevant answer worthy of credit.
Question 6 total 0 7 2 9 0 0
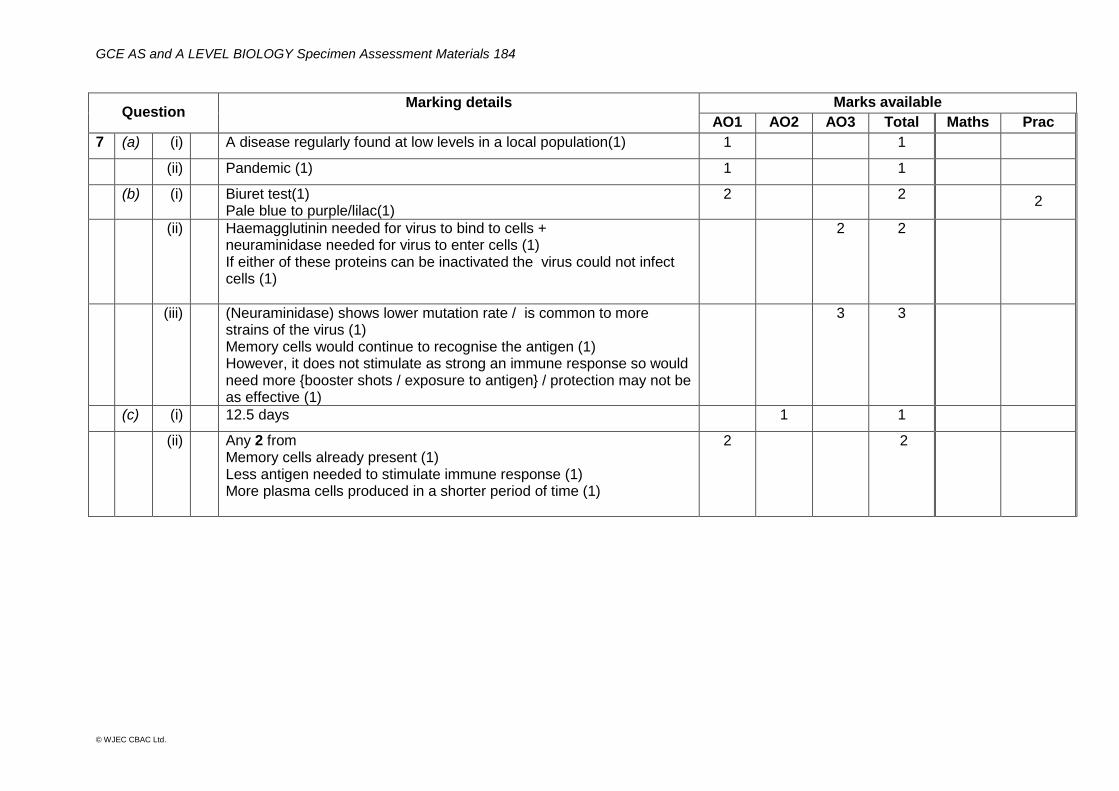
GCE AS and A LEVEL BIOLOGY Specimen Assessment Materials 184
© WJEC CBAC Ltd.
Question Marking details
Marks available
AO1 AO2 AO3 Total Maths Prac
7 (a) (i) A disease regularly found at low levels in a local population(1) 1 1
(ii) Pandemic (1) 1 1
(b) (i) Biuret test(1) Pale blue to purple/lilac(1)
2 2 2
(ii) Haemagglutinin needed for virus to bind to cells + neuraminidase needed for virus to enter cells (1) If either of these proteins can be inactivated the virus could not infect cells (1)
2 2
(iii) (Neuraminidase) shows lower mutation rate / is common to more strains of the virus (1) Memory cells would continue to recognise the antigen (1) However, it does not stimulate as strong an immune response so would need more {booster shots / exposure to antigen} / protection may not be as effective (1)
3 3
(c) (i) 12.5 days 1 1
(ii) Any 2 from Memory cells already present (1) Less antigen needed to stimulate immune response (1) More plasma cells produced in a shorter period of time (1)
2 2
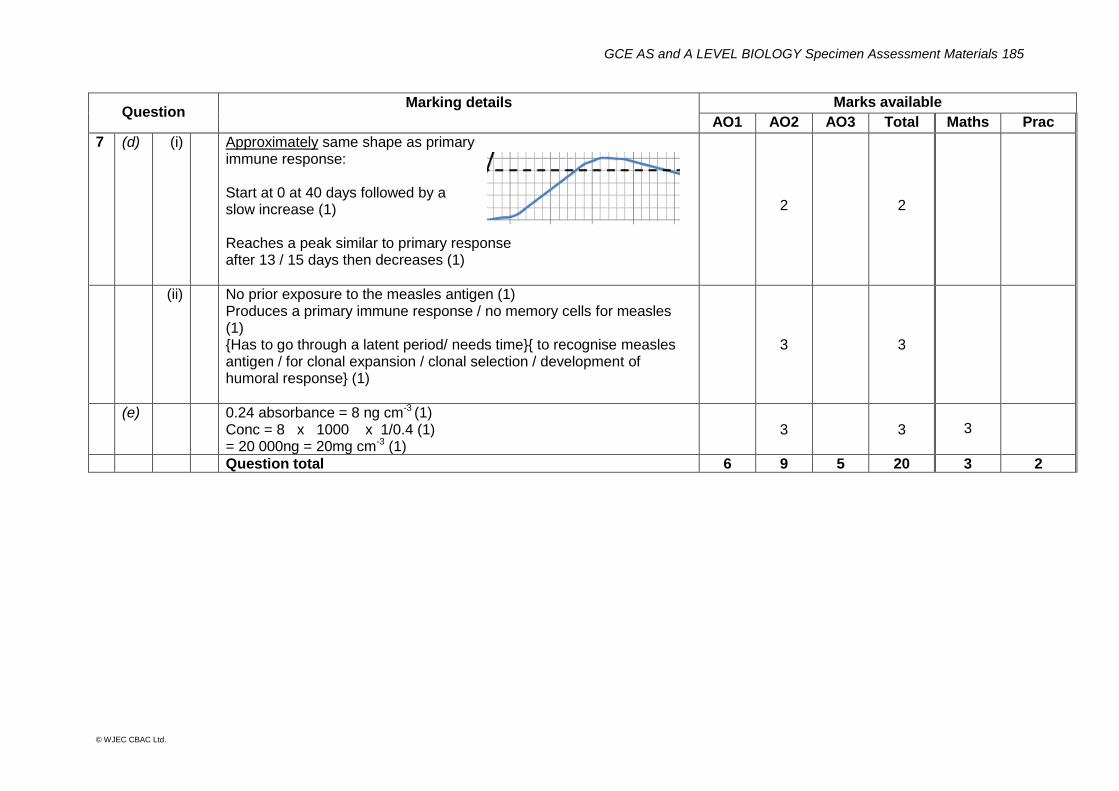
GCE AS and A LEVEL BIOLOGY Specimen Assessment Materials 185
© WJEC CBAC Ltd.
Question Marking details
Marks available
AO1 AO2 AO3 Total Maths Prac
7 (d) (i)
Approximately same shape as primary immune response: Start at 0 at 40 days followed by a slow increase (1) Reaches a peak similar to primary response after 13 / 15 days then decreases (1)
2 2
(ii) No prior exposure to the measles antigen (1) Produces a primary immune response / no memory cells for measles (1) {Has to go through a latent period/ needs time}{ to recognise measles antigen / for clonal expansion / clonal selection / development of humoral response} (1)
3 3
(e) 0.24 absorbance = 8 ng cm-3 (1) Conc = 8 x 1000 x 1/0.4 (1) = 20 000ng = 20mg cm-3 (1)
3 3 3
Question total 6 9 5 20 3 2

GCE AS and A LEVEL BIOLOGY Specimen Assessment Materials 186
© WJEC CBAC Ltd.
Question Marking details
Marks available
AO1 AO2 AO3 Total Maths Prac
8 (a) (i) Osteoblasts secrete matrix and Osteoclasts break matrix down. (1)
1 1
(ii) Any two for one mark Artery, vein, lymph vessel (1)
1 1
(iii) Cervical vertebra = B (1) vertebrarterial canals to protect blood vessels going to the brain {reduced / small} {neural spine / transverse processes} because of reduced muscle attachment / increase range of neck movement (1)
2 2
(b) Rickets caused by a lack of vitamin D/ calcium(1) Reduced dairy intake means less calcium in diet(1) Less outdoor play means less exposure to UV(1) Therefore less vitamin D synthesised(1) Vitamin D needed for calcium absorption(1)
5 5
(c) (i) A = Myosin B = Actin
2 2
(ii) transverse section (1) 1 1 1
(iii) only small circles drawn and labelled actin/A (1) 1 1 1
(d) length of myosin = 1.85-0.25 =1.65μm(1) convert to nanometres = 1.65 x 1000 = 1600nm(1) calculate number of myosin heads = 1600/40 x 6 = 240(1)
3 3 3
(e) (Low calcium) so fewer presynaptic vesicles fuse with presynaptic membrane(1) Less neurotransmitter secreted into synaptic cleft(1) Less troponin activated(1) Less tropomyosin changes shape(1) So fewer myosin-actin cross bridges form(1)
4 4
Question total 6 9 5 20 3 2
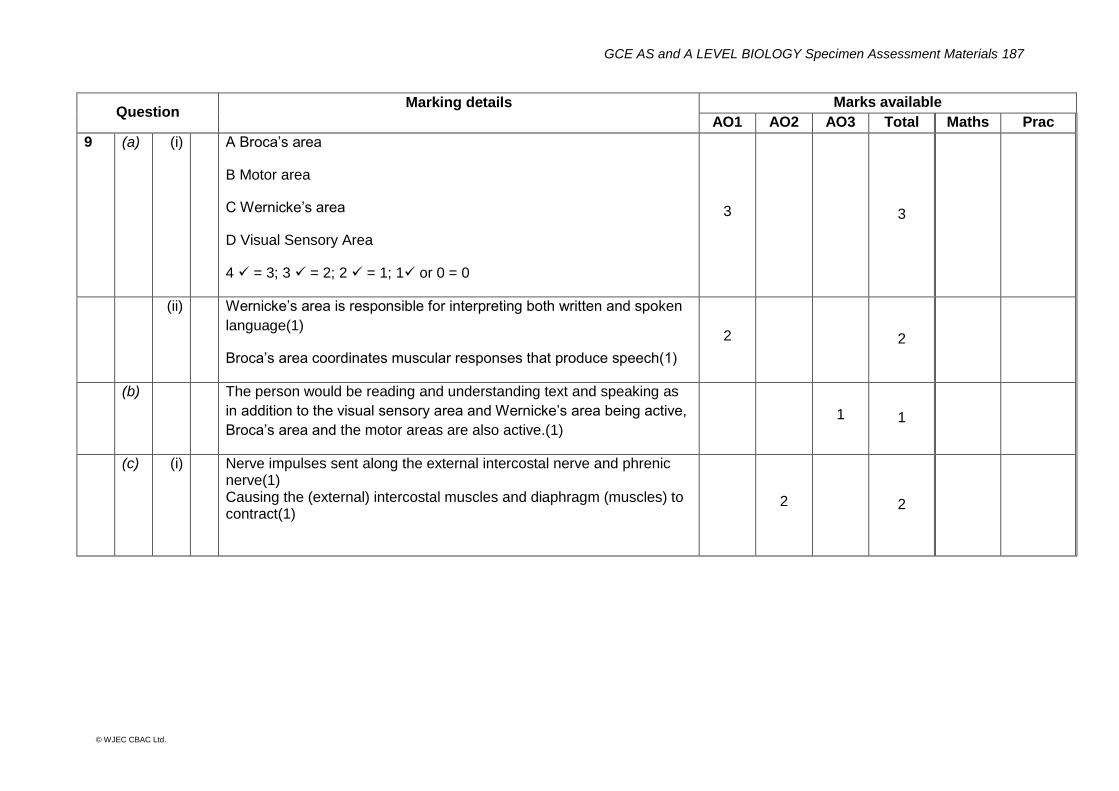
GCE AS and A LEVEL BIOLOGY Specimen Assessment Materials 187
© WJEC CBAC Ltd.
Question Marking details
Marks available
AO1 AO2 AO3 Total Maths Prac
9 (a) (i)
A Broca’s area
B Motor area
C Wernicke’s area
D Visual Sensory Area
4 = 3; 3 = 2; 2 = 1; 1 or 0 = 0
3 3
(ii) Wernicke’s area is responsible for interpreting both written and spoken
language(1)
Broca’s area coordinates muscular responses that produce speech(1)
2 2
(b) The person would be reading and understanding text and speaking as
in addition to the visual sensory area and Wernicke’s area being active,
Broca’s area and the motor areas are also active.(1) 1 1
(c) (i)
Nerve impulses sent along the external intercostal nerve and phrenic nerve(1) Causing the (external) intercostal muscles and diaphragm (muscles) to contract(1)
2 2

GCE AS and A LEVEL BIOLOGY Specimen Assessment Materials 188
© WJEC CBAC Ltd.
Question Marking details
Marks available
AO1 AO2 AO3 Total Maths Prac
9 (c) (ii) During exercise there is an increased rate of respiration(1) This causes the {pCO2 of the blood to increase/pH of the blood to fall}(1) This is detected by the chemoreceptors in the carotid bodies/aortic bodies(1) More nerve impulses are sent to the inspiratory centre in the medulla(1) More nerve impulses sent along the (external )intercostal nerve and phrenic nerve(1)
4 4
(d) (i) Spray water/ use no insect repellent(1) 1 1 1
(ii) Negative chemotaxis(1)
1 1
(iii) ∑ 2
x x = 69.2(1)
69.2/5 = 13.84(1) Standard deviation = √13.84 = 3.72 (1)
3 3 3
(iv) Brand B is the most effective as it had the highest mean and the lowest standard deviation(1) However the results for brand C have a large standard deviation and so there is less confidence in these results(1) The results for the control, brand A and B are random but there is a trend seen in the results for brand C(1)
3 3 1
Question 9 total 6 9 5 20 3 2

GCE AS and A LEVEL BIOLOGY Specimen Assessment Materials 189
© WJEC CBAC Ltd.
COMPONENT 4: Reproduction and Inheritance - SUMMARY OF ASSESSMENT OBJECTIVES
Question AO1 AO2 AO3 TOTAL MARK MATHS PRAC
Section A
1 0 4 8 12 2 1
2 4 0 8 12 0 0
3 9 5 0 14 0 5
4 0 13 2 15 5 0
5 5 2 1 8 1 1
6 0 7 2 9 0 0
Section A – totals 18 31 21 70 8 7
7 6 9 5 20 3 2
8 6 9 5 20 3 2
9 6 9 5 20 3 2
TOTAL 24 40 26 90 11 9

GCE AS and A LEVEL BIOLOGY Specimen Assessment Materials 190
© WJEC CBAC Ltd.
BIOLOGY – PRACTICAL EXAMINATION
MARK SCHEME
GENERAL INSTRUCTIONS Recording of marks
Examiners must mark in red ink.
One tick must equate to one mark.
Question totals should be written in the box at the end of the question.
Question totals should be entered onto the grid on the front cover and these should be added to give the script total for each candidate.
Marking rules
All work should be seen to have been marked.
Marking schemes will indicate when explicit working is deemed to be a necessary part of a correct answer.
Crossed out responses not replaced should be marked.
Credit will be given for correct relevant alternative responses which are not recorded in the mark scheme.
Marking abbreviations
The following may be used in marking schemes or in the marking of scripts to indicate reasons for the marks awarded.
cao = correct answer only
ecf = error carried forward
bod = benefit of doubt

GCE AS and A LEVEL BIOLOGY Specimen Assessment Materials 191
© WJEC CBAC Ltd.
Unit 5 – EXPERIMENTAL TASK
MARK SCHEME
Question Marking details
Marks Available
AO1 AO2 AO3 Total Maths Prac
1 (a) No help needed to set up apparatus(1)
Initial temperature set at 55/60C without help(1) Correct column headings in table (1) Appropriate units in headings, not in body of table (1) calc of mean/ rate as appropriate(1)
1 1
1 1 1
5 2 5
(b) X and Y axes correctly labelled (1) (1) Over half the grid used in both directions(1) Correct units both axes(1) Suitable linear scale on both axes(1) (1) Accurate plotting of plots(2) Suitable drawing of line(1) range bars plotted correctly(2) (1)
1 1 1
1 1 2 2
9 2 9
(c) Comment on length of range bars linked to reliability of mean/ consistency of raw data(1) Comment on overlap of range bars linked to confidence in trend(1) Reject reference to results rather than repeats/ readings/ mean
2 2 2
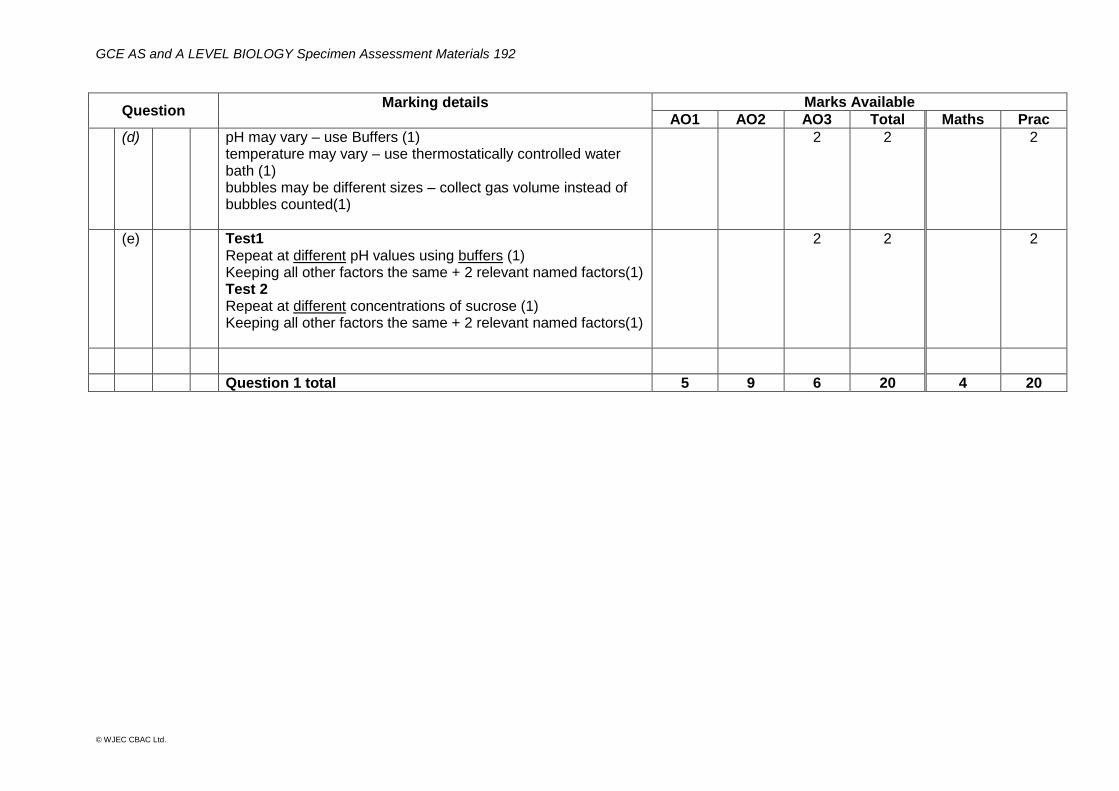
GCE AS and A LEVEL BIOLOGY Specimen Assessment Materials 192
© WJEC CBAC Ltd.
Question Marking details
Marks Available
AO1 AO2 AO3 Total Maths Prac
(d) pH may vary – use Buffers (1) temperature may vary – use thermostatically controlled water bath (1) bubbles may be different sizes – collect gas volume instead of bubbles counted(1)
2 2 2
(e) Test1 Repeat at different pH values using buffers (1) Keeping all other factors the same + 2 relevant named factors(1) Test 2 Repeat at different concentrations of sucrose (1) Keeping all other factors the same + 2 relevant named factors(1)
2 2 2
Question 1 total 5 9 6 20 4 20

GCE AS and A LEVEL BIOLOGY Specimen Assessment Materials 193
© WJEC CBAC Ltd.
Unit 5 – PRACTICAL ANALYSIS TASK
MARK SCHEME
Question Marking details Marks Available
AO1 AO2 AO3 Total Maths Prac
1 (a) (i) Chloroplast extract + DCPIP in darkness(1) 1 1 1
(ii)
Suitable osmotic/ionic strength – to prevent chloroplasts gaining/ losing too much water during the experiment(1) Buffer pH7 – keep pH constant so no change to tertiary structure of dehydrogenase enzymes/ proteins(1) Keep cold – so changes in kinetic energy do not effect dehydrogenase enzymes(1)
3 3 3
(iii) To know when experimental tubes have decolourised by comparing to colour of chloroplast extract(1)
1 1 1
(b) (i) Standard deviation blue light = 26.30 (1) Standard deviation red light = 35.85 (1) Substitution into t formula (1) t = 1.99 (1)
4 4 4
(ii)
Accept the null hypothesis (1)
Because value of t critical value of 2.101 at 0.05 probability with degrees of freedom = 18 (1)
2 2 2
(iii) Light energy / photons are trapped by accessory pigments (1) These are passed to chlorophyll a at reaction centre(1) This causes electrons in PSI and PSII to be excited / lost(1) More blue light absorbed than red light (1) So more electrons released by chlorophyll a in same period (1)
3
2
5
(iv) (using a colorimeter) to time how long it takes for each repeat to reach a set absorbance/ % transmission(1) Non-subjective results/ don’t have to rely on eye sight to decide if DCPIP has been decolourised(1)
2 2 2
(c) DCPIP {would take longer to decolourise/ would not decolourise}(1) Wavelengths in blue and red regions of visible light are absorbed/ used more efficiently than the other wavelengths/ ORA(1)
2 2 2
Question 1 total 3 13 4 20 4 11
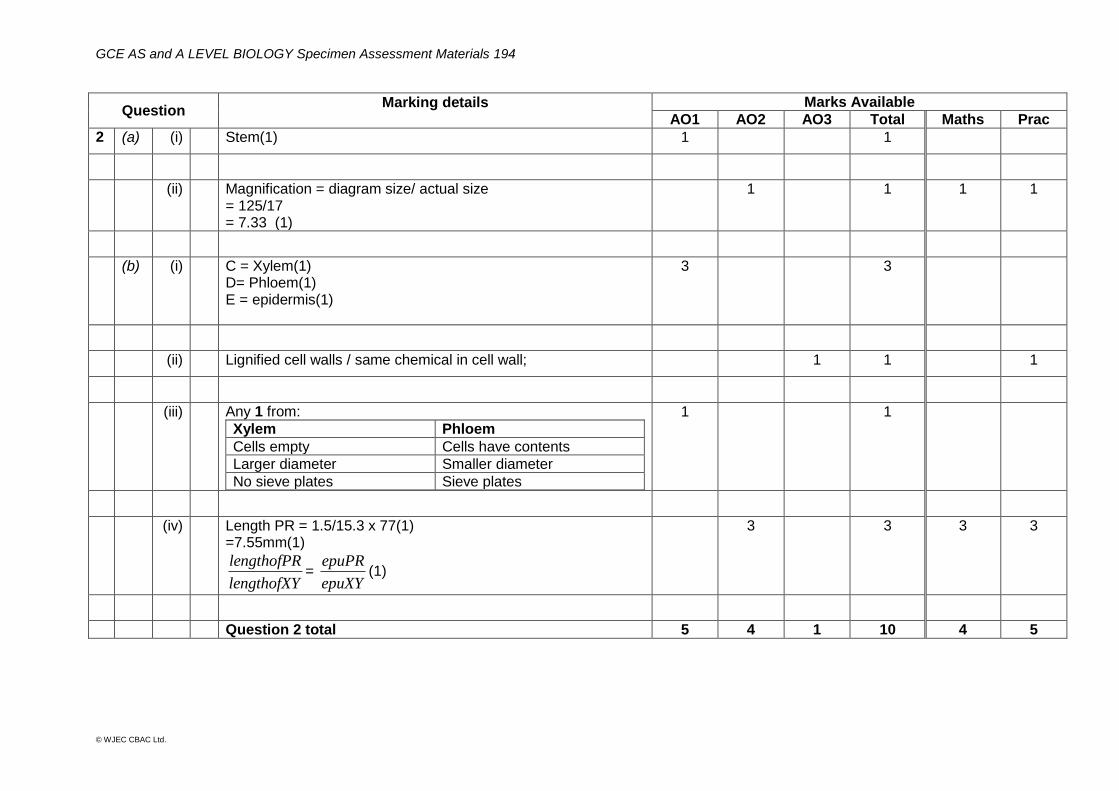
GCE AS and A LEVEL BIOLOGY Specimen Assessment Materials 194
© WJEC CBAC Ltd.
Question Marking details
Marks Available
AO1 AO2 AO3 Total Maths Prac
2 (a) (i) Stem(1) 1 1
(ii) Magnification = diagram size/ actual size = 125/17 = 7.33 (1)
1 1 1 1
(b) (i) C = Xylem(1) D= Phloem(1) E = epidermis(1)
3 3
(ii) Lignified cell walls / same chemical in cell wall; 1 1 1
(iii) Any 1 from:
Xylem Phloem
Cells empty Cells have contents
Larger diameter Smaller diameter
No sieve plates Sieve plates
1 1
(iv) Length PR = 1.5/15.3 x 77(1) =7.55mm(1)
lengthofPR
lengthofXY=
epuPR
epuXY(1)
3 3 3 3
Question 2 total 5 4 1 10 4 5

GCE AS and A LEVEL BIOLOGY Specimen Assessment Materials 195
© WJEC CBAC Ltd.
A2 UNIT 5 – PRACTICAL EXAMINATION - SUMMARY OF ASSESSMENT OBJECTIVES
Experimental Task
Question AO1 AO2 AO3 TOTAL MARK MATHS PRAC
TOTAL 5 9 6 20 4 20
Practical Analysis Task
1 3 13 4 20 4 11
2 5 4 1 10 4 5
TOTAL 8 17 5 30 8 16
OVERALL TOTAL
13 26 11 50 12 36
WJEC GCE AS and A Level Biology SAMS from 2015- HJ 10-03-15