wmawater – response to submissions to “review of …
TRANSCRIPT


WMAwater – Response to Submissions to “Review of Hydraulic Modelling” Report
2
Clarification of Scenario C
3 Modelling of Scenario C was undertaken as part of WMAwater’s report to the Commission in
July 2011 (Reference 1). A full table of relevant variables relating to Scenario C, hour by hour, is
attached at the end of this document. The table includes lake levels, estimated inflows, dam
releases, gate opening settings, and the predicted total peak flows at Lowood and Moggill
estimated to result from releases up to and including that hour.
4 Illustrations of the tabulated information are provided in Figure 1 to Figure 3 below. Figure 1
shows dam inflows, outflows and dam water levels as they occurred during the event and for
Scenario C.
Figure 1: Scenario C Wivenhoe Dam Releases and Water Levels
5 Figure 2 and Figure 3 shows the Scenario C dam releases over time, as well as the
corresponding predicted peaks for flow at Moggill at each point in time. The predicted peaks are
based on the operational spreadsheets used by Seqwater during the flood, which were provided
to WMAwater by the Commission. Different predicted peaks are obtained depending on whether
forecast rain information is included. It is important to note that this chart indicates the predicted
peak expected during the flood as estimated using Seqwater’s operational spreadsheets with
information available at the time, and not the actual flow at Moggill at that time.
67
68
69
70
71
72
73
74
75
76
0
2000
4000
6000
8000
10000
12000
14000
Wa
ter
Le
ve
l (m
AH
D)
Dis
cha
rge
(m
3/
s)
Date
Actual Outflow
Scenario C Outflow
Inflow (Seqwater Calculated)
Actual Level
Scenario C Level

WMAwater – Response to Submissions to “Review of Hydraulic Modelling” Report
3
Figure 2: Scenario C – Predicted Peak Flows at Moggill
Figure 3: Scenario C – Predicted Peak Flows at Lowood
0
2000
4000
6000
8000
10000
12000
Dis
char
ge (
m3/
s)
Date
Total @ Moggill (Predicted - no additional rain)
Total @ Moggill (Predicted - with forecast rain)
Moggill w/out Wivenhoe (Predicted - no additional rain)
Moggill w/out Wivenhoe (Predicted - with forecast rain)
Total Wivenhoe Releases
0
2000
4000
6000
8000
10000
12000
Dis
cha
rge
(m
3/
s)
Date
Total @ Lowood (Predicted - no additional rain)
Total @ Lowood (Predicted - with forecast rain)
Lowood w/out Wivenhoe (Predicted - no additional rain)
Lowood w/out Wivenhoe (Predicted - with forecast rain)
Total Wivenhoe Releases
WMAwater – Response to Submissions to “Review of Hydraulic Modelling” Report
4
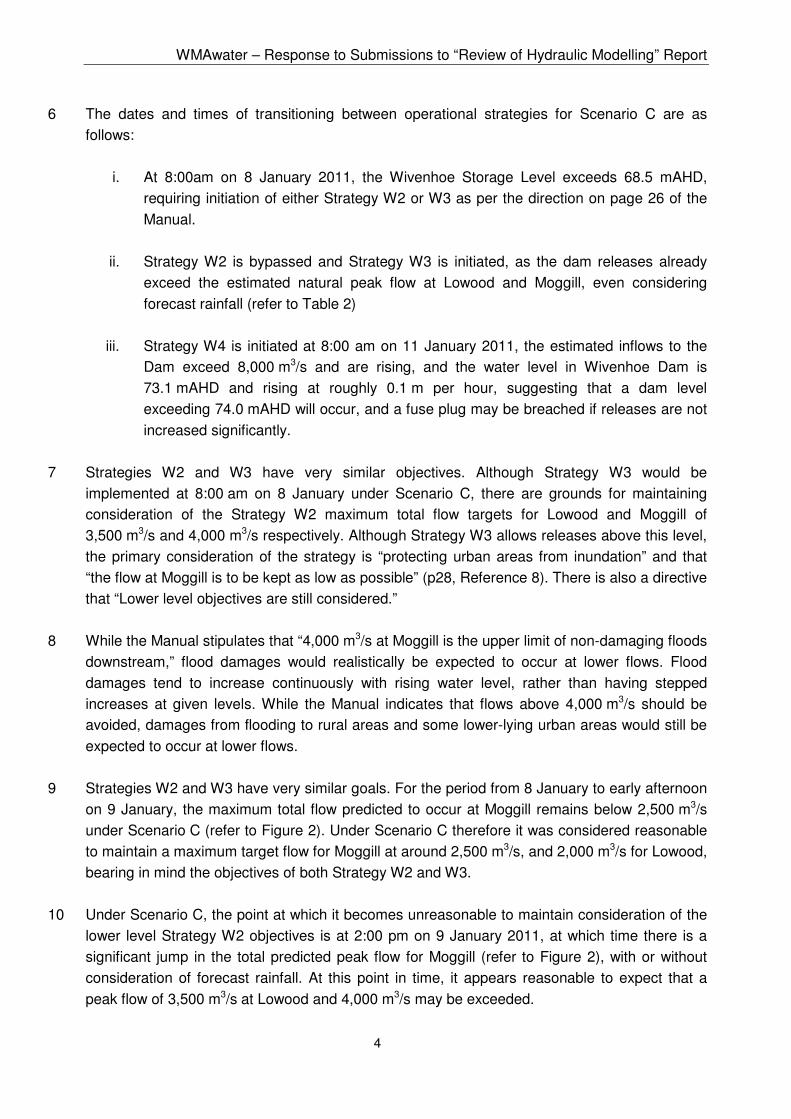
6 The dates and times of transitioning between operational strategies for Scenario C are as
follows:
i. At 8:00am on 8 January 2011, the Wivenhoe Storage Level exceeds 68.5 mAHD,
requiring initiation of either Strategy W2 or W3 as per the direction on page 26 of the
Manual.
ii. Strategy W2 is bypassed and Strategy W3 is initiated, as the dam releases already
exceed the estimated natural peak flow at Lowood and Moggill, even considering
forecast rainfall (refer to Table 2)
iii. Strategy W4 is initiated at 8:00 am on 11 January 2011, the estimated inflows to the
Dam exceed 8,000 m3/s and are rising, and the water level in Wivenhoe Dam is
73.1 mAHD and rising at roughly 0.1 m per hour, suggesting that a dam level
exceeding 74.0 mAHD will occur, and a fuse plug may be breached if releases are not
increased significantly.
7 Strategies W2 and W3 have very similar objectives. Although Strategy W3 would be
implemented at 8:00 am on 8 January under Scenario C, there are grounds for maintaining
consideration of the Strategy W2 maximum total flow targets for Lowood and Moggill of
3,500 m3/s and 4,000 m3/s respectively. Although Strategy W3 allows releases above this level,
the primary consideration of the strategy is “protecting urban areas from inundation” and that
“the flow at Moggill is to be kept as low as possible” (p28, Reference 8). There is also a directive
that “Lower level objectives are still considered.”
8 While the Manual stipulates that “4,000 m3/s at Moggill is the upper limit of non-damaging floods
downstream,” flood damages would realistically be expected to occur at lower flows. Flood
damages tend to increase continuously with rising water level, rather than having stepped
increases at given levels. While the Manual indicates that flows above 4,000 m3/s should be
avoided, damages from flooding to rural areas and some lower-lying urban areas would still be
expected to occur at lower flows.
9 Strategies W2 and W3 have very similar goals. For the period from 8 January to early afternoon
on 9 January, the maximum total flow predicted to occur at Moggill remains below 2,500 m3/s
under Scenario C (refer to Figure 2). Under Scenario C therefore it was considered reasonable
to maintain a maximum target flow for Moggill at around 2,500 m3/s, and 2,000 m3/s for Lowood,
bearing in mind the objectives of both Strategy W2 and W3.
10 Under Scenario C, the point at which it becomes unreasonable to maintain consideration of the
lower level Strategy W2 objectives is at 2:00 pm on 9 January 2011, at which time there is a
significant jump in the total predicted peak flow for Moggill (refer to Figure 2), with or without
consideration of forecast rainfall. At this point in time, it appears reasonable to expect that a
peak flow of 3,500 m3/s at Lowood and 4,000 m3/s may be exceeded.

WMAwater – Response to Submissions to “Review of Hydraulic Modelling” Report
5
Additional Modelling Scenarios
11 As requested by the Commission, WMAwater modelled the effects of two additional Wivenhoe
Dam release scenarios, to determine the impacts at various locations downstream relative to
what actually occurred. The additional scenarios are named as follows (to avoid confusion with
scenarios from previous reports):
i. Scenario G1 – Strategy W3 is invoked at 8:00 am on 8 January 2011, and the gates
are opened as fast as permitted by the Manual to produce a dam release that results in
a predicted total flow at Moggill of 4000 m3/s, using information available at the time
(but not including forecast rain).
ii. Scenario G2: - Strategy W3 is invoked at 8:00 am on 8 January 2011, and the gates
are opened as fast as permitted by the Manual to maintain a dam release of
4,000 m3/s.
12 In practice, the prescribed strategy for Scenario G1 results in releases being increased rapidly
from 940 m3/s at 8:00 am to 3,340 m3/s at 4:00 pm on 8 January. From this point, the discharge
from the dam would have to be steadily reduced to maintain the target peak flow of 4,000 m3/s
at Moggill, due to increases in the predicted flows from other tributaries as the flood progressed.
To achieve this reduction, the gate openings would be held at constant opening widths, but the
discharge from the dam would have steadily reduced as a result of the falling lake level.
Information for Scenario G1 is shown on Figure 4 and Figure 5 below.
Figure 4: Scenario G1 Wivenhoe Dam Releases and Water Levels
67
68
69
70
71
72
73
74
75
76
0
2000
4000
6000
8000
10000
12000
14000
Wa
ter
Le
ve
l (m
AH
D)
Dis
cha
rge
(m
3/
s)
Date
Actual Outflow
Scenario G1 Outflow
Inflow (Seqwater Calculated)
Actual Level
Scenario G1 Level

WMAwater – Response to Submissions to “Review of Hydraulic Modelling” Report
6
Figure 5: Scenario G1 – Predicted Peak Flows at Moggill
13 Under Scenario G1, the Wivenhoe Dam level would have exceeded 74.0 mAHD at around
9:00 pm on 11 January. Gate openings at the intervals specified on page 32 of the Manual are
initiated until the lake level begins to fall, in accordance with Strategy W4A on page 29 of the
Manual.
14 Relevant information for Scenario G2 is provided on Figure 6 and Figure 7.
15 Figure 6 shows that under Scenario G2, dam releases would have increased rapidly from
940 m3/s at 8:00 am to 4,000 m3/s at 6:00 pm on 8 January. Releases of 4,000 m3/s are then
maintained, except for a dip to around 3,500 m3/s between 8:00 am to 11:00 pm on 9 January.
The reason for the dip is that during this period the lake level drops below Full Supply Level and
there is insufficient head to drive releases of 4,000 m3/s from the dam (blue line, Figure 6).
16 The sustained release of 4,000 m3/s under Scenario G2 is enough to prevent the Wivenhoe
Dam level rising above 74.0 mAHD, and Strategy W4 is therefore not triggered under this
scenario. The maximum lake level is 72.3 mAHD at 9:00 pm on 12 January (Figure 6).
0
2000
4000
6000
8000
10000
12000
Dis
char
ge (
m3/
s)
Date
Total @ Moggill (Predicted - no additional rain)
Total @ Moggill (Predicted - with forecast rain)
Moggill w/out Wivenhoe (Predicted - no additional rain)
Moggill w/out Wivenhoe (Predicted - with forecast rain)
Total Wivenhoe Releases

WMAwater – Response to Submissions to “Review of Hydraulic Modelling” Report
7
Figure 6: Scenario G2 Wivenhoe Dam Releases and Water Levels
Figure 7: Scenario G2 – Predicted Peak Flows at Moggill
67
68
69
70
71
72
73
74
75
76
0
2000
4000
6000
8000
10000
12000
14000
Wa
ter
Le
ve
l (m
AH
D)
Dis
cha
rge
(m
3/
s)
Date
Actual Outflow
Scenario G2 Outflow
Inflow (Seqwater Calculated)
Actual Level
Scenario G2 Level
0
2000
4000
6000
8000
10000
12000
Dis
char
ge (
m3/
s)
Date
Total @ Moggill (Predicted - no additional rain)
Total @ Moggill (Predicted - with forecast rain)
Moggill w/out Wivenhoe (Predicted - no additional rain)
Moggill w/out Wivenhoe (Predicted - with forecast rain)
Total Wivenhoe Releases

WMAwater – Response to Submissions to “Review of Hydraulic Modelling” Report
8
Modelling Results
17 Modelled flood levels at key locations for each scenario are presented Figure 9, with the peak
comparisons given in Table 1 below. Results for Scenarios C and D from Reference 1 are also
included. A negative value of “Peak Flood Level Difference” for a given scenario indicates a
benefit (i.e. a reduction in flood levels compared to what actually occurred).
Table 1: Alternative Dam Operation Results
Location Case 1 Scenario C
Scenario D
Scenario G1
Scenario G2
Peak Flood Level (mAHD)
Peak Flood Level difference relative to Case 1 (m)
Moggill 17.6 -0.7 -0.9 -1.3 -1.0
Jindalee 13.1 -0.6 -0.8 -1.2 -0.8
Oxley 8.3 -0.5 -0.6 -0.9 -0.6
Brisbane 4.6 -0.3 -0.4 -0.6 -0.3
18 Note that both Scenario G1 and G2 result in a lower flood level at some locations than
Scenario D, which was an optimised strategy using hindsight presented in Reference 1. The
primary reason for this difference is that Scenario D does not incorporate releases greater than
the inflows (Figure 8). This issue is discussed further below.
Figure 8: Scenario D Wivenhoe Dam Releases and Water Levels (from Reference 1)
67
68
69
70
71
72
73
74
75
76
0
2000
4000
6000
8000
10000
12000
14000
Wa
ter
Le
ve
l (m
AH
D)
Dis
cha
rge
(m
3/
s)
Date
Actual Outflow
Option D Outflow
Inflow (Seqwater Calculated)
Actual Level
Option D Level

WMAwater – Response to Submissions to “Review of Hydraulic Modelling” Report
9
Figure 9: Modelled Flood Level Hydrographs for Base Case and Scenarios G1 and G2
WMAwater – Response to Submissions to “Review of Hydraulic Modelling” Report
10
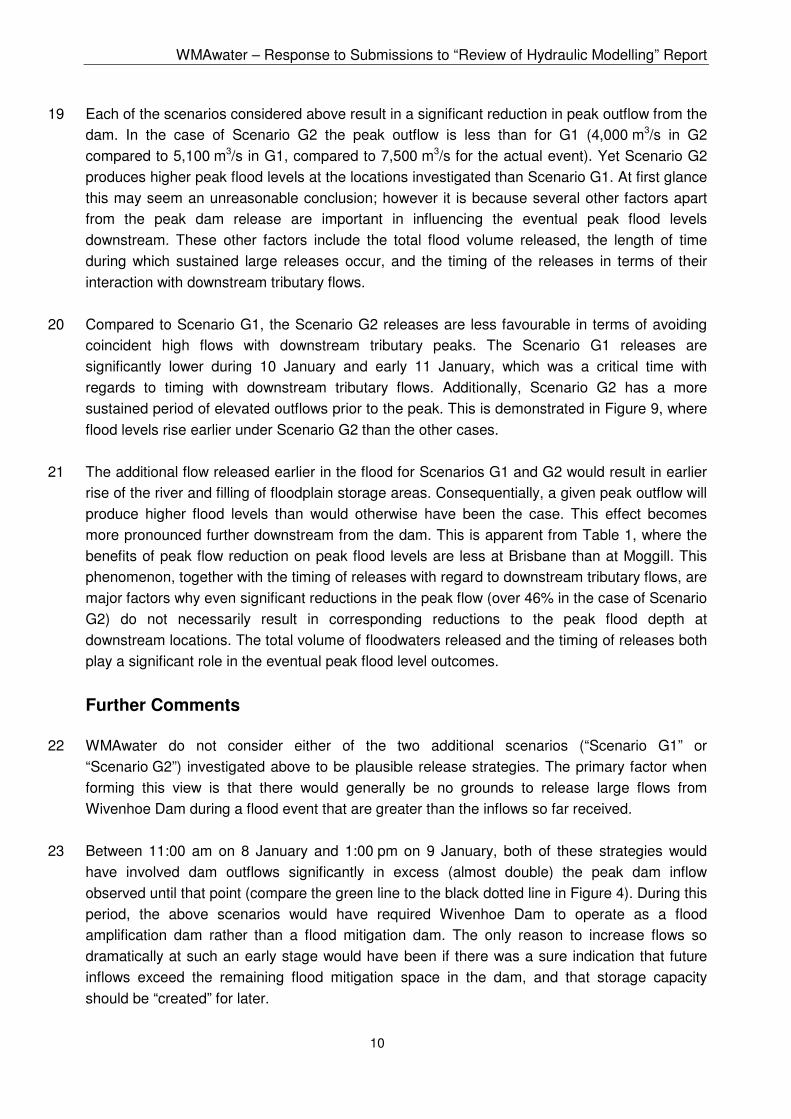
19 Each of the scenarios considered above result in a significant reduction in peak outflow from the
dam. In the case of Scenario G2 the peak outflow is less than for G1 (4,000 m3/s in G2
compared to 5,100 m3/s in G1, compared to 7,500 m3/s for the actual event). Yet Scenario G2
produces higher peak flood levels at the locations investigated than Scenario G1. At first glance
this may seem an unreasonable conclusion; however it is because several other factors apart
from the peak dam release are important in influencing the eventual peak flood levels
downstream. These other factors include the total flood volume released, the length of time
during which sustained large releases occur, and the timing of the releases in terms of their
interaction with downstream tributary flows.
20 Compared to Scenario G1, the Scenario G2 releases are less favourable in terms of avoiding
coincident high flows with downstream tributary peaks. The Scenario G1 releases are
significantly lower during 10 January and early 11 January, which was a critical time with
regards to timing with downstream tributary flows. Additionally, Scenario G2 has a more
sustained period of elevated outflows prior to the peak. This is demonstrated in Figure 9, where
flood levels rise earlier under Scenario G2 than the other cases.
21 The additional flow released earlier in the flood for Scenarios G1 and G2 would result in earlier
rise of the river and filling of floodplain storage areas. Consequentially, a given peak outflow will
produce higher flood levels than would otherwise have been the case. This effect becomes
more pronounced further downstream from the dam. This is apparent from Table 1, where the
benefits of peak flow reduction on peak flood levels are less at Brisbane than at Moggill. This
phenomenon, together with the timing of releases with regard to downstream tributary flows, are
major factors why even significant reductions in the peak flow (over 46% in the case of Scenario
G2) do not necessarily result in corresponding reductions to the peak flood depth at
downstream locations. The total volume of floodwaters released and the timing of releases both
play a significant role in the eventual peak flood level outcomes.
Further Comments
22 WMAwater do not consider either of the two additional scenarios (“Scenario G1” or
“Scenario G2”) investigated above to be plausible release strategies. The primary factor when
forming this view is that there would generally be no grounds to release large flows from
Wivenhoe Dam during a flood event that are greater than the inflows so far received.
23 Between 11:00 am on 8 January and 1:00 pm on 9 January, both of these strategies would
have involved dam outflows significantly in excess (almost double) the peak dam inflow
observed until that point (compare the green line to the black dotted line in Figure 4). During this
period, the above scenarios would have required Wivenhoe Dam to operate as a flood
amplification dam rather than a flood mitigation dam. The only reason to increase flows so
dramatically at such an early stage would have been if there was a sure indication that future
inflows exceed the remaining flood mitigation space in the dam, and that storage capacity
should be “created” for later.

WMAwater – Response to Submissions to “Review of Hydraulic Modelling” Report
11
24 Releasing 3,300 m3/s from Wivenhoe Dam over a period of a day corresponds to just over
40 mm of runoff from the dam catchment of approximately 7,000 km2 (noting that a greater
depth of rainfall is required to produce 40 mm of runoff, due to infiltration etc.). Additionally the
available dam storage for flood mitigation between 68.5 mAHD and 74.0 mAHD is 742,000 ML,
which corresponds to approximately 105 mm of runoff from the dam catchment. Maintaining a
release of 3,300 m3/s over a period of 3 days therefore discharges a catchment average runoff
of 120 mm. If the dam level is to increase from 68.5 mAHD to 74.0 mAHD during this period,
then an additional 105 mm of runoff are required, for a total catchment average runoff of
225 mm over 3 days (or 305 mm over 5 days using the same calculations). The actual rainfall
required to produce this runoff would be higher still.
25 Releasing more than 3,300 m3/s from 11:00 am on 8 January (as per Scenarios G1 and G2
above) would have required the dam operators to gamble that over 225 mm of runoff would
occur from the entire dam catchment in the next three days, or that 305 mm of runoff would
occur in the next five days. These totals would be the amount of runoff required to bring the
dam lake level up to 74.0 mAHD while making releases of this magnitude. At that point in time,
both the 3-day and 5-day forecasts were for less than 200 mm of rainfall (Figure 4.3, Reference
10). At midday on 8 January, the 3-day and 5-day forecasts were both reduced to less than
150 mm. During the period in question (8 and 9 January), the extreme rainfall experienced in
the dam catchment and Lockyer Valley on 11 January, which caused the second large inflow
peak to the dam, was therefore not expected. Releasing 3,300 m3/s from the dam at this time
would have required an implicit assumption that 3-day and 5-day rainfall totals higher than the
forecast were expected.
26 Without an expectation that the dam level would reach 74.0 mAHD, releases over 3,300 m3/s
would not therefore have been justified at that point in time (8 January 2011). If the additional
rainfall did not eventuate, the accelerated release strategy would have significantly increased
downstream flood damages in rural areas. Although hindsight indicates a better flood mitigation
result could have been obtained by this course of action, it would have been unjustifiably risky
using the information available at the time.
27 WMAwater consider it is unreasonable to consider release scenarios (such as Scenario G1 and
G2) that require dam outflows to be escalated above inflows for a significant period as plausible
alternative courses of action. To enact such strategies would have required foresight beyond
that obtained from a measured consideration of weather forecasts.
28 In light of these considerations, WMAwater consider Scenario D to be a more plausible
alternative strategy that is representative of a release sequence that might have been enacted,
if there was an accurate and certain rainfall forecast available with a three-day horizon.
WMAwater – Response to Submissions to “Review of Hydraulic Modelling” Report
12
Reductions in Dam Level below 68.5 mAHD
29 Under Scenario G1, the dam level would have fallen to 67.02 mAHD (just above Full Supply
Level) at 3:00 pm on 9 January. Under Scenario G2, the dam level would have fallen to
66.53 mAHD (below Full Supply Level) at 3:00 pm on 9 January. Scenario G1 and G2 both
therefore result in the dam level dropping below 68.5 mAHD, which is the trigger level for
shifting between Strategy W1 and Strategy W2 or W3.
30 It is not clear to WMAwater from the Manual whether dropping below 68.5 mAHD requires a
shift back into Strategy W1. Given that further inflows to the dam were expected, and the
Manual refers to a “likely” or “predicted” level of 68.5 mAHD when considering the application of
Strategy W1 (pages 23 and 28 of Reference 8 respectively), it may have still been reasonable
to remain in Strategy W3 during these periods.
31 It appears therefore that the releases under scenarios G1 and G2 would only be permissible
under the operational procedures in the Manual if there was a strong expectation that future
inflows would be sufficient to increase the dam level back above 68.5 mAHD. Given the low
level of the dam, it would be reasonable under such conditions to give strong consideration to
targeting flows at Moggill significantly lower than 4,000 m3/s, to give a safety buffer in case
there was a dramatic increase in Lockyer Creek or Bremer River flows.
Yours sincerely, WMAwater
Mark Babister Rhys Hardwick Jones Director Associate

WMAwater – Response to Submissions to “Review of Hydraulic Modelling” Report
13
References
1. WMAwater
Review of Hydraulic Modelling – Queensland Floods Commission of Inquiry
Queensland Floods Commission of Inquiry, July 2011
2. Queensland Floods Commission of Inquiry
Modelling of Additional Dam Release Scenarios – Addendum to “Review of Hydraulic
Modelling” Report
Queensland Floods Commission of Inquiry, November 2011
3. SKM
Joint Calibration of a Hydrologic and Hydrodynamic Model of the Lower Brisbane
River, Technical Report, Version 1
Seqwater, June 2011.
4. SKM
Joint Calibration of a Hydrologic and Hydrodynamic Model of the Lower Brisbane
River, Technical Report, Version 2
Seqwater, August 2011.
5. WMAwater
Report to the Queensland Floods Commission of Inquiry
Queensland Floods Commission of Inquiry, May 2011
6. WMAwater
Brisbane River 2011 Flood Event – Flood Frequency Analysis
Queensland Floods Commission of Inquiry, September 2011
7. WMAwater
Supplementary Report – Ipswich Flood Frequency Analysis
Queensland Floods Commission of Inquiry, October 2011
8. Seqwater
Manual of Operational Procedures for Flood Mitigation at Wivenhoe and Somerset
Dam – Revision 7
November 2009
9. Seqwater
January 2011 Flood Event – Report on the operation of Somerset Dam and Wivenhoe
Dam
March 2011
10. SKM
Review of Hydrological Issues. January 2011 Flood Event – Report on the operation
of Somerset Dam and Wivenhoe Dam
Seqwater, 11 March 2011

WMAwater – Response to Submissions to “Review of Hydraulic Modelling” Report
14
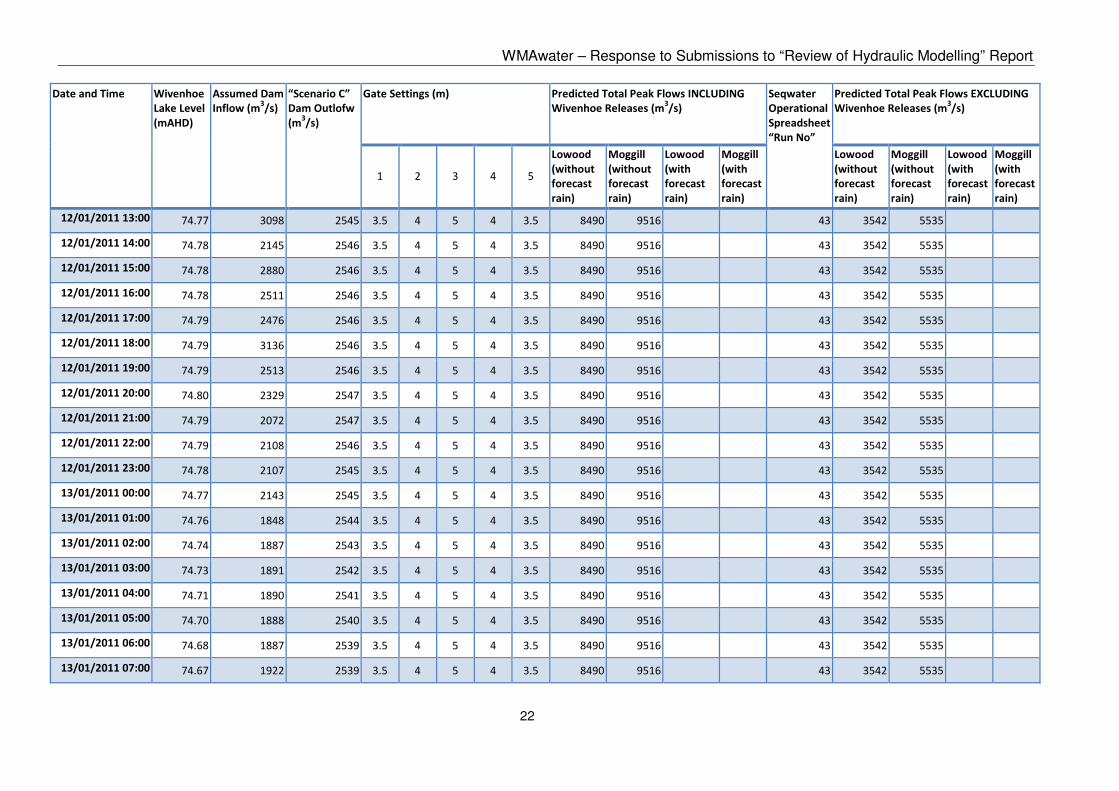
Table 2: Table of hourly variables for Scenario C
Note that some series relating to predicted peak flows do not extend for the full duration of the flood, as predictions relating to forecast rainfall
were discontinued near the peak of the second dam inflow.
Date and Time Wivenhoe
Lake Level
(mAHD)
Assumed Dam
Inflow (m3/s)
“Scenario C”
Dam Outlofw
(m3/s)
Gate Settings (m) Predicted Total Peak Flows INCLUDING
Wivenhoe Releases (m3/s)
Seqwater
Operational
Spreadsheet
“Run No”
Predicted Total Peak Flows EXCLUDING
Wivenhoe Releases (m3/s)
1 2 3 4 5
Lowood
(without
forecast
rain)
Moggill
(without
forecast
rain)
Lowood
(with
forecast
rain)
Moggill
(with
forecast
rain)
Lowood
(without
forecast
rain)
Moggill
(without
forecast
rain)
Lowood
(with
forecast
rain)
Moggill
(with
forecast
rain)
06/01/2011 09:00 67.32 406 50 0 0 0 0 0 172 396 191 396 2 122 346 141 346
06/01/2011 10:00 67.32 177 50 0 0 0 0 0 172 396 191 396 2 122 346 141 346
06/01/2011 11:00 67.33 177 50 0 0 0 0 0 172 396 191 396 2 122 346 141 346
06/01/2011 12:00 67.33 406 50 0 0 0 0 0 425 537 537 685 3 375 487 487 635
06/01/2011 13:00 67.34 177 50 0 0 0 0 0 425 537 537 685 3 375 487 487 635
06/01/2011 14:00 67.35 152 50 0 0 0 0 0 425 537 537 685 3 375 487 487 635
06/01/2011 15:00 67.35 559 50 0 0 0 0 0 425 537 537 685 3 375 487 487 635
06/01/2011 16:00 67.36 534 50 0 0 0 0 0 425 537 537 685 3 375 487 487 635
06/01/2011 17:00 67.38 330 50 0 0 0 0 0 425 537 537 685 3 375 487 487 635
06/01/2011 18:00 67.39 355 50 0 0 0 0 0 1386 1414 1581 1636 4 380 456 652 816
06/01/2011 19:00 67.40 355 50 0 0 0 0 0 1386 1414 1581 1636 4 380 456 652 816
06/01/2011 20:00 67.41 355 50 0 0 0 0 0 1386 1414 1581 1636 4 380 456 652 816
06/01/2011 21:00 67.42 355 50 0 0 0 0 0 1386 1414 1581 1636 4 380 456 652 816
06/01/2011 22:00 67.43 305 50 0 0 0 0 0 1386 1414 1581 1636 4 380 456 652 816
06/01/2011 23:00 67.44 660 50 0 0 0 0 0 1386 1414 1581 1636 4 380 456 652 816

WMAwater – Response to Submissions to “Review of Hydraulic Modelling” Report
15
Date and Time Wivenhoe
Lake Level
(mAHD)
Assumed Dam
Inflow (m3/s)
“Scenario C”
Dam Outlofw
(m3/s)
Gate Settings (m) Predicted Total Peak Flows INCLUDING
Wivenhoe Releases (m3/s)
Seqwater
Operational
Spreadsheet
“Run No”
Predicted Total Peak Flows EXCLUDING
Wivenhoe Releases (m3/s)
1 2 3 4 5
Lowood
(without
forecast
rain)
Moggill
(without
forecast
rain)
Lowood
(with
forecast
rain)
Moggill
(with
forecast
rain)
Lowood
(without
forecast
rain)
Moggill
(without
forecast
rain)
Lowood
(with
forecast
rain)
Moggill
(with
forecast
rain)
07/01/2011 00:00 67.45 1047 50 0 0 0 0 0 1386 1414 1581 1636 4 380 456 652 816
07/01/2011 01:00 67.48 798 50 0 0 0 0 0 1386 1414 1581 1636 4 380 456 652 816
07/01/2011 02:00 67.51 800 50 0 0 0 0 0 1426 1457 1725 1797 5 471 553 715 961
07/01/2011 03:00 67.53 980 50 0 0 0 0 0 1426 1457 1725 1797 5 471 553 715 961
07/01/2011 04:00 67.56 1135 50 0 0 0 0 0 1426 1457 1725 1797 5 471 553 715 961
07/01/2011 05:00 67.59 1342 50 0 0 0 0 0 1426 1457 1725 1797 5 471 553 715 961
07/01/2011 06:00 67.63 1109 50 0 0 0 0 0 1410 1452 1713 1827 6 474 598 688 1058
07/01/2011 07:00 67.67 1134 50 0 0 0 0 0 1410 1452 1713 1827 6 474 598 688 1058
07/01/2011 08:00 67.70 1167 50 0 0 0 0 0 1410 1452 1713 1827 6 474 598 688 1058
07/01/2011 09:00 67.74 864 50 0 0 0 0 0 1510 1552 1832 1959 7 475 566 675 966
07/01/2011 10:00 67.77 1648 50 0 0 0 0 0 1510 1552 1832 1959 7 475 566 675 966
07/01/2011 11:00 67.81 2225 50 0 0 0 0 0 1510 1552 1832 1959 7 475 566 675 966
07/01/2011 12:00 67.87 1778 50 0 0 0 0 0 1510 1552 1832 1959 7 475 566 675 966
07/01/2011 13:00 67.93 1472 50 0 0 0 0 0 1510 1552 1832 1959 7 475 566 675 966
07/01/2011 14:00 67.98 1139 50 0 0 0 0 0 1510 1552 1832 1959 7 475 566 675 966
07/01/2011 15:00 68.02 995 64 0 0 0.5 0 0 1606 1664 1887 2054 8 528 660 709 1037
07/01/2011 16:00 68.05 1020 116 0 0 1 0 0 1606 1664 1887 2054 8 528 660 709 1037
07/01/2011 17:00 68.08 1523 167 0 0 1.5 0 0 1606 1664 1887 2054 8 528 660 709 1037
07/01/2011 18:00 68.11 1360 218 0 0 2 0 0 1606 1664 1887 2054 8 528 660 709 1037

WMAwater – Response to Submissions to “Review of Hydraulic Modelling” Report
16
Date and Time Wivenhoe
Lake Level
(mAHD)
Assumed Dam
Inflow (m3/s)
“Scenario C”
Dam Outlofw
(m3/s)
Gate Settings (m) Predicted Total Peak Flows INCLUDING
Wivenhoe Releases (m3/s)
Seqwater
Operational
Spreadsheet
“Run No”
Predicted Total Peak Flows EXCLUDING
Wivenhoe Releases (m3/s)
1 2 3 4 5
Lowood
(without
forecast
rain)
Moggill
(without
forecast
rain)
Lowood
(with
forecast
rain)
Moggill
(with
forecast
rain)
Lowood
(without
forecast
rain)
Moggill
(without
forecast
rain)
Lowood
(with
forecast
rain)
Moggill
(with
forecast
rain)
07/01/2011 19:00 68.15 958 268 0 0 2.5 0 0 1606 1664 1887 2054 8 528 660 709 1037
07/01/2011 20:00 68.18 1514 316 0 0 3 0 0 1606 1664 1887 2054 8 528 660 709 1037
07/01/2011 21:00 68.21 1300 363 0 0 3.5 0 0 1606 1664 1887 2054 8 528 660 709 1037
07/01/2011 22:00 68.24 1387 416 0 0.5 3.5 0 0 1606 1664 1887 2054 8 528 660 709 1037
07/01/2011 23:00 68.27 1519 468 0 0.5 3.5 0.5 0 1606 1664 1887 2054 8 528 660 709 1037
08/01/2011 00:00 68.30 818 522 0 1 3.5 0.5 0 1606 1664 1887 2054 8 528 660 709 1037
08/01/2011 01:00 68.33 1841 575 0 1 3.5 1 0 1606 1664 1887 2054 8 528 660 709 1037
08/01/2011 02:00 68.35 1624 627 0.5 1 3.5 1 0 1606 1664 1887 2054 8 528 660 709 1037
08/01/2011 03:00 68.38 1246 681 0.5 1 3.5 1 0.5 1606 1664 1887 2054 8 528 660 709 1037
08/01/2011 04:00 68.41 1622 732 0.5 1.5 3.5 1 0.5 1606 1664 1887 2054 8 528 660 709 1037
08/01/2011 05:00 68.43 1135 784 0.5 1.5 3.5 1.5 0.5 1606 1664 1887 2054 8 528 660 709 1037
08/01/2011 06:00 68.45 1867 838 1 1.5 3.5 1.5 0.5 1606 1664 1887 2054 8 528 660 709 1037
08/01/2011 07:00 68.47 2144 892 1 1.5 3.5 1.5 1 1627 1697 1730 1948 9 531 691 531 828
08/01/2011 08:00 68.51 1515 939 1 1.5 4 1.5 1 1627 1697 1730 1948 9 531 691 531 828
08/01/2011 09:00 68.54 1649 991 1 2 4 1.5 1 1627 1697 1730 1948 9 531 691 531 828
08/01/2011 10:00 68.55 1755 1043 1 2 4 2 1 1627 1697 1730 1948 9 531 691 531 828
08/01/2011 11:00 68.58 1399 1097 1.5 2 4 2 1 1627 1697 1730 1948 9 531 691 531 828
08/01/2011 12:00 68.59 1260 1150 1.5 2 4 2 1.5 1627 1697 1730 1948 9 531 691 531 828
08/01/2011 13:00 68.60 1530 1202 1.5 2.5 4 2 1.5 1627 1697 1730 1948 9 531 691 531 828

WMAwater – Response to Submissions to “Review of Hydraulic Modelling” Report
17
Date and Time Wivenhoe
Lake Level
(mAHD)
Assumed Dam
Inflow (m3/s)
“Scenario C”
Dam Outlofw
(m3/s)
Gate Settings (m) Predicted Total Peak Flows INCLUDING
Wivenhoe Releases (m3/s)
Seqwater
Operational
Spreadsheet
“Run No”
Predicted Total Peak Flows EXCLUDING
Wivenhoe Releases (m3/s)
1 2 3 4 5
Lowood
(without
forecast
rain)
Moggill
(without
forecast
rain)
Lowood
(with
forecast
rain)
Moggill
(with
forecast
rain)
Lowood
(without
forecast
rain)
Moggill
(without
forecast
rain)
Lowood
(with
forecast
rain)
Moggill
(with
forecast
rain)
08/01/2011 14:00 68.60 1799 1355 2 2.5 4 2.5 2 1724 1826 1943 2253 10 528 771 528 940
08/01/2011 15:00 68.62 1581 1356 2 2.5 4 2.5 2 1724 1826 1943 2253 10 528 771 528 940
08/01/2011 16:00 68.63 1418 1403 2 2.5 4.5 2.5 2 1748 1843 1943 2312 10 528 771 528 940
08/01/2011 17:00 68.63 1227 1454 2.5 2.5 4.5 2.5 2 1788 1880 1942 2391 10 528 771 528 940
08/01/2011 18:00 68.63 1255 1505 2.5 2.5 4.5 2.5 2.5 1837 1925 1932 2350 11 531 774 531 897
08/01/2011 19:00 68.62 1255 1553 2.5 3 4.5 2.5 2.5 1876 1962 1931 2391 11 531 774 531 897
08/01/2011 20:00 68.61 1255 1602 2.5 3 4.5 3 2.5 1916 1999 1964 2465 11 531 774 531 897
08/01/2011 21:00 68.60 1282 1649 2.5 3.5 4.5 3 2.5 1954 2035 2033 2543 11 531 774 531 897
08/01/2011 22:00 68.59 1091 1696 2.5 3.5 4.5 3.5 2.5 1993 2071 2081 2593 11 531 774 531 897
08/01/2011 23:00 68.57 899 1744 3 3.5 4.5 3.5 2.5 2032 2108 2131 2634 11 531 774 531 897
09/01/2011 00:00 68.55 926 1791 3 3.5 4.5 3.5 3 2072 2146 2183 2681 11 531 774 531 897
09/01/2011 01:00 68.53 925 1789 3 3.5 4.5 3.5 3 2062 2142 2062 2568 12 528 771 528 836
09/01/2011 02:00 68.50 943 1787 3 3.5 4.5 3.5 3 2062 2142 2062 2568 12 528 771 528 836
09/01/2011 03:00 68.47 1189 1784 3 3.5 4.5 3.5 3 2062 2142 2079 2570 12 528 771 528 836
09/01/2011 04:00 68.45 970 1782 3 3.5 4.5 3.5 3 2062 2142 2099 2600 12 528 771 528 836
09/01/2011 05:00 68.43 802 1781 3 3.5 4.5 3.5 3 2062 2142 2100 2602 12 528 771 528 836
09/01/2011 06:00 68.40 1047 1778 3 3.5 4.5 3.5 3 2076 2156 2076 2531 13 531 774 531 795
09/01/2011 07:00 68.38 1046 1776 3 3.5 4.5 3.5 3 2076 2156 2076 2531 13 531 774 531 795
09/01/2011 08:00 68.35 773 1774 3 3.5 4.5 3.5 3 2065 2146 2065 2495 14 528 771 528 780

WMAwater – Response to Submissions to “Review of Hydraulic Modelling” Report
18
Date and Time Wivenhoe
Lake Level
(mAHD)
Assumed Dam
Inflow (m3/s)
“Scenario C”
Dam Outlofw
(m3/s)
Gate Settings (m) Predicted Total Peak Flows INCLUDING
Wivenhoe Releases (m3/s)
Seqwater
Operational
Spreadsheet
“Run No”
Predicted Total Peak Flows EXCLUDING
Wivenhoe Releases (m3/s)
1 2 3 4 5
Lowood
(without
forecast
rain)
Moggill
(without
forecast
rain)
Lowood
(with
forecast
rain)
Moggill
(with
forecast
rain)
Lowood
(without
forecast
rain)
Moggill
(without
forecast
rain)
Lowood
(with
forecast
rain)
Moggill
(with
forecast
rain)
09/01/2011 09:00 68.33 1182 1771 3 3.5 4.5 3.5 3 2098 2195 2098 2365 15 531 799 531 799
09/01/2011 10:00 68.30 1536 1769 3 3.5 4.5 3.5 3 2098 2195 2098 2397 15 531 799 531 799
09/01/2011 11:00 68.29 1646 1768 3 3.5 4.5 3.5 3 2098 2195 2098 2422 15 531 799 531 799
09/01/2011 12:00 68.28 2080 1767 3 3.5 4.5 3.5 3 2088 2264 2225 2743 16 528 795 572 1182
09/01/2011 13:00 68.29 2054 1768 3 3.5 4.5 3.5 3 2088 2264 2225 2743 16 528 795 572 1182
09/01/2011 14:00 68.29 3448 1815 3 4 4.5 3.5 3 2066 2321 2437 2817 17 528 771 689 1207
09/01/2011 15:00 68.32 4136 1907 3 4 5 4 3 2139 2332 2522 2923 18 531 774 692 1207
09/01/2011 16:00 68.38 3946 2008 3.5 4 5 4 3.5 2906 2957 3810 4024 19 531 774 1054 1716
09/01/2011 17:00 68.45 4733 2105 3.5 4.5 5 4.5 3.5 3024 3076 3938 4160 20 531 774 1174 1929
09/01/2011 18:00 68.52 5454 2206 4 4.5 5 4.5 4 3018 3070 3933 4155 20 531 774 1174 1929
09/01/2011 19:00 68.61 5848 2216 4 4.5 5 4.5 4 3191 3243 4115 4356 21 528 771 1253 1941
09/01/2011 20:00 68.71 7338 2319 4.5 4.5 5 4.5 4.5 3053 3125 3986 4354 22 531 774 1254 1964
09/01/2011 21:00 68.85 7659 2423 4.5 5 5 5 4.5 3052 3124 3985 4353 22 531 774 1254 1964
09/01/2011 22:00 69.00 7646 2533 5 5 5 5 5 3050 3158 3984 4351 22 531 774 1254 1964
09/01/2011 23:00 69.16 7935 2552 5 5 5 5 5 3049 3193 3983 4350 22 531 774 1254 1964
10/01/2011 00:00 69.31 7936 2572 5 5 5 5 5 3052 3225 3982 4349 22 531 774 1254 1964
10/01/2011 01:00 69.47 8449 2590 5 5 5 5 5 3152 3348 4061 4427 23 620 821 1294 2002
10/01/2011 02:00 69.63 8732 2607 5 5 5 5 5 3192 3380 4060 4426 23 620 821 1294 2002
10/01/2011 03:00 69.80 9133 2628 5 5 5 5 5 3256 3436 4041 4440 24 622 824 1263 1970

WMAwater – Response to Submissions to “Review of Hydraulic Modelling” Report
19
Date and Time Wivenhoe
Lake Level
(mAHD)
Assumed Dam
Inflow (m3/s)
“Scenario C”
Dam Outlofw
(m3/s)
Gate Settings (m) Predicted Total Peak Flows INCLUDING
Wivenhoe Releases (m3/s)
Seqwater
Operational
Spreadsheet
“Run No”
Predicted Total Peak Flows EXCLUDING
Wivenhoe Releases (m3/s)
1 2 3 4 5
Lowood
(without
forecast
rain)
Moggill
(without
forecast
rain)
Lowood
(with
forecast
rain)
Moggill
(with
forecast
rain)
Lowood
(without
forecast
rain)
Moggill
(without
forecast
rain)
Lowood
(with
forecast
rain)
Moggill
(with
forecast
rain)
10/01/2011 04:00 69.98 8759 2651 5 5 5 5 5 3219 3454 4005 4620 25 620 837 1240 1976
10/01/2011 05:00 70.16 8933 2669 5 5 5 5 5 3261 3488 4003 4617 25 620 837 1240 1976
10/01/2011 06:00 70.33 9312 2690 5 5 5 5 5 3294 3513 4002 4615 25 620 837 1240 1976
10/01/2011 07:00 70.51 9351 2514 4.5 4.5 5 4.5 4.5 3294 3513 4000 4614 25 620 837 1240 1976
10/01/2011 08:00 70.70 10095 2279 4 4 4.5 4 4 3294 3513 4000 4613 25 620 837 1240 1976
10/01/2011 09:00 70.90 9731 2191 3.5 4 4.5 4 3.5 3303 3685 3974 4618 26 630 1090 1221 2092
10/01/2011 10:00 71.11 7267 1993 3 3.5 4.5 3.5 3 3303 3685 3974 4618 26 630 1090 1221 2092
10/01/2011 11:00 71.28 8059 2007 3 3.5 4.5 3.5 3 3303 3685 3974 4618 26 630 1090 1221 2092
10/01/2011 12:00 71.43 9026 2019 3 3.5 4.5 3.5 3 3293 3880 4462 5555 27 630 1455 1615 2861
10/01/2011 13:00 71.60 7384 2031 3 3.5 4.5 3.5 3 3293 3880 4462 5555 27 630 1455 1615 2861
10/01/2011 14:00 71.76 7856 2043 3 3.5 4.5 3.5 3 3293 3880 4462 5555 27 630 1455 1615 2861
10/01/2011 15:00 71.91 8411 2054 3 3.5 4.5 3.5 3 3437 4138 4409 5128 28 779 1497 1594 2566
10/01/2011 16:00 72.08 6568 2121 3 4 4.5 3.5 3 3453 4160 4841 5574 29 785 1501 1999 3008
10/01/2011 17:00 72.23 5116 2244 3 4 5 4 3 3464 4170 3887 4474 30 785 1501 1105 1884
10/01/2011 18:00 72.34 5286 2365 3.5 4 5 4 3.5 3464 4170 3887 4474 30 785 1501 1105 1884
10/01/2011 19:00 72.42 4946 2482 3.5 4.5 5 4.5 3.5 3464 4170 3887 4474 30 785 1501 1105 1884
10/01/2011 20:00 72.50 4920 2657 4.5 4.5 5 4.5 4 3439 4139 3820 4411 31 779 1497 1063 1837
10/01/2011 21:00 72.55 5026 2662 4.5 4.5 5 4.5 4 3439 4139 3820 4411 31 779 1497 1063 1837
10/01/2011 22:00 72.60 4488 2666 4.5 4.5 5 4.5 4 3439 4139 3820 4411 31 779 1497 1063 1837

WMAwater – Response to Submissions to “Review of Hydraulic Modelling” Report
20
Date and Time Wivenhoe
Lake Level
(mAHD)
Assumed Dam
Inflow (m3/s)
“Scenario C”
Dam Outlofw
(m3/s)
Gate Settings (m) Predicted Total Peak Flows INCLUDING
Wivenhoe Releases (m3/s)
Seqwater
Operational
Spreadsheet
“Run No”
Predicted Total Peak Flows EXCLUDING
Wivenhoe Releases (m3/s)
1 2 3 4 5
Lowood
(without
forecast
rain)
Moggill
(without
forecast
rain)
Lowood
(with
forecast
rain)
Moggill
(with
forecast
rain)
Lowood
(without
forecast
rain)
Moggill
(without
forecast
rain)
Lowood
(with
forecast
rain)
Moggill
(with
forecast
rain)
10/01/2011 23:00 72.65 4574 2670 4.5 4.5 5 4.5 4 3439 4139 3820 4411 31 779 1497 1063 1837
11/01/2011 00:00 72.69 4654 2673 4.5 4.5 5 4.5 4 3586 4196 4009 4504 32 892 1554 1265 1918
11/01/2011 01:00 72.74 4175 2677 4.5 4.5 5 4.5 4 3586 4196 4009 4504 32 892 1554 1265 1918
11/01/2011 02:00 72.77 3594 2680 4.5 4.5 5 4.5 4 3616 4196 4010 4567 33 896 1554 1233 1940
11/01/2011 03:00 72.80 4388 2682 4.5 4.5 5 4.5 4 3634 4196 4017 4593 34 905 1554 1231 1942
11/01/2011 04:00 72.83 4974 2685 4.5 4.5 5 4.5 4 3522 4139 3849 4489 35 780 1497 1055 1811
11/01/2011 05:00 72.87 5866 2689 4.5 4.5 5 4.5 4 3522 4139 3849 4489 35 780 1497 1055 1811
11/01/2011 06:00 72.94 6817 2696 4.5 4.5 5 4.5 4 4899 5155 4432 5035 36 1314 1626 1596 2326
11/01/2011 07:00 73.02 6802 2704 4.5 4.5 5 4.5 4 4899 5155 4432 5035 36 1314 1626 1596 2326
11/01/2011 08:00 73.12 8060 2713 4.5 4.5 5 4.5 4 5362 5803 5814 6468 37 1751 2318 2126 3005
11/01/2011 09:00 73.23 9165 2934 4.5 5 5.5 5 4.5 5362 5803 5814 6468 37 1751 2318 2126 3005
11/01/2011 10:00 73.37 10376 3282 5.5 5.5 5.5 5.5 5.5 6796 7596 7788 9202 38 2368 3424 3061 4949
11/01/2011 11:00 73.53 9606 3467 5.5 6 6 6 5.5 6796 7596 7788 9202 38 2368 3424 3061 4949
11/01/2011 12:00 73.69 10120 3596 6 6 6 6 6 6796 7596 7788 9202 38 2368 3424 3061 4949
11/01/2011 13:00 73.84 11561 3615 6 6 6 6 6 8037 9080 8779 10555 39 2996 4406 3563 5768
11/01/2011 14:00 74.01 9739 3917 6.5 6.5 6.5 6.5 6.5 8484 9707 9125 11090 40 3421 4993 3963 6335
11/01/2011 15:00 74.17 9055 3937 6.5 6.5 6.5 6.5 6.5 7359 8584 7990 9960 40 3421 4993 3963 6335
11/01/2011 16:00 74.30 8947 4238 7 7 7 7 7 7640 8791 8274 10242 40 3421 4993 3963 6335
11/01/2011 17:00 74.42 8196 4252 7 7 7 7 7 7640 8791 8274 10242 40 3421 4993 3963 6335

WMAwater – Response to Submissions to “Review of Hydraulic Modelling” Report
21
Date and Time Wivenhoe
Lake Level
(mAHD)
Assumed Dam
Inflow (m3/s)
“Scenario C”
Dam Outlofw
(m3/s)
Gate Settings (m) Predicted Total Peak Flows INCLUDING
Wivenhoe Releases (m3/s)
Seqwater
Operational
Spreadsheet
“Run No”
Predicted Total Peak Flows EXCLUDING
Wivenhoe Releases (m3/s)
1 2 3 4 5
Lowood
(without
forecast
rain)
Moggill
(without
forecast
rain)
Lowood
(with
forecast
rain)
Moggill
(with
forecast
rain)
Lowood
(without
forecast
rain)
Moggill
(without
forecast
rain)
Lowood
(with
forecast
rain)
Moggill
(with
forecast
rain)
11/01/2011 18:00 74.52 7141 4553 7.5 7.5 7.5 7.5 7.5 7920 8923 8560 10526 40 3421 4993 3963 6335
11/01/2011 19:00 74.59 6876 4564 7.5 7.5 7.5 7.5 7.5 8102 9456 8706 10707 41 3542 5534 4020 6914
11/01/2011 20:00 74.65 7060 4863 8 8 8 8 8 8375 9552 8996 10821 41 3542 5534 4020 6914
11/01/2011 21:00 74.70 6797 4872 8 8 8 8 8 10329 11356
42 3542 5535
11/01/2011 22:00 74.75 6229 5170 8.5 8.5 8.5 8.5 8.5 9313 10211
42 3542 5535
11/01/2011 23:00 74.78 5964 5176 8.5 8.5 8.5 8.5 8.5 9313 10211
42 3542 5535
12/01/2011 00:00 74.80 5052 5180 8.5 8.5 8.5 8.5 8.5 9287 10129
42 3542 5535
12/01/2011 01:00 74.81 4750 5182 8.5 8.5 8.5 8.5 8.5 8661 9516
42 3542 5535
12/01/2011 02:00 74.80 4096 5180 8.5 8.5 8.5 8.5 8.5 8635 9516
42 3542 5535
12/01/2011 03:00 74.78 4638 5177 8.5 8.5 8.5 8.5 8.5 8490 9516
42 3542 5535
12/01/2011 04:00 74.77 4190 4884 8 8 8 8 8 8490 9516
42 3542 5535
12/01/2011 05:00 74.75 4083 4303 7 7 7 7 7 8490 9516
42 3542 5535
12/01/2011 06:00 74.74 3984 3723 6 6 6 6 6 8490 9516
42 3542 5535
12/01/2011 07:00 74.74 3694 3141 5 5 5 5 5 8490 9516
42 3542 5535
12/01/2011 08:00 74.75 2473 2544 3.5 4 5 4 3.5 8490 9516
43 3542 5535
12/01/2011 09:00 74.76 2510 2544 3.5 4 5 4 3.5 8490 9516
43 3542 5535
12/01/2011 10:00 74.76 2804 2544 3.5 4 5 4 3.5 8490 9516
43 3542 5535
12/01/2011 11:00 74.76 2730 2544 3.5 4 5 4 3.5 8490 9516
43 3542 5535
12/01/2011 12:00 74.76 3025 2545 3.5 4 5 4 3.5 8490 9516
43 3542 5535
WMAwater – Response to Submissions to “Review of Hydraulic Modelling” Report
22
Date and Time Wivenhoe
Lake Level
(mAHD)
Assumed Dam
Inflow (m3/s)
“Scenario C”
Dam Outlofw
(m3/s)
Gate Settings (m) Predicted Total Peak Flows INCLUDING
Wivenhoe Releases (m3/s)
Seqwater
Operational
Spreadsheet
“Run No”
Predicted Total Peak Flows EXCLUDING
Wivenhoe Releases (m3/s)
1 2 3 4 5
Lowood
(without
forecast
rain)
Moggill
(without
forecast
rain)
Lowood
(with
forecast
rain)
Moggill
(with
forecast
rain)
Lowood
(without
forecast
rain)
Moggill
(without
forecast
rain)
Lowood
(with
forecast
rain)
Moggill
(with
forecast
rain)
12/01/2011 13:00 74.77 3098 2545 3.5 4 5 4 3.5 8490 9516
43 3542 5535
12/01/2011 14:00 74.78 2145 2546 3.5 4 5 4 3.5 8490 9516
43 3542 5535
12/01/2011 15:00 74.78 2880 2546 3.5 4 5 4 3.5 8490 9516
43 3542 5535
12/01/2011 16:00 74.78 2511 2546 3.5 4 5 4 3.5 8490 9516
43 3542 5535
12/01/2011 17:00 74.79 2476 2546 3.5 4 5 4 3.5 8490 9516
43 3542 5535
12/01/2011 18:00 74.79 3136 2546 3.5 4 5 4 3.5 8490 9516
43 3542 5535
12/01/2011 19:00 74.79 2513 2546 3.5 4 5 4 3.5 8490 9516
43 3542 5535
12/01/2011 20:00 74.80 2329 2547 3.5 4 5 4 3.5 8490 9516
43 3542 5535
12/01/2011 21:00 74.79 2072 2547 3.5 4 5 4 3.5 8490 9516
43 3542 5535
12/01/2011 22:00 74.79 2108 2546 3.5 4 5 4 3.5 8490 9516
43 3542 5535
12/01/2011 23:00 74.78 2107 2545 3.5 4 5 4 3.5 8490 9516
43 3542 5535
13/01/2011 00:00 74.77 2143 2545 3.5 4 5 4 3.5 8490 9516
43 3542 5535
13/01/2011 01:00 74.76 1848 2544 3.5 4 5 4 3.5 8490 9516
43 3542 5535
13/01/2011 02:00 74.74 1887 2543 3.5 4 5 4 3.5 8490 9516
43 3542 5535
13/01/2011 03:00 74.73 1891 2542 3.5 4 5 4 3.5 8490 9516
43 3542 5535
13/01/2011 04:00 74.71 1890 2541 3.5 4 5 4 3.5 8490 9516
43 3542 5535
13/01/2011 05:00 74.70 1888 2540 3.5 4 5 4 3.5 8490 9516
43 3542 5535
13/01/2011 06:00 74.68 1887 2539 3.5 4 5 4 3.5 8490 9516
43 3542 5535
13/01/2011 07:00 74.67 1922 2539 3.5 4 5 4 3.5 8490 9516
43 3542 5535

WMAwater – Response to Submissions to “Review of Hydraulic Modelling” Report
23
Date and Time Wivenhoe
Lake Level
(mAHD)
Assumed Dam
Inflow (m3/s)
“Scenario C”
Dam Outlofw
(m3/s)
Gate Settings (m) Predicted Total Peak Flows INCLUDING
Wivenhoe Releases (m3/s)
Seqwater
Operational
Spreadsheet
“Run No”
Predicted Total Peak Flows EXCLUDING
Wivenhoe Releases (m3/s)
1 2 3 4 5
Lowood
(without
forecast
rain)
Moggill
(without
forecast
rain)
Lowood
(with
forecast
rain)
Moggill
(with
forecast
rain)
Lowood
(without
forecast
rain)
Moggill
(without
forecast
rain)
Lowood
(with
forecast
rain)
Moggill
(with
forecast
rain)
13/01/2011 08:00 74.66 1631 2538 3.5 4 5 4 3.5 8490 9516
43 3542 5535
13/01/2011 09:00 74.64 1629 2536 3.5 4 5 4 3.5 8490 9516
43 3542 5535
13/01/2011 10:00 74.62 1918 2535 3.5 4 5 4 3.5 8490 9516
43 3542 5535
13/01/2011 11:00 74.60 1917 2534 3.5 4 5 4 3.5 8490 9516
43 3542 5535
13/01/2011 12:00 74.59 1589 2533 3.5 4 5 4 3.5 8490 9516
44 3542 5535
13/01/2011 13:00 74.57 1938 2591 3.5 4.5 5 4 3.5 8490 9516
44 3542 5535
13/01/2011 14:00 74.55 2359 2649 3.5 4.5 5 4.5 3.5 8490 9516
44 3542 5535
13/01/2011 15:00 74.54 1451 2649 4 4.5 5 4 3.5
44 3542 5535
13/01/2011 16:00 74.52 1677 2767 4 4.5 5 4.5 4
44 3542 5535
13/01/2011 17:00 74.50 1817 2824 4.5 4.5 5 4.5 4
44 3542 5535
13/01/2011 18:00 74.47 1231 2881 4.5 4.5 5 4.5 4.5
44 3542 5535
13/01/2011 19:00 74.44 2062 2996 4.5 5 5 5 4.5
44 3542 5535
13/01/2011 20:00 74.41 1530 3111 5 5 5 5 5
44 3542 5535
13/01/2011 21:00 74.38 1679 3222 5 5.5 5.5 5 5
44 3542 5535
13/01/2011 22:00 74.34 2091 3275 5 5.5 5.5 5.5 5
44 3542 5535
13/01/2011 23:00 74.31 1534 3329 5.5 5.5 5.5 5.5 5
44 3542 5535
14/01/2011 00:00 74.28 1667 3383 5.5 5.5 5.5 5.5 5.5
44 3542 5535
14/01/2011 01:00 74.24 1767 3436 5.5 5.5 6 5.5 5.5
44 3542 5535
14/01/2011 02:00 74.20 1572 3489 5.5 6 6 5.5 5.5
44 3542 5535

WMAwater – Response to Submissions to “Review of Hydraulic Modelling” Report
24
Date and Time Wivenhoe
Lake Level
(mAHD)
Assumed Dam
Inflow (m3/s)
“Scenario C”
Dam Outlofw
(m3/s)
Gate Settings (m) Predicted Total Peak Flows INCLUDING
Wivenhoe Releases (m3/s)
Seqwater
Operational
Spreadsheet
“Run No”
Predicted Total Peak Flows EXCLUDING
Wivenhoe Releases (m3/s)
1 2 3 4 5
Lowood
(without
forecast
rain)
Moggill
(without
forecast
rain)
Lowood
(with
forecast
rain)
Moggill
(with
forecast
rain)
Lowood
(without
forecast
rain)
Moggill
(without
forecast
rain)
Lowood
(with
forecast
rain)
Moggill
(with
forecast
rain)
14/01/2011 03:00 74.16 1339 3541 5.5 6 6 6 5.5
44 3542 5535
14/01/2011 04:00 74.11 1653 3535 5.5 6 6 6 5.5
44 3542 5535
14/01/2011 05:00 74.06 1648 3530 5.5 6 6 6 5.5
44 3542 5535
14/01/2011 06:00 74.02 1338 3525 5.5 6 6 6 5.5
44 3542 5535
14/01/2011 07:00 73.97 1659 3519 5.5 6 6 6 5.5
44 3542 5535
14/01/2011 08:00 73.92 1616 3513 5.5 6 6 6 5.5
44 3542 5535
14/01/2011 09:00 73.87 1612 3507 5.5 6 6 6 5.5
44 3542 5535
14/01/2011 10:00 73.83 1640 3502 5.5 6 6 6 5.5
44 3542 5535
14/01/2011 11:00 73.79 1399 3496 5.5 6 6 6 5.5
44 3542 5535
14/01/2011 12:00 73.74 1163 3491 5.5 6 6 6 5.5
44 3542 5535
14/01/2011 13:00 73.69 1193 3485 5.5 6 6 6 5.5
44 3542 5535
14/01/2011 14:00 73.63 1151 3479 5.5 6 6 6 5.5
44 3542 5535
14/01/2011 15:00 73.58 1386 3472 5.5 6 6 6 5.5
44 3542 5535
14/01/2011 16:00 73.52 1705 3466 5.5 6 6 6 5.5
44 3542 5535
14/01/2011 17:00 73.48 1090 3460 5.5 6 6 6 5.5
44 3542 5535
14/01/2011 18:00 73.43 1392 3454 5.5 6 6 6 5.5
44 3542 5535
14/01/2011 19:00 73.37 1715 3502 6 6 6 6 5.5
44 3542 5535
14/01/2011 20:00 73.33 1399 3496 6 6 6 6 5.5
44 3542 5535
14/01/2011 21:00 73.28 1441 3491 6 6 6 6 5.5
44 3542 5535

WMAwater – Response to Submissions to “Review of Hydraulic Modelling” Report
25
Date and Time Wivenhoe
Lake Level
(mAHD)
Assumed Dam
Inflow (m3/s)
“Scenario C”
Dam Outlofw
(m3/s)
Gate Settings (m) Predicted Total Peak Flows INCLUDING
Wivenhoe Releases (m3/s)
Seqwater
Operational
Spreadsheet
“Run No”
Predicted Total Peak Flows EXCLUDING
Wivenhoe Releases (m3/s)
1 2 3 4 5
Lowood
(without
forecast
rain)
Moggill
(without
forecast
rain)
Lowood
(with
forecast
rain)
Moggill
(with
forecast
rain)
Lowood
(without
forecast
rain)
Moggill
(without
forecast
rain)
Lowood
(with
forecast
rain)
Moggill
(with
forecast
rain)
14/01/2011 22:00 73.23 1482 3485 6 6 6 6 5.5
44 3542 5535
14/01/2011 23:00 73.18 1202 3479 6 6 6 6 5.5
44 3542 5535
15/01/2011 00:00 73.13 1229 3472 6 6 6 6 5.5
44 3542 5535
15/01/2011 01:00 73.07 1259 3465 6 6 6 6 5.5
44 3542 5535
15/01/2011 02:00 73.02 997 3458 6 6 6 6 5.5
44 3542 5535
15/01/2011 03:00 72.97 1087 3506 6 6 6 6 6
44 3542 5535
15/01/2011 04:00 72.91 1078 3499 6 6 6 6 6
44 3542 5535
15/01/2011 05:00 72.86 1071 3492 6 6 6 6 6
44 3542 5535
15/01/2011 06:00 72.80 1079 3485 6 6 6 6 6
44 3542 5535
15/01/2011 07:00 72.75 1085 3479 6 6 6 6 6
44 3542 5535
15/01/2011 08:00 72.70 1075 3472 6 6 6 6 6
44 3542 5535
15/01/2011 09:00 72.64 1066 3465 6 6 6 6 6
44 3542 5535
15/01/2011 10:00 72.59 1094 3513 6 6 6.5 6 6
44 3542 5535
15/01/2011 11:00 72.54 1365 3505 6 6 6.5 6 6
44 3542 5535
15/01/2011 12:00 72.48 1355 3498 6 6 6.5 6 6
44 3542 5535
15/01/2011 13:00 72.42 1084 3490 6 6 6.5 6 6
44 3542 5535
15/01/2011 14:00 72.35 1151 3481 6 6 6.5 6 6
44 3542 5535
15/01/2011 15:00 72.29 899 3472 6 6 6.5 6 6
44 3542 5535
15/01/2011 16:00 72.21 862 3463 6 6 6.5 6 6
44 3542 5535

WMAwater – Response to Submissions to “Review of Hydraulic Modelling” Report
26
Date and Time Wivenhoe
Lake Level
(mAHD)
Assumed Dam
Inflow (m3/s)
“Scenario C”
Dam Outlofw
(m3/s)
Gate Settings (m) Predicted Total Peak Flows INCLUDING
Wivenhoe Releases (m3/s)
Seqwater
Operational
Spreadsheet
“Run No”
Predicted Total Peak Flows EXCLUDING
Wivenhoe Releases (m3/s)
1 2 3 4 5
Lowood
(without
forecast
rain)
Moggill
(without
forecast
rain)
Lowood
(with
forecast
rain)
Moggill
(with
forecast
rain)
Lowood
(without
forecast
rain)
Moggill
(without
forecast
rain)
Lowood
(with
forecast
rain)
Moggill
(with
forecast
rain)
15/01/2011 17:00 72.14 1487 3503 6 6.5 6.5 6 6
44 3542 5535
15/01/2011 18:00 72.07 971 3494 6 6.5 6.5 6 6
44 3542 5535
15/01/2011 19:00 72.01 527 3485 6 6.5 6.5 6 6
44 3542 5535
15/01/2011 20:00 71.93 491 3475 6 6.5 6.5 6 6
44 3542 5535
15/01/2011 21:00 71.86 1154 3465 6 6.5 6.5 6 6
44 3542 5535
15/01/2011 22:00 71.79 1943 3506 6 6.5 6.5 6.5 6
44 3542 5535
15/01/2011 23:00 71.74 1406 3499 6 6.5 6.5 6.5 6
44 3542 5535
16/01/2011 00:00 71.69 956 3492 6 6.5 6.5 6.5 6
44 3542 5535
16/01/2011 01:00 71.63 1009 3484 6 6.5 6.5 6.5 6
44 3542 5535
16/01/2011 02:00 71.56 1043 3475 6 6.5 6.5 6.5 6
44 3542 5535
16/01/2011 03:00 71.50 767 3466 6 6.5 6.5 6.5 6
44 3542 5535
16/01/2011 04:00 71.43 1093 3505 6.5 6.5 6.5 6.5 6
44 3542 5535
16/01/2011 05:00 71.36 1080 3496 6.5 6.5 6.5 6.5 6
44 3542 5535
16/01/2011 06:00 71.30 838 3488 6.5 6.5 6.5 6.5 6
44 3542 5535
16/01/2011 07:00 71.23 908 3479 6.5 6.5 6.5 6.5 6
44 3542 5535
16/01/2011 08:00 71.16 677 3469 6.5 6.5 6.5 6.5 6
44 3542 5535
16/01/2011 09:00 71.09 510 3508 6.5 6.5 6.5 6.5 6.5
44 3542 5535
16/01/2011 10:00 71.01 488 3496 6.5 6.5 6.5 6.5 6.5
44 3542 5535
16/01/2011 11:00 70.93 911 3484 6.5 6.5 6.5 6.5 6.5
44 3542 5535

WMAwater – Response to Submissions to “Review of Hydraulic Modelling” Report
27
Date and Time Wivenhoe
Lake Level
(mAHD)
Assumed Dam
Inflow (m3/s)
“Scenario C”
Dam Outlofw
(m3/s)
Gate Settings (m) Predicted Total Peak Flows INCLUDING
Wivenhoe Releases (m3/s)
Seqwater
Operational
Spreadsheet
“Run No”
Predicted Total Peak Flows EXCLUDING
Wivenhoe Releases (m3/s)
1 2 3 4 5
Lowood
(without
forecast
rain)
Moggill
(without
forecast
rain)
Lowood
(with
forecast
rain)
Moggill
(with
forecast
rain)
Lowood
(without
forecast
rain)
Moggill
(without
forecast
rain)
Lowood
(with
forecast
rain)
Moggill
(with
forecast
rain)
16/01/2011 12:00 70.85 1355 3473 6.5 6.5 6.5 6.5 6.5
44 3542 5535
16/01/2011 13:00 70.79 1106 3511 6.5 6.5 7 6.5 6.5
44 3542 5535
16/01/2011 14:00 70.73 1173 3501 6.5 6.5 7 6.5 6.5
44 3542 5535
16/01/2011 15:00 70.66 1007 3491 6.5 6.5 7 6.5 6.5
44 3542 5535
16/01/2011 16:00 70.60 360 3528 6.5 7 7 6.5 6.5
44 3542 5535
16/01/2011 17:00 70.52 428 3515 6.5 7 7 6.5 6.5
44 3542 5535
16/01/2011 18:00 70.43 602 3499 6.5 7 7 6.5 6.5
44 3542 5535
16/01/2011 19:00 70.35 1010 3486 6.5 7 7 6.5 6.5
44 3542 5535
16/01/2011 20:00 70.27 1301 3522 6.5 7 7 7 6.5
44 3542 5535
16/01/2011 21:00 70.20 827 3512 6.5 7 7 7 6.5
44 3542 5535
16/01/2011 22:00 70.14 634 3500 6.5 7 7 7 6.5
44 3542 5535
16/01/2011 23:00 70.06 624 3442 6.5 7 7 7 6
44 3542 5535
17/01/2011 00:00 69.98 632 3428 6.5 7 7 7 6
44 3542 5535
17/01/2011 01:00 69.90 700 3415 6.5 7 7 7 6
44 3542 5535
17/01/2011 02:00 69.82 0 3402 6.5 7 7 7 6
44 3542 5535
17/01/2011 03:00 69.73 253 3388 6.5 7 7 7 6
44 3542 5535
17/01/2011 04:00 69.64 724 3373 6.5 7 7 7 6
44 3542 5535
17/01/2011 05:00 69.56 160 3359 6.5 7 7 7 6
44 3542 5535
17/01/2011 06:00 69.47 734 3345 6.5 7 7 7 6
44 3542 5535

WMAwater – Response to Submissions to “Review of Hydraulic Modelling” Report
28
Date and Time Wivenhoe
Lake Level
(mAHD)
Assumed Dam
Inflow (m3/s)
“Scenario C”
Dam Outlofw
(m3/s)
Gate Settings (m) Predicted Total Peak Flows INCLUDING
Wivenhoe Releases (m3/s)
Seqwater
Operational
Spreadsheet
“Run No”
Predicted Total Peak Flows EXCLUDING
Wivenhoe Releases (m3/s)
1 2 3 4 5
Lowood
(without
forecast
rain)
Moggill
(without
forecast
rain)
Lowood
(with
forecast
rain)
Moggill
(with
forecast
rain)
Lowood
(without
forecast
rain)
Moggill
(without
forecast
rain)
Lowood
(with
forecast
rain)
Moggill
(with
forecast
rain)
17/01/2011 07:00 69.38 239 3331 6.5 7 7 7 6
44 3542 5535
17/01/2011 08:00 69.30 0 3317 6.5 7 7 7 6
44 3542 5535
17/01/2011 09:00 69.21 751 3301 6.5 7 7 7 6
44 3542 5535
17/01/2011 10:00 69.12 293 3286 6.5 7 7 7 6
44 3542 5535
17/01/2011 11:00 69.04 0 3272 6.5 7 7 7 6
44 3542 5535
17/01/2011 12:00 68.94 268 3257 6.5 7 7 7 6
44 3542 5535
17/01/2011 13:00 68.85 759 3241 6.5 7 7 7 6
44 3542 5535
17/01/2011 14:00 68.76 1309 3144 6.5 6.5 6.5 6.5 6.5
44 3542 5535
17/01/2011 15:00 68.70 806 3047 6 6.5 6.5 6.5 6
44 3542 5535
17/01/2011 16:00 68.64 0 2953 6 6 6.5 6 6
44 3542 5535
17/01/2011 17:00 68.56 919 2899 6 6 6 6 6
44 3542 5535
17/01/2011 18:00 68.48 574 2672 5.5 5.5 5.5 5.5 5.5
44 3542 5535
17/01/2011 19:00 68.42 424 2577 5 5.5 5.5 5.5 5
44 3542 5535
17/01/2011 20:00 68.35 786 2482 5 5 5.5 5 5
44 3542 5535
17/01/2011 21:00 68.29 545 2388 5 5 5 5 4.5
44 3542 5535
17/01/2011 22:00 68.24 0 2295 4.5 5 5 4.5 4.5
44 3542 5535
17/01/2011 23:00 68.17 0 2200 4.5 4.5 5 4.5 4
44 3542 5535
18/01/2011 00:00 68.10 981 2101 4 4.5 5 4.5 3.5
44 3542 5535
18/01/2011 01:00 68.05 828 2096 4 4.5 5 4.5 3.5
44 3542 5535

WMAwater – Response to Submissions to “Review of Hydraulic Modelling” Report
29
Date and Time Wivenhoe
Lake Level
(mAHD)
Assumed Dam
Inflow (m3/s)
“Scenario C”
Dam Outlofw
(m3/s)
Gate Settings (m) Predicted Total Peak Flows INCLUDING
Wivenhoe Releases (m3/s)
Seqwater
Operational
Spreadsheet
“Run No”
Predicted Total Peak Flows EXCLUDING
Wivenhoe Releases (m3/s)
1 2 3 4 5
Lowood
(without
forecast
rain)
Moggill
(without
forecast
rain)
Lowood
(with
forecast
rain)
Moggill
(with
forecast
rain)
Lowood
(without
forecast
rain)
Moggill
(without
forecast
rain)
Lowood
(with
forecast
rain)
Moggill
(with
forecast
rain)
18/01/2011 02:00 68.02 834 2092 4 4.5 5 4.5 3.5
44 3542 5535
18/01/2011 03:00 67.98 881 2087 4 4.5 5 4.5 3.5
44 3542 5535
18/01/2011 04:00 67.94 510 2083 4 4.5 5 4.5 3.5
44 3542 5535
18/01/2011 05:00 67.89 136 2079 4 4.5 5 4.5 3.5
44 3542 5535
18/01/2011 06:00 67.83 195 2073 4 4.5 5 4.5 3.5
44 3542 5535
18/01/2011 07:00 67.77 126 2066 4 4.5 5 4.5 3.5
44 3542 5535
18/01/2011 08:00 67.71 715 2059 4 4.5 5 4.5 3.5
44 3542 5535
18/01/2011 09:00 67.66 775 1966 3.5 4.5 5 4 3.5
44 3542 5535
18/01/2011 10:00 67.62 425 1873 3.5 4 5 4 3
44 3542 5535
18/01/2011 11:00 67.58 570 1781 3 4 4.5 4 3
44 3542 5535
18/01/2011 12:00 67.53 488 1689 3 3.5 4.5 3.5 3
44 3542 5535
18/01/2011 13:00 67.49 243 1593 2.5 3.5 4.5 3.5 2.5
44 3542 5535
18/01/2011 14:00 67.45 0 1498 2.5 3 4.5 3 2.5
44 3542 5535
18/01/2011 15:00 67.41 247 1495 2.5 3 4.5 3 2.5
44 3542 5535
18/01/2011 16:00 67.36 1032 1491 2.5 3 4.5 3 2.5
44 3542 5535
18/01/2011 17:00 67.33 570 1489 2.5 3 4.5 3 2.5
44 3542 5535
18/01/2011 18:00 67.31 223 1488 2.5 3 4.5 3 2.5
44 3542 5535
18/01/2011 19:00 67.27 231 1485 2.5 3 4.5 3 2.5
44 3542 5535
18/01/2011 20:00 67.23 603 1482 2.5 3 4.5 3 2.5
44 3542 5535

WMAwater – Response to Submissions to “Review of Hydraulic Modelling” Report
30
Date and Time Wivenhoe
Lake Level
(mAHD)
Assumed Dam
Inflow (m3/s)
“Scenario C”
Dam Outlofw
(m3/s)
Gate Settings (m) Predicted Total Peak Flows INCLUDING
Wivenhoe Releases (m3/s)
Seqwater
Operational
Spreadsheet
“Run No”
Predicted Total Peak Flows EXCLUDING
Wivenhoe Releases (m3/s)
1 2 3 4 5
Lowood
(without
forecast
rain)
Moggill
(without
forecast
rain)
Lowood
(with
forecast
rain)
Moggill
(with
forecast
rain)
Lowood
(without
forecast
rain)
Moggill
(without
forecast
rain)
Lowood
(with
forecast
rain)
Moggill
(with
forecast
rain)
18/01/2011 21:00 67.20 755 1435 2.5 3 4.5 2.5 2.5
44 3542 5535
18/01/2011 22:00 67.17 235 1341 2.5 2.5 4.5 2.5 2
44 3542 5535
18/01/2011 23:00 67.14 188 1244 2 2.5 4.5 2.5 1.5
44 3542 5535
19/01/2011 00:00 67.11 46 1152 1.5 2.5 4 2.5 1.5
44 3542 5535
19/01/2011 01:00 67.07 302 1056 1.5 2 4 2 1.5
44 3542 5535
19/01/2011 02:00 67.04 609 958 1 2 4 2 1
44 3542 5535
19/01/2011 03:00 67.02 96 861 1 1.5 4 1.5 1
44 3542 5535
19/01/2011 04:00 67.01 0 762 0.5 1.5 4 1.5 0.5
44 3542 5535
19/01/2011 05:00 66.98 244 665 0.5 1 4 1 0.5
44 3542 5535
19/01/2011 06:00 66.96 466 567 0 1 4 1 0
44 3542 5535
19/01/2011 07:00 66.95 319 469 0 0.5 4 0.5 0
44 3542 5535
19/01/2011 08:00 66.95 228 377 0 0.5 3.5 0 0
44 3542 5535
19/01/2011 09:00 66.94 136 284 0 0 3 0 0
44 3542 5535