women, marriage, and social security benefits revisited security bulletin • vol. 67 • no. 4 •...
TRANSCRIPT

SocialSecurityBulletin•Vol.67•No.4•2007
Summary and IntroductionIntroduced into the Social Security program in 1939, spouse and survivor benefits have impor-tant implications for the retirement experience of women. At the end of 2005, 12.9 million women Social Security beneficiaries aged 62 or older (59 percent) received at least part of their benefit as wives or widows of entitled workers.1 For these women, a spouse or widow benefit provided a larger payment than that of their own earnings record (SSA 2007, Table 5.A14).
A number of dynamic factors influence the number of women (and men) eligible for, and claiming, Social Security spouse or survivor benefits at retirement. Past and present marital status determines potential benefit eligibil-ity (typically, one must be currently married, widowed, or have had a 10-year marriage to qualify), and the benefit amount is based on a person’s lifetime earnings record in relation to a current or former spouse. This article focuses on the marital history component of eligibility, while acknowledging that large-scale changes in women’s workforce attachment over the past half century, such as increases in labor market participation and earnings relative to men, have led to an increase in the share of women retirees receiving at least part of their benefit based on their own earnings record.
The connection between marital history and eligibility for spouse or widow benefits is of increasing interest among policymakers and
retirement analysts (Favreault and Steuerle 2007; Harrington Meyer, Wolf, and Himes 2006). Although marital trends have begun to stabilize in the United States in recent years (for example, divorce rates appear to have leveled off), an extensive literature documents dramatic changes in the marital patterns of women over the past several decades. Notable changes include increases in divorce, decreases in marriage durations, and a rise in the number of women who delay or forgo marriage.2 From a retirement perspective, shifting marital pat-terns are important as they may mean that the share of women with the option of claiming a spouse or widow benefit at retirement may change as well. For example, recent trends show higher proportions of never-married women in the population (Tamborini 2007), which would reduce the share of women potentially eligible for spouse or widow ben-efits by the time they reach retirement age.
Since marital histories help establish whether spouse or widow benefits will be a retirement income option for women in old age, it is important to track marital trends, particularly as the leading edge of the baby-boom generation begins retiring. This article uses data from the 2001 Marital History Topical Module (wave 2) to the U.S. Census Bureau’s Survey of Income and Program Participation (SIPP) to examine the extent to which marital patterns are changing among different age groups of women. The SIPP
Women, Marriage, and Social Security Benefits Revisitedby Christopher R. Tamborini and Kevin Whitman
The authors are with the Office of Retirement and Disability Policy, Social Security Administration.

2 SocialSecurityBulletin•Vol.67•No.4•2007
Marital History Module is considered one of the best surveys to gauge recent marital patterns, especially since the National Center for Health Statistics and the Current Population Survey no longer collect compre-hensive data on marriage and divorce. Thanks to an agreement with the U.S. Census Bureau, the Social Security Administration has access to a Restricted-Use File of the Marital History Module, which contains the year and month of marital transition events (mar-riage, divorce, widow). This information is impor-tant because it allows for the estimation of length of marriages, an important component of this article’s analysis.3
To explore how marital patterns have changed over the past 15 years, the article also draws on data reported in Iams and Ycas (1988), which is based on the U.S. Census Bureau’s 1985 Marital History Supplement to the Current Population Survey (CPS).4 To facilitate comparability between the 2001 SIPP data analyzed in this article and the 1985 CPS data reported in Iams and Ycas’ work, women are grouped into three age cohorts: Older Age (ages 60 to 69 in the year of analysis), Late Middle Age (ages 50 to 59 in the year of analysis), and Middle Age (ages 40 to 49 in the year of analysis).
Altogether, the article highlights important linkages between sociodemographic trends in marital patterns, the Social Security program, and its beneficiaries. By comparing the marital histories of women aged 40 to 69 in 2001 to similarly aged women in 1985, the article provides an indication of how marital trends are changing and how such changes may impact the extent to which spouse and widow benefits will be an option for future women retirees. Results indicate that the majority of women aged 40 to 69 in 2001 (over three-fourths) already had marital histories that will guar-antee them the option of a spouse or widow benefit at retirement. However, a smaller proportion of these women would be potentially eligible to receive spouse or widow benefits compared with their counterparts in 1985 due to changes in current marital status or past marital duration. The magnitude of change between 1985 and 2001 varies markedly by age cohort, with the smallest shift in marital patterns having occurred among the Older Age and Late Middle Age groups and the most dramatic among the Middle Age group. Notable shifts, by and large, reflect marital pattern changes in the younger wave of the large baby-boom cohort and include a rise in the share of divorced women with shorter marriages (less than 10 years) and never-married women.
Women and Social Security Auxiliary BenefitsThe retirement security of women is a clear concern among policymakers and retirement analysts. Although women’s economic situation at old age has improved greatly over the past 30 years, women are still more likely than men to experience old-age poverty; partly because women earn less over their lifetimes and live longer than men. In 2004, the poverty rate for women aged 65 or older was 12 percent, compared with 7 per-cent for men (SSA 2006, Table 8.1).
Established in the 1939 Social Security Amend-ments, spouse and widow(er) benefits, sometimes called dependent or auxiliary benefits, provide monthly payments to qualified spouses and survi-vors of insured workers (Martin and Weaver 2005).5 Receipt of a Social Security auxiliary benefit is contingent on two main factors: marital status/history and lifetime earnings relative to a current or previous spouse. This link between benefit eligibility and mari-tal history has become increasingly important given recent evidence of changing marital patterns among the baby-boom and younger birth cohorts (Butrica and Iams 2000; Favreault and Steuerle 2007; Goldstein and Kenney 2001; Harrington Meyer, Wolf, and Himes 2006; Kreider and Simmons 2003).
Table 1 summarizes the current marital require-ments for spouse and widow benefits. Under current law, married women are eligible for a spouse benefit at retirement age. The benefit equals 50 percent of their spouse’s primary insurance amount (PIA) if claimed at the full retirement age (FRA). Divorcees may be eligible for a divorced spouse benefit based on their previous spouse’s lifetime earnings provided that they had a 10-year (120 months) marriage. If a woman qualifies for benefits based on her own work record and her spouse’s work record, she will receive the higher amount of the two (her own PIA or 50 percent of her husband’s PIA). Qualifying spouse beneficiaries must be married to the retiring spouse for at least one continuous year prior to applying for benefits, with certain exceptions.6
The Social Security program also provides ben-efits to widow(er)s of deceased workers.7 The benefit for widow(er)s can equal 100 percent of a deceased spouse’s PIA if the surviving spouse begins to collect benefits at the FRA. A reduced benefit (from 71 per-cent to 99 percent of the deceased’s PIA) is available as early as age 60 (age 50 if disabled).8 Divorced surviving spouses may also qualify if their marriage

SocialSecurityBulletin•Vol.67•No.4•2007 �
lasted at least 10 years. Qualifying widow(er)s must have been married to the deceased spouse for at least 9 months and have not remarried before the age of 60 (50 if disabled) (SSA 2007b). Since these duration requirements are fairly short, this article assumes that they have been met.
It is important to note that spouse and widow benefit rules have been modified over time.9 The 1939 Social Security Amendments originally established a spouse benefit equal to one-half of the retired-worker benefit of the present spouse and a survivor’s benefit equal to three-fourths of the deceased spouse’s worker benefit. Benefits were extended to divorced widows with children and dependent widowers in the 1950 amendments. In 1965, divorced wives and surviving divorced spouses without children became eligible for payments, but there was a dependency and a 20-year length of marriage requirement.10 Congress raised widow(er)s benefits in 1972 from 82.5 percent of the deceased worker’s benefit to 100 percent (Martin and Weaver 2005). In 1977, the length of marriage requirement was reduced from 20 years (240 months) to 10 years (120 months), and remarried women were allowed to receive a regular survivor benefit from the deceased spouse’s record if the remarriage occurred after age 60 (age 50 if disabled).
To date, Social Security spouse and widow ben-efits remain a major source of income for elderly women (Butrica, Iams, and Sandell 1999; Favreault, Sammartino, and Steuerle 2002; Favreault and Steuerle 2007; Harrington Meyer, Wolf, and Himes 2006; Weaver 1997). As shown in Chart 1, over the past 45 years the majority of women Social Security beneficiaries aged 62 or older received a benefit based at least partly on the earnings record of their spouse or previous spouse, 61 percent (4.1 million) in 1960 and 59 percent (12.9 million) in 2005.11
That said, increased labor market participation among women and a rise in their earnings relative to men (Blau, Ferber, and Winkler 2006; Bureau of Labor Statistics 2005; Clark and Weismantle 2003),12 have led to a decline in the share of women receiving ben-efits as wives or widows only, and correspondingly, an increase in the share of dually entitled women—that is, women who qualify for benefits as retired workers and as spouses and surviving spouses. This development is highlighted in Chart 1, which shows that between 1960 and 1985, the share of female beneficiaries aged 62 or older who were dually entitled grew from 5 percent to 20 percent. By 2005, 28 percent of women beneficia-ries 62 or older were dually entitled; 12 percent therein were dually entitled spouses (2.7 million) and 16 per-cent were dually entitled widows (3.5 million).13 The
Retired-worker benefit Auxiliary benefit
Must have at least 40 quarters of covered employment
Yes, up to 50 percent of spouse's PIA if spouse is still living. a
Must have at least 40 quarters of covered employment
Yes, up to 100 percent of deceased spouse's PIA. b
Must have at least 40 quarters of covered employment
Yes, if spouse is living, benefits for married or separated women apply, if spouse deceased, widow benefits apply.
Must have at least 40 quarters of covered employment None
a.
b.
Divorced with 10 years of marriage to an insured former spouse?
Divorced with less than 10 years of marriage
Marital history/status
Table 1.Entitlement to auxiliary and retired-worker benefits at retirement age, by marital history
Currently married or separated
Widowed
If person is entitled to a spousal and retired-worker benefit, then the beneficiary is said to be dually entitled. If the spouse benefit exceeds his/her own retired-worker benefit, then the full retired-worker benefit is paid with the difference between the retired worker and spouse benefit added to the benefit amount.
Widows can also be dually entitled. To qualify for survivor benefit, a person must be unmarried or have remarried at or after age 60.
SOURCE: Authors' compilation based on Iams and Ycas (1988, Table 2).

4 SocialSecurityBulletin•Vol.67•No.4•2007
average monthly benefit in 2005 for women aged 65 or older who were dually entitled spouse beneficiaries was $601 and for dually entitled survivor benefi-ciaries it was $1,131; for spouse-only beneficiaries the monthly benefit averaged $507, and for widow-only beneficiaries the average was $969 (SSA 2007, Table 5.A15).
Women’s Marital Patterns, 1985 and 2001The estimates reported in this article are based on a Restricted-Use File of the 2001 Marital History Module to the U.S. Census Bureau’s Survey of Income and Program Participation (SIPP).14
Data
The SIPP is a household survey of the civilian non-institutionalized resident U.S. population made up of a series of panels, each of which represents a new sample. The 2001 panel began in 2001 and extended
through 2003 with interviews conducted every 4 months. The survey can be used as a longitudinal sample or cross-sectional study, as is done here.
SIPP’s topical modules represent a variety of top-ics and are implemented on a rotating basis in survey panels. In this article, we rely on data from the Marital History Module, which was administered in wave two (the second interview) of the 2001 panel. The supple-ment is designed to collect comprehensive informa-tion on the marital histories of persons, families, and households in the United States. Note that, because marital event dates are suppressed in the Public-Use File of the 2001 Marital History Module, the following analysis relies on a Restricted-Use File, which contains the dates (in year and months) at which a respondent’s marriage (up to three) began and ended. Such infor-mation allows us to estimate length of marriage(s), an important factor determining potential eligibility for Social Security auxiliary benefits. Similar to other
Chart 1.Percentage distribution of women Social Security beneficiaries aged 62 or olderby type of benefit, 1960–2005
SOURCE: Social Security Administration, Master Beneficiary Record. Reported in SSA 2007 (Table 5.A14).
NOTES: All data for 2005 and dual entitlement data for 1995 and 2000 are based on a 10-percent sample. All other years are100 percent data.
Worker benefits excludes special age-72 beneficiaries and disabled adult children. Dually entitled includes disabled workers.
Widow-only beneficiaries include disabled widows and mothers.
0
5
10
15
20
25
30
35
40
45
1960 1970 1975 1980 1985 1990 1995 2000 2005
Year
Retired-only Spouse-only Widow-only Dually entitled/spouse Dually entitled/widow
Percentage

SocialSecurityBulletin•Vol.67•No.4•2007 �
topical modules, the marital history module is col-lected in combination with the core questionnaire, which covers general demographic, socioeconomic, and program participation information across all waves of each panel. All users of restricted-use data must be granted permission by the U.S. Census Bureau and the Social Security Administration, and the data must be drawn for research purposes only.15
To ascertain how women’s marital histories are changing, the article also draws on data from the June 1985 Marital History Supplement to the U.S. Census Bureau’s Current Population Survey (CPS), as reported by Iams and Ycas (1988). An important asset of this data is that the marital his-tory supplement questions were essentially the same questions used in the 2001 SIPP panel. In both cases, women were asked a sequence of similar questions relating to the dates that marriage events started and ended, in months and years (up to three marriages).16 Given that the Current Population Survey (after 1995) and the National Center for Health Statistics no longer collect comprehensive data on marriage and divorce, the SIPP Marital History Module represents one of the best available microlevel data sources to gauge recent marital trends.
All declarations of numeric change between 1985 and 2001 have undergone statistical tests of differ-ence, and only those differences that are statistically
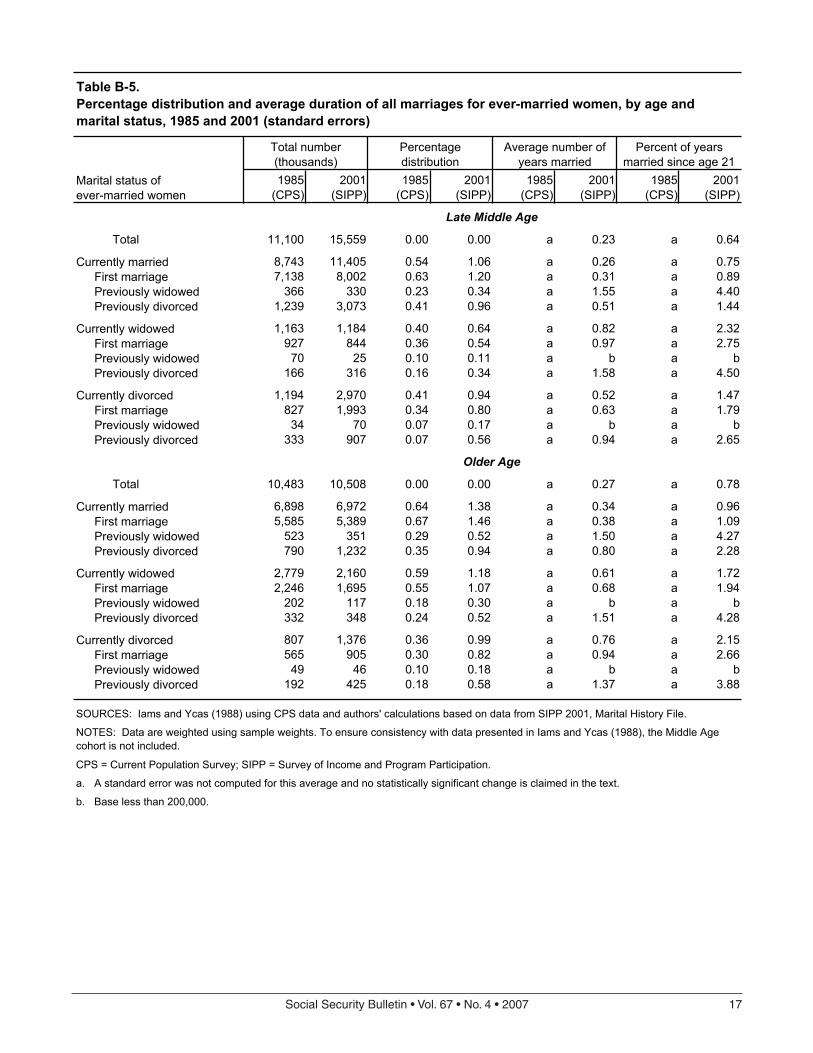
significant at a 95-percent level are cited.17 To lessen the magnitude of sampling error, statistics from a weighted population base of less than 200,000 are not reported. Nevertheless, particular caution should be used when comparing differences between estimated percentages across data sources. Appendix A discusses the methodological issues of this study in greater detail. Appendix B provides the standard errors of the estimates reported in this article. All estimates are weighted using the final person weights supplied in the data set.
Tables 2–6 report the results, which are organized by age cohort, beginning with the Older Age group.
Older Age Cohort: Age 60–69
The Older Age cohort in 2001 is comprised of women born between 1932 and 1941. Women’s marital histo-ries at this age are particularly salient as these women have already reached, or are on the verge of, retirement age. As a starting point, the share of Older Age women potentially eligible for spouse or widow benefits on the basis of current marital status was determined (Table 2). In 2001, 63.7 percent of Older Age women were currently married (including separated) and 19.7 percent were widows, compared with 63.0 per-cent and 25.4 percent, respectively, in 1985 (Table 2).18
In terms of women who would not be potentially eligible for spouse or widow benefits, Table 2 shows
1985(CPS)
2001(SIPP)
1985(CPS)
2001(SIPP)
1985(CPS)
2001(SIPP)
Total number (thousands) 13,168 22,036 11,570 16,626 10,950 10,956
Never-married 5.5 10.5 4.1 6.4 4.3 4.1Married 73.1 66.5 72.6 65.8 61.3 61.3Separated 4.0 3.8 3.0 2.9 1.7 2.4Widowed 3.5 2.4 10.1 7.1 25.4 19.7Divorced 13.9 16.8 10.3 17.9 7.4 12.6
None 5.5 10.5 4.1 6.4 4.3 4.1One 73.6 65.1 76.9 65.2 76.7 72.9Two 17.3 19.8 16.1 22.1 15.7 17.4Three or more 3.7 4.7 3.0 6.3 3.4 5.6
CPS = Current Population Survey; SIPP = Survey of Income and Program Participation.
Middle Age Late Middle Age Older Age
SOURCES: Iams and Ycas (1988) using CPS data and authors’ calculations of SIPP 2001, Marital History File.
NOTES: Data are weighted using sample weights.
Table 2.Percentage distribution of women, by marital status and total number of marriages, age,and survey, 1985 and 2001
Marital status total marriages
Marital Status
Total number of marriages
6 SocialSecurityBulletin•Vol.67•No.4•2007
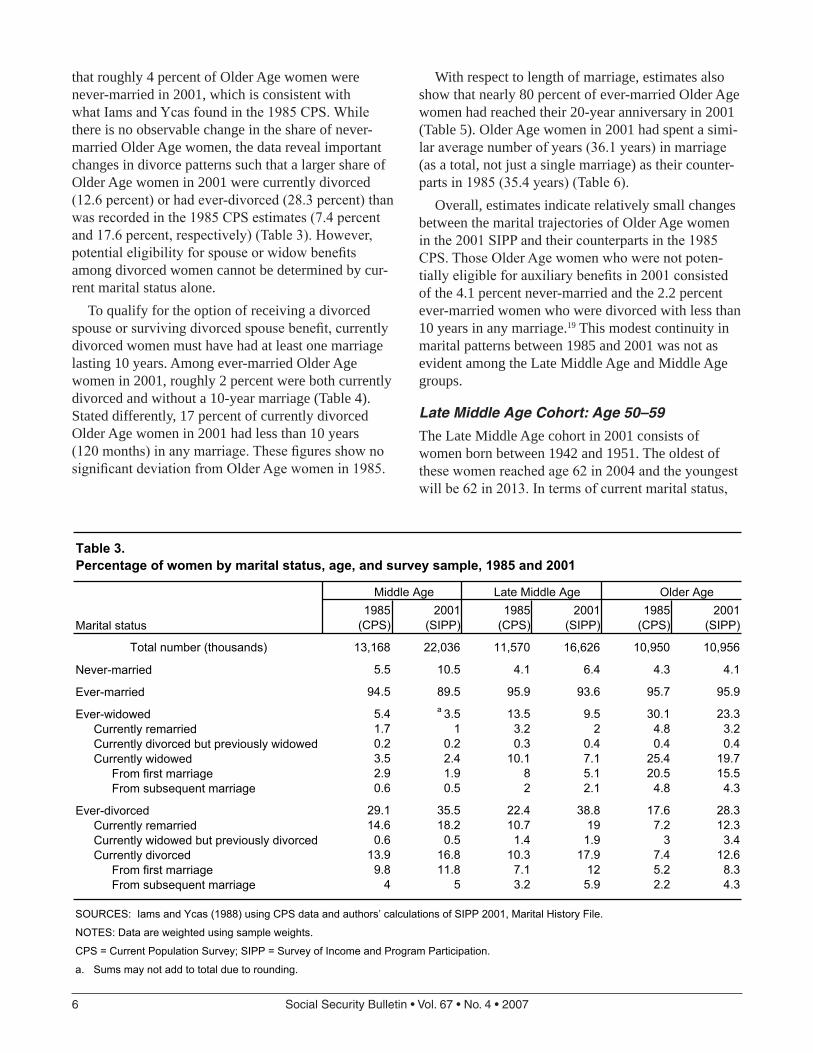
that roughly 4 percent of Older Age women were never-married in 2001, which is consistent with what Iams and Ycas found in the 1985 CPS. While there is no observable change in the share of never- married Older Age women, the data reveal important changes in divorce patterns such that a larger share of Older Age women in 2001 were currently divorced (12.6 percent) or had ever-divorced (28.3 percent) than was recorded in the 1985 CPS estimates (7.4 percent and 17.6 percent, respectively) (Table 3). However, potential eligibility for spouse or widow benefits among divorced women cannot be determined by cur-rent marital status alone.
To qualify for the option of receiving a divorced spouse or surviving divorced spouse benefit, currently divorced women must have had at least one marriage lasting 10 years. Among ever-married Older Age women in 2001, roughly 2 percent were both currently divorced and without a 10-year marriage (Table 4). Stated differently, 17 percent of currently divorced Older Age women in 2001 had less than 10 years (120 months) in any marriage. These figures show no significant deviation from Older Age women in 1985.
With respect to length of marriage, estimates also show that nearly 80 percent of ever-married Older Age women had reached their 20-year anniversary in 2001 (Table 5). Older Age women in 2001 had spent a simi-lar average number of years (36.1 years) in marriage (as a total, not just a single marriage) as their counter-parts in 1985 (35.4 years) (Table 6).
Overall, estimates indicate relatively small changes between the marital trajectories of Older Age women in the 2001 SIPP and their counterparts in the 1985 CPS. Those Older Age women who were not poten-tially eligible for auxiliary benefits in 2001 consisted of the 4.1 percent never-married and the 2.2 percent ever-married women who were divorced with less than 10 years in any marriage.19 This modest continuity in marital patterns between 1985 and 2001 was not as evident among the Late Middle Age and Middle Age groups.
Late Middle Age Cohort: Age 50–59
The Late Middle Age cohort in 2001 consists of women born between 1942 and 1951. The oldest of these women reached age 62 in 2004 and the youngest will be 62 in 2013. In terms of current marital status,
1985(CPS)
2001(SIPP)
1985(CPS)
2001(SIPP)
1985(CPS)
2001(SIPP)
Total number (thousands) 13,168 22,036 11,570 16,626 10,950 10,956
5.5 10.5 4.1 6.4 4.3 4.1
94.5 89.5 95.9 93.6 95.7 95.9
5.4 a 3.5 13.5 9.5 30.1 23.31.7 1 3.2 2 4.8 3.20.2 0.2 0.3 0.4 0.4 0.43.5 2.4 10.1 7.1 25.4 19.72.9 1.9 8 5.1 20.5 15.50.6 0.5 2 2.1 4.8 4.3
29.1 35.5 22.4 38.8 17.6 28.314.6 18.2 10.7 19 7.2 12.3
0.6 0.5 1.4 1.9 3 3.413.9 16.8 10.3 17.9 7.4 12.6
9.8 11.8 7.1 12 5.2 8.34 5 3.2 5.9 2.2 4.3
a.
Ever-widowedCurrently remarriedCurrently divorced but previously widowed
Table 3.Percentage of women by marital status, age, and survey sample, 1985 and 2001
Marital status
Never-married
Ever-married
Currently remarried
From subsequent marriage
Currently divorced
NOTES: Data are weighted using sample weights.
Sums may not add to total due to rounding.
SOURCES: Iams and Ycas (1988) using CPS data and authors’ calculations of SIPP 2001, Marital History File.
CPS = Current Population Survey; SIPP = Survey of Income and Program Participation.
Middle Age Late Middle Age Older Age
Currently widowed but previously divorced
From subsequent marriage
From first marriage
Currently widowedFrom first marriage
Ever-divorced

SocialSecurityBulletin•Vol.67•No.4•2007 7
Tota
lnu
mbe
r(th
ousa
nds)
Per
cent
of
curr
ently
divo
rced
Per
cent
of
ever
-mar
ried
Tota
lnu
mbe
r(th
ousa
nds)
Per
cent
of
curr
ently
divo
rced
Per
cent
of
ever
-mar
ried
Tota
lnu
mbe
r(th
ousa
nds)
Per
cent
of
curr
ently
divo
rced
Per
cent
of
ever
-mar
ried
Tota
l eve
r-m
arrie
d12
,443
. . .
. . .
11,1
00. .
.. .
.10
,483
. . .
. . .
1,82
710
0.0
14.7
1,19
410
0.0
10.8
806
100.
07.
71,
296
70.9
10.4
827
69.3
7.5
565
70.1
5.4
261.
40.
234
2.8
0.3
496.
10.
550
527
.64.
133
327
.93.
019
223
.81.
8
597
32.7
4.8
265
22.2
2.4
146
18.1
1.4
352
19.3
2.8
161
13.5
1.5
9011
.20.
911
0.6
0.1
60.
50.
18
1.0
0.1
234
12.8
1.9
988.
20.
948
6.0
0.5
1,23
067
.39.
992
977
.88.
466
081
.96.
394
451
.77.
666
655
.86.
047
558
.94.
515
0.8
0.1
282.
30.
340
5.0
0.4
271
14.8
2.2
235
19.7
2.1
145
18.0
1.4
Tota
l eve
r-m
arrie
d19
,715
. . .
. . .
15,5
59. .
.. .
.10
,508
. . .
. . .
3,70
410
0.0
18.8
2,97
010
0.0
19.1
1,37
610
0.0
13.1
2,59
770
.113
.21,
993
67.1
12.8
905
65.8
8.6
320.
90.
270
2.4
0.5
463.
40.
41,
075
29.0
5.5
907
30.5
5.8
425
30.9
4.1
1,90
451
.49.
792
031
.06.
023
517
.02.
21,
200
32.4
6.1
522
17.6
3.4
168
12.2
1.6
130.
40.
112
0.4
0.1
130.
90.
169
018
.63.
538
513
.02.
554
3.9
0.5
1,80
148
.69.
22,
050
69.1
13.3
1,14
182
.910
.81,
397
37.7
7.1
1,47
149
.59.
573
753
.57.
019
0.5
0.1
582.
00.
433
2.4
0.3
384
10.4
2.0
521
17.6
3.4
371
27.0
3.5
NO
TES
: Dat
a ar
e w
eigh
ted
usin
g sa
mpl
e w
eigh
ts.
. . .
= no
t app
licab
le.
Tabl
e 4.
Perc
enta
ge d
istr
ibut
ion
of c
urre
ntly
div
orce
d w
omen
, by
dura
tion
of m
arria
ge a
nd a
ge, 1
985
and
2001
2001
Tota
l cur
rent
ly d
ivor
ced
Firs
t mar
riage
O
lder
Age
Pre
viou
sly
wid
owed
Pre
viou
sly
divo
rced
1985
Mid
dle
Age
La
te M
iddl
e A
ge
Firs
t mar
riage
Pre
viou
sly
wid
owed
10 y
ears
or m
ore
in a
ny m
arria
geFi
rst m
arria
ge
10 y
ears
or m
ore
in a
ny m
arria
ge
Firs
t mar
riage
Pre
viou
sly
wid
owed
Pre
viou
sly
divo
rced
Pre
viou
sly
wid
owed
Pre
viou
sly
divo
rced
Firs
t mar
riage
Mar
ital s
tatu
s an
ddu
ratio
n of
mar
riage
Tota
l cur
rent
ly d
ivor
ced
Less
than
10
year
s in
any
mar
riage
Firs
t mar
riage
Pre
viou
sly
wid
owed
Pre
viou
sly
divo
rced
Pre
viou
sly
divo
rced
Less
than
10
year
s in
any
mar
riage
Pre
viou
sly
wid
owed
Pre
viou
sly
divo
rced
SO
UR
CE
S:
Iam
s an
d Y
cas
(198
8) u
sing
Cur
rent
Pop
ulat
ion
Sur
vey
data
and
aut
hors
' cal
cula
tions
usi
ng S
urve
y of
Inco
me
and
Pro
gram
Par
ticip
atio
n 20
01, M
arita
l His
tory
File
.

� SocialSecurityBulletin•Vol.67•No.4•2007
Total number(thousands)
Less than10 years
10 yearsor more
Less than20 years
20 yearsor more
Total 11,100 4.2 95.8 17.8 82.2
7,138 0.6 99.4 2.7 97.3366 5.9 94.1 45.5 54.5
1,239 3.0 97.0 44.2 55.8
927 7.1 92.9 25.2 74.870 11.7 88.3 54.1 45.9
166 11.9 88.1 55.7 44.3
827 19.5 80.5 53.0 47.034 16.7 83.3 60.7 39.3
333 29.4 70.6 74.2 25.8
Total 10,483 3.2 96.8 11.7 88.3
5,585 0.6 99.4 1.7 98.3523 0.8 99.2 16.9 83.1790 2.0 98.0 17.3 82.7
2,246 3.9 96.1 14.6 85.4202 5.5 94.5 27.9 72.1332 10.6 89.4 41.2 58.8
565 15.9 84.1 42.4 57.649 17.3 92.7 44.0 56.0
192 24.7 75.3 62.7 37.3Previously widowedPreviously divorced
Previously divorced
First marriagePreviously widowed
Currently divorcedFirst marriage
Previously widowed
First marriage
Previously divorced
Currently widowedFirst marriagePreviously widowed
Previously divorced
Currently married
Currently widowed
First marriage
Currently divorced
Previously divorced
Previously divorced
Table 5.Percentage distribution of longest marriage, for ever-married women, by age, 1985 and 2001
(Continued)
First marriage
Previously widowed
Older Age
Currently married
Duration of longest marriage
Late Middle Age
Previously widowed
1985
Marital status of ever-married women

SocialSecurityBulletin•Vol.67•No.4•2007 �
Total number(thousands)
Less than10 years
10 yearsor more
Less than20 years
20 yearsor more
Total 15,559 10.0 90.0 36.4 63.6
8,002 3.4 96.6 11.4 88.6330 3.4 96.6 61.8 38.2
3,073 7.3 92.7 61.2 38.8
844 9.2 90.8 28.0 72.025 a a a a
316 16.7 83.3 70.2 29.8
1,993 26.2 73.8 63.8 36.270 a a a a
907 42.5 57.5 95.9 4.1
Total 10,508 4.0 96.0 20.2 79.9
5,389 1.3 98.7 4.0 96.0350 3.4 96.6 34.2 65.8
1,232 1.6 98.4 35.1 64.9
1,695 3.6 96.4 15.4 84.6117 a a a a348 4.7 95.3 50.7 49.4
905 18.6 81.4 51.5 48.546 a a a a
425 12.7 87.3 78.4 21.6
a.
2001Late Middle Age
Currently married
NOTES: Data are weighted using sample weights. To ensure consistency with data presented in Iams and Ycas (1988), the Middle Agecohort is not included in Tables 5 and 6.
Table 5.Continued
Marital status of ever-married women
Duration of longest marriage
First marriagePreviously widowedPreviously divorced
Currently widowedFirst marriagePreviously widowedPreviously divorced
Currently divorcedFirst marriagePreviously widowedPreviously divorced
First marriage
Older Age
Currently marriedFirst marriagePreviously widowed
SOURCES: Iams and Ycas (1988) using Current Population Survey data and authors' calculations using the Survey of Income and Program Participation 2001, Marital History File.
Base less than 200,000.
Previously divorced
Previously widowedPreviously divorced
Currently widowedFirst marriagePreviously widowedPreviously divorced
Currently divorced

10 SocialSecurityBulletin•Vol.67•No.4•2007
1985(CPS)
2001(SIPP)
1985(CPS)
2001(SIPP)
1985(CPS)
2001(SIPP)
1985(CPS)
2001(SIPP)
Total 11,100 15,559 100.0 100.0 28.7 26.8 85.5 79.4
8,743 11,405 78.8 73.3 30.8 29.5 91.8 87.77,138 8,002 64.3 51.4 31.6 30.6 94.1 90.6
366 330 3.3 2.1 26.8 28.0 78.3 82.21,239 3,073 11.2 19.8 27.4 26.8 82.8 80.5
1,163 1,184 10.5 7.6 23.9 24.9 69.5 71.2927 844 8.4 5.4 24.2 25.1 70.3 71.8
70 25 0.6 0.2 21.0 a 61.8 a166 316 1.5 2.0 23.8 24.2 68.8 69.6
1,194 2,970 10.8 19.1 18.2 17.0 b 50.7827 1,993 7.5 12.8 18.1 16.3 54.2 48.7
34 70 0.3 0.5 21.1 a 62.0 a333 907 c 3.0 5.8 18.3 18.0 54.7 53.9
Total 10,483 10,508 100.0 100.0 35.4 36.1 82.0 82.5
6,898 6,972 65.8 66.3 39.1 40.4 90.9 92.45,585 5,389 53.3 51.3 40.0 41.6 92.9 95.0
523 351 5.0 3.3 35.2 37.0 81.6 83.7790 1,232 7.5 11.7 35.5 36.1 82.8 83.6
2,779 2,160 26.5 20.6 30.5 31.8 69.2 71.62,246 1,695 21.4 16.1 30.9 32.3 70.0 72.9
202 117 1.9 1.1 29.4 a 66.8 a332 348 3.2 3.3 28.4 30.2 65.3 68.3
807 1,376 7.7 13.1 21.3 21.4 50.0 49.3565 905 5.4 8.6 21.1 19.7 49.4 45.4
49 46 0.5 0.4 27.0 a 62.1 a 192 425 1.8 4.1 20.5 24.5 48.7 57.0
a.
b.
c.
Marital status ofever-married women
Previously widowedPreviously divorced
Currently widowedFirst marriagePreviously widowedPreviously divorced
Currently divorced
Currently married
Currently widowed
Previously widowedPreviously divorced
Currently divorcedFirst marriage
First marriage
CPS = Current Population Survey; SIPP = Survey of Income and Program Participation.
SOURCES: Iams and Ycas (1988) and authors' calculations of SIPP 2001, Marital History File.
Table 6.Percentage distribution and average duration of all marriages for ever-married women, by marital status, survey sample, and age, 1985 and 2001
Late Middle Age
Older Age
Previously widowed
First marriagePreviously widowedPreviously divorced
Total number(thousands)
Percentagedistribution
Average number of years married
Percent of years married since age 21
Figure is reported as ".3" in the original publication, but it is assumed that this is an error and "3.0" is the correct percentage based on the need for the three statuses reported to add up to the larger currently divorced category.
Previously divorced
First marriage
Base less than 200,000.
NOTES: Data are weighted using sample weights. To ensure consistency with data presented in Iams and Ycas (1988), the Middle Agecohort is not included in Tables 5 and 6.
Missing value in Iams and Ycas (1988).
Currently marriedFirst marriagePreviously widowedPreviously divorced

SocialSecurityBulletin•Vol.67•No.4•2007 11
Table 2 shows that 68.7 percent of Late Middle Age women in 2001 were potentially eligible for spouse or widow benefits as a result of being married or sepa-rated and 7.1 percent due to their current status as widows, which are lower than the equivalent percent-ages in the 1985 CPS data.20
Estimates also show that the share of this group who were never-married increased by more than 2 percentage points from 1985 to 2001(Table 2). While never-married women in this age group may change their current status by the time they reach retirement age, a first marriage between the ages of 50 to 59 is relatively unlikely. From 1985 to 2001, the median age at first marriage for women increased from 23.3 years to 25.1 years (U.S. Census Bureau 2005), which is 25 years younger than even the youngest members of the Late Middle Age cohort.
With respect to divorce, 38.8 percent of Late Middle Age women in the 2001 SIPP were ever-divorced (Table 3). This figure represents a substantial increase over the 22.4 percent of ever-divorced women in the 1985 CPS. Currently divorced women also repre-sented a larger share of the Late Middle Age group in 2001 than in 1985 (17.9 percent versus 10.3 percent, respectively). That said, remarriage remained com-mon among Late Middle Age women in 2001, with over half of the ever-divorced having at some point remarried.
The share of currently divorced Late Middle Age women without a 10-year marriage also increased between 1985 and 2001. In 2001, 31.0 percent of those who were currently divorced did not have a marriage that met the 10-year duration requirement, compared with 22.2 percent in 1985 (Table 4). Stated differ-ently, 6.0 percent of the ever-married Late Middle Age female population were currently divorced and without a 10-year marriage in 2001, up from the 2.4 percent reported in the 1985 CPS.
Many Late Middle Age women in 2001 had already been married for a long period of time; 63.6 percent of the ever-married had been married at least 20 years (Table 5). The average number of years married among Late Middle Age women in 2001, 26.8 years, is fairly similar to Iams and Ycas’ findings of 28.7 years for 1985 (Table 6).
Middle Age Cohort: Age 40–49
The Middle Age cohort represents the youngest age group considered in this study. In 2001, women in this group were born between 1952 and 1961 and
are thus reflective of the younger wave of the large baby-boom cohort born between 1946 and 1964. The oldest of this group in 2001 will reach age 62 in 2014 and the youngest in 2023. Since there is less certainty about the marital paths that the Middle Age group will take as they age into retirement, findings in this section should be regarded with caution when estimat-ing women’s potential eligibility for spouse or widow benefits between 2014 and 2023.
As shown in Table 2, 70.3 percent of Middle Age women in 2001 were currently married (including sep-arated), compared with 77.1 percent in the correspond-ing 1985 CPS estimates (Table 3).21 A particularly striking change between Middle Age women in 1985 and 2001 is the increasing share in the never-married population. Roughly 10.5 percent were never-married in 2001, while about half this amount was documented in the 1985 CPS data. An important consideration that will become evident in future years is whether mar-riage is simply being delayed until later in life among younger cohorts or avoided altogether (see Goldstein and Kenney 2001).
The experience of Middle Age women with divorce has also changed. In 2001, 16.8 percent were currently divorced and 35.5 percent had at least one divorce, up from 13.9 percent and 29.1 percent, respectively, from their 1985 predecessors (Table 3). Furthermore, 51.4 percent of currently divorced women aged 40 to 49 were without a 10-year marriage in 2001, up from 32.7 percent in 1985 (Table 4). Looking at the ever-married group, 9.7 percent of ever-married Middle Age women were divorced and without a qualifying marriage in 2001, compared with 4.8 percent in 1985 (Table 4). However, some of these currently ineligible women may remarry before retirement.
Concluding RemarksTrends in women’s retirement income have been a longstanding point of interest in the retirement litera-ture, and Social Security spouse and widow benefits constitute an important source of income for many aged women. Since marital history affects women’s potential eligibility for spouse and widow benefits, it is important to understand changes in marital trends in the context of Social Security rules, particularly as the leading edge of the baby-boom cohort begins retiring.
While caution should be used in interpreting differ-ences across data sources, this article highlights both important changes and continuities in women’s poten-tial eligibility for spouse and widow benefits since

12 SocialSecurityBulletin•Vol.67•No.4•2007
1985. On the one hand, despite important structural changes in marital patterns such as the “retreat from marriage” (Goldstein and Kenney 2001; Waite 1995), over three-fourths of women aged 40 to 69 in the 2001 SIPP already had marital histories that assured them the option for spouse or widow benefits at retirement. On the other hand, trends reveal a downward shift in the share of women potentially eligible for spouse or widow benefits in future years due to changing marital patterns among baby boomers. Changes are princi-pally evident for the Middle Age cohort (aged 40–49), which had a significantly higher share of never- married and divorced women with shorter marriages in 2001 than in 1985.
As a whole, this article contributes to our under-standing of sociodemographic trends affecting the Social Security program and distributional outcomes of its beneficiary population. Most aged women qualify for Social Security benefits as wives or widows today. However, a growing tendency toward never marrying, along with shorter marriages before divorce, among the younger wave of baby boomers may foreshadow a decline in the proportion of women that will be eligible for spouse or widow benefits in future years. These trends could have an important effect on the sources, and in some instances adequacy, of retire-ment income for some women, as well as the sociode-mographic profile of the overall beneficiary population for Social Security.
Appendix A: Methodological IssuesThis study’s analytic approach raises several method-ological issues for elaboration. To begin with, esti-mates based on the SIPP and CPS, as with any survey data, are subject to errors related to measurement and sampling, among other factors. Because estimates of women’s marital histories may differ from the actual population, a standard error for the estimated percent-ages was calculated for all reported estimates using the appropriate generalized variance tables for each survey.
Special care should be taken when making numeric contrasts based on two independent data sources. In this article, estimates of women’s marital histories from the 2001 SIPP are evaluated against estimates from the 1985 CPS on which the Iams and Ycas’ (1988) study is based. Although both of these surveys were conducted by the Census Bureau and represent large, nationally-representative samples of U.S. house-holds, they are designed to meet different objectives. Each survey, for example, has different sampling pro-
cedures, sample compositions, and survey reference periods, all of which affect the parameter estimates. The CPS data are based on a single cross-sectional study, whereas SIPP data are based on a longitudinal panel sample. A panel design can introduce nonsam-pling errors not found in cross-sectional samples, such as a “seam” effect (patterned heavy concentration of responses to adjacent months between waves) and a “historical maturity” effect.22 Another concern present in both surveys is the potential bias in respondents’ ret-rospective report of their marital histories (see Lillard and Waite 1989; Weaver 2000).
A number of steps were taken to lessen the negative impact of the aforementioned concerns. All declara-tions of numeric change between 1985 and 2001 have undergone statistical tests of difference. Only those numeric differences that are statistically significant at a 95-percent level are cited. Moreover, standard error calculations were based on generalized variance tables rather than the formula for random samples. The test of difference between two estimates accounts for, in part, the impact of the individual survey design. To further reduce the magnitude of error, statistics are derived from weighted data. Any statistic from a weighted population base of less than 200,000 is not reported.23
It is worthwhile to mention that although the esti-mates used in this article are derived from separate surveys, they are based on largely consistent supple-mental marital history modules. Both the SIPP and CPS surveys used a similar sequence of questions about marital history, focusing on events such as dura-tion of marriages (month and year of each marriage event) and number of times married. This consistency reduces potential bias arising in nonsampling errors between the SIPP and CPS.24 While estimates of mari-tal status from the CPS have been shown to be rather consistent with those from the SIPP,25 any numeric contrast between women’s marital histories in 2001 and their counterparts in 1985 should be interpreted as representing a broad directional shift in marital pat-terns, rather than an exact percentage change over the period of analysis.
Appendix B: Standard ErrorsThe following tables present the standard errors of estimated percentages reported in this article. They were approximated using the formula
( , ) ( )(100 )x p
b p pxs = −

SocialSecurityBulletin•Vol.67•No.4•2007 1�
1985(CPS)
2001(SIPP)
1985(CPS)
2001(SIPP)
1985(CPS)
2001(SIPP)
Total number (thousands) 13,168 22,036 11,570 16,626 10,950 10,956
0.27 0.62 0.25 0.57 0.27 0.57
0.27 0.62 0.25 0.57 0.27 0.57
0.27 0.37 0.44 0.68 0.60 1.210.16 0.20 0.23 0.33 0.28 0.500.05 0.09 0.07 0.15 0.08 0.180.22 0.31 0.39 0.60 0.57 1.140.20 0.28 0.35 0.51 0.53 1.040.09 0.14 0.18 0.33 0.28 0.58
0.55 0.97 0.53 1.13 0.50 1.290.42 0.78 0.40 0.91 0.34 0.940.09 0.14 0.15 0.32 0.22 0.520.42 0.75 0.39 0.89 0.35 0.950.36 0.65 0.33 0.75 0.29 0.790.24 0.44 0.23 0.55 0.19 0.58
Table B-2.Percentage distribution of women by marital status and age, 1985 and 2001 (standard errors)
Marital status
Never-married
Ever-married
Middle Age Late Middle Age Older Age
Ever-widowedCurrently remarried
Currently widowedFrom first marriageFrom subsequent marriage
From subsequent marriage
Ever-divorcedCurrently remarriedCurrently widowed but previously divorced
SOURCES: Iams and Ycas (1988) using CPS data and authors’ calculations based on data from SIPP 2001, Marital History File.
NOTES: CPS = Current Population Survey; SIPP = Survey of Income and Program Participation.
Currently divorced but previously widowed
Currently divorcedFrom first marriage
1985(CPS)
2001(SIPP)
1985(CPS)
2001(SIPP)
1985(CPS)
2001(SIPP)
Total number (thousands) 13,168 22,036 11,570 16,626 10,950 10,956
0.27 0.62 0.25 0.57 0.27 0.570.53 0.95 0.57 1.10 0.64 1.390.24 0.39 0.22 0.39 0.17 0.440.22 0.31 0.39 0.60 0.57 1.140.42 0.75 0.39 0.89 0.35 0.95
0.27 0.62 0.25 0.57 0.27 0.570.53 0.96 0.54 1.11 0.56 1.270.45 0.80 0.47 0.96 0.48 1.080.23 0.43 0.22 0.56 0.24 0.66
Never-marriedCurrent marital status
Number of marriages
Three or moreTwoOneNone
DivorcedWidowedSeparatedMarried
NOTES: CPS = Current Population Survey; SIPP = Survey of Income and Program Participation.
Table B-1.Percentage distribution of women, by current marital status and total number of marriages, age, and survey sample, 1985 and 2001 (standard errors)
Current marital status andtotal number of marriages
Middle Age Late Middle Age Older Age
SOURCES: Iams and Ycas (1988) using CPS data and authors’ calculations of SIPP 2001, Marital History File.
where x is the total number of persons, families, or households (the base of the percentage), p is the percentage, and b is the parameter associated with the characteristic in the numerator of the percentage. For parameters associated with estimated percentages
based on the 2001 SIPP Marital History Topical Mod-ule (wave 2) see U.S. Census Bureau (2005b, Table 9); for reported 1985 CPS estimates see U.S. Census Bureau (1986, Table C-5).

14 SocialSecurityBulletin•Vol.67•No.4•2007
Tota
lnu
mbe
r(th
ousa
nds)
Per
cent
of
curr
ently
divo
rced
Per
cent
of
ever
-mar
ried
Tota
lnu
mbe
r(th
ousa
nds)
Per
cent
of
curr
ently
divo
rced
Per
cent
of
ever
-mar
ried
Tota
lnu
mbe
r(th
ousa
nds)
Per
cent
of
curr
ently
divo
rced
Per
cent
of
ever
-mar
ried
Tota
l eve
r-m
arrie
d12
,443
. . .
. . .
11,1
00. .
.. .
.10
,483
. . .
. . .
1,82
70
0.44
1,19
40
0.41
806
00.
361,
296
1.47
0.38
827
1.84
0.34
565
2.22
0.30
260.
380.
0634
0.66
0.07
491.
160.
1050
51.
440.
2533
31.
790.
2219
22.
070.
18
597
1.51
0.26
265
1.66
0.20
146
1.87
0.16
352
1.27
0.20
161
1.36
0.16
901.
530.
1311
0.25
0.04
60.
280.
048
0.48
0.04
234
1.08
0.17
981.
100.
1248
1.15
0.10
1,23
01.
510.
3792
91.
660.
3666
01.
870.
3394
41.
610.
3366
61.
980.
3147
52.
390.
2815
0.29
0.04
280.
600.
0740
1.06
0.09
271
1.15
0.18
235
1.59
0.19
145
1.87
0.16
Tota
l eve
r-m
arrie
d19
,715
. . .
. . .
15,5
59. .
.. .
.10
,508
. . .
. . .
3,70
40
0.83
2,97
00
0.94
1,37
60
0.99
2,59
72.
250.
721,
993
2.58
0.80
905
3.83
0.82
320.
460.
1070
0.84
0.17
461.
460.
181,
075
2.23
0.49
907
2.53
0.56
425
3.73
0.58
1,90
42.
460.
6392
02.
540.
5723
53.
030.
431,
200
2.30
0.51
522
2.09
0.43
168
2.64
0.37
130.
310.
0712
0.35
0.08
130.
760.
0969
01.
910.
3938
51.
850.
3754
1.56
0.21
1,80
12.
460.
622,
050
2.54
0.82
1,14
13.
040.
911,
397
2.38
0.55
1,47
12.
750.
7073
74.
030.
7519
0.35
0.07
580.
770.
1533
1.24
0.16
384
1.50
0.30
521
2.09
0.43
371
3.58
0.54
SO
UR
CE
S:
Iam
s an
d Y
cas
(198
8) u
sing
Cur
rent
Pop
ulat
ion
Sur
vey
data
and
aut
hors
' cal
cula
tions
bas
ed o
n da
ta fr
om th
e S
urve
y of
Inco
me
and
Pro
gram
Par
ticip
atio
n 20
01, M
arita
l His
tory
Fi
le.P
revi
ousl
y w
idow
edP
revi
ousl
y di
vorc
ed
10 y
ears
or m
ore
in a
ny m
arria
ge
Pre
viou
sly
wid
owed
Firs
t mar
riage
Tabl
e B
-3.
Perc
enta
ge d
istr
ibut
ion
of c
urre
ntly
div
orce
d w
omen
, by
dura
tion
of m
arria
ge a
nd a
ge, 1
985
and
2001
(sta
ndar
d er
rors
)
Mid
dle
Age
La
te M
iddl
e A
ge
Firs
t mar
riage
O
lder
Age
Mar
ital s
tatu
s an
ddu
ratio
n of
mar
riage
Cur
rent
ly d
ivor
ced
1985
Pre
viou
sly
wid
owed
Pre
viou
sly
divo
rced
10 y
ears
or m
ore
in a
ny m
arria
geFi
rst m
arria
ge
Pre
viou
sly
wid
owed
Pre
viou
sly
divo
rced
Pre
viou
sly
wid
owed
Pre
viou
sly
divo
rced
Less
than
10
year
s in
any
mar
riage
Firs
t mar
riage
NO
TE:
. . .
= no
t app
licab
le.
2001
Cur
rent
ly d
ivor
ced
Firs
t mar
riage
Pre
viou
sly
wid
owed
Firs
t mar
riage
Pre
viou
sly
divo
rced
Less
than
10
year
s in
any
mar
riage
Pre
viou
sly
divo
rced

SocialSecurityBulletin•Vol.67•No.4•2007 1�
Total number(thousands)
Less than10 years
10 yearsor more
Less than20 years
20 yearsor more
Total 11,100 0.26 0.26 0.50 0.50
7,138 0.13 0.13 0.26 0.26366 1.70 1.70 3.59 3.59
1,239 0.67 0.67 1.95 1.95
927 1.16 1.16 1.97 1.9770 a a a a
166 3.47 3.47 5.32 5.32
827 1.90 1.90 2.39 2.3934 a a a a
333 3.44 3.44 3.31 3.31
Total 10,483 0.24 0.24 0.43 0.43
5,585 0.14 0.14 0.24 0.24523 0.54 0.54 2.26 2.26790 0.69 0.69 1.86 1.86
2,246 0.56 0.56 1.03 1.03202 a a a a332 2.33 2.33 3.73 3.73
565 2.12 2.12 2.87 2.8749 a a a a
192 4.29 4.29 4.81 4.81Previously widowed
First marriage
Currently divorcedFirst marriage
Table B-4.Percentage distribution of longest marriage for ever-married women, by age,1985 and 2001 (standard errors)
Previously divorced
1985
Marital status of ever-married women
Currently married
Previously widowedPreviously divorced
Late Middle Age
Older Age
Currently married
Currently widowedFirst marriagePreviously widowed
Previously widowed
First marriage
(Continued)
Previously divorced
Previously divorced
Previously widowed
First marriage
Previously divorced
Currently divorced
First marriagePreviously widowed
Currently widowed
Previously divorced

16 SocialSecurityBulletin•Vol.67•No.4•2007
Total number(thousands)
Less than10 years
10 yearsor more
Less than20 years
20 yearsor more
Total 15,559 0.72 0.72 1.15 1.15
8,002 0.61 0.61 1.06 1.06330 2.99 2.99 8.01 8.01
3,073 1.40 1.40 2.63 2.63
844 2.98 2.98 4.63 4.6325 a a a a
316 6.28 6.28 7.70 7.70
1,993 2.95 2.95 3.22 3.2270 a a a a
907 4.91 4.91 1.97 1.97
Total 10,508 0.57 0.57 1.17 1.17
5,389 0.46 0.46 0.80 0.80350 2.90 2.90 7.59 7.59
1,232 1.07 1.07 4.07 4.07
1,695 1.35 1.35 2.62 2.62117 a a a a348 3.40 3.40 8.02 8.02
905 3.87 3.87 4.97 4.9746 a a a a
425 4.84 4.84 5.98 5.98
a. Base less than 200,000.
Previously divorced
Currently widowedFirst marriagePreviously widowedPreviously divorced
Currently divorcedFirst marriage
SOURCES: Iams and Ycas (1988) using Current Population Survey data and authors' calculations using the Survey of Income and Program Participation 2001, Marital History File.
Currently marriedFirst marriage
Previously widowed
Previously widowedPreviously divorced
First marriagePreviously widowed
Currently marriedFirst marriagePreviously widowedPreviously divorced
2001
Duration of longest marriage
Table B-4.Continued
Marital status of ever-married women
Late Middle Age
Previously divorced
Currently divorcedFirst marriage
Older Age
Previously widowedPreviously divorced
Currently widowed
SocialSecurityBulletin•Vol.67•No.4•2007 17
1985(CPS)
2001(SIPP)
1985(CPS)
2001(SIPP)
1985(CPS)
2001(SIPP)
1985(CPS)
2001(SIPP)
Total 11,100 15,559 0.00 0.00 a 0.23 a 0.64
8,743 11,405 0.54 1.06 a 0.26 a 0.757,138 8,002 0.63 1.20 a 0.31 a 0.89
366 330 0.23 0.34 a 1.55 a 4.401,239 3,073 0.41 0.96 a 0.51 a 1.44
1,163 1,184 0.40 0.64 a 0.82 a 2.32927 844 0.36 0.54 a 0.97 a 2.75
70 25 0.10 0.11 a b a b166 316 0.16 0.34 a 1.58 a 4.50
1,194 2,970 0.41 0.94 a 0.52 a 1.47827 1,993 0.34 0.80 a 0.63 a 1.79
34 70 0.07 0.17 a b a b333 907 0.07 0.56 a 0.94 a 2.65
Total 10,483 10,508 0.00 0.00 a 0.27 a 0.78
6,898 6,972 0.64 1.38 a 0.34 a 0.965,585 5,389 0.67 1.46 a 0.38 a 1.09
523 351 0.29 0.52 a 1.50 a 4.27790 1,232 0.35 0.94 a 0.80 a 2.28
2,779 2,160 0.59 1.18 a 0.61 a 1.722,246 1,695 0.55 1.07 a 0.68 a 1.94
202 117 0.18 0.30 a b a b332 348 0.24 0.52 a 1.51 a 4.28
807 1,376 0.36 0.99 a 0.76 a 2.15565 905 0.30 0.82 a 0.94 a 2.66
49 46 0.10 0.18 a b a b 192 425 0.18 0.58 a 1.37 a 3.88
a.
b.
Currently widowed
Currently divorcedFirst marriage
Marital status ofever-married women
Currently married
Previously divorced
First marriage
NOTES: Data are weighted using sample weights. To ensure consistency with data presented in Iams and Ycas (1988), the Middle Agecohort is not included.
Previously widowed
Currently widowedFirst marriagePreviously widowedPreviously divorced
Currently divorced
SOURCES: Iams and Ycas (1988) using CPS data and authors' calculations based on data from SIPP 2001, Marital History File.
Previously widowedPreviously divorced
Previously divorced
Previously widowedPreviously divorced
First marriage
Table B-5.Percentage distribution and average duration of all marriages for ever-married women, by age and marital status, 1985 and 2001 (standard errors)
Late Middle Age
Older Age
Previously widowed
First marriagePreviously widowedPreviously divorced
Base less than 200,000.
Total number(thousands)
Percentagedistribution
Average number of years married
Percent of years married since age 21
A standard error was not computed for this average and no statistically significant change is claimed in the text.
Currently marriedFirst marriage
CPS = Current Population Survey; SIPP = Survey of Income and Program Participation.

1� SocialSecurityBulletin•Vol.67•No.4•2007
NotesAcknowledgments: The authors are thankful to
Howard M. Iams for his support of this project. David Weaver, Linda Maxfield, Susan Grad, and the reviewers pro-vided valuable comments and suggestions on earlier drafts of this article. Thuy Ho provided exceptional research sup-port. The findings and conclusions in this article are those of the authors and do not necessarily represent the views of the Social Security Administration. An earlier version of this work was presented at the 2007 meeting of the Population Association of America, New York City, New York.
1 Therein, 28 percent dually entitled (12 percent spouse benefit, 16 percent survivor), 11 percent spousal-only, and 19 percent survivor-only.
2 Divorce rates surged in the 1960s and 1970s in the United States, and have since stabilized at a relatively high level. For useful discussion of recent marital trends within the United States, see Butrica and Iams 2000; Goldstein 1999; Goldstein and Kenney 2001; Kreider 2005; Harrington Meyer et al. 2006; Norton and Miller 1992; Ruggles 1997; Waite 1995.
3 Marital event dates are suppressed in the Public-Use File of the 2001 Marital History Module. The public file therefore does not contain information that would allow estimates of each respondent’s length of marriage(s). To ensure confidentiality, all users of restricted data must be authorized by the U.S. Census Bureau.
4 The Marital History Supplement (June) to the Current Population Survey was discontinued after 1995.
5 The definition of auxiliary benefits used in this article follows the Social Security Administration’s Annual Statistical Supplement to the Social Security Bulletin. OASDI auxiliary benefits are defined as a “monthly benefit payable to a spouse or child of a retired or disabled worker, or to a survivor of a deceased worker” (SSA 2007, G.2).
6 There are duration requirements for spouse and survi-vor benefits based on current status, however the minimum standards for a marriage that is still active or ended through death are far shorter than the duration requirement for a divorced spousal benefit.
7 This article focuses on old-age benefits, not benefits paid based on having a child-in-care. We do not discuss mother’s benefits, which are “payable to a widow or surviv-ing divorced mother if (1) the deceased worker on whose account the benefit is paid was either fully or currently insured at the time of his death and (2) the entitled child of the worker is in her care and is under age 16 or disabled” (SSA 2007).
8 A widow benefit may be limited if the deceased spouse claimed early retirement benefits. The benefit is increased if the deceased spouse earned delayed retirement credits.
9 The 1939 Social Security Amendments also established survivor benefits for parents and minor children. Since 1939, benefits have been extended to disabled widows, divorced wives, and surviving divorced wives. Auxiliary benefits have become gender neutral (available to men) over time. The 1983 Amendments extended benefits to divorced widowers and eliminated the dependency test for all widow-ers. For review of legislative history of survivor benefits see Martin and Weaver (2005).
10 Public Law 84-880.11 These can include spouse-only, widow-only, dually
entitled spouse, and dually entitled widow benefits.12 According to Social Security administrative records,
there were 23,810,000 male workers (16 or older) with tax-able earnings in 1937 compared to 9,090,000 women (16 or older), a ratio of 2.62 men to every woman. By 1985, there were 66,113,000 male workers with taxable earnings and 53,687,000 female workers, a significantly lower ratio of 1.23 men for each woman. In 2001, this ratio declined to 1.12, with 82,006,000 male workers and 73,410,000 female workers with taxable earnings (SSA 2007, Table 4.B3). See also Fullerton 1999. With respect to earnings, in 2004, the median weekly earnings for women employed full time were 80 percent of men’s median earnings, an increase from 68 percent in 1984. Women still earn less on average than men and as a result remain much more likely than men to be eligible for an auxiliary benefit upon retirement, especially a dually entitled widow benefit (Butrica, Iams, and Sandell 1999, Chart 2).
13 In contrast, in 2005, 11 percent of female beneficiaries aged 62 or older were receiving spouse only (2.5 million) and 19 percent widow only (4.3 million) benefits.
14 The survey collected a marital history for every per-son of the household aged 15 or older between June and September 2001. The sample comprises 56,574 persons, or around 30,000 U.S. households. For more detailed informa-tion on survey methodology see Kreider (2005, 15-16).
15 To maintain confidentiality, marriage event dates in the SIPP were approximated by the Census. Bias would occur if the duration between start and finish systematically affects the 120-month (10 year) duration. We cannot know this, but suspect the process would even out in estimating marriage durations short and long of 120 months.
16 Both the SIPP and CPS universe cover the noninstitu-tionalized resident population living in the United States, however, only the CPS includes people living in military barracks.
17 Tests of difference between two sample estimates are based on the square root of the sum of the squares of the standard errors of each estimate considered separately.

SocialSecurityBulletin•Vol.67•No.4•2007 1�
18 Currently married women, however, are not guaranteed eligibility for a spouse or widow benefit if they divorce before retirement without a 10-year marriage. Likewise, some women who are currently divorced may be eligible for a divorced spouse or divorced widow benefit if they had been married for 10 years. To establish the population of women who have guaranteed potential eligibility for a spouse or widow benefit regardless of any future change in marital status such as divorce, we calculated the sum of those who are widowed, already divorced with a 10-year marriage, or currently married with at least one 10-year marriage. Results reveal that 92.8 percent of the women among the Older Age cohort in 2001 had marital histories that provided guaranteed potential eligibility for spouse or widow benefits (figure not included in Tables).
19 This estimate does not include currently married women who did have 10 years in any marriage. These women would not be eligible for spouse or widow benefits if they divorced before reaching their 10-year anniversary.
20 This figure underestimates the actual share of women potentially eligible because it excludes divorced women with 10 or more years in any marriage. The sum of those women with more than 10 years in any marriage or with qualifying widowhood shows that over three-fourths (85 percent) of Late Middle Age women in 2001 already have assured eligibility for auxiliary benefits (figure not included in Tables).
21 Notwithstanding, the sum of Middle Age women in 2001 that have already been married 10 years or with quali-fying widowhood revels that more than two-thirds (71 per-cent) already had a marital history that ensured eligibility for auxiliary benefits (figure not included in Tables).
22 The historical maturity effect refers to a situation in which respondents learn from earlier survey waves how to answer anticipated questions in order to shorten the inter-view and in the process compromise or at least put in ques-tion the content validity of responses. However, it should be recognized that the marital history information analyzed in this article is derived from a special module, which is not introduced on a regular basis.
23 This follows Kreider’s (2005) method from the same data source.
24 A variety of sources can account for nonsampling errors; for example, the inability to obtain information about all cases in the sample; definitional difficulties; differences in the interpretation of questions; inability or unwillingness on the part of the respondents to provide correct informa-tion; inability to recall information, errors made in the following: collection such as in recording or coding the data, processing the data, estimating values for missing data; biases resulting from the differing recall periods caused by the interviewing pattern used; and undercoverage (see U.S. Census Bureau 1998).
25 For example, the 1998 SIPP Quality Profile compares estimates of current marital status with results from the CPS across five SIPP panels. The results show estimates of mari-tal status between the two surveys to be largely consistent. For more information, see U.S. Census Bureau (1998).
ReferencesBlau, Francine D., Marianne Ferber, and Anne Winkler.
2006. The economics of women, men and work, 5th ed. Englewood Cliffs, NJ: Prentice Hall.
Bureau of Labor Statistics. 2005. Highlights of women’s earnings in 2004. Report 987, Washington, DC: U.S. Department of Labor, Available at http://www.bls .gov/cps/cpswom2004.pdf.
Butrica, Barbara A., and Howard M. Iams. 2000. Divorced women at retirement: Projections of economic well-being in the near future. Social Security Bulletin 63(3):3–12.
Butrica, Barbara A., Howard M. Iams, and Steven H. Sandell. 1999. Using data for couples to project the distributional effects of changes in Social Security policy. Social Security Bulletin 62(3): 20–27.
Clark, Sandra L., and Mai Weismantle. 2003. Employment status 2000. Census 2000 Brief, C2KBR-18. Washington, DC: U.S. Census Bureau. Available at http://www.census .gov/prod/2003pubs/c2kbr-18.pdf.
Favreault, Melissa M., and C. Eugene Steuerle. 2007. Social Security spouse and survivor benefits for the modern family. The Retirement Project, Discussion Paper 07-01. Washington, DC: The Urban Institute.
Favreault, Melissa M., Frank J. Sammartino, and C. Eugene Steuerle, eds. 2002. Social Security and the family. Washington, DC: The Urban Institute Press.
Fullerton, Howard N. Jr. 1999. Labor force participation: 75 years of change, 1950–1998 and 1998–2025. Monthly Labor Review: 3–12.
Goldstein, Joshua R. 1999. The Leveling of divorce in the United States. Demography 36(3):409–414.
Goldstein, Joshua, and Catherine Kenney. 2001. Marriage delayed or marriage forgone? New cohort forecasts of first marriage for U.S. women. American Sociological Review 66: 506–519.
Harrington Meyer, Madonna, Douglas A. Wolf, and Christine L. Himes. 2006. Declining eligibility for Social Security spouse and widow benefits in the United States? Research on Aging 28(2): 240–260.
Iams, Howard M., and Martynas A. Ycas. 1988. Women, marriage, and Social Security benefits. Social Security Bulletin 51(5): 3–9.
Kreider, Rose M., and Tavia Simmons. 2003. Marital status: 2000, Census 2000 Brief. Census Bureau Special Reports, C2KBR-30. Washington, DC: U.S. Census Bureau.
20 SocialSecurityBulletin•Vol.67•No.4•2007
Kreider, Rose M. 2005. Number, timing, and duration of marriages and divorces: 2001. Current Population Reports.: Washington DC: U.S. Census Bureau (February).
Lillard, Lee A., and Linda J. Waite. 1989. Panel Versus Retrospective Data on Marital Histories: Lessons from the PSID. In Individuals and Families in Transition: Understanding Change through Longitudinal Data. Washington DC: U.S. Census Bureau.
Martin, Patricia and David Weaver. 2005. Social Security: A program and policy history. Social Security Bulletin 66(1): 1–15.
Norton, Arthur J., and Louisa F. Miller. 1992. Marriage, divorce, and remarriage in the 1990s. Current Population Reports: Special Studies. Series P-23, No. 180. Washington, DC: U.S. Census Bureau.
Ruggles, Steven. 1997. The rise of divorce and separation in the United States, 1880-1990. Demography 34(4): 455–466.
Social Security Administration [SSA]. 2006. Income of the population 55 or older, 2004. SSA Publication No. 13-11871. Washington, DC: U.S. Government Printing Office.
———. 2007. Annual Statistical Supplement to the Social Security Bulletin, 2006. Washington, DC: SSA.
———. 2007b. Online Social Security Handbook. Available at http://www.ssa.gov/OP_Home/handbook/handbook .html.
Tamborini, Christopher R. 2007. The never-married in old age: Projections and concerns for the near future. Social Security Bulletin 67(2): 25–40.
Waite, Linda J. 1995. Does marriage matter? Demography 32(4): 483–507.
Weaver, David A. 1997. The economic well-being of Social Security beneficiaries, with an emphasis on divorced beneficiaries. Social Security Bulletin 60(4): 3–17.
———. 2000. The accuracy of survey-reported marital status: Evidence from survey records matched to Social Security records. Demography 37(3): 395–399.
U.S. Census Bureau. 1986. Fertility of American women: June 1985. Current Population Reports: Population Characteristics. Series P-20, No. 406. Washington, DC: U.S. Census Bureau.
———. 1998. SIPP quality profile 1998, 3rd edition. SIPP Working Paper 230., Washington DC: U.S. Census Bureau. Available at http://www.sipp.census.gov/sipp/workpapr/wp230.pdf.
———. 2005a. Estimated median age at first marriage, by sex: 1890 to the present. Table MS-2. Internet Release Date: June 29, 2005. Available at http://www.census .gov/population/socdemo/hh-fam/ms2.pdf.
———. 2005b. Survey of Income and Program Participa-tion (SIPP) 2001 Panel: Source and accuracy statement for Wave 1–Wave 9 Public Use Files (S&A-2)” Available at http://www.sipp.census.gov/sipp/sourceac/ S&A-2_SIPP2001_w1tow9_20050214.pdf.