women’s bargaining power and children’s schooling
TRANSCRIPT

1
Women’s Bargaining Power and Children’s Schooling
Outcomes: Evidence from Ghana1
Clifford Afoakwah+*, Xin Deng+ and Ilke Onur+
+School of Commerce, UniSA Business School, University of South Australia,
South Australia, Australia
* Corresponding author: [email protected]
1 A research paper submitted for the 2018 Annual Meeting of the American Economic Association (AEA).

2
Abstract
We use data from Ghana to examine the link between women’s bargaining power and children’s schooling
outcomes. We employ a principal component analysis to compute women’s bargaining power using their
education, earnings and age, and examine its effect on schooling outcomes such as late enrollment, grade
repetition, and the intensity of grade repetition. Using age at first marriage and age at first job to identify
women’s bargaining power, we find a significant association between bargaining power and late school
enrollment as well as grade repetition. Our results show that girls tend to benefit more from the mother’s
bargaining power compared to boys, which reflects, in part, the large matrilineal society in Ghana. Further
investigation on the plausible channels suggests that children’s grade progression is associated with
women’s relative education and earnings, while women’s relative age influences late enrollment.
Keywords: Women’s bargaining power, late enrollment, grade repetition, intensity of grade repetition,
Ghana.
JEL classifications: D13, I21, I24

3
1. Introduction
Women’s empowerment and children’s schooling are two of the United Nations’ Sustainable Development
Goals (SDGs) (UN, 2015) due to their economic importance. This paper examines the link between these
two goals via the effect of women’s intra-household bargaining power on children’s late enrollment and
school progression through primary school using household survey data from Ghana.
Schooling outcomes are important to policy-makers and many development organizations largely because
of the close correlation between a region’s human capital stock and its economic development. Its spillover
effects are also well documented (Christiaensen & Alderman, 2004; Thomas, Wang & Fan, 2001). The first
few years of schooling are vital for children’s human capital formation and cognitive progress: what children
learn during these years lays a solid foundation for their development and is a strong predictor of the skills
they accumulate in later years (Cunha & Heckman 2007; Currie, 2001). Delay in schooling, grade repetition
and dropping out constitute major setbacks to building human capital and an inefficient use of educational
resources.
Yet, slow school progression remains a common problem worldwide, especially in the developing
economies. UNESCO (2012) estimates suggest around 32.2 million primary school children repeat a grade
globally, and 31.2 million students dropped out of school in 2010. Grade repetition and late enrollment make
pupils over-aged for their grade and such students are more likely to dropout (UNESCO, 2012). The number
of grade repeaters in sub-Saharan Africa, for example, was 11.4 million in 2010, representing about 35
percent of primary school repeaters in the world. Significant gender differences are also observed, in that
boys are more likely to fall behind compared to girls. Not only do they start primary school later, their
chances of repeating a grade and dropping out are also higher than girls (UNESCO, 2012).
In addition to genetic factors and school attributes, family plays an important role in children’s schooling
outcomes. The extent of family influence depends on resource allocation within the household (Becker,
1965; Doss, 2013). School outcomes such as enrollment and progression are influenced by the amount of

4
money spent on the child’s development2 as well as the amount of time that parents spend with the child on
school-related activities such as helping with homework, offering motivation in educational activities, and
attending to other non-financial academic needs. While ample evidence exists on the link between parental
influence and children’s schooling outcomes, it is unclear how the bargaining power of the mother
influences children’s schooling outcomes such as late enrollment, grade repetition and the intensity of grade
repetition. This study investigates the channel through which a woman’s bargaining power in the household
affects children’s schooling outcomes.
Conceptualizing ‘women’s bargaining power’ as her ability to influence household decision-making, we
probe into its impact on the children’s late enrollment, as well as the likelihood and extent of grade repetition
at school. Our findings suggest that women’s bargaining power reduces the incidence of late school
enrollment and grade repetition, as well as the intensity of grade repetition, and such an effect is more
evident for their daughters. Women’s power derived from their relative education is found to be the most
significant predictor of children’s schooling outcomes, and is significantly associated with on-time school
enrollment, low probability of grade repetition and less intensity of grade repetition for children who have
repeated at least once. Women’s relative age, on the other hand, is the most significant predictor of
children’s on-time school enrollment.
The premise of our paper and findings are paramount for the policy-makers in developing countries since
the adverse consequences of grade repetition on children and society at large are well documented. Grade
repetition not only retards economic growth, but also increases poverty and undermines public health,
especially the wellbeing of the children who repeat a school grade (UNSECO, 2012). For example, children
who repeat a grade usually have low self-esteem, poor peer relationships, increased school alienation and
higher risk of dropping out of school (Anderson, Jimerson & Whipple, 2005; Corman, 2003; Hong &
Raudenbush, 2005). Children’s life chances, as well as development opportunities, are negatively affected,
especially among poor households. While some research suggests that grade repetition improves students’
2 For example the amount of money spent on food, school supplies, sports activities, etc.

5
performance for tests especially in countries where a common examination is required for secondary school
entry, evidence suggests that this relationship is weak and sometimes non-linear (Jimerson, 2001;
Schiefelbein & Wolff, 1993; Schwille, 1991). On the supply-side, Brophy (2006) argues that grade
repetition induces inefficiency and wastage of social resources because each student’s repetition
economically affects the addition of new grade entrants. These problems include the need for larger class
sizes, more teaching and support staff, and the demand for extra desks and supplies. Similar to grade
repetition, late enrollment is also a major contributing factor to a high incidence of school dropouts
(UNESCO, 2012). As well, delayed school enrollment complicates teaching because teachers need to
accommodate pupils with different levels of physical, psychological and cognitive maturity. Since the
learning needs of students at different ages are likely to be different, it is more challenging for teachers to
effectively utilize teaching materials and supplies in delivering their responsibilities (Ezpeleta & Weiss,
1994; Schiefelbein & Wolf, 1993).
The underpinning theoretical link between women’s bargaining power and children’s schooling outcomes,
as discussed in this paper, is within the framework of the collective household model which allows for both
parents to influence decisions regarding resource allocation within the household. This model differs from
the neo-classical household model, which treats parents as a single decision-maker of household level
decisions on children’s schooling (Belzil & Hansen, 2003; Glick & Sahn, 2000; Lillard & Willis, 1994;
Tansel, 1997). The neo-classical model does not allow us to reveal the dynamics of the decision makers
within the household, especially the role of empowered women in influencing the decision. Power sharing
in decision-making, especially for women, has been shown to enhance welfare by improving human capital
in the household (Klugman et al., 2012; Wong, 2012). Thus, human capital indicators such as school
performance, are affected by the parents’ negotiation power regarding the allocation of household resources,
including time and money. Differences between the parents imply negotiation in making household
decisions. The outcome of the negotiation depends on the bargaining power of each party, which is
influenced by the amount of authority each person has in the marriage. For example, evidence from the

6
sociology literature suggests that women with better education and employment have more power regarding
household financial decisions (Malhotra & Mather, 1997).
Similarly, the extant literature on intra-household decision-making has demonstrated that women’s
empowerment has a significant impact on early childhood development (Barber & Gertler, 2009; Carneiro,
Meghir & Parey, 2013), as well as on other household outcomes such as staple crop production, health,
recreation, food and other commodities (Nyqvist & Jayachandran, 2017; Doss, 2006; Duflo & Udry, 2004;
Lim, Winter-Nelson & Arends-Kuenning, 2007; Quisumbing & Maluccio, 2003). Although certain studies
have demonstrated the link between women’s bargaining power and the schooling outcomes of their
children, they leave out some important issues. First is the measurement of bargaining power. Some studies
measure women’s bargaining power without taking into consideration the husband’s endowment. Handa
(1996), for example, used maternal education alone as a proxy for women’s bargaining power and found no
significant impact on children’s highest level of education in female-headed households in Jamaica.
However, she noticed a significant effect of the mother’s education in male-headed households, implying
that the relative power of women may play a role in children’ outcomes. Mothers’ education may capture
the direct effect of their schooling on children’s educational outcomes (Leibowitz, 1974), but does not reflect
the indirect effect of their relative ability to negotiate with the father in allocation of resources within the
household (Doss, 2013). Thus, the relative power of women needs to be considered to reflect the outcome
of the negotiation process. Moreover, it is argued that a mother’s education enhances effective use of time
in improving her child’s education as well as genetic endowment (Leibowitz, 1974; Wolfe & Behrman,
1984), but unless it is compared with that of the father, mothers’ education alone does not demonstrate the
relative power women have in influencing household decision-making. Similarly, Gitter and Barham (2008)
established a link between women’s control over resources and children’s school enrollment, measuring
women’s power using their years of schooling compared to their husbands. They found a positive and
significant effect of a woman’s power on the decision to enroll her child in school in Nicaragua.
Second, in addition to education, other factors such as earnings and experiences are also critical in
influencing power relations within the household. More resources may be allocated to children’s education

7
when women are powerful (Doss, 2013), especially in societies which are matrilineal. McElroy (1990) uses
a Nash bargaining model to demonstrate each member’s threat point in decision-making, and argues that
extra-household environmental parameters (EEPs) increases a member’s threat points. The author argues
that: “indices of each member's control over resources outside the family (including indices of wages, non-
wage income, and employability of each family member), measures of how well each family member could
do in the marriage or remarriage market (e.g., appropriate age-specific sex ratios) or returning to their family
of origin (e.g., parental wealth), measures of supporting social networks and social restrictions (such as
religion and caste)” (McElroy, 1990, p 578). These are good measures for each member’s threat point or
influence because they explain how well members can succeed outside the marriage.
We therefore employ a composite index which comprises the woman’s education, earnings, and age to
examine its effect on children’s schooling outcomes using nationally representative household data from
Ghana. Our contribution to the literature is three fold. First, we explore the impact of women’s bargaining
power on children’s schooling outcomes, with special focus on late enrollment and grade repetition. To the
best our knowledge no studies have examined this important association. Second, we develop a bargaining
index that includes the three key sources of women’s bargaining power identified in the literature. Previous
studies have either discounted the father’s influence in measuring the mother’s impact, or only used a single
indicator for women’s bargaining power which is likely to be an imperfect measure. Since women derive
their household power from different sources, we develop an index to capture three aspects of women’s
potential sources of bargaining: education, earnings, and age, which is unique. Third, we explore the paths
through which women’s bargaining power influences schooling outcomes by examining the independent
effect of the three different threat points; spousal-schooling ratio, spousal-earnings ratio, and spousal-age
ratio. By comparing the composite and relative effects of women’s bargaining power, we demonstrate that
each component of women’s endowment may influence the child’s schooling in different ways.
The rest of the paper is organized as follows. Section 2 presents the measurement of women’s bargaining
power and section 3 outlines the empirical strategy. Section 4 describes the data source and the descriptive

8
statistics, which is followed by a discussion of results and implications. The final section concludes with
policy recommendations.
2. Measurement of women’s bargaining power
The literature on intra-household decision-making is diversified and includes negotiations between parents
and children, between spouses, or between parents and some other household members (Doss, 2013). The
negotiation process depends on each member’s endowments in the household. Due to the unobserved nature
of the bargaining process, it is difficult to directly measure bargaining power, so we consider the amount of
endowment the woman has in the marriage. We conceptualize bargaining power as her ability to influence
intra-household decision-making processes and outcomes. Drawing on the existing literature, we
parameterize three household environmental factors: education, earnings, and age.
First, education has long been identified as an important source of women’s bargaining power in the
household, and her outside marriage options. One of the notable pathways through which education
improves women’s bargaining power is by exposing them to new ideas that improve their independence and
also prohibit them from prevailing traditional and cultural norms (Malhotra & Mather, 1997). Women’s
power derived from education has also been shown to improve children’s cognitive and health outcomes
(Lavy, Lotti & Yan, 2016; Carneiro, Meghir & Parey, 2013; Barber & Gertler, 2009; Gitter & Barham,
2008; Rhee et al, 2005; Thomas & Mundial, 1991). Leibowitz (1974) suggests that while a father’s education
reflects genetic endowments only, a mother’s education is a representation of both genetic attributes and
home investments. This is explained by the fact that mothers usually devote more time to the child than
fathers. Mother’s education reflects a composition of several factors such as taste for education, efficient
household production, opportunity cost of mother’s time in the labour market, parental role modelling,
genetic endowment of abilities, and motivation (Tansel, 1997). Also, educated women are better able to
survive outside the marriage. They are not necessarily limited to the local labour market and can migrate to
a different labour markets to seek employment in order to improve their children’s education.

9
Our second measure of women’s power is their earnings. It has been argued that women who have more
financial resources have more say in the household and therefore exert more power in household decision-
making (Morirajo, 2013). Women’s employment and earnings have been positively linked with children’s
outcomes and their own wellbeing. For example, Getahun and Villanger (2017) have shown that wives who
are employed in labour-intensive jobs have high bargaining power and this improves household
consumption. Prettner and Strulik (2017) found that in less developed countries, the higher the relative
earnings of wives, the lower the fertility. Also, Luke and Munshi (2011) noted that in India an increase in
women’s relative earnings reduces the chances of children marrying a relative or being sent back to their
ancestral home for schooling.3 Similarly, Qian (2008) found evidence indicating an increase in women’s
earnings relative to men improves the daughter’s survival rate in China. A woman’s earnings explain how
well she can survive during a marriage break-up, and also reflect how she can take care of the child’s
financial needs in the absence of the man. Women’s earnings provide them with direct bargaining power,
and their control over earnings gives them the financial resources to fund a decision such as schooling
expenditure (Doss, 2013). Higher earnings also increase women’s bargaining power in negotiation.
Our final proxy for women’s bargaining is age. While the evidence for this variable is empirically rare,
bargaining power through spousal-age ratio may produce either a positive or negative effect on household
outcomes. As McElroy (1990) argues, spousal age measures how well each family member can do in the
marriage or remarriage market. Thus, younger wives could have more bargaining power during negotiations.
On the other hand, age might also capture the life experience each couple brings into the marriage. Older
wives may therefore have greater influence on decision-making, which could lead to positive outcomes for
their children (Chari, Heath, Maertens and Fatima, 2017). Since the outcome we are interested in this study
is children’s schooling, we hypothesize that older wives would have more say about their children’s
schooling, leading to a higher bargaining position.
3 In their paper, the authors point out that in India women in tea estates were found to send their children back home
for schooling. They refer to rural Tamil Nadu as the “ancestral home” in their study.

10
In this study, we first employ a composite index for women’s bargaining power, which is computed using
principal component analysis (PCA) based on women’s education, earnings, and age to capture its
composite effect on children’s school outcomes. With this approach, we are able to tease out the different
sources from which a women might derive her household power. Figures on scree plot, component loadings
and PCA scores are presented in Appendices A, B, and C respectively. We then consider the relative effect
of all three sources of bargaining power to further explain the drivers of children’s schooling outcomes,
where, bargaining power is calculated using a woman’s education, earnings or age as a ratio of the sum of
the couple’s education, earnings or age, respectively.
The mechanism through which these measures could improve children’s schooling outcomes is through two
potential channels4. The first channel concerns women’s bargaining power in the household; women
possessing more human capital have been found to have greater bargaining power (Getahun & Villanger,
2017; Prettner & Strulik, 2017; Doss, 2013; Luke & Munshi 2011; Qian, 2008; McElroy, 1990), and
empowered women could effectively bargain well regarding the allocation of household time and money,
which is likely to translate into on-time school enrollment of their children. It will also mitigates the
probability and intensity of grade repetition. The second potential channel is the through child’s cognitive
development. A woman’s endowment such as education and earnings could serve as parental role
modelling, especially for her daughter, as well as genetic endowment of abilities, and motivation. In these
ways, educated mothers help improve the cognitive development of their children (Carneiro, Meghir &
Parey, 2013; Lavy, Lotti & Yan 2016), and thereby reduce the probability and intensity of grade repetition.
4 Another potential mechanism is that empowered women could also bargain well not only in the marriage but also in
other non-marriage market activities. This will improve their children’s schooling outcomes.

11
3. Empirical strategy
3.1 The model
In our model, a child’s schooling outcome is determined by his/her mother’s bargaining power in the
marriage, the father’s endowment, the child’s personal attributes, school characteristics, and other household
confounding factors. Our main argument is that the degree of bargaining power the mother has in order to
contribute to household resource allocation, could yield positive outcomes for the child’s schooling. Our
study focuses on three main outcomes: late enrollment, grade repetition, and intensity of grade repetition.
Late enrollment is defined as a child beginning school at the age of 7 or later since the required school going
age in Ghana is 6.5 Grade repetition is considered in two ways: first, whether the child has repeated a grade
at least once during basic education; and second, how many times the child has repeated. The first variable
is computed by comparing the child’s actual grade with his/her expected grade. Children, whose actual
completed grade is lower than their expected grade, are considered to have repeated at least one grade.
Expected grade is calculated as the current age minus the age child started basic school. The intensity of
repetition is estimated by comparing the children’s expected grades with the actual grades for those who
have repeated at least once. The corresponding econometric model is specified as follows:
' ' '
i i i i i i iSp wbargain chi sch hh (1)
Sp , schooling outcomes, captures LE , eR p and _ eNum R p . LE , is a dummy for whether the child
enrolled late, while eR p and _ eNum R p are grade repetition and number of times the child has repeated
respectively. wbargain represents women’s bargaining power, chi is a vector of variables for child
attributes, sch controls for school attributes such as school type and expenditure on books and supplies
while hh captures household effects. We further decompose our analysis into gender-specific effects
because a woman may have preference for her boy or girl child’s schooling based on the prevailing socio-
5 Ghana’s basic education begins at age six and is divided into primary school (six years) and junior high school (three years). This
level of education is a continuous process where students complete primary school at age 12 and continue directly to junior high
unless the student has repeated a grade. In other words, without grade repetition, a 15 year old child should have nine years of
schooling.
12
cultural norms and the perceived differences in returns to gender in the labour market (Attanasio, Meghir &
Salvati, 2017). In equation (1) our main hypothesis is that women’s bargaining power has a negative effect
on children’s late school enrollment and grade repetition ( 0 ).
3.2. Potential endogeneity
We suspect possible endogeneity in the form of measurement error of women’s bargaining power because
women derive their bargaining power from different sources; household bargaining in itself is a “black box”
which is latent in nature. Our identification strategy, therefore, utilizes an instrumental variables technique
(IV), which is used to confirm the reliability of our estimates. Our bargaining index might be correlated
with the error term in equation (1). We therefore apply the IV technique for the composite effect of women’s
bargaining power on schooling. We use two instruments to identify bargaining power: her age at first
marriage and the age she started working for the first time. Our argument is that early marriage impedes
female human capital accumulation through poor or low school attainment, and future earnings. Chari,
Heath, Maertens and Fatima (2017) find that in India, early marriage affects the woman’s school attainments
and her marriage market outcomes. It is also estimated that a woman’s years of schooling increase by 0.22
due to a one year delay in marriage, and such a delay also has an increasing effect on her decision-making
and mobility during marriage (Field & Ambrus 2008). This subsequently affects the woman’s bargaining
power, preferences, and knowledge during marriage (Glewwe, 1999; Christiaensen and Alderman, 2004;
Banerji et al., 2013). Evidence from the GSS (2014) suggests that females marry about four years earlier
than males. Similarly, starting one’s working life early, especially during primary school, could have grave
implications for the amount of human capital she brings to marriage in her life cycle. Psacharopoulos (1997)
found that the child laborer lowers his/her educational attainment by an average of 2 years compared to
those who do not begin work early. Thus, although work could have a damaging effect on the child’s future
human capital accumulation, its subsequent impact on the private and social returns on the child’s life cycle
is noteworthy. The GSS (2014) reports that about 28.8% of children aged 7-14 years are already
working, and some children even start at the age of five years (ILO; GSS, 2003). We, therefore, utilize

13
these instruments to identify women’s bargaining power in the household. The corresponding first-stage
regression is stated as:
' ' '_ _i i i i i i i iwbargain married age work age chi sch hh (2)
By controlling for regional effects, we also fix any potential endogeneity of the instruments which might be
due to household poverty6. We also believe that there is no measurement error for our instruments. Even if
it exists, we are confident that it is minimal since marriage is an important life event in Ghana which is
reported by the women themselves during the survey. In section 5, we present statistical tests which support
the validity of our instruments.
Our estimation strategy follows a stepwise approach. In the first specification we examine women’s
bargaining power as well as child and school attributes without including household factors. In the second
specification, we add household covariates in order to observe how they affect the coefficient of women’s
bargaining power to influence their children’s schooling outcomes. The estimation technique employed is a
maximum likelihood method. More specifically, we assume the error term in equation (1) to be normally
distributed and therefore use the IVProbit method for late enrollment and grade repetition, but employ
IVPoisson GMM estimator for intensity of grade repetition since it is a count variable ranging from 1 to 5.
4. Data and descriptive statistics
Our data are sourced from the sixth round of the Ghana Living Standards Surveys (GLSS-6). The GLSSs
are comprehensive datasets in Ghana collected by the Ghana Statistical Service (GSS) and supported by the
World Bank. The dataset is a household survey collected in line with the World Bank’s Living Standards
Measurement Surveys (LSMS). With the objective of providing information on living conditions in the
country, the GLSS has been available since 1988 (GSS, 2014). The study was based on the most recent
6 The Ghana Statistical Service (GSS) report that the incidence of poverty is unevenly distributed throughout Ghana’s ten
administrative regions. While Greater Accra records a low level (5.6%) of poverty; that is 18.6 percentage points lower than the
national rate of poverty, the three northern regions are poorest in Ghana. It is estimated that the poverty in the Upper East and
Northern regions is 44.4% and 50.4%, respectively, which is only better than that of the Upper West region where seven out of ten
people (70.7%) are poor (GSS 2014). In the southern part of the country, poverty is estimated to be high in the Volta region (33.8%),
Brong Ahafo region (27.9%), Eastern region (21.7%) and Western region (20.9%) (GSS, 2014).

14
round of the Ghana Living Standards Survey (GLSS 6), which was collected in 2012/2013. We limit the
study to only 2012/13 because the previous rounds have not captured information on the age an individual
began basic schooling, thus it cannot be utilized for this study. The GLSS-6 surveyed 16,772 households
over the period October 2012 to October 2013. The distribution of population across the country’s 10 regions
is reflected in the samples drawn for the survey, as the Ghana Statistical Service computes weights
depending on different probabilities of selecting an enumeration area in the sample (GSS, 2014). Since these
weights are available in the data, our regression results are based on a weighted dataset and are therefore
representative of the population. Also, due to our sample cohort and missing information on some covariates
used for the regression analysis, the sample size is 8,074 children aged 7-15 years, but varies by
specification. We focus on children of this age cohort because basic education begins at age 6 and ends at
age 15.
Table 1 presents descriptive statistics and definition of the variables used in this study. The descriptive
statistics show that our sample consists of 53% boys, 57% of children who have repeated a grade at least
once at basic school level, with 46.7% enrolling late at school. Although these figures seem to be high, Goux
and Maurin (2005) discovered that about 50% of children in France were held back in school. These figures
also echo the significant increase in the number of grade repeaters in sub-Saharan Africa over the past
decade (UNESCO, 2012). With a very low standard deviation, on average, students repeat two grades before
completing basic education. The average number of years for a father’s schooling is 7 while the mean of the
log earnings of the father is 5.369.
Regarding the proxies for women’s bargaining power, on average, women contribute 22% of total household
earnings and account for 27% of the couple’s total years of schooling. Women are slightly younger than
their spouses, approximately 85% of the age of the men. The average age of a female’s first marriage is 20
years and she tends to start working at the age of 15. We also found that on average, a household has about
two children aged 7 to 15 years.
In addition to parental earnings, education and age, we include a range of household variables such as
amount spent on books and supplies, access to the internet and a computer, distance to the nearest water

15
source and household structure. The average amount spent on books and supplies is 26.76 Ghana cedis,
which is equivalent to US$ 14.32 (Bank of Ghana, 2013), although the standard deviation suggests that the
amount varies significantly across households. About 77% of students are in public school while 0.4% have
at least one form of disability. With regards to fetching water, we notice that household members on average
travel as far as 2341 meters to fetch water for household use. In terms of household crowding, on average,
one room is shared by three household members. A total of 66% of these children live in rural areas.
-------------------------
Insert Table 1 here
----------------------
5. Results and discussion
5.1 Composite effect of women’s bargaining power on children’s schooling outcomes
We begin by analyzing the composite effect of women’s bargaining power on children’s school outcomes
in the full sample. Probit and Poisson models were first estimated and these were followed by instrumental
variable estimations (IVProbit and IVPoisson) to address the possible endogeneity issue discussed earlier.
Both Probit and IV estimates are reported for comparison, and are presented in Tables 2-4. The tables also
report the Cragg- Donald F-statistics as well as the Hansen J statistics. As hypothesized earlier, delayed
marriage and work increase women’s bargaining power, although the latter is insignificant in some
specifications. The Cragg-Donald F-statistics suggest that we have strong instruments in all specifications,
and the Hansen J statistics provide evidence that at least one of our instruments identifies women’s
bargaining power. Although we find a statistically significant effect for women’s bargaining power and
school outcomes in all Probit specifications, which assume exogeneity, endogeneity causes the results to be
biased upwards. We therefore discuss results for our IV estimates.

16
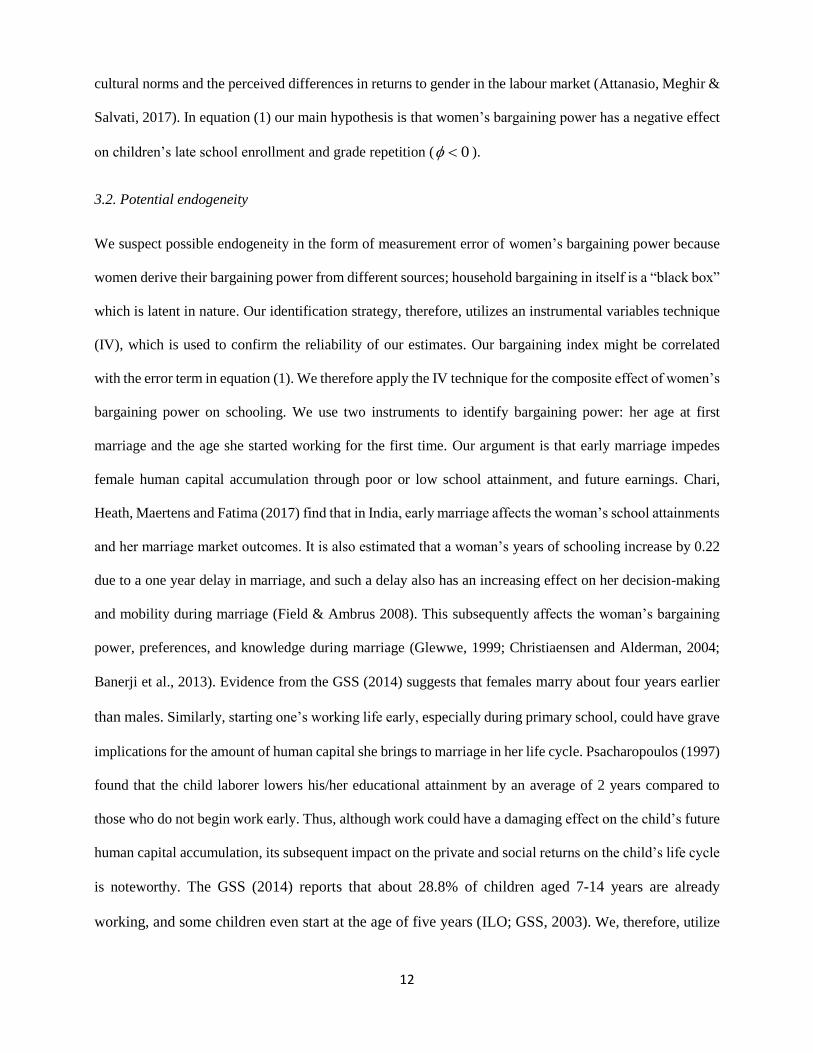
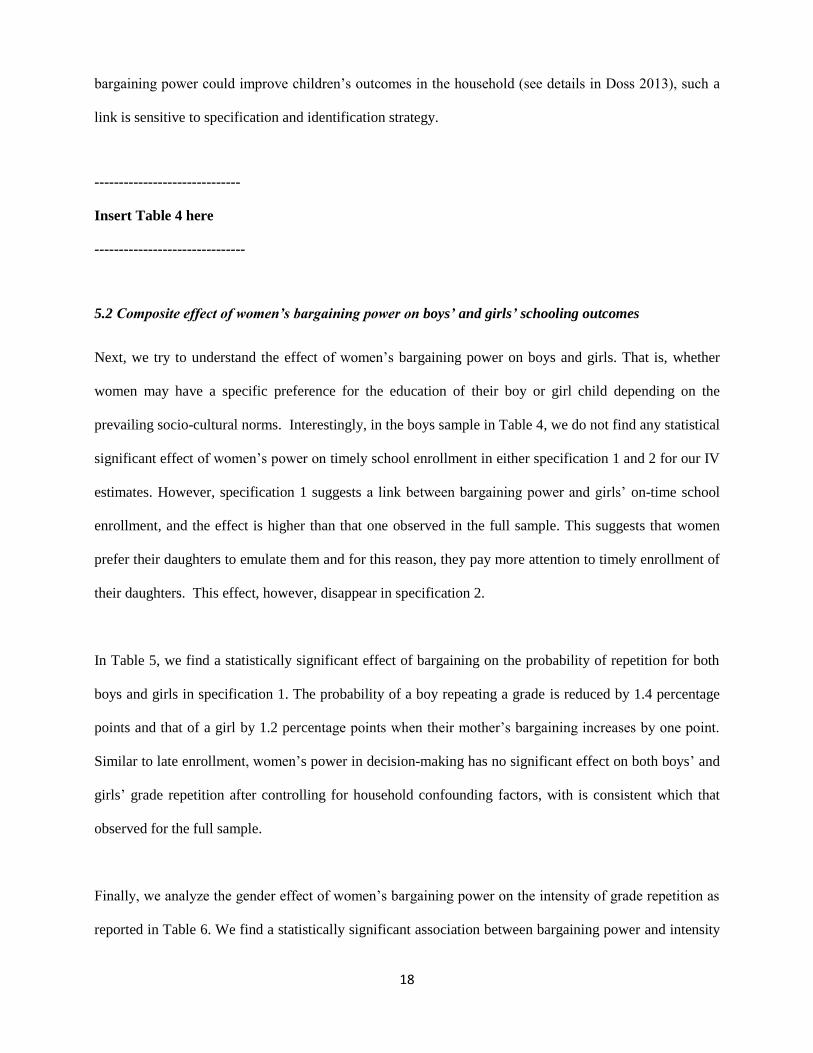
We start with the IV estimate for a base line model as reported in Figures 1-3, and show that women’s
bargaining power reduces late enrollment, grade repetition and intensity of grade repetition. Figures 1-3 plot
the predicted probability of late enrollment and grade repetition against women’s bargaining power without
any control variables. In specification 1, we control for the child-specific attributes and the father’s human
capital endowment, while specification 2 reports the full model which includes household characteristics
and regional effects. In specification 1 in Table 2, we notice that both Probit and IV Probit estimates are
statistically significant, however, estimates from the Probit models suggest an upward bias due to
endogeneity. The IV estimates show that a one point increase in women’s bargaining power reduces the
probability that her child will enroll late by 0.8 percentage points. This effect is statistically significant at
one percent. However, in specification 2, where we control for household covariates, this effect disappears
in the IV model but is still significant in the Probit model. Given that we pass all the validity tests, and our
preferred estimate is the IV, we conclude that household factors such as rural dwelling erodes the impact of
women’s bargaining power on timely enrollment of her child in school. Thus, women in rural areas may
have less power in the household to decide when their child will enroll in school.
--------------
Insert table 2 here
---------------------
Table 3 reports the effect of women’s bargaining power and children’s grade repetition. Similar to late
enrollment, we find that women’s power reduces grade repetition in both Probit and IV Probit models in
specification 1. A one point increase in women’s bargaining power is found to reduce the probability of her
child repeating a grade by 1.2 percentage points, and it is statistically significant. In specification 2, although
the negative coefficient is still observed, its significance vanishes after including household factors. Our
preferred results are from the IV estimates and suggest that women’s bargaining power wields no significant
effect on the likelihood of children’s grade repetition.

17
-----------------------------
Insert Table 3 here
----------------------------
Finally, we examine whether the enhanced bargaining power of women can mitigate the incidence of
children’s grade repetition. Women’s power is statistically significant in both the Poisson and IV Poisson
models. Specification 1 in Table 4 suggests that a point increase in women’s power in the household reduces
the number of times her child repeats by 18 percentage points, all else being equal. In specification 2, this
effect is still significant in the IV Poisson model and reduces the intensity of grade repetition by 25.2%.
After considering the interaction of plausible household factors, women’s bargaining power may not play a
significant role in determining whether their child will enroll on time or repeat a grade, but their decision-
making power could mitigate the number of times their children could repeat. Empowered women are likely
to follow up their children’s performance in school in order to implement appropriate measures that prevent
potential grade repetition. In Ghana, while fathers play a peripheral role in the lives of their offspring,
mothers engage in the upbringing of children, and also produce and distribute food in the household
(Oppong & Bleek 1982; Nsamenang, 1987).
The woman’s power over allocation of resources is, therefore, likely to have a significant influence on the
academic performance of the child. Also, since women spend more time with children, more bargaining
power, leads them to become more involved in their children’s education, and provide better assistance for
their schooling. From the children’s perspective, the higher the mother’s endowment, the more likely her
daughters will do well at school. In part, this association echoes the finding in Ghana by Thomas (1994)
that women who are more educated than their husbands, tend to improve their children’s health, especially
their daughter. To sum up, a higher bargaining power of the mother is associated with a greater likelihood
of her children beginning school at the required age and such children are more likely to progress well in
their learning. For children who repeat a grade, the bargaining power of the mother reduces the chances of
repeating again. Although our findings support evidence from other studies which suggest that women’s
18
bargaining power could improve children’s outcomes in the household (see details in Doss 2013), such a
link is sensitive to specification and identification strategy.
------------------------------
Insert Table 4 here
-------------------------------
5.2 Composite effect of women’s bargaining power on boys’ and girls’ schooling outcomes
Next, we try to understand the effect of women’s bargaining power on boys and girls. That is, whether
women may have a specific preference for the education of their boy or girl child depending on the
prevailing socio-cultural norms. Interestingly, in the boys sample in Table 4, we do not find any statistical
significant effect of women’s power on timely school enrollment in either specification 1 and 2 for our IV
estimates. However, specification 1 suggests a link between bargaining power and girls’ on-time school
enrollment, and the effect is higher than that one observed in the full sample. This suggests that women
prefer their daughters to emulate them and for this reason, they pay more attention to timely enrollment of
their daughters. This effect, however, disappear in specification 2.
In Table 5, we find a statistically significant effect of bargaining on the probability of repetition for both
boys and girls in specification 1. The probability of a boy repeating a grade is reduced by 1.4 percentage
points and that of a girl by 1.2 percentage points when their mother’s bargaining increases by one point.
Similar to late enrollment, women’s power in decision-making has no significant effect on both boys’ and
girls’ grade repetition after controlling for household confounding factors, with is consistent which that
observed for the full sample.
Finally, we analyze the gender effect of women’s bargaining power on the intensity of grade repetition as
reported in Table 6. We find a statistically significant association between bargaining power and intensity

19
of grade repetition for both boys and girls. In specification 1, the restricted sample for boys suggests that a
one point increase in their mother’s power reduces the number of times they repeat a grade by 18% while
that of girls is 19.5%. In specification 2, this effect is statistically significant and larger than in specification
1. Overall, it appears that the link between women’s bargaining power and schooling outcomes is stronger
for girls than boys. This finding somewhat reflects the matrilineal system in Ghana, at least in the south.
Children inherit from their mother’s brother and not their fathers, so the father is likely to divert resources
to their nephews instead of their own children (Thomas, 1994). Women may therefore use their bargaining
power to favor their daughters’ schooling over that of their sons’.
------------------------------
Insert Tables 5, 6 and 7 here
-------------------------------------
5.3 Channels for women’s bargaining power and children’s schooling outcomes
In this section, we discuss the role each of our three measures of women’s bargaining power play in
enhancing children’s schooling outcomes. This helps us to better understand the channels through which
empowered women can facilitate better school outcomes for their children.
The first part of Table 8 shows the link between timely school enrollment and women’s relative education,
earnings and age. We notice that the most significant effect is the spousal age ratio, which reduces the
probability of late school enrollment by about 87.8 percentage points, with the effect being noticeably large
for girls compared to boys. A plausible explanation is that if a woman is older than her partner, the more
likely she will takes more responsibility in running the household. She is also more able to get children
organized for school on time. In order word, older women may have life experiences which help them to
effectively manage the household for children’s on-time school enrollment.

20
Women’s relative education is highly significant in all specifications except for girls. All else being equal,
the more educated a woman is relative to her husband, the more likely it is that she sends their children to
school on time. The corresponding probabilities are 0.067 for the full sample, and 0.077 for boys. With
reference to women’s relative earnings, our pooled regression suggests a significant effect on late
enrollment, especially for girls. In short, we find that relative age of the mother predicts the overall on-time
enrollment, but the mother’s relative education is linked to the timely schooling for her son, and her relative
earnings and age associate her daughter with on-time enrollment.
The second part of Tables 8 presents the breakdown of the three measures used to proxy women’s bargaining
power and grade repetition. They suggest that women’s relative education is the best predictor of both grade
repetition and incidence of grade repetition. Women’s relative education reduces the probability of grade
repetition by 0.095 and the corresponding probabilities for boys and girls are 0.086 and 0.103 respectively.
Also, the number of times a child repeats a grade at basic school falls by an average of 10.7% with an
increase in women’s relative education. Apart from the indirect benefit of women’s education, through
bargaining power, this finding supports the argument that fathers’ education symbolizes genetic
endowments only, but mothers’ education is a reflection of both genetic attributes and home investments
(Leibowitz, 1974).
Furthermore, women’s relative earnings are found to be a significant predictor of grade repetition. This
effect, however, loses its significance when household factors are included. Intriguingly, women’s relative
earnings have more impact on boys’ school progression than that of girls. At five percent significance level,
an increase in women’s earnings relative to men reduces the probability and number of boys’ grade
repetition by 0.089 and 11.6%, respectively. Women’s relative age does not have any significant impact on
children’s grade repetition.
Overall, in our specification 2, in which we include household characteristics, the significance of women’s
bargaining power disappears. This effect is somewhat captured by rural dwelling and distance to fetch
water. As shown in Appendix D, women in rural areas have poorer education, earn less and are relatively

21
younger compared to urban women. This interaction effect might explain the fall in the significance of
women’s bargaining power index. It is also worth noting that a significant proportion of children from rural
areas, compared to their peers in urban settings, enroll late for school, repeat a grade and have a high rate
of grade repetition. This could explain why the inclusion of household factors mitigates the role of women’s
bargaining power in children’s school progression.
----------------------------------
Insert Table 8 here
----------------------------------------
5.4 Effect of other control variables on children’s schooling outcomes
We discuss the impact of our control variables in this section. In specifications 1 and 2, we control for the
fathers’ education and earnings. We focus our discussion on estimates from the IV regression in Tables 2-
7. We find that fathers’ schooling significantly reduces late enrollment both for boys and girls. No such
effect is observed for fathers’ earnings. Similarly, in Table 4, we find that fathers’ education reduces
probability of grade repetition but not the intensity of grade repetition. Interestingly, fathers’ earnings reduce
grade repetition and intensity of grade repetition for their daughters. Gender does not play any significant
role in determining late school enrollments, implying that the onus of school enrollment solely lies on the
parents and unobserved gender attributes play no significant role. However, our controls for child-specific
characteristics show that boys are more likely than girls to repeat a grade. This can be explained by evidence
from the psychology literature which suggests that boys have low self-efficacy and beliefs compared to girls
(see Eccles, Wigfield & Blumenfeld, 1993; Wigfield et al., 1997) and they also tend to overestimate their
abilities in several disciplines such as mathematics (see Pajares, 1996; Wolters, Yu & Pintrich, 1996). In
other words, girls tend to progress faster than boys at basic school. No significant effect is found for the
number of grade repetitions at basic school level. We also find that the number of siblings, aged 7- 15 years,
increases late enrollment, the probability of grade repetition and the intensity of grade repetition. This

22
supports the quantity-quality trade off argument that family size affects children’s academic achievements
(Hanushek, 1992).
Disability, which is a proxy for the child’s health status in our model, is found to hinder on-time school
enrollment among boys but propels girls to be sent to school early. Parents are less likely to delay their
daughter’s enrollment if she has a disability but they are more likely to delay their son’s enrollment if he is
disabled in any form. Also, boys with any form of disability generally do not progress well at school, but
no significant effect is found for girls. Although Afoakwah and Dauda (2016) found no significant
difference in educational attainment among boys and girls with a disability in Ghana, our findings suggest
that gender differences do exist in terms of late enrollment and grade progression among children with
disabilities.
Another intriguing finding is that late enrolling children progress better than those who enroll on time or
early. At one percent significance level, late enrollment reduces the probability of repeating a grade by 0.264
and 0.229 respectively among boys and girls. It also reduces the incidence of grade repetition by 34.1%
among boys and 26.9% among girls. Having adjusted for late enrollment in measuring grade repetition, this
finding suggests that children who enroll late may take advantage of their better developed cognitive abilities
compared to their younger peers. Another plausible explanation is that children who enroll late are extra
motivated to study hard in order to avoid further delay in their schooling. Thus, late enrollment produces
some positive outcomes by reducing the chances and intensity of children repeating a grade.
On the supply side, our control variables such as public schooling and expenditure on books and supplies
reveal significant but different results. For example, public school children are at higher risk of repetition
than children at a private school. Specification 2 in Table 4 suggests that all else being equal, the probability
of a boy repeating a grade at a public school is more than a girl. Another interesting finding is that
expenditure on books and supplies is positively associated with on-time enrollment and improves school
progression. In other words, households that spend more on books and supplies are less likely to enroll their
children late: this indicates parents’ willingness to invest in their children. Investment in books and supplies
also reduces the likelihood of basic school repetition, especially for girls. For example, Table 4 suggests

23
that a one percentage point increase in spending on books and school supplies brings about a 1.9 percentage
point reduction in the probability of a girl repeating a grade.
Household factors such as distance to fetch water and rural dwelling are found to be significant in increasing
late school enrollment and impeding girls’ progress through school. At five percent significance level, a one
percentage increase in distance (meters) to fetch water corresponds to 1.33 percentage points in the
probability of late enrollment. Thus, access to water impedes both on-time school enrollment and grade
progression among girls but has no significant effect on boys’ school enrollment. However, boys in rural
areas are more likely to enroll late for school. At five percent significance level, boys who live in rural areas
have an extra 0.052 probability of enrolling late at school, but no significant effect is found for girls in rural
areas. In terms of grade repetition boys in rural areas are at a greater risk of repetition and repeat more
frequently than girls. Thus, rural dwellings are not only associated with late enrollment, but they are linked
with a higher risk of grade repetition for boys.
6. Conclusion
Slow progression at school is detrimental to development of the human capital needed by a country. Adding
to the literature on intra-household bargaining, we have used principal component analysis to measure
women’s bargaining power in the household and scrutinized its effect on three schooling outcomes; late
enrollment, grade repetition and intensity of grade repetition. Our novel approach of using variations in age
at first marriage and age at first job to identify women’s bargaining power is also noteworthy. Finally, we
focus on women’s relative measures of education, earnings, and age at marriage, instead of absolute ones
which is common in the literature. This enables us to examine in more detail the link between women’s
bargaining power and children’s schooling outcomes.
The most important finding from our study is that an increase in women’s power improves child outcomes.
Put differently, not only the absolute level of women’s empowerment, but also the relative level of women’s
power in the household benefits their children’s education, especially the intensity of grade repetition. We

24
also find that the overall effect of women’s bargaining power benefits their daughter’s school progression
compared to the son.
This study also reveals the link between the channels of bargaining power and the children’s schooling
outcomes. Women’s power driven by their relative education is the most significant predictor of children’s
schooling outcomes, and is significantly associated with on-time school enrollment, low probability of grade
repetition and less intensity of grade repetition. However, women’s relative age is the most significant
predictor of children’s on-time school enrollment.
Our findings also demonstrate the rural-urban disparity in Ghana. Compared to their counterparts in urban
areas, women in the countryside have low bargaining power, and their children enroll late for school, stand
a higher chance of repeating a grade, and experience higher grade repetition intensity. Rural dwelling and
longer distance to retrieve water severely compromise women’s ability to exert power on their children’s
academic progress achievements. Children who live far from a water source are also more likely to delay
school enrollment and repeat a grade. This highlights the spillover effect of better access to water and other
types of infrastructure on education.
Our findings have several policy implications. First, it is not enough to increase women’s absolute levels of
education and earnings, but it is nonetheless important to achieve gender equality in those areas.
Empowerment of women and gender equality, especially for those areas where women are traditionally
disadvantaged, through access to education and labor market participation, is very important. Such
empowerment does not only benefit women and the nation by improving their human capital, they also
advantage the next generation by improving their offspring’s learning outcomes. Second, improving
children’s learning outcomes requires the concerted effort of family, school and government. As illustrated
in our study, better access to water might lead to an improved school outcome, and children enrolled in
private schools are doing better than those in public schools. Thus, and finally, a better allocation of
household resources, improvement in government infrastructure, and a school’s commitment to education
will contribute to better learning outcomes for all children.

25
References
Afoakwah, C. and Dauda, F. (2016). Employment status and educational attainment among disabled
Ghanaians, WIDER Working Paper, No. 2016/56.
Anderson, G., Jimerson, S., and Whipple, A. (2005). Student ratings of stressful experiences at home and
school: Loss of a parent and grade retention as superlative stressors. Journal of Applied School
Psychology, 21, 1-20.
Attanasio, O., Meghir, C., Nix, E., & Salvati, F. (2017). Human capital growth and poverty: Evidence from
Ethiopia and Peru. Review of Economic Dynamics, 25, 234-259.
Banerji, R., Berry, J., Shotland, M. (2013). The impact of mother literacy and participation programs on
child learning: Evidence from a randomized evaluation in India. Working paper, Abdul Latif Jameel
Poverty Action Lab (J-PAL).
Bank of Ghana (2013). Statistical Bulletin. Retrieved 12 December 2016 from
https://www.bog.gov.gh/privatecontent/Publications/Statistical_Bulletin/2013/StatBulJune%202013
c.pdf
Barber, S. L. and Gertler, P. J. (2009). Empowering women to obtain high quality care: evidence from an
evaluation of Mexico's conditional cash transfer programme. Health Policy and Planning, 24(1), 18-
25.
Becker, G. S. (1965). A theory of the allocation of time. Economic Journal, 75(299), 493-517.
Belzil, C. and Hansen, J. (2003). Structural estimates of the intergenerational education correlation. Journal
of Applied Econometrics, 18(6), 679-696.
Brophy, J. (2006). Grade repetition. Education Policy Series, 6, 420-437.
Carneiro, P., Meghir, C. and Parey, M. (2013). Maternal education, home environments, and the
development of children and adolescents. Journal of the European Economic Association, 11(s1),
123-160.
Chari, A. V., Heath, R., Maertens, A., & Fatima, F. (2017). The causal effect of maternal age at marriage
on child wellbeing: Evidence from India. Journal of Development Economics, 127, 42-55.
Christiaensen, L. and Alderman, H. (2004). Child malnutrition in Ethiopia: can maternal knowledge
augment the role of income? Economic Development and Cultural Change, 52(2), 287-312.
Corman, H. (2003). The effects of state policies, individual characteristics, family characteristics, and
neighbourhood characteristics on grade repetition in the United States. Economics of Education
Review, 22, 409-420.

26
Cunha, F. and Heckman, J. (2007). The technology of skill formation. American Economic Review, 97(2),
31-47
Currie, J. (2001). Early childhood education programs. Journal of Economic Perspectives, 15(2), 213-238.
Doss, C. (2006). The effects of intrahousehold property ownership on expenditure patterns in Ghana.
Journal of African Economies, 15(1): 149–180.
Doss, C. (2013). Intrahousehold bargaining and resource allocation in developing countries. The World
Bank Research Observer, 28(1), 52-78.
Duflo, E. and Udry, C. (2004). Intrahousehold resource allocation in Cote d’Ivoire: social norms, separate
accounts and consumption choices. NBER Working Papers 10498. National Bureau of Economic
Research, Cambridge, MA.
Eccles, J., Wigfield, A., Harold, R. and Blumenfeld, P. (1993). Age and gender differences in children's
self- and task perceptions during elementary school. Child Development, 64, 830–847.
Ezpeleta, J. and Weiss, E. (1994). Program to reduce educational lag. Qualitative impact assessment. Final
report. Mexico. Center for Research and Advanced Studies of the National Polytechnic Institute,
Department of Educational Research-DIE.
Field, E., Ambrus, A. (2008). Early marriage, age of menarche, and female schooling attainment in
Bangladesh. Journal of Political Economy, 116(5), 881–929.
Getahun, T. D., & Villanger, E. (2017). Labour-Intensive Jobs for Women and Development: Intra-
household Welfare Effects and Its Transmission Channels. The Journal of Development Studies, 1-
21.
Ghana Statistical Service (2014). Ghana Living Standards Survey Round 6 (GLSS 6), Main Report, Accra.
ILO; Ghana Statistical Service (2003). Ghana child labour survey / International Labour Organization; ILO
International Programme on the Elimination of Child Labour; Ghana Statistical Service - Accra
Gitter, S. R., and Barham, B. L. (2008). Women's power, conditional cash transfers, and schooling in
Nicaragua. The World Bank Economic Review, 22(2), 271-290.
Glewwe, P. (1999). Why does mother's schooling raise child health in developing Countries? Evidence from
Morocco. Journal of Human Resources, 34(1), 124–159.
Glick, P. and Sahn, D.E. (2000). Schooling of girls and boys in a West African country: the effects of
parental education, income, and household structure. Economics of Education Review, 19(1), 63-87.
Goux, D. and Maurin, E. (2005). The effect of overcrowded housing on children's performance at school.
Journal of Public Economics, 89(5), 797-819.
Handa, S. (1996). Maternal education and child attainment in Jamaica: testing the bargaining power
hypothesis. Oxford Bulletin of Economics and Statistics, 58(1), 119-137.
Hanushek, E. A. (1992). The trade-off between child quantity and quality. Journal of Political Economy,
100(1), 84-117.

27
Harvey, S. M., Bird, S. T., Galavotti, C., Duncan, E. A. and Greenberg, D. (2002). Relationship power,
sexual decision making and condom use among women at risk for HIV/STDs. Women & Health,
36(4), 69-84.
Hong, G. and Raudenbush, S. (2005). Effects of kindergarten retention policy on children’s cognitive
growth in reading and mathematics. Educational Evaluation and Policy Analysis, 27, 205-224.
Jimerson, S. (2001). Meta-analysis of grade retention research: Implications for practice in the 21st century.
School Psychology Review, 30, 420-437.
Klugman, J., Hanmer, L., Twigg, S., Hasan, T., McCleary-Sills, J., and Santamaria, J. (2014). Voice and
agency: Empowering women and girls for shared prosperity. World Bank Publications.
Lavy, V., Lotti, G., and Yan, Z. (2016). Empowering Mothers and Enhancing Early Childhood Investment:
Effect on Adults Outcomes and Children Cognitive and Non-Cognitive Skills. National Bureau of
Economic Research. No. w22963.
Leibowitz, A. (1974). 'Home investments in children', Marriage, Family, Human Capital, and Fertility.
Journal of Political Economy, 82(2), Part II, 111-135.
Lillard, L.A. and Willis, R.J. (1994). Intergenerational educational mobility: Effects of family and state in
Malaysia. Journal of Human Resources, 29(4), 1126-1166.
Lim, S. S., Winter-Nelson, A., and Arends-Kuenning, M. (2007). Household bargaining power and
agricultural supply response: Evidence from Ethiopian coffee growers. World Development, 35(7),
1204-1220.
Luke, N. and Munshi, K. (2011). Women as agents of change: Female income and mobility in India. Journal
of Development Economics, 94(1), 1-17.
Malhotra, A., & Mather, M. (1997). Do schooling and work empower women in developing countries?
Gender and domestic decisions in Sri Lanka. Sociological Forum, 12(4), 599-630.
McElroy, M.B. (1990). The empirical content of Nash-bargained household behavior. Journal of Human
Resources, 25(4), 559-583.
Mojirayo, A. (2013). Shifting gender power dynamics: Agricultural commercialisation and its impacts on
gender relations in Yekemi. (Adobe digital version). Retrieved May 2017 from
https://www.aeaweb.org/aea/2014conference/program/retrieve.php?pdfid=958
Nsamenang, A. B (1987). A West African Perspective. In The Father's Role: Cross Cultural Perspectives,
ed. Michael Lamb. London: Lawrence Erlbaum.
Nyqvist M. B and Jayachandran S. (2017). Mothers Care More, But Fathers Decide: Educating Parents
about Child Health in Uganda. American Economic Review: Papers & Proceedings, 107(5), 496–
500.
Oppong, C., Wolf, B. (1982). Economic Models and Having Children: Some Evidence from Kwahu, Ghana.
Africa, 52(3), 15-33.

28
Pajares, F. (1996). Self-efficacy beliefs and mathematical problem-solving of gifted students. Contemporary
Educational Psychology, 21, 325–344.
Prettner, K. and Strulik, H. (2017). Gender equity and the escape from poverty. Oxford Economic Papers,
69(1), 55–74.
Psacharopoulos, G. (1997). Child labor versus educational attainment Some evidence from Latin America.
Journal of Population Economics, 10(4), 377-386.
Qian, N. (2008). Missing Women and the Price of Tea in China: The Effect of Sex-Specific Earnings on
Sex Imbalance. The Quarterly Journal of Economics, 123(3), 1251–85.
Rhee, M., Sissoko, M., Perry, S., McFarland, W., Parsonnet, J., and Doumbo, O. (2005). Use of insecticide-
treated nets (ITNs) following a malaria education intervention in Piron, Mali: a control trial with
systematic allocation of households. Malaria Journal, 4, 35.
Quisumbing, A.R. and Maluccio, J.A. (2003). Resources at Marriage and Intrahousehold Allocation:
Evidence from Bangladesh, Ethiopia, Indonesia, and South Africa. Oxford Bulletin of Economics and
Statistics, 65(3), 283–327.
Schiefelbein, E., and Wolff, L. (1993). Repetition and Inadequate Achievement in Latin America's Primary
School: a review of magnitudes causes relationships and strategies. Estudos em avaliação
educacional, (07), 45-87.
Schwille, J. (1991). Is Grade Repetition Always Wasteful? New Data and Unanswered Questions. Basic
Research and Implementation in Developing Education Systems. No. 7.
Tansel, A. (1997). Schooling attainment, parental education, and gender in Cote d'Ivoire and Ghana.
Economic Development and Cultural Change, 45(4), 825-856.
Thomas, D. (1994). Like father, like son; like mother, like daughter: Parental resources and child height.
Journal of Human Resources, Special issue, 29(4), 950-988.
Thomas, D. and Mundial, B. (1991). Gender differences in household resource allocations (Vol. 79).
Washington, DC: World Bank.
Thomas, V., Wang, Y. and Fan, X, (2001). Measuring education inequality: Gini coefficients of education.
World Bank Publications, vol. 2525.
UN (2015). Transforming our world: the 2030 Agenda for Sustainable Development. Retrieved February
2017, from https://sustainabledevelopment.un.org/post2015/transformingourworld
UNESCO (2012). Opportunities lost: The impact of grade repetition and early school leaving. Retrieved
December 2016, from http://www.uis.unesco.org/Education/Documents/ged-2012-en.pdf
Wigfield, A., Eccles, J.S., Yoon, K.S., Harold, R. D., Arbreton, A., Freedman-Doan, C. and Blumenfeld,
P.C. (1997). Changes in children's competence beliefs and subjective task values across the
elementary school years: A three-year study. Journal of Educational Psychology, 89(3), 451–469.

29
Wolfe, B. L., and Behrman, J. R. (1984). Who is schooled in developing countries? The roles of income,
parental schooling, sex, residence and family size. Economics of Education Review, 3(3), 231-245.
Wolters, A.C., Yu, S.L. and Pintrich, P.R. (1996). The relation between goal orientation and students'
motivational beliefs and self-regulated learning. Learning and Individual Differences, 8, 211–238.
Wong, Y. N. (2012, November). World Development Report 2012: Gender equality and development.
Forum for Development Studies, 39(3), 435-444.

30
List of Tables
Table 1: Summary statistic of variables used in the regression analysis
Variable Definition Mean SD
Late enrollment (1/0) Dummy for whether the child started basic school after age
6 (1/0)
0.467 0.499
Repeated a grade (1/0) Whether the child has repeated at least once at basic school 0.574 0.494
Number of grade
repetitions
Number of times the child repeats at basic school 1.938 1.282
Woman’s relative age Mother’s age as a ratio of total age of mother and father
(continuous variable)
0.455 0.035
Woman’s relative
education
Mother’s education as a ratio of total education of mother
and father (continuous variable)
0.271 0.296
Woman’s relative
earnings
Mother’s annual earnings as a ratio of total annual earnings
of mother and father (continuous variable)
0.222 0.325
PCA index Principal component analysis using woman’s age,
education and wage
-0.245 0.828
Age at first marriage Age the mother married lived with a man for the first time 20.42 3.669
Age at first work Age the mother started working for the first time 15.78 5.49
Father’s education Years of schooling of the father 6.660 4.730
Ln(1+father’s
earnings)
Log of the father’s annual earnings 5.369 3.991
Boy (1/0) Boy child (1/0) 0.527 0.499
7-15 years children Number of children aged 7-15 years in the household 2.493 1.253
Disability (1/0) Dummy for whether the child has any form of disability
(1/0)
0.004 0.056
Public school (1/0) Dummy for whether the child is attending public school
(1/0)
0.765 0.424
Books & supplies Expenditure on books and supplies for the child’s education 26.76 53.48
Water distance Distance to fetch water for general use of the household (in
meters)
2341 29945
Household crowding
(hhsize/rooms)
Household size/number of rooms in the house 3.366 1.794
Rural (1/0) Dummy for rural dwelling (1/0) 0.658 0.474
Personal computer
(1/0)
Whether the household has access to a computer (1/0) 0.877 0.329
Internet (1/0) Whether the household has access to the internet (1/0) 0.872 0.334 Source: Authors’ own computation from GLSS 6. Multicollinearity test was conducted using the pairwise correlation test
in Stata. Variables that were perfectly or highly correlated with the included right-hand-side variables were dropped to
avoid biased estimates.

31
Table 2: Estimates for women’s bargaining power and late school enrollment (Unrestricted sample)
Specification 1 Specification 2
Probit IVProbit Probit IVProbit
Explanatory variables Marginal effects Marginal effects Marginal effects Marginal effects Bargaining index -0.045
(0.025)**
-0.008
(0.172)***
-0.054 (0.032)***
-0.025
(0.277)
Boy 0.015
(0.037)
0.016
(0.037)
0.016
(0.044)
0.016
(0.046)
Father education -0.020 (0.005)***
-0.021
(0.007)***
-0.015 (0.006)***
-0.016
(0.006)*** Ln(1+Father earnings) -0.001
(0.005)
-0.002
(0.005)
0.002 (0.006)
0.0004
(0.007)
7-15 year old sibling 0.019 (0.015)***
0.020
(0.019)***
0.023 (0.022)***
0.025
(0.027)** Disability (1/0) 0.075
(0.273)
-0.108
(0.272)
0.099
(0.374)
0.103
(0.414)
School attributes
Public school (1/0) No No 0.006 (0.058)
0.009
(0.062) Ln(Books & supplies exp) No No -0.019
(0.020)***
-0.019
(0.022)**
Household attributes
Log(distance in meters) No No 0.005 (0.012)
0.006
(0.012) Household crowding No No 0.001
(0.014)
-0.001
(0.021) Rural No No 0.036
(0.054)*
0.039
(0.068)*
Personal computer No No 0.097 (0.189)
0.073
(0.229) Internet No No -0.152
(0.191)
-0.032
(0.241) Regional effects No 0.070
(0.077)
Yes 0.546
(0.175)*** Constant 0.129
(0.061)**
No 0.476 (0.172)*** Yes
Instruments for bargaining
Age first married 0.024
(0.003)***
0.024
(0.002)***
Age first worked 0.007
(0.002)***
0.001
(0.002)
Weak ID ( Cragg-Donald F-statistic) 60.35 71.13
Hansen J statistic 4.75[0.03] 0.12[0.728]
N 8,074 7477 5,415 4990
Wald chi 2 269.14*** 295.14*** 273.68*** 269.66***
Source: Authors’ own computation from GLSS 6. Robust standard errors are in parentheses.*, **, *** Significant at 10, 5 and
1%, respectively. Note: coefficient of constant is reported

32
Table 3: Estimates for women’s bargaining power and grade repetition (Unrestricted sample)
Specification 1 Specification 2
Probit IVProbit Probit IVProbit
Explanatory variables Marginal effects Marginal effects Marginal effects Marginal effects Bargaining index -0.056
(0.026)***
-0.012
(0.134)***
-0.048 (0.031)***
-0.010
(0.288)
Boy 0.027
(0.039)*
0.023
(0.037)
0.041
(0.046)***
0.034
(0.047)**
Father education -0.011 (0.005)***
-0.014
(0.007)***
-0.005 (0.006)***
-0.008
(0.006)*** Ln(1+Father earnings) -0.005
(0.005)***
-0.006
(0.005)*
-0.002 (0.007)
-0.003
(0.007) 7-15 year old sibling 0.005
(0.015)
0.010
(0.061)***
0.007 (0.023)
0.009
(0.028) Disability 0.193
(0.313)*
-0.108
(0.289)
0.298
(0.415)**
0.250
(0.421)*
Late enroll -0.255 (0.040)***
0.248
(0.063)***
-0.265 (0.048)***
-0.263
(0.050)***
School attributes
Public school (1/0) No No 0.080 (0.060)***
0.090
(0.063)*** Ln(Books & supplies exp) No No 0.007
(0.020)
0.009
(0.022)
Household attributes
Log(distance in meters) No No 0.007
(0.012)*
0.009
(0.013)*
Household crowding No No 0.096 (0.058)***
0.007
(0.022) Rural No No 0.008
(0.015)*
0.098
(0.077)*** Computer No No -0.065
(0.192)
-0.061
(0.231) Internet No No 0.052
(0.192)
0.031
(0.240) Regional effects No No Yes Yes
Constant 0.682 (0.070)*** 0.556
(0.103)***
-0.285 (0.190) 0.190
(0.202)
Instruments for bargaining
Age first married 0.024
(0.003)***
0.024
(0.002)***
Age first worked 0.008
(0.002)***
0.001
(0.002)
Weak ID ( Cragg-Donald F-statistic) 60.58 70.36
Hansen J statistic 2.99[0.084] 0.50[0.25]
N 8,011 7423 5,376 4957
Wald chi 2 424.85*** 302.18*** 541.57*** 504.23***
Source: Authors’ own computation from GLSS 6. Robust standard errors are in parentheses.*, **, *** Significant at 10, 5 and
1%, respectively. Note: coefficient of constant is reported

33
Table 4: Estimates for women’s bargaining power and intensity of grade repetition (Unrestricted
sample)
Specification 1 Specification 2
Poisson IVPoisson Poisson IVPoisson
Explanatory variables IRR IRR IRR IRR Bargaining index 0.931
(0.015)***
0.820
(0.058)***
0.935
(0.018)***
0.748
(0.054)***
Boy 1.037 (0.023)
1.032
(0.025)
1.046 (0.026)*
1.037
(0.028) Father education 0.990
(0.003)***
0.995
(0.005)
0.993 (0.004)*
0.998
(0.004)
Ln(1+Father earnings) 0.993 (0.003)**
0.990
(0.003)***
0.993 (0.004)*
0.989
(0.004)** 7-15 year old sibling 1.033
(0.008)***
1.043
(0.010)***
1.026
(0.012)**
1.037
(0.014)***
Disability 1.179 (0.133)
1.201
(0.176)
1.104 (0.126)
1.080
(0.139) Late enroll 0.694
(0.023)***
0.694
(0.019)***
0.678 (0.025)***
0.669
(0.019)***
School attributes
Public school (1/0) No No 1.123 (0.036)***
1.146
(0.042)*** Ln(Books & supplies exp) No No 1.002
(0.011)
1.023
(0.014)
Household attributes
Log(distance in meters) No No 1.004 (0.007)
1.005
(0.007) Household crowding No No 1.001
(0.008)
0.973
(0.009)*** Rural No No 1.141
(0.031)***
1.090
(0.038)** Computer No No 0.853
(0.147)
0.809
(0.101)* Internet No No 1.279
(0.147)*
1.354
(0.172)**
Regional effects No No Yes Yes
Constant 2.082
(0.038)***
2.006
(0.088)***
1.355
(0.105)***
1.464
(0.162)***
Instruments for bargaining
Age first married 0.047
(0.005)***
0.048
(0.005)***
Age first worked 0.007
(0.003)**
0.008
(0.003)**
Weak ID ( Cragg-Donald F-
statistic)
124.26 92.03
Hansen J statistic 1.16[0.28] 2.67[0.10]
N 4,665 4366 3,240 3013
Wald chi 2 323.71*** 302.18*** 347.83*** 504.23***
Source: Authors’ own computation from GLSS 6. IRR= incidence-rate ratio. Robust standard errors are in parentheses.*, **,
*** Significant at the 10%, 5& and 1% levels, respectively. Multiplicative GMM estimator is used.

34
Table 5: Estimates for women’s bargaining power and late school enrollment (Restricted sample) Specification 1 Specification 2
Boys Girls Boys Girls
Probit IVProbit Probit IVProbit Probit IVProbit Probit IVProbit
Explanatory variables Marginal effects Marginal
effects
Marginal effects Marginal effects Marginal effects Marginal effects Marginal effects Marginal effects
Bargaining index -0.042
(0.035)***
-0.049
(0.242)
-0.048
(0.037)***
-0.010
(0.209)***
-0.054
(0.044)***
-0.032
(0.384)
-0.052
(0.046)***
-0.030
(0.381)
Father education -0.019 (0.007)***
-0.021
(0.007)***
-0.019 (0.007)***
-0.020
(0.013)***
-0.016 (0.008)***
-0.016
(0.009)***
-0.014 (0.008)***
-0.015
(0.008)*** Ln(1+Father earnings) 0.001
(0.007)
-0.0002
(0.007)
-0.003 (0.007)
-0.006
(0.007)
0.005 (0.009)
0.004
(0.010)
-0.002 (0.009)
-0.004
(0.009)
7-15 year old sibling 0.015 (0.020)*
0.017
(0.021)**
0.019 (0.022)**
0.022
(0.036)***
0.022 (0.030)**
0.023
(0.034)
0.027 (0.033)**
0.030
(0.043)** Disability (1/0) 0.319
(0.475)*
0.277
(0.507)
-0.114
(0.353)
-0.094
(0.134)
0.621
(0.638)***
0.060
(0.638)**
-0.427
(0.399)***
-0.388
(0.413)**
School attributes
Public school (1/0) No No No No -0.015 (0.080)
-0.010
(0.084)
0.032 (0.083)
0.030
(0.090) Ln(Books & supplies exp) No No No No -0.016
(0.027)
-0.019
(0.031)**
-0.024 (0.028)**
-0.019
(0.031)*
Household attributes
Log(distance in meters) No No No No -0.0004 (0.017)
0.002
(0.018)
0.013 (0.016)**
0.0133
(0.017)** Household crowding No No No No 0.002
(0.020)
-0.002
(0.030)
-0.001
(0.020)
0.0002
(0.030)
Rural No No No No 0.054 (0.075)*
0.052
(0.091)*
0.008 (0.078)
0.021
(0.098) Personal computer No No No No 0.177
(0.286)*
0.149
(0.0427)
0.031 (0.251)
0.007
(0.259) Internet No No No No -0.076
(0.295)
-0.093
(-0.430)
-0.051 (0.251)
0.007
(0.264) Regional effects No -0.753
(0.089)***
No -0.074
(0.147)
Yes 0.655
(0.235)**
Yes 0.486
(0.254)* Constant 0.153
(0.081)*
No 0.145
(0.084)*
No 0.464
(0.233)**
Yes 0.591
(0.240)**
Yes
Instruments for bargaining
Age first married 0.031
(0.004)***
0.017
(0.004)***
0.024
(0.003)***
0.024
(0.003)***
Age first worked 0.005
(0.003)
0.009
(0.003)***
0.0005
(0.003)
0.001
(0.003)
Weak ID
( Cragg-Donald F-statistic)
48.50 17.53 35.33 37.49
Hansen J statistic 3.61[0.057] 0.787[0.37] 0.00[0.98] 0.17(0.68)
N 4,269 3945 3,805 3532 2,878 2647 2,537 2343
Wald chi 2 127.98*** 126.9*** 137.23*** 141.97*** 144.60*** 140.12*** 156.67*** 160.37***
Source: Authors’ own computation from GLSS 6. Robust standard errors are in parentheses.*, **, *** Significant at 10, 5 and 1%, respectively. Coefficient of constant is reported.
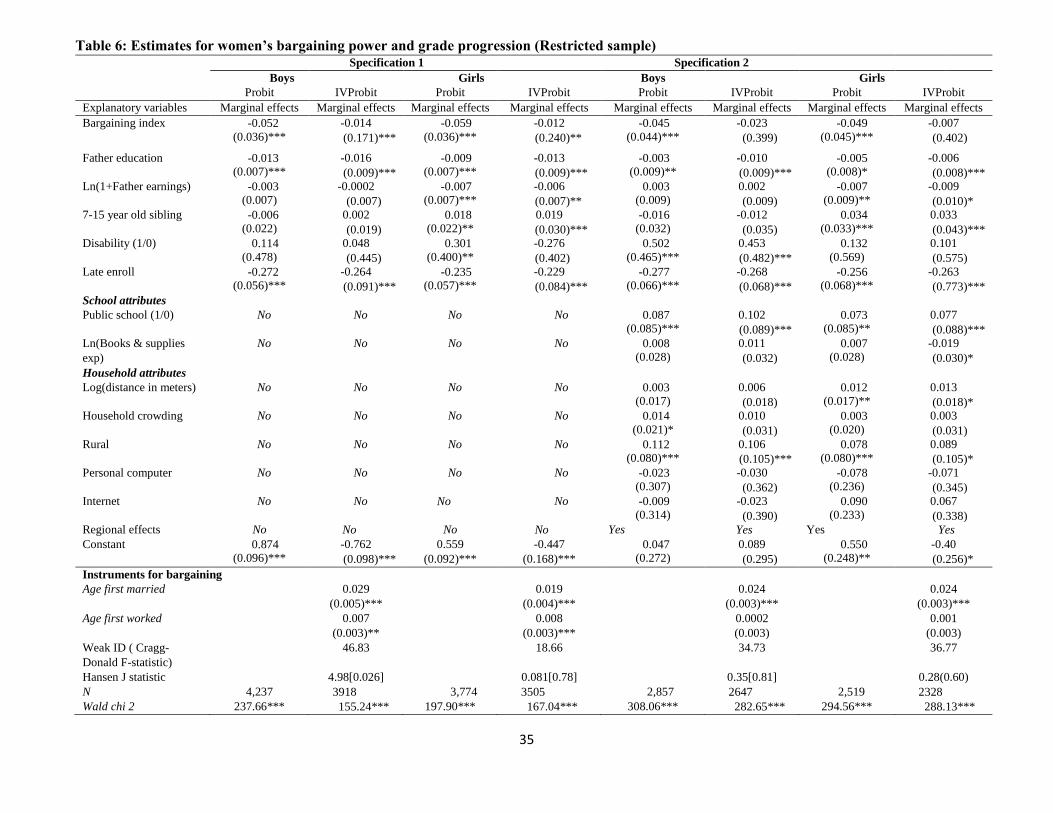
35
Table 6: Estimates for women’s bargaining power and grade progression (Restricted sample) Specification 1 Specification 2
Boys Girls Boys Girls
Probit IVProbit Probit IVProbit Probit IVProbit Probit IVProbit
Explanatory variables Marginal effects Marginal effects Marginal effects Marginal effects Marginal effects Marginal effects Marginal effects Marginal effects
Bargaining index -0.052
(0.036)***
-0.014
(0.171)***
-0.059
(0.036)***
-0.012
(0.240)**
-0.045
(0.044)***
-0.023
(0.399)
-0.049
(0.045)***
-0.007
(0.402)
Father education -0.013 (0.007)***
-0.016
(0.009)***
-0.009 (0.007)***
-0.013
(0.009)***
-0.003 (0.009)**
-0.010
(0.009)***
-0.005 (0.008)*
-0.006
(0.008)*** Ln(1+Father earnings) -0.003
(0.007)
-0.0002
(0.007)
-0.007 (0.007)***
-0.006
(0.007)**
0.003 (0.009)
0.002
(0.009)
-0.007 (0.009)**
-0.009
(0.010)* 7-15 year old sibling -0.006
(0.022)
0.002
(0.019)
0.018
(0.022)**
0.019
(0.030)***
-0.016
(0.032)
-0.012
(0.035)
0.034
(0.033)***
0.033
(0.043)*** Disability (1/0) 0.114
(0.478)
0.048
(0.445)
0.301
(0.400)**
-0.276
(0.402)
0.502
(0.465)***
0.453
(0.482)***
0.132
(0.569)
0.101
(0.575)
Late enroll -0.272 (0.056)***
-0.264
(0.091)***
-0.235 (0.057)***
-0.229
(0.084)***
-0.277 (0.066)***
-0.268
(0.068)***
-0.256 (0.068)***
-0.263
(0.773)***
School attributes
Public school (1/0) No No No No 0.087 (0.085)***
0.102
(0.089)***
0.073 (0.085)**
0.077
(0.088)*** Ln(Books & supplies
exp)
No No No No 0.008 (0.028)
0.011
(0.032)
0.007 (0.028)
-0.019
(0.030)*
Household attributes
Log(distance in meters) No No No No 0.003 (0.017)
0.006
(0.018)
0.012 (0.017)**
0.013
(0.018)* Household crowding No No No No 0.014
(0.021)*
0.010
(0.031)
0.003
(0.020)
0.003
(0.031)
Rural No No No No 0.112 (0.080)***
0.106
(0.105)***
0.078 (0.080)***
0.089
(0.105)*
Personal computer No No No No -0.023 (0.307)
-0.030
(0.362)
-0.078 (0.236)
-0.071
(0.345) Internet No No No No -0.009
(0.314)
-0.023
(0.390)
0.090 (0.233)
0.067
(0.338) Regional effects No No No No Yes Yes Yes Yes
Constant 0.874 (0.096)***
-0.762
(0.098)***
0.559
(0.092)***
-0.447
(0.168)***
0.047 (0.272)
0.089
(0.295)
0.550 (0.248)**
-0.40
(0.256)*
Instruments for bargaining
Age first married 0.029
(0.005)***
0.019
(0.004)***
0.024
(0.003)***
0.024
(0.003)***
Age first worked 0.007
(0.003)**
0.008
(0.003)***
0.0002
(0.003)
0.001
(0.003)
Weak ID ( Cragg-
Donald F-statistic)
46.83 18.66 34.73 36.77
Hansen J statistic 4.98[0.026] 0.081[0.78] 0.35[0.81] 0.28(0.60)
N 4,237 3918 3,774 3505 2,857 2647 2,519 2328
Wald chi 2 237.66*** 155.24*** 197.90*** 167.04*** 308.06*** 282.65*** 294.56*** 288.13***

36
Source: Authors’ own computation from GLSS 6. Robust standard errors are in parentheses.*, **, *** Significant at the 10%, 5% and 1% levels, respectively. Note: coefficient of
constant is reported

37
Table 7: Estimates for women’s bargaining power and intensity of grade progression (Restricted sample) Specification 1 Specification 2
Boys Girls Boys Girls
Probit IVProbit Probit IVProbit Probit IVProbit Probit IVProbit
Explanatory variables IRR IRR IRR IRR IRR IRR IRR IRR
Bargaining index 0.933
(0.021)***
0.820
(0.058)***
0.928
(0.022)***
0.805
(0.073)**
0.930
(0.024)***
0.779
(0.082)**
0.947
(0.027)**
0.739
(0.072)***
Father education 0.988 (0.004)***
0.992
(0.006)
0.992 (0.005)*
1.000
(0.007)
0.992 (0.005)
0.997
(0.006)
0.992 (0.005)
1.000
(0.006) Ln(1+Father earnings) 0.997
(0.004)
0.994
(0.004)
0.987 (0.005)***
0.986
(0.005)***
0.999 (0.005)
0.994
(0.005)
0.987 (0.006)**
0.984
(0.006)*** 7-15 year old sibling 1.045
(0.011)***
1.053
(0.019)***
1.020
(0.013)
1.030
(0.015)**
1.029
(0.017)*
1.034
(0.018)*
1.023
(0.019)
1.042
(0.021)** Disability (1/0) 1.331
(0.155)*
1.206
(0.242)
1.114
(0.191)
1.199
(0.230)
1.213
(0.139)
1.078
(0.210)
1.060
(0.224)
1.193
(0.192)
Late enroll 0.669 (0.030)***
0.659
(0.024)***
0.723 (0.036)***
0.731
(0.028)***
0.635 (0.032)***
0.631
(0.023)***
0.724 (0.039)***
0.721
(0.034)***
School attributes
Public school (1/0) No No No No 1.139 (0.048)***
1.172
(0.056)***
1.090 (0.050)*
1.105
(0.060)*** Ln(Books & supplies exp) No No No No 0.999
(0.016)
1.029
(0.019)
1.004 (0.016)
1.010
(0.019)
Household attributes
Log(distance in meters) No No No No 0.995
(0.010)
0.999
(0.010)
1.016
(0.009)*
1.007
(0.010)
Household crowding No No No No 1.000 (0.010)
0.979
(0.013)
1.000 (0.012)
0.965
(0.013)*** Rural No No No No 1.158
(0.044)***
1.122
(0.052)**
1.118 (0.044)**
1.064
(0.054) Personal computer No No No No 0.932
(0.229)
0.908
(0.187)
0.787 (0.193)
0.743
(0.109)** Internet No No No No 1.181
(0.232)
1.196
(0.253)
1.377 (0.189)*
1.495
(0.212)*** Regional effects No No No No Yes Yes Yes Yes
Constant 0.874
(0.096)***
2.075
(0.117)***
0.559
(0.092)***
2.001
(0.127)***
1.363
(0.139)**
1.371
(0.190)***
1.459
(0.158)**
1.684
(0.294)***
Instruments for bargaining
Age first married 0.045
(0.006)***
0.048
(0.007)***
0.042
(0.006)***
0.055
(0.007)***
Age first worked 0.004
(0.004)
0.010
(0.004)***
0.009
(0.005)*
0.007
(0.004)*
Weak ID
( Cragg-Donald F-statistic)
58.95 65.80 38.90 56.10
Hansen J statistic 0.42[0.52] 0.081[0.05] 0.67[0.41] 2.26[0.13]
N 4,237 2,358 3,774 2008 1,769 1641 1,471 1372
Wald chi 2 237.66*** 155.24*** 197.90*** 167.04*** 293.62*** 282.65*** 116.56*** 288.13***

38
Source: Authors’ own computation from GLSS 6. IRR= incidence-rate ratio. Robust standard errors are in parentheses.*, **, *** Significant at the 10%, 5% and 1% levels,
respectively. Multiplicative GMM estimator is used.

39
Table 8: Estimates for women’s relative power and children’s schooling outcomes
Specification 1 Specification 2
Full sample Boys Girls Full sample Boys Girls
Late enrollment mfx mfx mfx mfx mfx mfx
Relative education -0.067 -0.077 -0.054 -0.046 -0.058 -0.027
(0.064)*** (0.090)** (0.092) (0.075) (0.104) (0.108)
Relative earnings -0.041 -0.025 -0.060 -0.050 -0.027 -0.078
(0.056)* (0.080) (0.079)** (0.070)* (0.101) (0.097)**
Relative age -0.878 -0.787 -0.949 -0.776 -0.791 -0.658
(0.524)*** (0.731)*** (0.752)*** (0.610)*** (0.848)** (0.880)**
Father education -0.018 -0.019 -0.018 -0.013 -0.014 -0.012
(0.004)*** (0.006)*** (0.006)*** (0.005)*** (0.007)*** (0.008)***
Ln(1+Father earnings) -0.001 0.001 -0.003 0.002 0.005 -0.002
(0.005) (0.007) (0.007) (0.006) (0.009) (0.008)
Child attributes Yes Yes Yes Yes Yes Yes
Controls No No No Yes Yes Yes
Regional effects No No No Yes Yes Yes
N 8 ,074 4,269 3,805 5,502 2,927 2,575
Wald chi 2 303.10*** 142.95*** 161.70*** 164.70 77.01*** 111.95***
Grade repetition mfx mfx mfx mfx mfx mfx
Relative education -0.095 -0.086 -0.103 -0.071 -0.062 -0.079
(0.067)*** (0.095)** (0.094)*** (0.078)*** (0.110)* (0.111)**
Relative earnings -0.076 -0.089 -0.060 -0.021 -0.031 -0.015
(0.056)*** (0.079)*** (0.080)** (0.070) (0.101) (0.099)
Relative age 0.175 0.270 0.097 0.259 0.405 0.115
(0.544) (0.752) (0.785) (0.641) (0.882) (0.940)
Father education -0.015 -0.017 -0.014 -0.009 -0.010 -0.008
(0.004)*** (0.006)*** (0.006)*** (0.006)*** (0.008)*** (0.008)***
Ln(1+Father earnings) -0.07 -0.004 -0.009 -0.002 0.002 -0.007
(0.005)*** (0.007)* (0.007)*** (0.007) (0.009) (0.009)**
Child attributes Yes Yes Yes Yes Yes Yes
Controls No No No Yes Yes Yes
Regional effects No No No Yes Yes Yes
N 8,011 4,237 3,774 5,463 2,906 2,557
Wald chi 2 421.84 238.27*** 194.16*** 536.44*** 317.03*** 286.76***
Intensity of grade
repetition
IRR IRR IRR IRR IRR IRR
Relative education 0.893 0.878 0.903 0.892 0.867 0.923
(0.042)*** (0.055)** (0.064) (0.049)** (0.064)** (0.074)
Relative earnings 0.994 0.884 0.986 0.980 0.923 1.041
(0.034)** (0.048)** (0.048) (0.040) (0.058) (0.053)
Relative age 1.618 1.778 1.586 1.300 1.588 1.300
(0.336) (0.453) (0.499) (0.474) (0.537) (0.474)
Father education 0.985 0.983 0.986 0.987 0.986 0.989
(0.003)*** (0.004)*** (0.004)*** (0.003)*** (0.005)*** (0.005)**
Ln(1+Father earnings) 0.991 0.996 0.005 0.993 0.998 0.988
(0.003)*** (0.004) (0.005)*** (0.004)* (0.005) (0.005)**
Child attributes Yes Yes Yes Yes Yes Yes
Controls No No No Yes Yes Yes
Regional effects No No No Yes Yes Yes
N 4,665 2,527 2,138 3,283 1,792 1,491
Wald chi 2 317.31 266.60**** 94.61*** 340.23*** 286.65 113.43***
Source: Authors’ own computation from GLSS 6. Mfx= marginal effects from Probit regression, IRR= incidence-rate ratio
from Poisson regression. Robust standard errors are in parentheses.*, **, *** Significant at the 10%, 5% and 1% levels,
respectively.
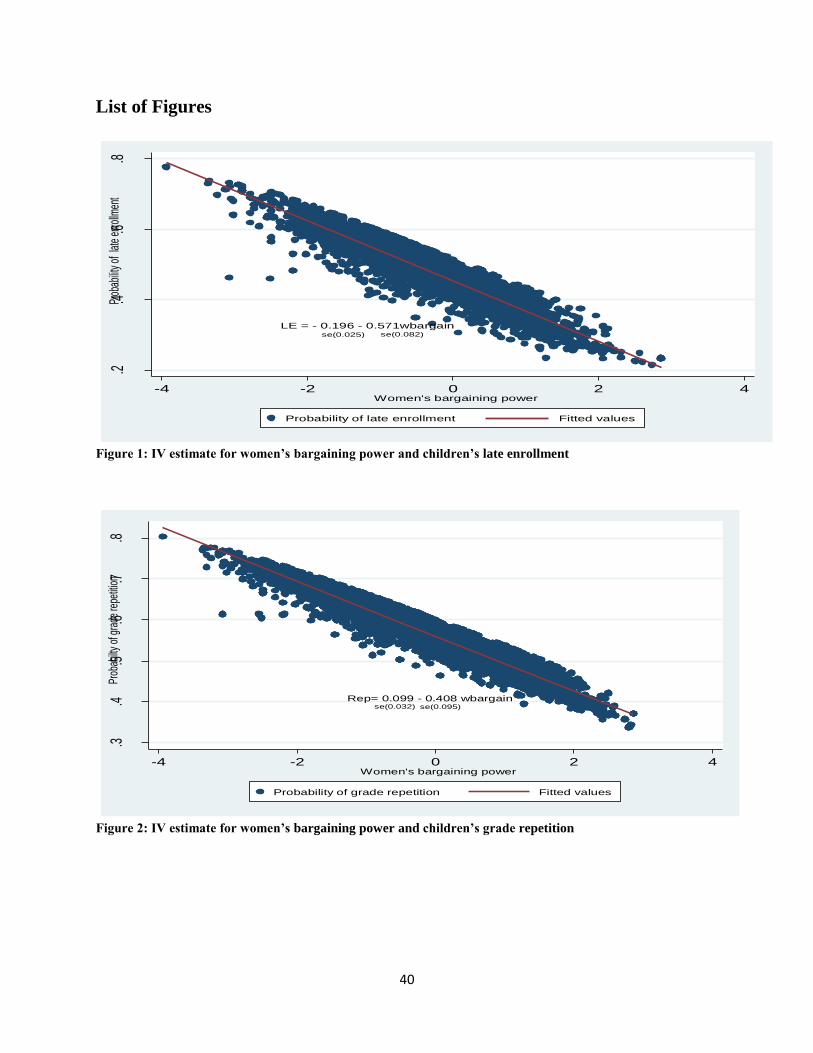
40
List of Figures
Figure 1: IV estimate for women’s bargaining power and children’s late enrollment
Figure 2: IV estimate for women’s bargaining power and children’s grade repetition
LE = - 0.196 - 0.571wbargainse(0.025) se(0.082)
.2.4
.6.8
-4 -2 0 2 4Women's bargaining power
Probability of late enrollment Fitted values
Prob
abilit
y of
late
enr
ollm
ent
Rep= 0.099 - 0.408 wbargainse(0.095)se(0.032)
.3.4
.5.6
.7.8
-4 -2 0 2 4Women's bargaining power
Probability of grade repetition Fitted values
Prob
abilt
y of
gra
de re
petit
ion

41
Figure 3: IV estimate for women’s empowerment and intensity of children’s grade repetition
Num_rep = 0.623 - 0.159 wbargainse(0.581)se(0.013)
01
23
4
-4 -2 0 2 4
Predicted number of grade repetitions Fitted values
Women's bargaining power
Num
ber o
f gra
de re
petit
ions
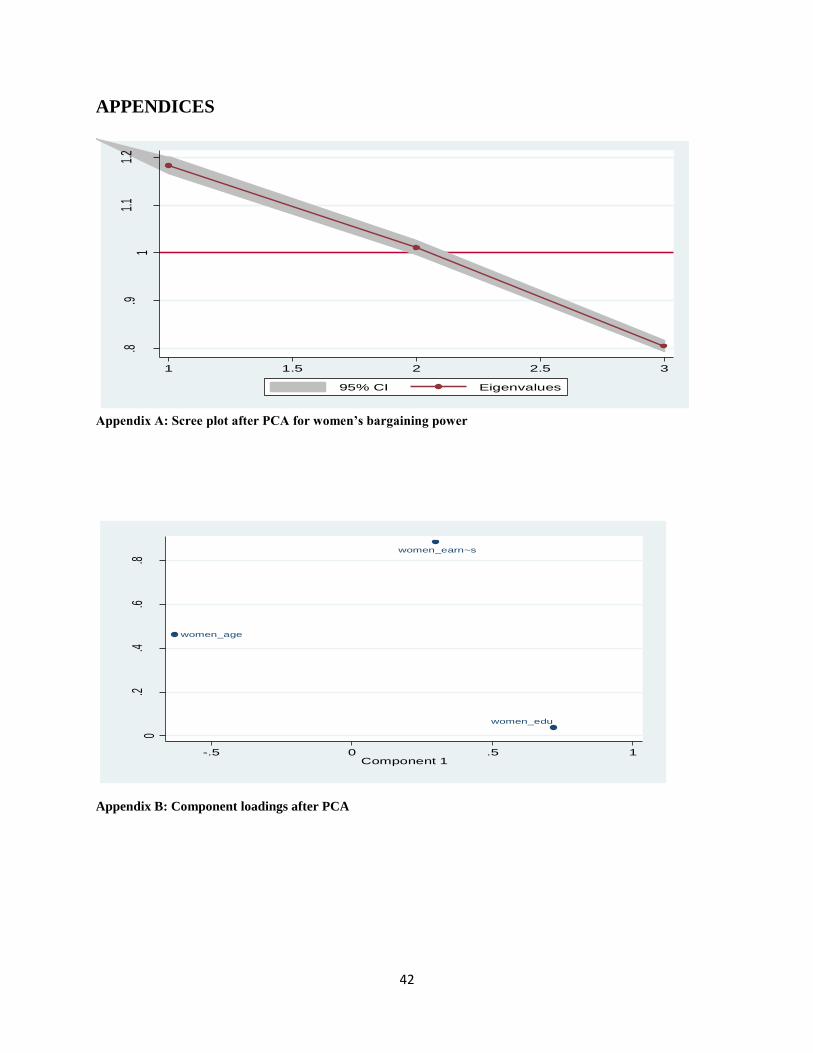
42
APPENDICES
Appendix A: Scree plot after PCA for women’s bargaining power
Appendix B: Component loadings after PCA
.8.9
11.
11.
2
Eige
nval
ues
1 1.5 2 2.5 3
95% CI Eigenvalues
women_age
women_earn~s
women_edu
0.2
.4.6
.8
Com
pone
nt 2
-.5 0 .5 1Component 1
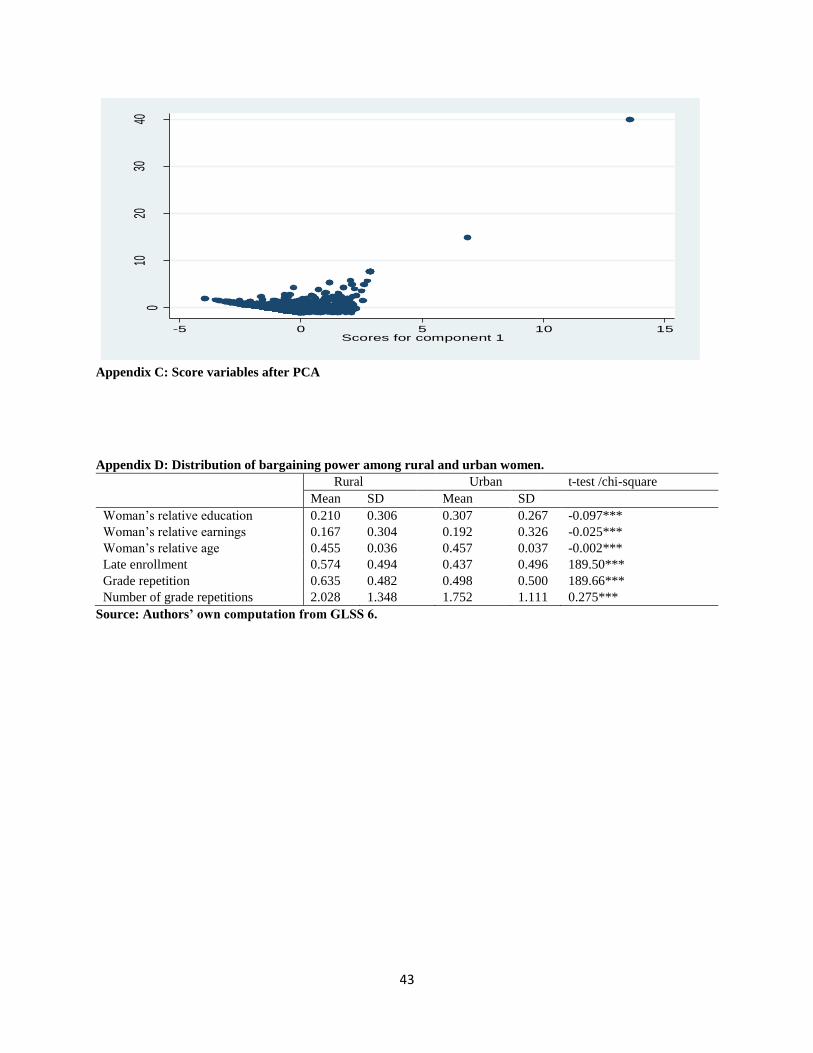
43
Appendix C: Score variables after PCA
Appendix D: Distribution of bargaining power among rural and urban women.
Rural Urban t-test /chi-square
Mean SD Mean SD
Woman’s relative education 0.210 0.306 0.307 0.267 -0.097***
Woman’s relative earnings 0.167 0.304 0.192 0.326 -0.025***
Woman’s relative age 0.455 0.036 0.457 0.037 -0.002***
Late enrollment 0.574 0.494 0.437 0.496 189.50***
Grade repetition 0.635 0.482 0.498 0.500 189.66***
Number of grade repetitions 2.028 1.348 1.752 1.111 0.275***
Source: Authors’ own computation from GLSS 6.
010
2030
40
Scor
es fo
r com
pone
nt 2
-5 0 5 10 15Scores for component 1