woody biomass feedstock for the bioenergy and - state of indiana
TRANSCRIPT

Woody Biomass Feedstock For the Bioenergy and
Bioproducts industries
Indiana Department of Natural Resources

Woody Biomass Feedstock for the Bioenergy and Bioproducts Industries

ContentsExecutive Summary 3
Introduction 4
Abbreviations, Acronyms, Definitions 5
Indiana’s Forest Resources 6 Biomass Conversion Tables 7
Location of Woody Biomass 9
Woody Biomass Residue 10
Harvest Residue 16
Live Tree Woody Biomass 17
Standing Dead Woody Biomass 19
Potential Concerns & Impacts 22
Biomass Resources 23
Conclusion 24

3
Executive Summary The Indiana Department of Natural Resources is committed to supporting and expanding the role of woody biomass as an alternative energy source in Indiana. The increased costs associated with oil, coal and natural gas gives biomass fuels a place to smooth the progress by reducing imports and creating new growth in the agribusiness commu-nity. The expansion of bio-energy products will foster new domestic business and support urban rural economies.
Woody biomass, still in the early stages of energy production, has great potential to be one of several biomass solu-tions to reduce energy dependence and carbon emissions. Actually, biomass has surpassed hydropower as the largest domestic source of renewable energy and provides 3 percent of the total energy consumption in the United States. This includes all plant and plant-derived materials, including animal manure, starch, sugar and crops. Another fact that makes woody biomass and biomass in its other forms significant is that it’s a renewable resource and thus invaluable as a solution to current energy demands.
There are two essential questions to ask: Is it economical? Is there sufficient supply of woody biomass in Indiana to have an impact on our energy needs?
Assuming that financial, public policy and conversion technologies continue to advance, woody biomass will be eco-nomically feasible to compete with other more established fuel sources. As for the sufficient supply question, the broad answer is yes, dependent on the number of facilities and their volume requirements of woody biomass. Indiana pro-duces more than 487 million green tons of woody biomass (harvest residue, mill residue, standing dead/above ground biomass, and construction/demolition wood waste) as described in this report.
This report will address several known quantities of woody biomass – live trees, standing dead trees, fine residue, bark residue, course residue and urban wood waste. All could play a support role in energy production and its sustainability for future needs. The woody biomass in this report is based on the latest Forest Inventory Analysis (FIA) data from 2003-2007. Woody biomass statistics are subject to relative changes due to land use changes, forestry management practices and economic conditions affecting the sources of production.
This report is based on reasonable assumptions. With scientific advances and sound forest management future, biomass quantities could increase for energy consumption.

4
Introduction The Indiana Department of Natural Resources, Forestry Division, compiled this information to support industries or individual(s) in energy production or non-energy related businesses needing estimated volumes of woody biomass.
This document quantifies the volumes from U.S. Forest Service Forest Inventory Analysis (FIA) data and makes reasonable assumptions of volumes of woody biomass from several sources in Indiana. Resource volumes of woody biomass were from – primary mill residue, fines (sawdust), bark (log), course (chips), urban wood waste (construction secondary manufacturing), live trees and standing dead trees.
It should be acknowledged that the total volume of reported materials aren’t necessarily available or unavailable to new users of biomass. Due to logistics, raw material pricing, national forests and other public issues not all of the biomass volumes/tons may be available for consumption. Also existing competition needs to be considered. Substantial vol-umes of woody materials currently being used in landscaping materials, pulp and paper production, bedding and pellet production are included in these reported totals.
Indiana’s Estimated Total BiomassHarvest Residue 1,300,000 million green tonsMill Residue 1,200,000 million green tonsAbove Ground Live Biomass 474,391,114 million green tonsStanding Dead >15” DBH 10,424,904 million green tonsC/D Wood Waste 161,700 tons
Wood pellets

5
Abbreviations and AcronymsTSI …………………………Timber Stand Improvement FIA …………………………Forest Inventory & Analysis (USDA program)TPO…………………………Timber Product Output (USDA program)USDA ………………………U.S. Department of AgricultureDNR ………………………..Department of Natural ResourcesDBH ………………………..Diameter at Breast Height MSW ……………………….Municipal Solid Waste
Definitions primary industry“Primary” mills take logs and other round sections cut from trees – called roundwood – and convert them into prod-ucts (e.g., lumber, veneer and pulp).
secondary industryClass of hardwood manufacturers who dry, plane, cut and assemble processed wood (lumber, veneer other primary products) into parts or finished goods. Examples would be all types of furniture, kitchen cabinets, flooring, architec-tural millwork, pallets and paper products. (Forests of Indiana: Their Economic Importance)
Chip pile

6
Indiana’s Forest ResourcesTotal forestland in Indiana is approximately 4.8 million acres1 – 21 percent of the state’s 23 million acres. Most for-estland is privately owned by individuals or by the forestry industry (Figure # 1). More than 90 percent is classified timberland, defined by the USFS as land capable of growing more than 20 cubic feet of wood per acre annually.
Indiana’s net growth rate of timberland is 52 cubic feet per acre. Most timberland is not reserved from harvesting, but some may be inaccessible by forestry equipment, statute, land development or environmental issues. The remainder grows less than the prescribed 20 cubic feet per acre annually. Lower productivity can be due to several management aspects or site locations (e.g., soil conditions, moisture, rockiness and/or lack of management). As a result, this land may be used for livestock grazing, parks or other non-timberland uses.
Almost 70 percent of Indiana’s forestland is south of an imaginary east-to-west line south of Indianapolis. Forests in southern Indiana are usually in large consolidated tracts of land. In the north, they are scattered woodlots and along rivers and streams.
Private landowners possess 84 percent of the forestland in Indiana; 75 percent of these are family forest owners with an average forest tract of less than 25 acres.
Hardwoods make up 96 percent of the total species that grow naturally in Indiana forests. Some of the most common tree species by volume are; oaks (28 percent), maples (15 percent), tulip-wood (11 percent), hickory (10 percent), and ash 7 (percent).
Fig. 1
Ownership of Indiana Forestland
State350,000, 7%
Federal400,000, 8% County/Municipal
33,000, 1%
Private4,000,000, 84%
1 USDA Forest Service FIA, Indiana 2003-2007

7
Biomass conversion Factors
1 green ton (GT) of chips = 2,000 pounds (not adjusted for moisture)1 bone-dry ton (BDT) of chips = 2,000 dry pounds (assumes no moisture content)1 bone-dry unit (BDU) of chips = 2,400 dry pounds (assumes no moisture content)1 unit of chips = 200 cubic feet1 BDT chips = 2.0 GT (assuming 50-percent moisture content)1 unit of chips = 1.0 BDT chips1 CCF (100 cubic feet) roundwood = 1.0 BDU chips1 CCF roundwood (logs) = 1.2 BDT chips1 CCF roundwood (logs) = 1.2 units of chips1 CCF roundwood (logs) = 1.2 cords roundwood @ 85 cu. Ft. wood/cord1 Board Foot (BF) (12” x 1” thick) = 1 board foot of lumber measures 1 MBF (1,000 board feet) = 1,000 BF1 GT (green ton) of logs = 160 BF of lumber6 GT (green ton) of logs = 1 MBF
1 Standard chip van carries 25 green tons, or approximately 12.5 bone dry tons (BDT), assuming 50 percent moisture content.
When woody biomass is used in a commercial-scale (10+ megawatt [MW] electricaloutput) power generation facility, the following energy output rules of thumb apply:1 BDT fuel will produce 10,000 pounds of steam.10,000 pounds of steam will generate 1 megawatt hour (MWH) of electricity1 MW = 1,000 horsepower1 MW = power for approximately 750 to 1,000 homes.Source: Woody Biomass Utilization Desk Guide, USDA Forest Service, NationalTechnology & Development Program, 2400 – Forest Management, September 2007.
conversion of Lumber to residue(International ¼)
PROD MILL TYPE OUTPUT RESIDUE CONV
Saw logs band/circle mills Green tons Bark 0.46
Saw logs band/circle mills Green tons Coarse 1.34
Saw logs band/circle mills Green tons Fine 0.62
Saw logs band/circle mills Dry tons Bark 0.29
Saw logs band/circle mills Dry tons Coarse 0.79
Saw logs band/circle mills Dry tons Fine 0.37
Saw logs band/circle mills Cubic feet Bark 24.5
Saw logs band /circle mills Cubic feet Coarse 48
Saw logs band/circle mills Cubic feet Fine 22
NOTE:
If you multiply the conversion factor number in the table above by 1.38, that will give you the conversion factor to convert 1,000 bf Doyle to green tons (or other unit of measure).
EXAMPLE - TO GET GREEN TONS OF COARSE - # Bf Doyle x 1.34 x 1.38 = green tons
Source: USDA Forest Service, Northern Reach Station, Ron Piva

8
Sawdust storage

9
Location of Woody Biomass
The following described areas shown in the map and graph(s) below show the Forest Inventory Analysis (FIA) of each unit and the counties within the unit.

10
Woody Biomass Residueprimary mill residue
Wood residue from the primary manufacturing industry is classified in three categories – bark (mulch), coarse (chips) and fines (shavings-sawdust). Each category is made up of mostly hardwood materials with a very small percentage of softwood.
Primary wood products are the major source of material in Indiana for energy, pellets and others uses as they are required to be clean, uniform, easily transported and usually low in moisture content. For these reasons, they are in de-mand as inputs from several manufacturing industries, including pulp and paper mills, playground material, landscap-ing mulch, animal bedding and boiler fuel.
Other products requiring low moisture biomass – such as pellets, horse and poultry bedding – come from the second-ary wood products industry or must be dried.
The volume of mill residue produced in a given year is linked closely to in-state lumber production. Sawmills account for nearly all of the coarse and bark residue production in the state along with a large portion of the green fines. Some sawmills produce a small percentage of dry fines (planer shavings), with the majority of dry fines coming from the secondary wood products industry. Milling equipment, species and size of logs, amount of defect in logs and market conditions also influence residue volume.
In 2005, Indiana mills produced 1.3 million green tons of wood (coarse and fine residue) and bark residue; 53 percent of the mill residue generated was in the form of coarse wood residue, such as slabs and edgings. Fines and bark residue contributed 25 percent and 22 percent respectively of the remaining mill residue produced. (Fig. 2)
(Fig. 2)
Distribution of Mill Residue (green tons)
2005 TPO survey
Bark280,570
Fines306,890
Coarse683,630

11
Disposition of residue produced at primary wood-using mills by Forest Survey Unit, disposition, residue type, and softwoods and hardwoods, Indiana, 2005 (in green tons)
FIA Region All material Coarse1 Fine2 Bark Softwood Hardwood Softwood Hardwood Softwood Hardwood Softwood HardwoodAll UnitsFiber products 3 2.65 409.98 2.61 385.65 0.04 21.78 -- 2.55Industrial fuel 0.43 206.41 0.28 97.76 0.08 102.67 0.07 5.98Domestic fuel 0.56 45.25 0.29 33.43 -- 1.25 0.27 10.57Miscellaneous 4 3.94 584.15 0.25 156.66 2.29 170.51 1.40 256.98Not used 1.20 16.53 0.72 5.99 0.18 8.08 0.30 2.46 Total 8.78 1,262.31 4.15 679.48 2.59 304.30 2.04 278.53Knobs UnitFiber products 3 2.65 209.02 2.61 184.69 0.04 21.78 -- 2.55Industrial fuel 0.28 69.06 0.16 15.63 0.07 48.69 0.05 4.74Domestic fuel 0.21 17.43 0.15 13.06 -- 0.46 0.06 3.91Miscellaneous 4 3.70 225.53 0.23 57.96 2.09 65.30 1.38 102.27Not used 0.92 10.93 0.58 3.46 0.10 6.11 0.24 1.36 Total 7.79 531.97 3.74 274.80 2.31 142.34 1.74 114.83Lower Wabash UnitFiber products 3 -- 113.92 -- 113.92 -- -- -- -- Industrial fuel -- 30.81 -- 5.68 -- 24.89 -- 0.24Domestic fuel 0.03 5.67 0.02 3.95 -- 0.08 0.01 1.64Miscellaneous 4 0.01 111.45 -- 22.96 0.01 29.68 -- 58.81Not used -- 4.71 -- 2.13 -- 1.70 -- 0.88 Total 0.04 266.54 0.02 148.64 0.01 56.34 0.01 61.56Northern UnitFiber products 3 -- 67.07 -- 67.07 -- -- -- -- Industrial fuel 0.07 104.08 0.07 75.85 0 27.48 -- 0.75Domestic fuel 0.31 17.68 0.11 13.18 -- 0.71 0.20 3.79Miscellaneous 4 0.19 226.01 -- 75.00 0.17 63.76 0.02 87.25Not used -- 0.06 -- 0.01 -- 0 -- 0.05 Total 0.56 414.92 0.18 231.11 0.17 91.96 0.21 91.85Upland Flats UnitFiber products 3 -- 19.97 -- 19.97 -- -- -- -- Industrial fuel 0.06 2.47 0.04 0.60 -- 1.61 0.02 0.26Domestic fuel 0 4.45 0 3.23 -- -- 0 1.22Miscellaneous 4 0.04 21.16 0.01 0.74 0.03 11.77 0 8.65Not used 0.28 0.81 0.14 0.38 0.08 0.27 0.06 0.16 Total 0.39 48.87 0.20 24.93 0.11 13.65 0.08 10.29
12
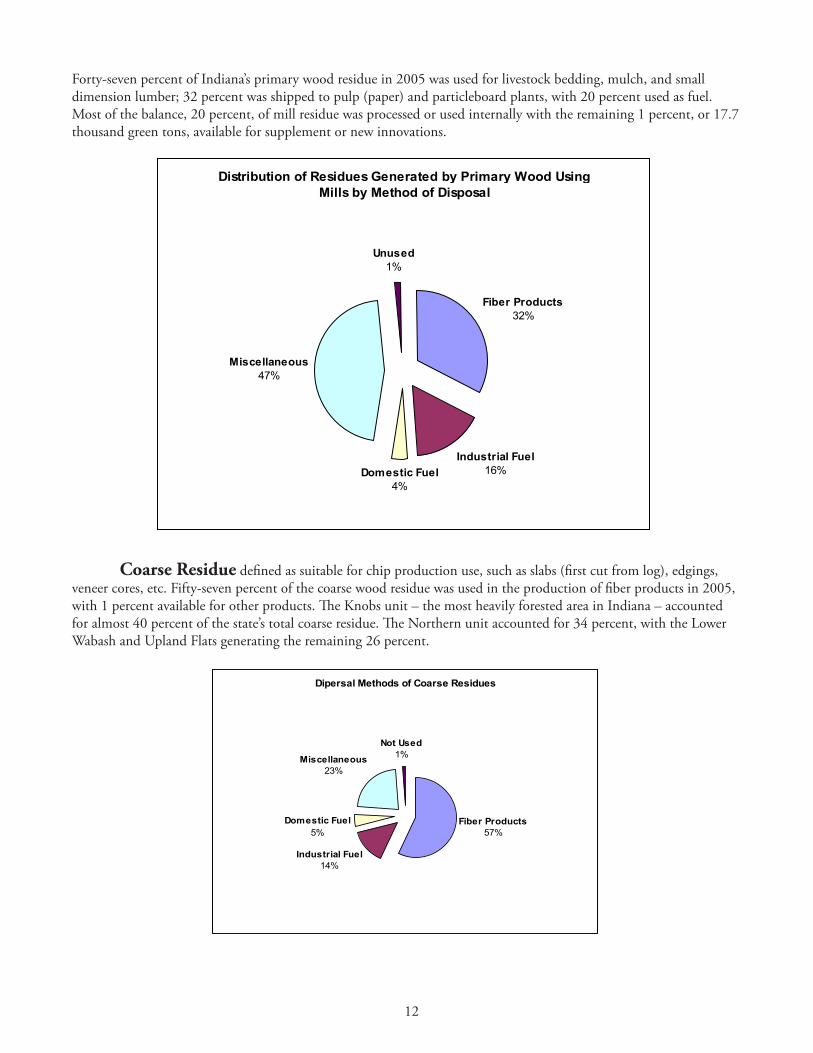
Forty-seven percent of Indiana’s primary wood residue in 2005 was used for livestock bedding, mulch, and small dimension lumber; 32 percent was shipped to pulp (paper) and particleboard plants, with 20 percent used as fuel. Most of the balance, 20 percent, of mill residue was processed or used internally with the remaining 1 percent, or 17.7 thousand green tons, available for supplement or new innovations.
Distribution of Residues Generated by Primary Wood UsingMills by Method of Disposal
Unused1%
Domestic Fuel4%
Industrial Fuel16%
Miscellaneous47%
Fiber Products32%
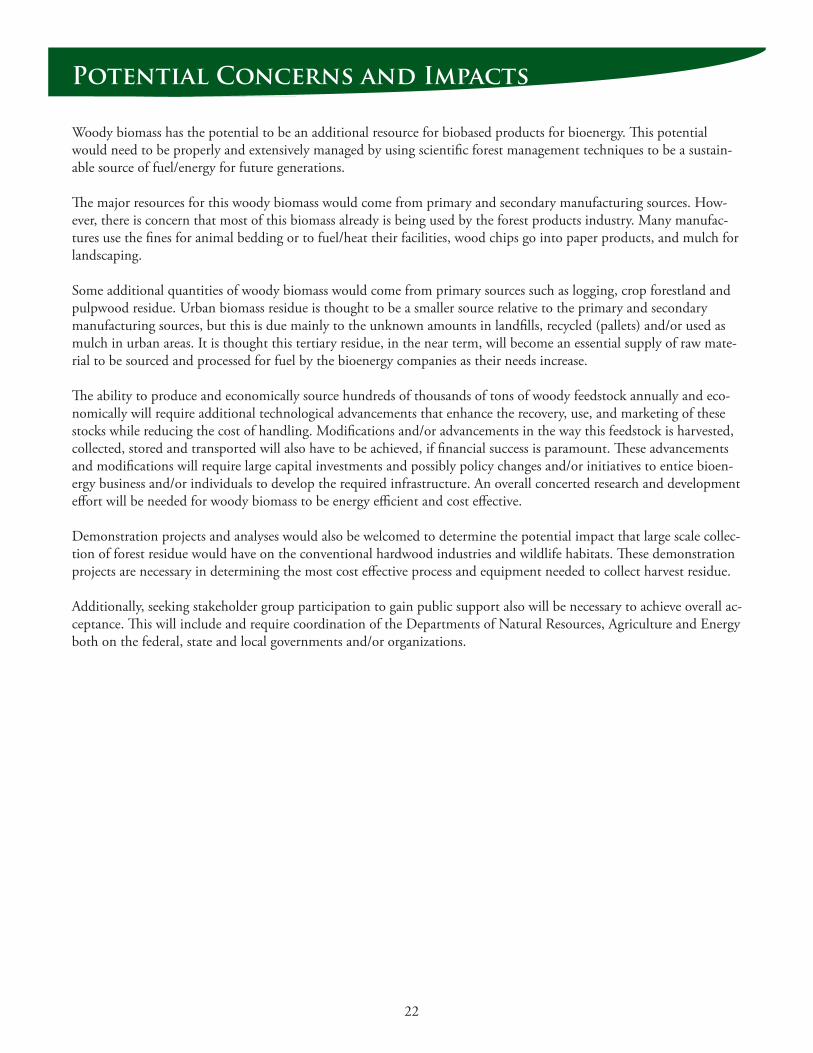
coarse residue defined as suitable for chip production use, such as slabs (first cut from log), edgings, veneer cores, etc. Fifty-seven percent of the coarse wood residue was used in the production of fiber products in 2005, with 1 percent available for other products. The Knobs unit – the most heavily forested area in Indiana – accounted for almost 40 percent of the state’s total coarse residue. The Northern unit accounted for 34 percent, with the Lower Wabash and Upland Flats generating the remaining 26 percent.
Dipersal Methods of Coarse Residues
Not Used1%Miscellaneous
23%
Domestic Fuel5%
Industrial Fuel14%
Fiber Products57%

13
Distribution of Coarse Residues by FIA Unit (green tons) 2005 TPO survey
Lower Wabash148,660 , 22%
Northern231,290 , 34%
Upland Flats25,130 , 4%
Knobs278,540 , 40%
Fine residue is defined as residue not suitable for chip production, such as sawdust, planer shavings and veneer clippings etc. Fifty-seven percent of the fine residue produced was used for miscellaneous purposes, such as animal bedding, mulch, or in the manufacturing of ply products. With the expanding poultry markets and reduced mill production due to current economic conditions, sawdust is in high demand, bringing as much as $20 per ton. The remaining 33 percent is used as industrial fuel with 3 percent available or given away. The Knobs unit produced 48 percent of the fine residue across the state. The Northern Unit produced 30 percent, with the remaining 22 percent split between the Lower Wabash and Upland Flats units.
Dispersal Methods of Fine Residues
Fiber Products
7%Industrial
Fuel33%
Domestic Fuel
Misc.57%
Not Used3%

14
Distribution of Fine Residues by FIA Unit (green tons) 2005 TPO Survey
Upland Flats13,760, 4%
Northern92,130, 30%
Lower Wabash56,350, 18%
Knobs144,650, 48%
Bark residue is defined as the material taken off of the log prior to processing. Ninety-two percent of the bark residue produced was used either as landscape or playground mulch. Slightly less than 1 percent of the bark resi-due produced was not used. The Knobs unit produced 42 percent of bark residue across the state. The Northern unit produced 32 percent, with the Lower Wabash and Upland Flats producing 24 and 4 percent, respectively.
Dispersal Methods of Bark Residues
Landscape/ P l aygr ound
Mul ch
92%
N ot Used1%
Fiber Product s1%
Indust rial Fuel2%
Domest ic Fuel4%
Distribution of Bark Residues by FIA Units (green tons)2005 TPO survey
Upland Flats10,370
Northern92,060
Lower Wabash61,570
Knobs116,570

15
secondary mill residue
The secondary manufacturing industry uses products from the primary industry. Some products are mill-work, pallets and containers, furniture, flooring, building products and others. When comparing the secondary to the primary industry in total volume of residue produced, the secondary is a smaller producer (Rooney, 1998 – McKeever, 1998). Residue generated by the secondary includes sawdust, sander dust, shavings, board cut offs and scrap wood.
Many of these secondary manufacturers, both large and small, use the residue produced to meet their energy needs for heat for dry kilns and their manufacturing processing, or to heat their facilities in winter. Much of the rest is sold for animal bedding.
Total residue produced by this industry in Indiana is not collected by any agency and therefore is unknown or can only be estimated.
urban residue
There are two principal sources of urban wood residue – municipal solid waste (MSW) and construction or demolition (C/D) debris. MSW consists of a variety of items, including food scraps, paper, plastics, discarded furni-ture and appliances. Wood, yard and tree trimmings are the sources in urban residue that would be recoverable for woody biomass applications. Wood components would include discarded furniture, pallets, containers, lumber scraps and wood residue from manufacturing plants. Approximately 55 percent (McKeever 2004) of this material is used as compost, burned for power or is unavailable due to contamination. The remaining component in the MSW stream is yard and tree trimmings; only a small percentage of which is used after accounting for what is recovered and what is unusable.
Construction and demolition debris make up the other principal source of urban residue. These are considered sepa-rate from MSW since they come from different sources. Most of this residue is correlated to economic activity, popula-tion, demolition activity, and recycling programs. A large percentage of construction debris is potentially usable, unlike demolition debris, which tends to be more often than not contaminated, making recovery expensive and difficult.
Currently, there is little to no data available as to the volume of urban wood residue that could be used. However, there are tools available to estimate urban wood biomass. Hopefully, cities will begin using this tool and be able to provide a better picture of urban wood biomass/residue volumes.
Estimating wood waste being collected at landfills across the state is a somewhat complex. Total tonnage is available and broken down by waste type. C/D waste is broken down, but there are other items besides wood that fall into the C/D category. Keeping this in mind, the Indiana Department of Environmental Management reports that in 2007 there was 808.6 tons of C/D waste collected across the state.2 Although not scientific, estimating 20 percent of the total as wood waste would amount to more than 161 thousand tons of wood waste. 2 Indiana Department of Environment Management, 2007 Solid Waste Facilities Annual Report

16
Harvest/Logging Residue Supply Harvest/Logging residue is defined as the unused portions of the merchantable central stem of growing-stock trees cut or killed by logging during the harvesting of timber for commercial products (e.g., saw logs, pulpwood, etc.).
It is important to note that it may not be feasible economically, logistically, or silviculturally to collect and use the en-tire volume of logging residue that is generated. In some harvesting units, most logging residue is dispersed across the site and would be very costly to collect. In other units, particularly where whole-tree harvesting and skidding are used, the majority of logging residue is concentrated at log landings, but some residue inevitably remains near where each tree was felled and along skid trails. Because of these factors, not all logging residue is or would be available for use as a woody biomass feedstock. The total amount of logging residue produced during the harvesting of timber products (e.g.., saw logs, pulpwood, veneer logs, etc.) in Indiana was estimated to be 62 million cubic feel or 1.2 million green tons (Fig 3).3 The red oak, white oak, and yellow-poplar species groups accounted for 56 percent of the volume of harvest residue generated in Indiana. The Knobs unit (fig. 1) accounted for more than 44 percent of the total harvest residue, while the Lower Wa-bash accounted for 25 percent. The Northern and Upland Flats units had 22 and 9 percent respectively (fig. 4). More than two-thirds of the wood material left on the ground after the harvest of Indiana’s industrial roundwood came from non-growing-stock sources such as limb wood, dead trees, culls trees, non-forest trees, and saplings.
(Fig. 3)Harvest Residue TOTALStatewide 62 million cubic feet 1,237,623 green tonsKnobs 27,867,000 cubic feet 552,000 green tonsLower Wabash 15,622,000 cubic feet 309,400 green tonsNorthern 13,547,000 cubic feet 267,000 green tonsUpland Flats 5,332,000 cubic feet 106,400 green tons
(Fig
Distribution of Harvest/Logging Residue by FIA Units (green tons)average of 2000-2005 TPO surveys
Upland Flats106,400 , 9%
Northern267,000 , 22%
Lower Wabash309,400 , 25%
Knobs552,000 , 44%
3 USDA Forest Service, Resource Bulletin-NRS 22, Indiana Timber Industry-An Assessment of Timber Prod-uct Output and Use, 2005

17
Live Tree Woody Biomass Above-ground live tree woody biomass in trees with diameter at breast height (DBH) ≥ 1.0 inch (in.) on timberland in Indiana totals 474.3 (MGT).4 Small live trees are very abundant in Indiana, and many have suggested using small trees removed from the forest during restoration or Timber Stand Improvement (TSI) projects as a source of woody bio-mass. There are more than 2.3 billion live trees on Indiana forestland, and 81 percent of those trees have dbh < 7.0 in.
all live biomass of forestland (green tons)Current dbh 2 inch classes to 40 inches
Total National Forest
National Park Service
F&W Service
Dept of Defense
Other federal State County and
Municipal Private
1.0-2.9 8,511,970 313,713 14,419 185,911 213,888 24,340 650,907 49,489 7,059,303
3.0-4.9 17,145,470 543,298 123,593 377,797 355,327 91,052 1,193,826 83,277 14,377,301
5.0-6.9 23,112,678 867,103 157,834 451,592 476,250 84,957 1,475,735 125,986 19,473,221
7.0-8.9 32,653,241 1,272,781 95,908 620,593 637,566 115,915 2,490,320 147,488 27,272,670
9.0-10.9 40,972,675 1,647,953 166,730 613,530 975,097 220,520 3,229,818 136,866 33,982,160
11.0-12.9 46,665,957 2,032,921 179,835 495,321 1,070,604 200,584 3,376,442 141,778 39,168,472
13.0-14.9 50,270,671 2,274,939 83,982 410,921 1,840,038 293,752 3,943,626 310,262 41,113,151
15.0-16.9 52,593,718 2,729,656 164,913 165,229 868,774 339,393 3,711,822 359,226 44,254,705
17.0-18.9 52,556,942 2,900,014 97,726 614,772 1,425,602 419,471 4,467,943 295,162 42,336,252
19.0-20.9 40,621,609 1,806,458 58,792 137,057 1,403,353 700,164 3,115,136 134,833 33,265,817
21.0-22.9 32,516,746 1,425,046 345,327 289,240 921,488 95,831 1,629,491 319,059 27,491,264
23.0-24.9 22,651,959 763,854 95,414 149,936 1,272,841 129,233 2,026,999 140,671 18,073,012
25.0-26.9 15,983,468 546,155 0 0 675,701 0 1,136,476 95,459 13,529,677
27.0-28.9 10,946,177 389,170 0 0 462,661 133,448 1,151,231 0 8,809,666
29.0-30.9 8,837,141 207,564 0 0 0 0 424,697 300,937 7,903,943
31.0-32.9 5,866,933 0 0 0 0 0 367,773 333,399 5,165,761
33.0-34.9 2,634,479 0 0 0 0 0 172,280 85,775 2,376,424
35.0-36.9 1,958,839 0 0 0 221,201 0 0 0 1,737,638
37.0-38.9 3,419,346 0 0 0 0 0 829,327 351,091 2,238,928
39.0-40.9 2,968,328 0 0 0 0 0 0 0 2,968,328
41.0+ 1,502,765 0 0 0 0 0 0 0 1,502,765
Total 474,391,114 19,720,626 1,584,473 4,511,898 12,820,394 2,848,659 35,393,848 3,410,757 394,100,459
Another key component relating to the supply and availability of woody biomass is ownership. Eighty-three percent 4 USDA Forest Service FIA Program, Indiana 2003-2007

18
(394.1 MGT) of live tree woody biomass on Indiana forestlands is privately owned (Table 2), with the next largest ownership class being federal lands with 8 percent (41.4 MGT).
All Live Biomass on Forestland by Ownership (green tons)
Private394,100,459
Federal41,486,050
State35,393,848
County & Municipal3,410,757
Privately owned forests comprise almost 84 percent (4 million acres) of forestland in Indiana. Federal lands account for 8.2 percent; state and local forestland account for 7.8 percent. On average, privately owned forests have about 97.5 green tons per acre of live tree woody biomass. The statewide average is 98 green tons per acre of live tree woody biomass.
If use of live tree woody biomass is going to increase appreciably in Indiana, it likely will require using material from all ownership classes. Privately owned forests will play a pivotal role in biomass availability, if for no other reason than their majority shares of timberland and biomass supply in the state.

19
Standing Dead Tree Woody Biomass Standing dead trees are also quite abundant in Indiana, and many have suggested using standing dead trees removed from the forest during timber salvage or timber stand improvement (TSI) projects. Above-ground standing dead tree woody biomass does not include trees, logs, limbs, or leaves and needles lying on the forest floor. This material is referred to as coarse woody debris or forest litter. Above-ground standing dead tree woody biomass in trees with dbh ≥ 5.0 in. totals 406,580,039 cubic feet; of which more than 398 million cubic feet (98 percent) is potentially available (2003-2007 IN FIA). (FIA does not measure standing dead trees with dbh < 5.0 in.) Almost 47 percent of the stand-ing dead tree woody biomass is in standing dead trees with dbh < 15.0 in.
inventory -- indiana 2003-2007: area/voLume -- aLL units reportingIndiana (18) -- Net tree volume (standing dead) on forest land by Species group and Diameter class (in cubic feet)
Tree Diameter Classifications
Total5.0-6.9 in
(3)7.0-8.9 in
(4)9-10.9 in
(5)11-12.9 in
(6)13-14.9 in
(7)15-16.9 in
(8)17-18.9 in
(9)19-20.9 in
(10)21-28.9 in
(11)29+ in (12)
177,838 239,572 209,993 123,834 184,583 -- -- -- -- -- 935,820
629,181 597,518 2,619,148 366,635 476,354 -- -- -- -- -- 4,688,836
835,841 1,757,543 1,659,087 1,515,008 -- -- -- -- -- -- 5,767,479
51,038 167,735 184,860 258,908 -- -- -- -- -- -- 662,541
1,744,449 1,760,853 1,092,034 1,062,981 472,786 -- -- -- -- -- 6,133,103
1,913,417 1,805,283 1,826,700 1,436,101 2,877,275 1,641,957 2,711,758 1,445,431 11,352,446 2,380,112 29,390,480
229,497 364,849 729,556 -- 1,244,972 -- 2,651,776 2,142,038 3,807,303 1,941,684 13,111,673
107,641 349,563 460,985 171,209 444,936 2,723,241 -- -- -- -- 4,257,575
1,344,263 2,837,233 1,620,827 788,370 3,396,983 2,514,965 1,327,043 2,715,105 17,358,266 -- 33,903,055
1,145,075 1,460,043 1,902,067 3,445,982 6,422,520 6,297,395 3,023,196 1,179,868 1,135,094 5,692,202 31,703,441
1,409,633 1,095,429 2,149,120 2,522,556 3,158,624 2,397,555 3,011,314 -- 1,915,192 2,287,750 19,947,174
1,758,881 1,167,399 1,415,829 1,871,217 1,803,235 1,475,903 2,582,240 4,756,954 5,433,493 3,003,774 25,268,926
83,804 -- 148,070 457,531 430,280 641,903 3,207,693 -- 7,839,068 8,078,267 20,886,617
113,280 394,064 391,352 1,140,228 1,393,478 516,105 -- -- -- -- 3,948,507
124,309 -- 556,494 -- -- -- -- -- -- -- 680,803
2,969,910 1,919,793 3,810,797 3,094,342 2,172,113 990,968 2,652,327 -- 1,602,927 3,289,578 22,502,754
373,880 933,803 1,253,926 1,186,069 3,282,617 726,124 1,316,930 -- 2,892,880 -- 11,966,228
178,597 -- -- 1,072,676 -- -- -- -- -- -- 1,251,273
1,331,192 1,691,462 3,110,541 2,405,087 2,561,322 5,269,269 597,234 577,145 -- -- 17,543,250
291,608 637,951 1,067,764 -- -- -- -- 510,547 -- -- 2,507,870
18,292,778 19,296,595 14,116,761 14,636,140 15,433,847 8,349,792 5,007,725 4,955,374 19,466,844 5,177,874 124,733,728
3,422,854 3,320,554 3,003,582 3,691,850 3,163,853 2,008,310 2,360,862 612,335 -- -- 21,584,200
1,372,603 890,956 574,635 366,514 -- -- -- -- -- -- 3,204,707
Totals 39,901,566 42,688,198 43,904,129 41,613,238 48,919,776 35,553,486 30,450,097 18,894,796 72,803,512 31,851,240 406,580,039

20
Availability (% non-reserved) of Standing Dead Volume by FIA Unit (cubic feet)
Upland Flats46,248,142
90%
Northern146,686,711
98%
Lower Wabash 65,976,812
96%
Knobs139,809,294
98%
The Northern unit contains 37 percent of the total volume of standing dead woody biomass, followed closely by the Knobs unit with 35 percent. The remaining is split between the Lower Wabash (17 percent) and Upland Flats (11 percent) units.
Standing Dead Volume by FIA Unit (cubic feet)
Northern148,758,458,
37%
Upland Flats46,741,605,
11%
Knobs142,833,805,
35%
Lower Wabash
68,246,171, 17%

21
Almost 90 percent (358.6 MM cubic feet) of standing dead tree woody biomass on Indiana forestland is located on private forestland, followed by 5.3 percent (21.4 MM cubic feet) on federal owned lands.
Standing Dead by Ownership (cubic feet)
Private358,685,397
LocalMunicipal4,152,241State
14,469,574 Federal 1,413,747
22
Potential Concerns and Impacts
Woody biomass has the potential to be an additional resource for biobased products for bioenergy. This potential would need to be properly and extensively managed by using scientific forest management techniques to be a sustain-able source of fuel/energy for future generations.
The major resources for this woody biomass would come from primary and secondary manufacturing sources. How-ever, there is concern that most of this biomass already is being used by the forest products industry. Many manufac-tures use the fines for animal bedding or to fuel/heat their facilities, wood chips go into paper products, and mulch for landscaping.
Some additional quantities of woody biomass would come from primary sources such as logging, crop forestland and pulpwood residue. Urban biomass residue is thought to be a smaller source relative to the primary and secondary manufacturing sources, but this is due mainly to the unknown amounts in landfills, recycled (pallets) and/or used as mulch in urban areas. It is thought this tertiary residue, in the near term, will become an essential supply of raw mate-rial to be sourced and processed for fuel by the bioenergy companies as their needs increase. The ability to produce and economically source hundreds of thousands of tons of woody feedstock annually and eco-nomically will require additional technological advancements that enhance the recovery, use, and marketing of these stocks while reducing the cost of handling. Modifications and/or advancements in the way this feedstock is harvested, collected, stored and transported will also have to be achieved, if financial success is paramount. These advancements and modifications will require large capital investments and possibly policy changes and/or initiatives to entice bioen-ergy business and/or individuals to develop the required infrastructure. An overall concerted research and development effort will be needed for woody biomass to be energy efficient and cost effective.
Demonstration projects and analyses would also be welcomed to determine the potential impact that large scale collec-tion of forest residue would have on the conventional hardwood industries and wildlife habitats. These demonstration projects are necessary in determining the most cost effective process and equipment needed to collect harvest residue. Additionally, seeking stakeholder group participation to gain public support also will be necessary to achieve overall ac-ceptance. This will include and require coordination of the Departments of Natural Resources, Agriculture and Energy both on the federal, state and local governments and/or organizations.

23
Biomass Resources The three key woody biomass resources identified for this report are primary and secondary manufacturing sources, logging and other forest removals and urban wood residue. Each residue has particular utilization issues.
Accessibility, steep terrain and environmentally protected areas may limit to some degree the availability to collect woody biomass in the forest. Where operations are appropriate, the expense (logistics and product pricing) to remove excess biomass may not be cost effective. Purchasing and marketing the larger diameter trees for commercial use may help offset the logging costs of harvesting the smaller sized material. However, the combination of removing both small and large diameter material may leave a “clear cut” look, creating an unfavorable public opinion and opposition to woody biomass use. Current transportation costs, in the range of $1.90 to $2.15 per mile (approximately 35 cents/dry ton mile) to some extent limits the haul radius based only on the biomass volume and product pricing. Elevated logistical costs could severely limit the feasible transportation distance to available markets by diminishing profit margins or the reverse – compel operators to increase product pricing to their customers, which would have a ripple effect on the final mar-kets.Removal of large volumes of biomass from timberlands has the possibility of reduced long-term site productively for future needs. The loss of wildlife habit associated with the collection of downed wood debris may also be a cause for alarm. Minimizing the negative impact could be accomplished by leaving all the small debris and portions of the woody biomass in the forest. Urban woody biomass currently is a smaller but essential part of the equation to meet the volume require-ments for biomass fuel. However, in the future it will play a vital role in raw material use to reduce the competition for biomass fuel. Urban biomass requires specialized equipment along with collection points to minimize transportation costs. The high startup costs in the initial stages versus product pricing could be an impediment.

24
ConclusionThe Indiana Department of Natural Resources, Forestry Division, supports the expansion/use of woody biomass as an energy source. This support of forest-based fuels is one additional way to reduce our dependence for energy from oil imports along with supporting agriculture and sound forest management. The nurturing and development of new biomass industries create safe and clean efficient energy for future generations and have a direct impact on local econo-mies.
The rationale for this report was to account for and describe the amounts of woody biomass available in Indiana along with determining if this resource is sufficient and economical to support one or more woody biomass facilities. The study information finds that Indiana forests do produce an adequate amount woody biomass to supply energy related facility(s).
It should be acknowledged that not all woody biomass in this study is necessarily available, and much of it is used cur-rently in one form or another. While current use of manufacturing wood byproduct material may not be for the high-est benefit, its new uses will compete with current uses for this material. It is a misconception that byproducts from the primary and secondary wood industry are “free” or “going to the landfill.” Logistics costs, product pricing, protected forested areas and public issues all play an important role in the biomass that is currently available for consumption.
Primary and secondary residue combined with harvest residue has the potential to produce approximately 2.5 million green tons of woody biomass. These volumes come from the manufacturing of various products, pulpwood, chips, bark, veneer clippings and fines along with additional residue generated from manufactured goods, with the exception of municipal solid waste (urban) residue, existing uses in pulp and paper production, landscaping materials, animal bedding and pellet production must be taken into consideration when calculating the total use of this material.
Growing trees (above ground) 15 inches and greater produce an additional 394 million green tons of residue. How-ever, much of this timberland (trees) is sold commercially for lumber production, thus reducing the total volume available for the production of energy. Sound forest management practices, timber stand improvement (TSI) and other thinning to reduce forest fire potential also can play a role in meeting future energy needs using woody biomass. In closing, Indiana has adequate woody biomass stocks to supply the energy needs of a conversion facility. Conversely, there are several important issues that need be addressed. The three significant factors in the planning of a conversion facility are location of forestland, logistics, and product pricing. Without careful consideration of these three key com-ponents, success could be unattainable. One or more smaller strategically located facilities using 75,000 to 150,000 tons annually may offer better economies of scale and could support the needs of smaller municipalities, universities, and hospitals throughout the state.

25
SourcesForest Inventory and Analysis National Program, Indiana Data Cycle 2003-2007 www.fia.fs.fed.us/tools-data/other/default.asp
Indiana Timber Industry – An Assessment of Timber Product Output and Use, 2005. Resource Bulletin NRS-22, Ronald J. Piva, Joey Gallion, 2007 www.nrs.fs.fed.us/pubs/rb/rb_nrs22.pdf
Indiana Department of Environmental Management 2007 Solid Waste Facilities Annual Report, Michelle Weddle, Project Coordinator www.in.gov/idem/files/solid_waste_far07.pdf
Biomass as Feedstock for a Bionergy and Bioproducts Industry; The Technical Feasibility of a Billion-Ton Annual Supply – U.S. Department of Energy, U.S. Department of Agriculturewww1.eere.energy.gov/biomass/pdfs/final_billionton_vision_report2.pdf
