wool market in the balance: global wool prices, supply …€¦ · wool market in the balance:...
TRANSCRIPT

Wool Market in the Balance:
Global Wool Prices, Supply and Demand
Chris Wilcox
Chairman, Market Intelligence Committee
IWTO 2016 Congress, Sydney
4 April 2016

Anticipated− Slow economic recovery in advanced
economies
− China economy in transition
− Better raw wool demand
− Low world wool production
− Pull-back in superfine wool production
− Higher wool prices, particularly merino
cardings
− Continued strong demand for double-faced
woollen fabric
Events Affecting the Wool Industry since
84th IWTO Congress in 2015
Surprises− Spike in prices and surge in supplies in
Australia in May-June 2015
− Large decline in commodity prices
− Periods of global sharemarket upheaval
− Recovery in A$ and NZ$ against US$

World Wool Prices In the Past Year(% change March 2016 compared with March 2015)
-20% -10% 0% 10% 20% 30% 40% 50%
Aust EMI
Aust 18um
Aust Merino Card
South Africa MI
South Africa 21um
NZ Fine xbred
NZ xbred
British MI
Uruguay corriedaleUS$
Local currency
% change
Source: AWEX, NZ Wool Services, Capewools, BWMB, Zambrano & Cia (Uruguay)

Wool Outperforms Other Commodities% change March 2016 vs March 2015 – US$ base
Source: AWEX, The Economist, CotLook, PCI Fibres
Prices to March 2016
Apparel wool – Australian EMI; Interiors Wool – NZ Crossbred wool
-30%
-25%
-20%
-15%
-10%
-5%
0%
5%
10%
ApparelWool
InteriorsWool
Cashmere Cotton PolyesterStaple
Acrylic Oil Metals
% change y-o-y

World Wool Production Down then Flat
• World wool production steady in 2014/15 at 1,166 mkg clean
• World production predicted down by 1.5% in 2015/16– Up in China, India, UK, Mongolia and USA
– Down in Australia (-7%), New Zealand, South Africa, Uruguay (-9%)
• Continued interest in sheep for meat or dual-purpose
• Competition from other agricultural enterprises lessens (e.g. dairy in NZ)
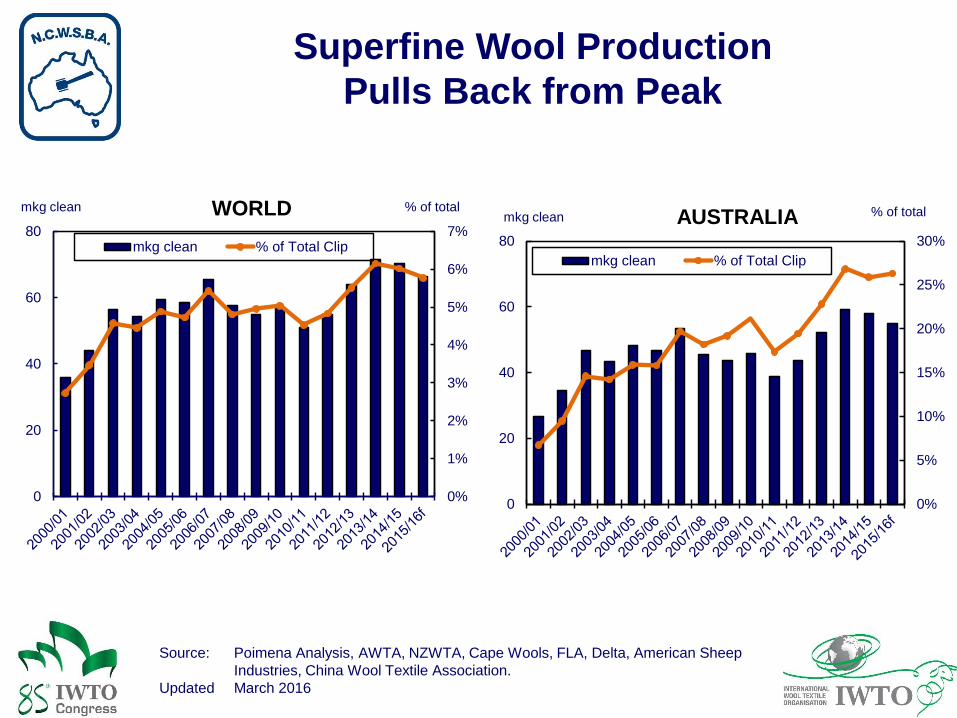
• Superfine (18.5 micron and finer) wool production falls back from peak
• Major decline in medium and broader Merino wool
• World wool production predicted to be flat in 2016/17– Lower production in Australia offset by expected increases in most other IWTO
countries

World Wool Production TrendsTotal wool production - mkg clean
Source: IWTO national committee reports, FAO and Poimena Analysis
Note: 2015 = 2014/15 for Australia, NZ, Uruguay, Argentina, South Africa. Updated: 30th March 2016
mkg clean 2015 2016f % change 2017f % change
“Apparel” wool IWTO countries
Australia 277 258 -7.0% 256 -0.6%
Argentina 28 28 0.0% 29 +0.7%
South Africa 30 30 -1.0% 30 +1.6%
Uruguay 22 19 -8.8% 20 +3.8%
USA 7.2 7.3 +1.5% 7.4 +1.9%
“Interior textile” wool IWTO countries
China 176 177 +0.3% 177 0.0%
New Zealand 114 112 -2.2% 112 +0.1%
India 39 39 +0.6% 39 +0.5%
UK 22 22 -1.0% 22 0.0%
Mongolia 17 18 +8.4% 21 +11.1%
Others 442 446 +0.8% 449 +0.7%
Global 1,166 1,148 -1.5% 1,154 +0.5%
0%
1%
2%
3%
4%
5%
6%
7%
0
20
40
60
80mkg clean % of Total Clip
mkg clean % of totalWORLD
Superfine Wool Production
Pulls Back from Peak
0%
5%
10%
15%
20%
25%
30%
0
20
40
60
80
mkg clean % of Total Clip
% of totalAUSTRALIAmkg clean
Source: Poimena Analysis, AWTA, NZWTA, Cape Wools, FLA, Delta, American Sheep
Industries, China Wool Textile Association.
Updated March 2016

Medium Merino Wool Production DropsAustralian Wool Production by Micron Range
Shares
Source: Australian Wool Production Forecasting Committee and Australian Wool
Testing Authority
Updated: March 2016
0%
25%
50%
75%
100%
1991/92 1994/95 1997/98 2000/01 2003/04 2006/07 2009/10 2012/13 2015/16f
18.5um & finer 18.6-20.5 um 20.6-24.5 um 24.6um and broader% share

IWTO Wool Textile Business Survey 2016
Eleven countries reported
Care with interpreting results
Early stage processing tracking slightly below “normal”
Knitting, weaving and interior textiles sectors come back from
“good” conditions
Spinning improving a little
Excess stocks in weaving, knitting, garment making and interior
textiles in 2015
Stocks now under control?
Low stocks currently in ESP

Wool Textile Industry Production Activity:
Return to Normal Levels?
1
2
3
4
5
Rating
Early Stage Proc
Spinning
Weaving
Source: IWTO Wool Textile Business Survey
Weighted results for China, Italy, Germany, Uruguay, Mongolia, Argentina,
South Africa, Japan, France, Spain and the United Kingdom
Very Good
Normal
Good
Poor
Very Poor 1
2
3
4
5
Rating
Knitting
Garment making
Interior textiles

Wool Textile Industry Stock Levels
Pull Back from Highs
1
2
3
4
5
2009 2010 2011 2012 2013 April2014
2014 April2015
2015 March2016
End2016f
Early Stage Proc Spinning
Weaving Knitting
Garment making Interior textiles
Well above
normal
Above normal
Normal
Below normal
Well below
normal
Source: IWTO Wool Textile Business Survey
Weighted results for China, Italy, Germany, Uruguay, Mongolia, Argentina,
South Africa, Japan, France, Spain and the United Kingdom

Raw Wool Imports by Europe Turns Up12 month rolling aggregate
-15%
-10%
-5%
0%
5%
10%
15%
20%
Total China
% change y-o-y
Source: Australian Bureau of Statistics, FLA, SUL, Capewools, Beef and Lamb NZ
Data to January 2016
-30%
-20%
-10%
0%
10%
20%
30%
40%India
Western Europe
Other
% change y-o-y

Clothing Retail Sales in the Major Wool
Consuming Countries
% change y-o-y 2010 2011 2012 2013 2014 2015 Oct-Jan
2014 2015
China +25.8% +25.1% +17.7% +11.5% +10.8% +9.5% +8.9% +6.6%
USA +6.0% +3.4% +0.9% +1.3% +1.1% +3.8% +5.1% +1.5%
Japan -6.3% +3.2% -0.4% -0.7% -0.5% -2.3% -1.0% -3.3%
Germany +1.2% +0.9% -0.3% +0.1% +1.3% +2.6% +2.1% +1.6%
UK +5.4% +3.3% +1.5% +3.1% +5.2% +1.6% -1.0% +0.2%
Italy +0.8% -1.1% -2.3% -2.1% -1.3% +0.8% -1.1% +0.7%
France +2.8% +1.7% +0.6% +1.1% +1.2% +2.9% +1.6% +2.0%
South Korea +9.8% +8.6% +3.2% +0.8% +1.6% +3.5% +0.7% +5.6%
Source: Government statistical bureaus.
Notes: Value of retail sales. China is for retail sales of garments, hats, footwear and knitwear.
Japan is for major department stores. Germany, Italy, France and South Korea is total
retail sales.

Retail Sales of Furnishings and
Floorcoverings in Selected Countries
% change y-o-y China USA Japan UK
2010 +37.2% +2.1% -4.0% -17.6%
2011 +32.8% +9.6% -1.8% -22.1%
2012 +27.0% +6.3% +1.7% +28.9%
2013 +21.0% +10.4% -2.5% +14.5%
2014 +13.9% +6.5% -1.8% -3.1%
2015 +16.1% +5.9% -14.8% -28.9%
Source: Government statistical bureaus.
Notes: Value of retail sales. China is for retail sales of furniture including floorcoverings, USA
is for carpets and other floorcoverings. Japan is for sales of furniture in major
department stores. UK is for floor covering retail stores.

0
200
400
600
800
1.000
1.200
1.400
Knitwear Men's suits Men'sseparates
Men's coats Women'swovens (ex
coats)
Women'scoats
Woolfloorcoverings
2012 2013 2014 2015
$US million
-2%
+1%
-4%
-5%
-12%
-14%
-4%
Source: OTEXA
Disappointing US Imports of Wool Products
in 2015(Value - Calendar Year)

Drivers and Prospects for 2016/17
• Slower world economic growth in 2016 and 2017
– Solid in US and UK, improving in Europe and Japan
– China slowing and in transition – a key for wool
• Positive consumer confidence in the US, Europe and
Japan
• BUT… Disappointing results for US imports of wool
products
• Mixed forecasts for growth in private consumption
• Wool textile industry stocks now under control?
• Low world wool production continues
• High price ratio for wool against cotton prices and
synthetic fibres – does it matter?
• US$ predicted to be strong against grower country
currencies, but how accurate are the forecasters?
Prospects in the balance

Country
Share of
wool at
retail
Private Consumption Forecasts
2014 2015 2016(f) 2017(f)
China* 23% 7.3% 6.9% 6.4% 6.2%
USA 11% 2.4% 2.4% 2.7% 2.6%
Japan 9% -1.0% -1.2% 0.4% 0.1%
Italy 5% 0.4% 0.9% 1.4% 1.2%
Germany 5% 0.9% 1.9% 2.0% 1.6%
South Korea 5% 3.3% 2.6% 2.5% 2.4%
UK 4% 2.6% 2.9% 2.7% 2.2%
France 3% 0.6% 1.4% 1.3% 1.6%
Private Consumption Forecasts in Key
Apparel Wool Consuming Countries
(f) forecast. * China is GDP growth.
Source: Poimena Analysis for wool at retail, three year average 2012-14, Consensus
Forecast (March 2016)

0
1
2
3
4
5
6
7
8
19 micron 21 micron 28 micron
Ratio
Wool Price Competitiveness US$ terms
0
1
2
3
4
5
6
7
8
19 micron 21 micron 28 micron
Ratio Synthetics Cotton
Source: AWEX, Cotton Outlook, PCI Fibres, CIRFS, Woolmark, Poimena AnalysisData to March 2016
Note: for 28 micron wool, the ratio is against acrylic fibre

Thank You!

Lower Wool Exports This SeasonFinancial Year to January
0
50
100
150
200
250
300
350
400
Australia New Zealand Argentina South Africa Uruguay Total
mkg g
reasy e
quiv
.
2009/10 2010/11 2011/12 2012/13
2013/14 2014/15 2015/16
-11%+2%
-9%
-20%
-5%
-8%
Source: Australian Bureau of Statistics, FLA, SUL, Capewools, Beef and Lamb NZ