woongjin coway co., ltd. audit report_2010...we have audited the accompanying non-consolidated...
TRANSCRIPT

1
Woongjin Coway Co., Ltd. Non-consolidated financial statements Years ended December 31, 2010 and 2009 with independent auditors’ report

Woongjin Coway Co., Ltd. Non-consolidated financial statements Years ended December 31, 2010 and 2009 with independent auditors’ report
Woongjin Coway Co., Ltd. December 31, 2010 and 2009
Contents Page Independent auditors’ report 1-2 Non-consolidated statements of financial position 3-5 Non-consolidated statements of income 6 Non-consolidated statements of appropriations of retained earnings 7 Non-consolidated statements of changes in equity 8-9 Non-consolidated statements of cash flows 10-11 Notes to non-consolidated financial statements 12-49 Internal control over financial reporting review report 50 Report on the operations of the internal control over financial reporting 51

1
Taeyoung Bldg., 10-2, Yeouido-dong,Yeongdeungpo-gu, Seoul 150-777 Korea Tel: +82 2 3787 6600 Fax: +82 2 783 5890 www.ey.com/kr
A member firm of Ernst & Young Global Limited
Independent auditors’ report The Board of Directors and Stockholders
Woongjin Coway Co., Ltd.
We have audited the accompanying non-consolidated statements of financial position of Woongjin
Coway Co., Ltd. (the “Company”) as of December 31, 2010 and 2009, and the related statements of
income, appropriations of retained earnings, changes in equity and cash flows for the years then ended.
These non-consolidated financial statements are the responsibility of the Company’s management. Our
responsibility is to express an opinion on these non-consolidated financial statements based on our
audits. We did not audit the financial statements of a subsidiary, which is accounted for using the equity
method. The carrying amount of the investment in that subsidiary represents approximately 9.8% and
8.05% of the Company’s total assets as of December 31, 2010 and 2009, respectively, and equity in
earnings of the subsidiary using the equity method represents approximately 10.94% and 2.13% of the
Company’s income before income taxes for the years ended December 31, 2010 and 2009,
respectively. Those financial statements were audited by other auditors whose report has been
furnished to us, and our opinion, insofar as it relates to the amounts included for this subsidiary, is
based solely on the report of the other auditors.
We conducted our audits in accordance with auditing standards generally accepted in the Republic of
Korea. Those standards require that we plan and perform the audit to obtain reasonable assurance
about whether the non-consolidated financial statements are free of material misstatement. An audit
includes examining, on a test basis, evidence supporting the amounts and disclosures in the non-
consolidated financial statements. An audit also includes assessing the accounting principles used and
significant estimates made by management, as well as evaluating the overall non-consolidated financial
statement presentation. We believe that our audits and the report of other auditors provide a
reasonable basis for our opinion.
In our opinion, based on our audits and the report of other auditors, the non-consolidated financial
statements referred to above present fairly, in all material respects, the financial position of Woongjin
Coway Co., Ltd. as of December 31, 2010 and 2009, and the results of its financial performance, and
its cash flows for the years then ended in conformity with accounting principles generally accepted in
the Republic of Korea.

2
A member firm of Ernst & Young Global Limited
The Board of Directors and Stockholders
Woongjin Coway Co., Ltd.
Accounting principles and auditing standards and their application in practice vary among countries. The
accompanying non-consolidated financial statements are not intended to present the financial position,
result of financial performance, and cash flows in accordance with accounting principles and practices
generally accepted in countries other than the Republic of Korea. In addition, the procedures and
practices utilized in the Republic of Korea to audit such non-consolidated financial statements may differ
from those generally accepted and applied in other countries. Accordingly, this report and the
accompanying non-consolidated financial statements are for use by those who are knowledgeable
about Korean accounting principles and auditing standards and their application in practice.
March 16, 2011 This audit report is effective as of March 16, 2011, the auditors’ report date. Accordingly, certain material subsequent events or circumstances may have occurred during the period from the auditors’ report date to the time this audit report is used. Such events and circumstances could significantly affect the accompanying non-consolidated financial statements and may result in modifications to this report.
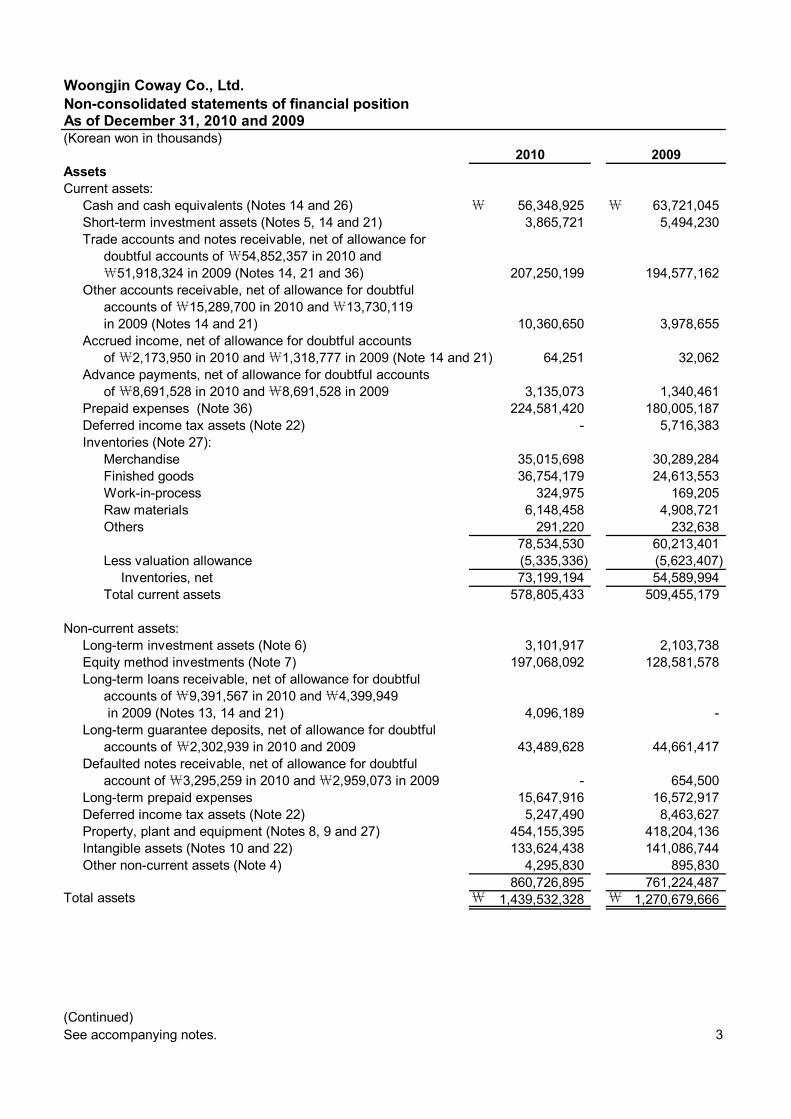
(Korean won in thousands)
AssetsCurrent assets:
Cash and cash equivalents (Notes 14 and 26) \ 56,348,925 \ 63,721,045 Short-term investment assets (Notes 5, 14 and 21) 3,865,721 5,494,230 Trade accounts and notes receivable, net of allowance for
doubtful accounts of \54,852,357 in 2010 and\51,918,324 in 2009 (Notes 14, 21 and 36) 207,250,199 194,577,162
Other accounts receivable, net of allowance for doubtful accounts of \15,289,700 in 2010 and \13,730,119in 2009 (Notes 14 and 21) 10,360,650 3,978,655
Accrued income, net of allowance for doubtful accounts of \2,173,950 in 2010 and \1,318,777 in 2009 (Note 14 and 21) 64,251 32,062
Advance payments, net of allowance for doubtful accounts of \8,691,528 in 2010 and \8,691,528 in 2009 3,135,073 1,340,461
Prepaid expenses (Note 36) 224,581,420 180,005,187 Deferred income tax assets (Note 22) - 5,716,383 Inventories (Note 27):
Merchandise 35,015,698 30,289,284 Finished goods 36,754,179 24,613,553 Work-in-process 324,975 169,205 Raw materials 6,148,458 4,908,721 Others 291,220 232,638
78,534,530 60,213,401 Less valuation allowance (5,335,336) (5,623,407)
Inventories, net 73,199,194 54,589,994 Total current assets 578,805,433 509,455,179
Non-current assets: Long-term investment assets (Note 6) 3,101,917 2,103,738 Equity method investments (Note 7) 197,068,092 128,581,578 Long-term loans receivable, net of allowance for doubtful
accounts of \9,391,567 in 2010 and \4,399,949 in 2009 (Notes 13, 14 and 21) 4,096,189 -
Long-term guarantee deposits, net of allowance for doubtful accounts of \2,302,939 in 2010 and 2009 43,489,628 44,661,417
Defaulted notes receivable, net of allowance for doubtful account of \3,295,259 in 2010 and \2,959,073 in 2009 - 654,500
Long-term prepaid expenses 15,647,916 16,572,917 Deferred income tax assets (Note 22) 5,247,490 8,463,627 Property, plant and equipment (Notes 8, 9 and 27) 454,155,395 418,204,136 Intangible assets (Notes 10 and 22) 133,624,438 141,086,744 Other non-current assets (Note 4) 4,295,830 895,830
860,726,895 761,224,487 Total assets \ 1,439,532,328 \ 1,270,679,666
See accompanying notes. 3(Continued)
Woongjin Coway Co., Ltd.Non-consolidated statements of financial positionAs of December 31, 2010 and 2009
20092010

(Korean won in thousands)
Liabilities and equityCurrent liabilities:
Trade accounts and notes payable (Note 21) \ 38,311,602 \ 29,220,399 Short-term borrowings (Notes 12 and 28) 74,473,032 119,715,069 Other accounts payable (Note 21) 132,391,930 103,577,575 Advances received 116,351,448 121,280,682 Unearned revenues 420,821 43,467 Withholdings 8,612,358 9,776,951 Accrued expenses 10,762,422 12,207,841 Income taxes payable (Note 22) 23,263,552 23,514,516 Provision for product warranties (Note 16) 3,008,687 1,765,671 Provision for return of goods sold (Note 16) 1,193,744 668,268 Current portion of long-term borrowings (Notes 12 and 28) 30,000,000 30,000,000 Current portion of bonds (Notes 12 and 28) - 90,000,000 Deferred income tax liabilities (Note 22) 2,179,905 -
Total current liabilities 440,969,501 541,770,439
Non-current liabilities:Long-term borrowings (Notes 12 and 28) \ 170,000,000 \ 30,000,000 Private bonds, net of discount on bonds
of \227,446 in 2010 and nil in 2009 49,772,554 - Long-term other accounts payable 81,400 24,000 Reserve for agent losses (Note 13) 5,948,614 5,594,074 Rental deposits received from customers 1,119,762 1,121,308 Provision for construction warranties (Note 16) 91,816 139,217 Severance and retirement benefits, net (Notes 15 and 21) 6,723,517 11,336,869 Leasehold deposits received 25,000 15,000
Total non-current liabilities 233,762,663 48,230,468 Total liabilities 674,732,164 590,000,907
Equity:Capital stock (Note 17) 40,662,398 40,662,398 Capital surplus:
Paid-in capital in excess of par value(Notes 17, 22 and 33) 95,244,305 97,276,688
Capital surplus in equity method(Notes 7, 21 and 22) 11,671,472 11,671,472
Other captal surplus (Notes 18 and 22) 33,115,087 32,979,546 140,030,864 141,927,706
Capital adjustments:Treasury stock (Note 19) (34,026,806) (36,432,706)Stock options (Notes 21 and 29) 6,707,194 5,167,222 Capital adjustments in equity method
(Notes 7 and 22) (15,671,255) (248,702)(42,990,867) (31,514,186)
See accompanying notes. 4(Continued)
Woongjin Coway Co., Ltd.Non-consolidated statements of position (cont'd)As of December 31, 2010 and 2009
2010 2009
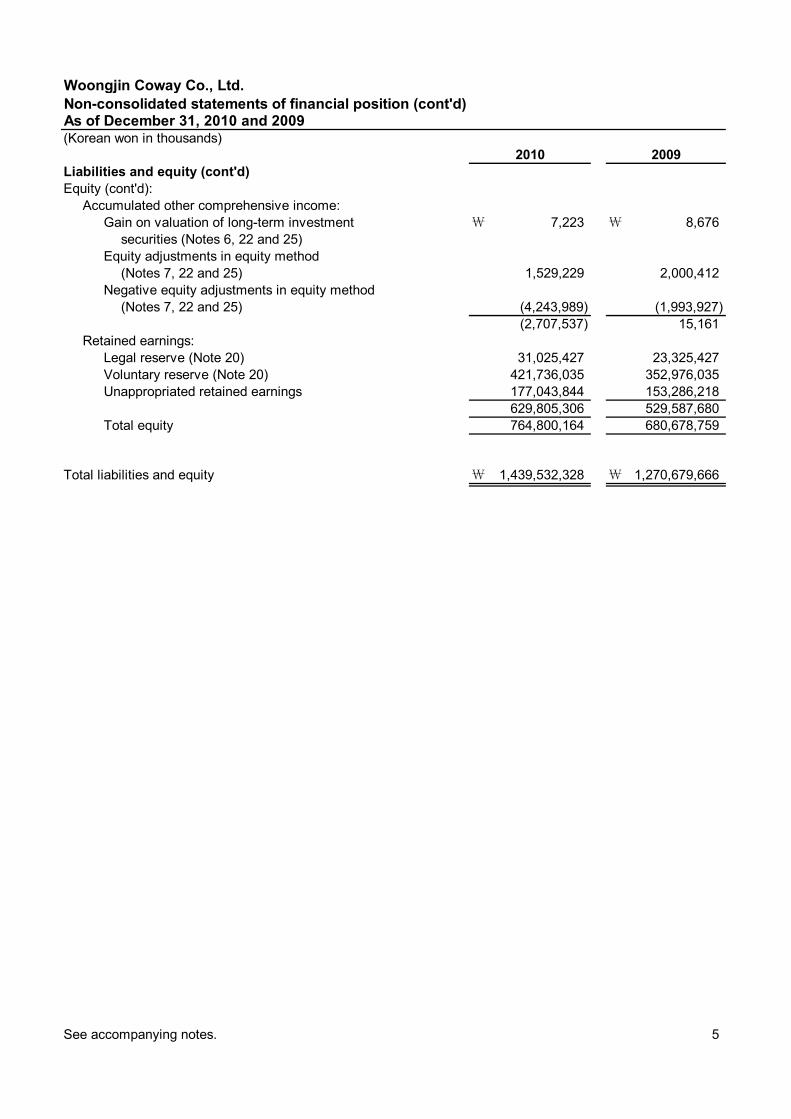
(Korean won in thousands)
Liabilities and equity (cont'd)Equity (cont'd):
Accumulated other comprehensive income:Gain on valuation of long-term investment \ 7,223 \ 8,676
securities (Notes 6, 22 and 25)Equity adjustments in equity method
(Notes 7, 22 and 25) 1,529,229 2,000,412 Negative equity adjustments in equity method
(Notes 7, 22 and 25) (4,243,989) (1,993,927)(2,707,537) 15,161
Retained earnings:Legal reserve (Note 20) 31,025,427 23,325,427 Voluntary reserve (Note 20) 421,736,035 352,976,035 Unappropriated retained earnings 177,043,844 153,286,218
629,805,306 529,587,680 Total equity 764,800,164 680,678,759
Total liabilities and equity \ 1,439,532,328 \ 1,270,679,666
See accompanying notes. 5
20092010
As of December 31, 2010 and 2009
Woongjin Coway Co., Ltd.Non-consolidated statements of financial position (cont'd)
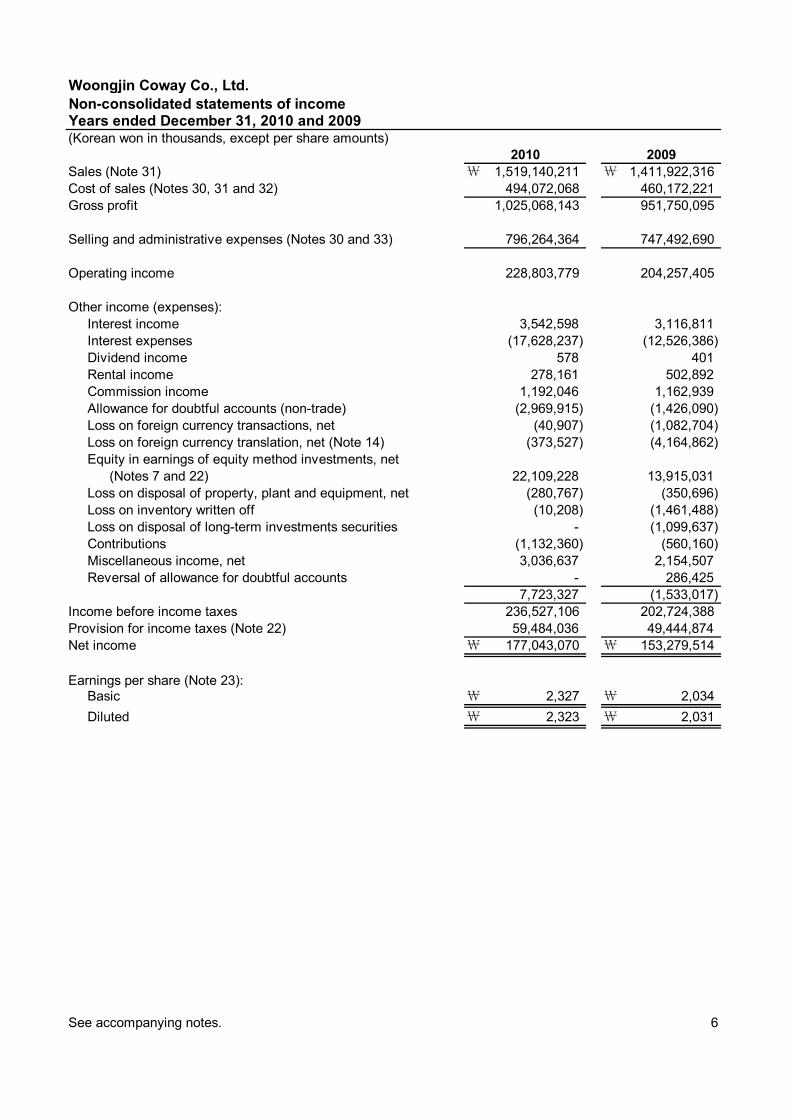
(Korean won in thousands, except per share amounts)
Sales (Note 31) \ 1,519,140,211 \ 1,411,922,316 Cost of sales (Notes 30, 31 and 32) 494,072,068 460,172,221 Gross profit 1,025,068,143 951,750,095
Selling and administrative expenses (Notes 30 and 33) 796,264,364 747,492,690
Operating income 228,803,779 204,257,405
Other income (expenses):Interest income 3,542,598 3,116,811Interest expenses (17,628,237) (12,526,386)Dividend income 578 401Rental income 278,161 502,892Commission income 1,192,046 1,162,939 Allowance for doubtful accounts (non-trade) (2,969,915) (1,426,090)Loss on foreign currency transactions, net (40,907) (1,082,704)Loss on foreign currency translation, net (Note 14) (373,527) (4,164,862)Equity in earnings of equity method investments, net
(Notes 7 and 22) 22,109,228 13,915,031Loss on disposal of property, plant and equipment, net (280,767) (350,696)Loss on inventory written off (10,208) (1,461,488)Loss on disposal of long-term investments securities - (1,099,637)Contributions (1,132,360) (560,160)Miscellaneous income, net 3,036,637 2,154,507Reversal of allowance for doubtful accounts - 286,425
7,723,327 (1,533,017)Income before income taxes 236,527,106 202,724,388 Provision for income taxes (Note 22) 59,484,036 49,444,874Net income \ 177,043,070 \ 153,279,514
Earnings per share (Note 23):Basic \ 2,327 \ 2,034 Diluted \ 2,323 \ 2,031
See accompanying notes. 6
Woongjin Coway Co., Ltd.Non-consolidated statements of incomeYears ended December 31, 2010 and 2009
20092010

(Korean won in thousands)
Retained earnings before appropriations:Unappropriated retained earnings carried forward from the
prior year \ 774 \ 6,704 Net income for the year 177,043,070 153,279,514
177,043,844 153,286,218
Appropriations (2010 - proposed): Legal reserve 8,000,000 7,700,000 Other reserves 89,102,000 68,760,000 Cash dividends (Note 24) 79,941,536 76,825,444
177,043,536 153,285,444 Unappropriated retained earnings to be carried forward to
to the next year \ 308 \ 774
See accompanying notes. 7
Woongjin Coway Co., Ltd.Non-consolidated statements of appropriations of retained earningsYears ended December 31, 2010 and 2009
20092010
(Korean won in thousands)
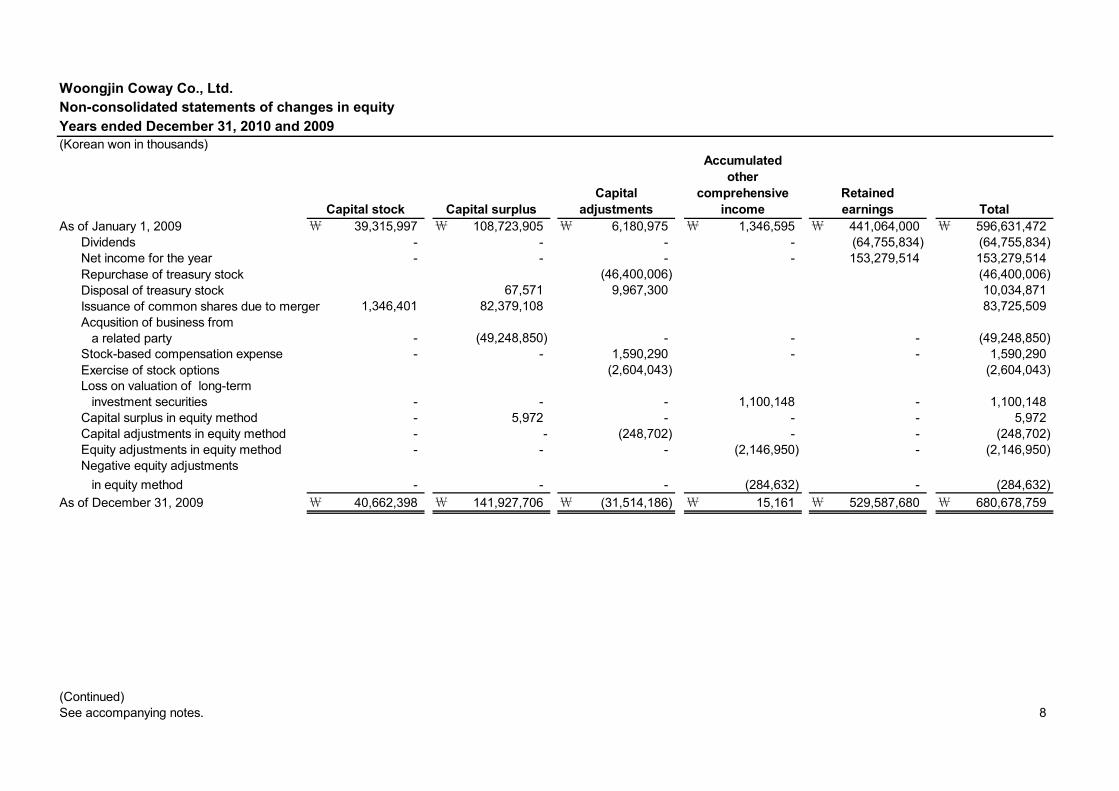
As of January 1, 2009 \ 39,315,997 \ 108,723,905 \ 6,180,975 \ 1,346,595 \ 441,064,000 \ 596,631,472Dividends - - - - (64,755,834) (64,755,834)Net income for the year - - - - 153,279,514 153,279,514Repurchase of treasury stock (46,400,006) (46,400,006)Disposal of treasury stock 67,571 9,967,300 10,034,871Issuance of common shares due to merger 1,346,401 82,379,108 83,725,509Acqusition of business from a related party - (49,248,850) - - - (49,248,850)Stock-based compensation expense - - 1,590,290 - - 1,590,290Exercise of stock options (2,604,043) (2,604,043)Loss on valuation of long-term investment securities - - - 1,100,148 - 1,100,148Capital surplus in equity method - 5,972 - - - 5,972Capital adjustments in equity method - - (248,702) - - (248,702)Equity adjustments in equity method - - - (2,146,950) - (2,146,950)Negative equity adjustments in equity method - - - (284,632) - (284,632)
As of December 31, 2009 \ 40,662,398 \ 141,927,706 \ (31,514,186) \ 15,161 \ 529,587,680 \ 680,678,759
(Continued)See accompanying notes. 8
Retainedearnings Total
Non-consolidated statements of changes in equityWoongjin Coway Co., Ltd.
Years ended December 31, 2010 and 2009
Capital stock Capital surplusCapital
adjustments
Accumulatedother
comprehensiveincome

(Korean won in thousands)
As of January 1, 2010 \ 40,662,398 \ 141,927,706 \ (31,514,186) \ 15,161 \ 529,587,680 \ 680,678,759Dividends (76,825,444) (76,825,444)Net income for the year 177,043,070 177,043,070Disposal of treasury stock - 135,541 2,405,900 - - 2,541,441Acqusition of business from a related party - (2,032,383) - - - (2,032,383)Stock-based compensation expense 2,226,143 - - 2,226,143Exercise of stock options - - (686,171) - - (686,171)Gain on valuation of long-term investment securities - - - (1,453) - (1,453)Capital adjustments in equity method - - (15,422,553) - - (15,422,553)Equity adjustments in equity method - - - (471,183) - (471,183)Negative equity adjustments in equity method - - - (2,250,062) - (2,250,062)
As of December 31, 2010 \ 40,662,398 \ 140,030,864 \ (42,990,867) \ (2,707,537) \ 629,805,306 \ 764,800,164
See accompanying notes. 9
Total
Woongjin Coway Co., Ltd.Non-consolidated statements of changes in equity (cont'd)Years ended December 31, 2010 and 2009
Capital stock Capital surplusCapital
adjustments
Accumulatedother
comprehensiveincome
Retainedearnings
(Korean won in thousands)
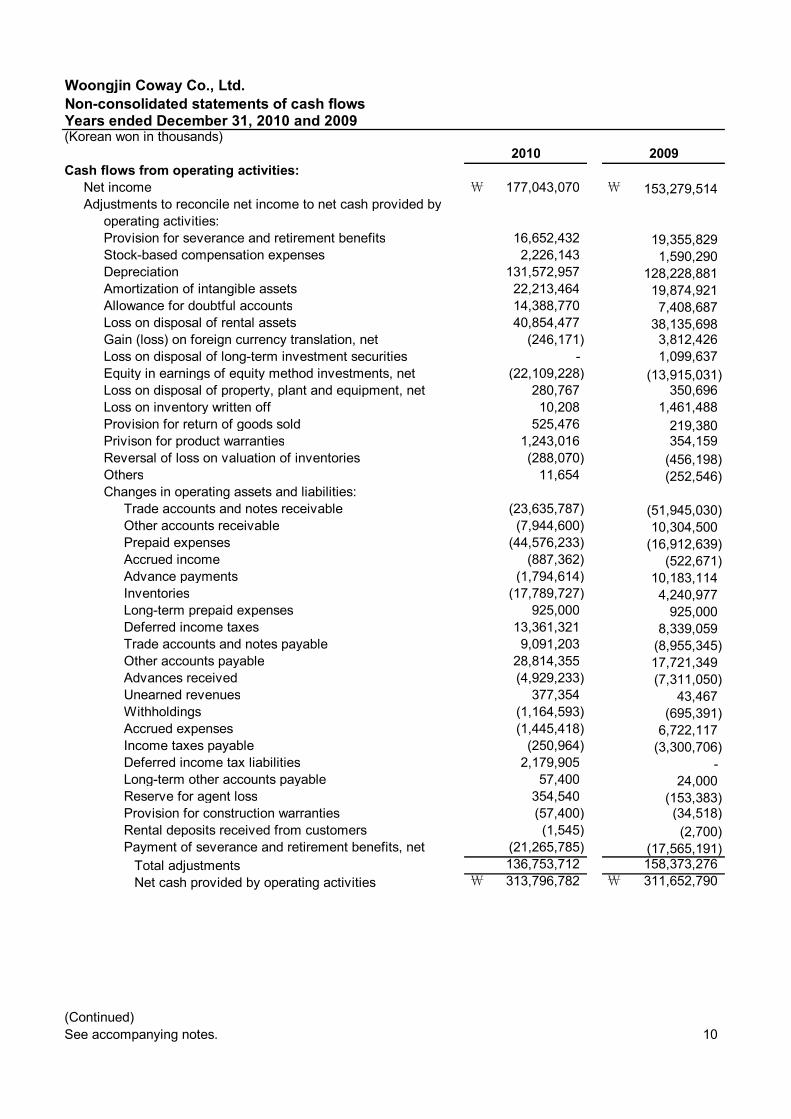
Cash flows from operating activities:Net income \ 177,043,070 \ 153,279,514Adjustments to reconcile net income to net cash provided by
operating activities:Provision for severance and retirement benefits 16,652,432 19,355,829Stock-based compensation expenses 2,226,143 1,590,290Depreciation 131,572,957 128,228,881Amortization of intangible assets 22,213,464 19,874,921Allowance for doubtful accounts 14,388,770 7,408,687Loss on disposal of rental assets 40,854,477 38,135,698Gain (loss) on foreign currency translation, net (246,171) 3,812,426Loss on disposal of long-term investment securities - 1,099,637Equity in earnings of equity method investments, net (22,109,228) (13,915,031)Loss on disposal of property, plant and equipment, net 280,767 350,696Loss on inventory written off 10,208 1,461,488Provision for return of goods sold 525,476 219,380Privison for product warranties 1,243,016 354,159Reversal of loss on valuation of inventories (288,070) (456,198)Others 11,654 (252,546)Changes in operating assets and liabilities:
Trade accounts and notes receivable (23,635,787) (51,945,030)Other accounts receivable (7,944,600) 10,304,500Prepaid expenses (44,576,233) (16,912,639)Accrued income (887,362) (522,671)Advance payments (1,794,614) 10,183,114Inventories (17,789,727) 4,240,977Long-term prepaid expenses 925,000 925,000Deferred income taxes 13,361,321 8,339,059Trade accounts and notes payable 9,091,203 (8,955,345)Other accounts payable 28,814,355 17,721,349Advances received (4,929,233) (7,311,050)Unearned revenues 377,354 43,467Withholdings (1,164,593) (695,391)Accrued expenses (1,445,418) 6,722,117Income taxes payable (250,964) (3,300,706)Deferred income tax liabilities 2,179,905 - Long-term other accounts payable 57,400 24,000Reserve for agent loss 354,540 (153,383)Provision for construction warranties (57,400) (34,518)Rental deposits received from customers (1,545) (2,700)Payment of severance and retirement benefits, net (21,265,785) (17,565,191)
Total adjustments 136,753,712 158,373,276Net cash provided by operating activities \ 313,796,782 \ 311,652,790
See accompanying notes. 10
Woongjin Coway Co., Ltd.Non-consolidated statements of cash flowsYears ended December 31, 2010 and 2009
2010 2009
(Continued)

(Korean won in thousands)
Cash flows from investing activities:Increase in short-term investment assets, net \ (3,322,315) \ (50,000)Proceeds from disposal of long-term investment securities - 3,807,002Acquisition of long-term investments securities (1,000,043) - Refund of long-term loans receivable 478,533 - Payment of long-term loans receivable (861,658) - Acquisition of equity method investments (63,749,006) (1,022,545)Proceeds from disposal of property, plant and equipment 11,217,131 13,804,417Acquisition of property, plant and equipment (223,120,234) (217,922,093)Proceeds from disposal of intangible assets 40,000 33,772Acquisition of intangible assets (9,808,056) (6,233,809)Refund of long-term guarantee deposits 21,572,883 18,082,427Payment of long-term guarantee deposits (19,988,214) (23,450,393)Increase of goodwill (4,960,000) - Others, net (2,930,000) (54,734)
Net cash used in investing activities (296,430,979) (213,005,956)
Cash flows from financing activities:Drawdown of short-term borrowings 807,312,654 745,684,306Repayment of short-term borrowings (852,554,691) (764,258,185)Issuance of private bonds 49,747,800 - Proceeds from current portion of bonds - 70,000,000Proceeds from long-term borrowings 100,000,000 - Redemption of current portion of bonds (50,000,000) - Repurchase of treasury stock - 7,452,400Acquisition of treasury stock - (46,400,006)Exercise of stock options 1,893,500 - Payment of dividends (76,825,444) (64,755,834)Others, net 10,000 (10,000)
Net cash used in financing activities (20,416,181) (52,287,319)
Increase of cash and cash equivalents due to merger and business combinations (4,321,742) (58,740,380)
Net decrease in cash and cash equivalents (7,372,120) (12,380,865)
Cash and cash equivalents at the beginning of the year 63,721,045 76,101,910
Cash and cash equivalents at the end of the year \ 56,348,925 \ 63,721,045
See accompanying notes. 11
2010 2009
Woongjin Coway Co., Ltd.Non-consolidated statements of cash flows (cont'd)Years ended December 31, 2010 and 2009

Woongjin Coway Co., Ltd. Notes to non-consolidated financial statements December 31, 2010 and 2009
12
1. Corporate information Woongjin Coway Co., Ltd. (the “Company”) was incorporated on May 2, 1989 under the laws of the Republic of Korea to engage in the manufacture and sales or rental of water purifiers and home appliances, construction of waste disposal facilities and other related business. The Company listed its common shares at the Korea Exchange (“KRX”) on August 7, 2001.
As the result of a merger and several increases in paid-in capital, the capital stock of the Company as of December 31, 2010 amounts to \40,662 million. In addition, the Company had previously retired 4,200,000 shares of treasury stock through the appropriation of retained earnings. As a result, the number of shares common stock outstanding amounting to 77,124,796 shares with a face value of \38,562 million differs from the face value and number of shares issued as recorded in the statement of financial position as of December 31, 2010.
As of December 31, 2010, the majority stockholder of the Company is Woongjin Holdings Co., Ltd., with a shareholding of 28.37%, and Woongjin Chemical Co., Ltd., Woong Jin Coway (Shenyang) Living Goods Co., Ltd., Woong jin Coway USA Inc., Woong Jin Coway (M) Sdn Bhd. and GETC Co., Ltd. are subsidiaries of the Company.
2. Summary of significant accounting policies Basis of financial statement preparation The Company maintains its official accounting records in Korean won and prepares statutory financial statements in the Korean language in conformity with accounting principles generally accepted in the Republic of Korea (“Korean GAAP”). Certain accounting principles applied by the Company that conform with financial accounting standards and accounting principles in the Republic of Korea may not conform with generally accepted accounting principles in other countries. Accordingly, these non-consolidated financial statements are intended for use by those who are informed about Korean accounting principles and practices. In the event of any differences in interpreting the non-consolidated financial statements or the independent auditors’ report thereon, the Korean version, which is used for regulatory reporting purposes, shall prevail. The accompanying non-consolidated financial statements have been condensed, restructured and translated into English (with certain expanded descriptions) from the Korean language financial statements.
The non-consolidated financial statements of the Company have been prepared in accordance with accounting principles generally accepted in the Republic of Korea, including Statements of Korea Accounting Standards (“SKAS”) 1 to 23, and the summary of significant account policies used for the preparation of the financial statements are as follows:
Revenue recognition Revenue from the sale of goods is recognized when significant risks and rewards of ownership of goods have passed to the buyer upon delivery of goods sold and rental revenue is recognized on an accrual basis over the rental period. Other revenue is recognized when the revenue has been earned, the amount of revenue can be reliably measured and it is probable that the economic benefits associated with the transaction will flow to the Company. Cash equivalents Highly liquid deposits and marketable securities with original maturities of three months or less, and which have no significant risk of loss in value by interest rate fluctuations, are considered as cash equivalents.

Woongjin Coway Co., Ltd. Notes to non-consolidated financial statements December 31, 2010 and 2009
13
2. Summary of significant accounting policies (cont’d) Financial instruments Financial instruments, such as time deposits and restricted bank deposits, which are traded by financial institutions and are held for short-term cash management purposes or which will mature within one year, are accounted for as short-term financial instruments. Financial instruments other than cash equivalents and short-term financial instruments are recorded as long-term financial instruments Allowance for doubtful accounts The Company provides an allowance for doubtful accounts in consideration of the estimated losses that may arise from non-collection of its receivables. The estimate of losses, if any, is based on a review of the aging and current status of the outstanding receivables. Inventories Inventories are stated at the lower of cost or net realizable value, with cost being determined using the moving-average method. Perpetual inventory system is used to record inventories, in which inventories are adjusted to physical inventory counts that are performed at the end of the year. When a decline in the value of an inventory indicates that its cost exceeds net realizable value, a valuation loss will be recognized to write the inventory down to its net realizable value. The loss on valuation is recognized in cost of sales which amounted to nil, as of December 31, 2010 and 2009. In the event of an increase in the net realizable value of previous written down inventory, the amount of the write-down is reversed to the extent of the original write-down amount so that the new carrying amount is the lower of cost and the revised net realizable value. The Company has made reversal of write-down which amounted to \288,070 thousand and \456,198 thousand for the years ended December 31, 2010 and 2009. Investments in securities Investments in securities within the scope of SKAS 8 Investments in Securities are classified as either trading, held-to-maturity or available-for-sale securities, as appropriate, and are initially measured at cost, including incidental expenses, with cost being determined using the moving average method. The Company determines the classification of its investments after initial recognition, and, where allowed and appropriate, re-evaluates this designation at each financial year end. Securities that are acquired and held principally for the purpose of selling them in the near term are classified as trading securities. Debt securities which carry fixed or determinable payments and fixed maturity are classified as held-to-maturity if the Company has the positive intention and ability to hold to maturity. Securities that are not classified as either trading or held-to-maturity are classified as available-for-sale securities. After initial measurement, available-for-sale securities are measured at fair value with unrealized gains or losses being recognized directly in equity as other comprehensive income. Likewise, trading securities are also measured at fair value after initial measurement, but with unrealized gains or losses reported as part of net income. Held-to-maturity securities are measured at amortized cost after initial measurement. The cost is computed as the amount initially recognized minus principal repayments, plus or minus the cumulative amortization using the effective interest method of any difference between the initially recognized amount and the maturity amount.

Woongjin Coway Co., Ltd. Notes to non-consolidated financial statements December 31, 2010 and 2009
14
2. Summary of significant accounting policies (cont’d) Investments in securities (cont’d) The fair value of trading and available-for-sale securities that are traded actively in the open market (marketable securities) is measured at the closing price of those securities at the reporting date. Non-marketable equity securities are measured at cost subsequent to initial measurement if their fair values cannot be reliably estimated. Non-marketable debt securities are carried at a value using the present value of future cash flows discounted using an appropriate interest rate which reflects the issuer’s credit rating announced by a public independent credit rating agency.
If the application of such measurement method is not feasible, estimates of fair values may be made using a reasonable valuation model or quoted market prices of similar debt securities issued by entities conducting business in similar industries. Trading securities are classified as current assets. Available-for-sale and held-to-maturity securities are classified as long-term investments, except that securities maturing within one year or that are certain to be disposed of within one year from the reporting date are classified as short-term investments. The Company recognizes an impairment loss on its investments in securities if there is objective evidence that the securities are impaired. The impairment loss is charged to statement of income.
Equity method investments Investments in entities over which the Company has control or significant influence are accounted for using the equity method. Under the equity method of accounting, the Company’s initial investment in an investee is recorded at acquisition cost. Subsequently, the carrying amount of the investment is adjusted to reflect the Company’s share of income or loss of the investee in the statement of income and share of changes in equity that have been recognized directly in the equity of the investee in the related equity account of the Company on the non-consolidated statement of financial position. If the Company’s share of losses of the investee equals or exceeds its interest in the investee, it suspends recognizing its share of further losses. However, if the Company has other long-term interests in the investee, it continues recognizing its share of further losses to the extent of the carrying amount of such long-term interests. Negative goodwill represents the excess of the Company’s share in the net fair value of the investee’s identifiable assets and liabilities over the cost of the investment. Negative goodwill is recorded to the extent of the fair value of acquired non-monetary assets and recognized as income using the straight-line method over the remaining weighted-average useful life of those acquired non-monetary assets. The amount of negative goodwill in excess of the fair value of acquired non-monetary assets is recognized as income immediately. The Company’s share in the investee’s unrealized profits and losses resulting from transactions between the Company and its investee are eliminated.
In translating the financial statements of foreign investees into Korean won, assets and liabilities are translated at the exchange rate on the reporting date and income and expenses are translated at the average exchange rate for the period. All resulting exchange differences are recognized as foreign currency translation adjustments in other comprehensive income within equity.
Property, plant and equipment Property, plant and equipment are stated at cost less accumulated depreciation. Maintenance and repairs are expensed in the year in which they are incurred. Expenditures which enhance the value or extend the useful life of the related assets are capitalized.

Woongjin Coway Co., Ltd. Notes to non-consolidated financial statements December 31, 2010 and 2009
15
2. Summary of significant accounting policies (cont’d) Property, plant and equipment (cont’d) Depreciation of property, plant and equipment is provided using the straight-line method over the estimated useful life of the assets as follows: Years
Buildings 25 – 40 Structures 7 – 25 Machinery and equipment 2 – 12 Vehicles 5 – 10 Tools 2 – 6 Furniture and fixtures 2 – 20 Research facility 3 Rental assets 3 – 5 Intangible assets Intangible assets of the Company consist of goodwill, industrial property rights and other intangible assets, which are stated at cost less accumulated amortization. Amortization is recognized as an expense based on the straight-line method over the estimated useful life of 5 to 10 years for goodwill and industrial property rights and 5 years for all other intangible assets. Borrowing costs Borrowing costs directly attributable to the acquisition, construction or production of qualifying assets are expensed in the period in which they are incurred. Impairment of assets When the recoverable amount of an asset is less than its carrying amount due to obsolescence, physical damage or abrupt decline in the market value of the asset, the decline in value, if material, is deducted from the carrying amount and recognized as an asset impairment loss in the current year. A previously recognized impairment loss for an impaired asset is reversed if the recoverable amount during the reporting period exceeds its carrying amount. The reversal is limited so that the carrying amount of the asset does not exceed its recoverable amount, nor exceed the carrying amount that would have been determined, net of depreciation, had no impairment loss been recognized for the asset in prior years. The Company recorded no impairment loss or reversal of impairment loss for the years ended December 31, 2010 and 2009. Government subsidy Government subsidy, which is used for the acquisition of certain assets, is accounted for as a deduction from the acquisition cost of the acquired assets. Such subsidy amount is offset against the depreciation or amortization of the acquired assets during such assets’ useful life. Government subsidy, which is required to be repaid, is recorded as a liability in the statements of financial position. Government subsidy with no repayment obligation, which is used to purchase a designated asset or to develop a certain technology, is presented as a deduction of the related asset and is amortized against the depreciation or amortization expense of the related asset. Government subsidy, contributed to compensate for specific expenses, is offset against the related expenses as incurred. Discount (premium) on bonds Discount (premium) on bonds is presented as a direct deduction from (addition to) the nominal value of the bonds and is amortized using the effective-interest-rate method over the life of the bonds.

Woongjin Coway Co., Ltd. Notes to non-consolidated financial statements December 31, 2010 and 2009
16
2. Summary of significant accounting policies (cont’d) Severance and retirement benefits In accordance with the Employee Retirement Benefit Security Act (“ERBSA”) and the Company’s employee benefits policy, employees terminating their employment with at least one year of service are entitled to severance and retirement benefits, based on the rates of pay in effect at the time of termination, years of service and certain other factors. The provision is determined based on the amount that would be payable assuming all employees were to terminate their employment as of the reporting date.
The Company’s severance and retirement benefits are partly funded through an insurance plan with Samsung Fire & Marine Insurance Co., Ltd. Up to March 1999, the Company had previously prepaid a portion of its severance and retirement benefits obligation to the National Pension Service (“NPS”). The insurance deposits and prepayments are presented as a deduction from the provision for severance and retirement benefits. Provisions and contingent liabilities Provisions are recognized when the Company has a present obligation (legal or constructive) as a result of a past event, it is probable that an outflow of resources embodying economic benefits will be required to settle the obligation and a reliable estimate can be made of the amount of the obligation. The provision is used only for expenditures for which the provision was originally recognized. If the effect of the time value of money is material, provisions are stated at present value. A contingent liability is disclosed, but not recognized when it is not probable that an outflow of resources embodying economic benefits will be required to settle the obligation or the amount of the obligation cannot be measured with sufficient reliability.
Income taxes Current income tax assets and liabilities for the current and prior periods are measured at the amount expected to be recovered from or paid to the tax authorities. Deferred income taxes are provided using the liability method for the tax effect of temporary differences between the tax bases of assets and liabilities and their reported amounts in the financial statements. Deferred income tax assets and liabilities are measured using the enacted tax rates and laws that will be in effect when the differences are expected to reverse, and are classified as current or non-current, respectively, based on the classification of the related asset or liability in the statements of financial position. In addition, current tax and deferred tax are charged or credited directly to equity if the tax relates to items that are credited or charged directly to equity. Foreign currency translation Transactions involving foreign currencies are recorded at the exchange rates prevailing at the time the transactions are made. The year-end exchange rate used were \1,138.90: US$1 and \1,167.60: US$1, \1,513.60: EUR1 and \1,674.28: EUR1, \13.9708: JPY1 and \12.6282: JPY1 and \37.78: THB1 and \35.02: THB1, as of December 31, 2010 and 2009, respectively, for statements of financial position items. Monetary assets and liabilities denominated in foreign currencies are translated into Korean won at the appropriate exchange rates on the reporting date. The resulting unrealized foreign currency translation gains or losses are credited or charged to current operations.

Woongjin Coway Co., Ltd. Notes to non-consolidated financial statements December 31, 2010 and 2009
17
2. Summary of significant accounting policies (cont’d) Share-based payment transactions For equity-settled share-based payment transactions, the Company measures the goods or services received, and the corresponding increase in equity at the fair value of the goods or services received or the equity instruments granted over the vesting period. For cash-settled share- based payment transactions, the Company measures the goods or services acquired and the liability incurred at the fair value of the liability, and re-measures the fair value of the liability at each reporting date, with any changes in value recognized in profit or loss for the period. For share-based payment transactions in which the terms of the arrangement provide the supplier of goods or services with a choice of whether the Company settles the transaction in cash or by issuing equity instruments, the Company accounts for that transaction, or the components of that transaction, as a cash-settled share-based payment transaction if, and to the extent that, the Company has incurred a liability to settle in cash (or other assets), or as an equity-settled share-based payment transaction if, and to the extent that, no such liability has been incurred. Share-based payment transactions implemented before the effective date of SKAS 22 are accounted in accordance with Korea Financial Accounting Standards Interpretation 39-35 Accounting for Stock Options.
Provision for construction warranties The Company records a provision for the estimated warranty costs relating to construction defects during the warranty period. Estimated warranty costs are charged to current operations at the time of sale and are included in the statement of financial position as provision for construction warranty. The provision for construction warranty made will be offset against the actual amount of rectification expense incurred on the defects in subsequent period. The actual rectification expense incurred in excess of the provision made is accounted for as an expense in the current period Per share amounts Basic earnings per share are computed by dividing net income by the weighted-average number of common shares outstanding during the year. Diluted earnings per share are calculated by dividing net income by the weighted-average number of common shares outstanding during the year plus the weighted-average number of common shares that would have been outstanding assuming the conversion of all dilutive potential common shares.
3. The effect of adoption Korea International Financial Reporting Standards (“K-IFRS”)
The Company will adopt K-IFRS from the fiscal year of 2011. The date of transition to K-IFRS is January 1, 2010. The Company’s approach to adopt K-IFRS is illustrated as follows:
Preparation and implementation of K-IFRS adoption The Company formed a task force to prepare for its transition from the generally accepted accounting principle in Republic of Korean (“K-GAAP”) to K-IFRS. The three phases of the transition which the K-IFRS task force performed are as follows: (1) Analysis and planning phase: This phase included a preliminary analysis and impact
assessments over the Company’s current accounting policies, financial reporting processes, including the determination of the reporting entity, and the system to identify key areas that would be impacted by the transition to K-IFRS.
(2) Design phase: This phase included further detailed analysis and employee training on the
impact assessments over the Company’s current accounting policies, financial information generating process and information systems.
(3) Implementation Phase: This phase included applying and embedding the changes identified
above in the Company’s operational processes and system. The Company anticipates the completion of this phase enables the Company to provide financial information in accordance with K-IFRS.

Woongjin Coway Co., Ltd. Notes to non-consolidated financial statements December 31, 2010 and 2009
18
3. The effect of adoption Korea International Financial Reporting Standards (“K-IFRS”) (cont’d)
Significant differences in accounting policies The difference between K-GAAP and K-IFRS that are expected to give use to a significant impact on the Company’s consolidated financial statements as of December 31, 2010 are summarized as follows:
Subject K-GAAP K-IFRS First-time adoption of
K-IFRS
Business combination Not applicable
Does not restate retrospectively past business combinations that occurred prior to January 1, 2010 (the transition date).
Investments in subsidiaries or affiliates.
Not applicable
Uses its previous K-GGAP carrying amount as deemed cost for the investments in subsidiaries and affiliates as of January 1, 2010 (the transition date).
Borrowing costs
Not applicable
Capitalize of borrowing costs related to qualified assets which are acquired after the transition date.
Investments in subsidiaries and affiliates on non-consolidated financial statements
Investments in subsidiaries and affiliates are accounted for using the equity method on non-consolidated financial statements. .
On separate financial statements, investments in subsidiaries and affiliates are accounted for using the cost method.
Severance and retirement benefits
Estimated based on the amount that would be payable assuming all employees were to terminate their employment at the reporting date.
Based on projected unit credit method, the obligation for severance and retirement benefit is calculated based on actuarial present value on a discounted basis. In addition, for the reward for long-service, other long-term estimated liabilities are measured using actuarial method.
Accumulated paid-time-off
Recognize as expenses when the Company’s obligation to pay is determined.
Records liabilities as payables and recognizes expenses when employees render services.
Investment properties
Real estate for rental income or trading gain is classified as plant, property and equipment.
Real estate for rental income or trading gain is classified as investment properties.
Goodwill
Goodwill is amortized for reasonable periods within 20 years.
Goodwill is not subject to amortization and impairment test is performed at least once every financial year.
Membership (facility usage rights)
Membership and guarantee deposits are recognized as other long-term assets.
Membership is classified as an intangible asset with indefinite useful life, and membership with characteristics of equity is classified as available-for-sale financial assets.
financial guarantee contracts
Financial guarantee contracts to subsidiaries and related parties are not recognized, but are disclosed in the financial statements.
Measurement of the value of guarantees provided is required for financial guarantee contracts.
Deferred income
taxes
Does not separate temporary differences arising from investments in subsidiaries and affiliates by each source.
Presented deferred tax assets and liabilities based on the classification of related assets and liabilities.
Does not recognize deferred income tax liabilities from revaluation gains under the Assets Revaluations Law.
Does separate temporary differences arising from investments in subsidiaries and affiliates by each source.
Present deferred tax assets and liabilities as non-current assets and liabilities.
Does recognize deferred income tax liabilities from revaluation gains under the Assets Revaluations Law.

Woongjin Coway Co., Ltd. Notes to non-consolidated financial statements December 31, 2010 and 2009
19
3. The effect of adoption Korea International Financial Reporting Standards (“K-IFRS”) (cont’d)
Changes in-scope entities for consolidation The Company is required to prepare consolidated financial statements under K-GAAP and K-IFRS, and changes in-scope entities are as follow:
K-GAAP K-IFRS Difference Woong Jin Coway (Shenyang) Living Goods Co., Ltd.
Woong Jin Coway (Shenyang) Living Goods Co., Ltd.
-
Woong Jin Coway USA Inc. Woong Jin Coway USA Inc. - Woong Jin Coway (M) S dn
Bhd. Woong Jin Coway (M) S dn Bhd. -
Woongjin Chemical Co., Ltd. -
Under Korean GAAP, based on the Act on External Audit of Stock Companies, it was considered that the Company has control over the entity hence the Company holds in excess of 30% of equity interest as a major shareholders. Under K-IFRS, it is considered that the Company has no control over the entity.
GTEC Co., Ltd. GTEC Co., Ltd. - -
Woong Jin Coway (Thailand) Co.,Ltd.
Under Korean GAAP, based on the Act on External Audit of Stock Companies, a stock company whose total value of asset is less than \10 billion shall not be considered as a subsidiary. Under K-IFRS, if the parent company has control over company, the company is deemed to be a subsidiary regardless of its size.

Woongjin Coway Co., Ltd. Notes to non-consolidated financial statements December 31, 2010 and 2009
20
4. Restricted deposits
Restricted deposits as of December 31, 2010 and 2009 consist of the following (Korean won in thousands):
Financialinstitution Description
Long-term financial instruments Shinhan Bank \ 10,500 \ 10,500
Security deposit for bank overdraft facility
2010 2009
5. Short-term investment assets
The balances of short-term investment assets of the Company as of December 31, 2010 and 2009 are presented as follows (Korean won in thousands):
Short-term loans receivable \ 2,905,721 \ 2,905,721 \ 2,905,721 \ 5,494,230
Short-term financial instruments 960,000 960,000 960,000 -
\ 3,865,721 \ 3,865,721 \ 3,865,721 \ 5,494,230
2009
Book valueFair value Book valueAcquisition2010
6. Long-term investment assets The balances of long-term investment assets of the Company as of December 31, 2010 and 2009
are presented as follows (Korean won in thousands):
Available-for-sale securities (Equity securities)Marketable \ 9,260 \ 11,124Non-marketable 2,670,766 1,670,773
2,680,026 1,681,897Held-to-maturity securities (Debt securities) 421,891 421,841
\ 3,101,917 \ 2,103,738
2010 2009

Woongjin Coway Co., Ltd. Notes to non-consolidated financial statements December 31, 2010 and 2009
21
6. Long-term investment assets (cont’d) Available-for-sale equity securities as of December 31, 2010 and 2009 consist of the following (Korean won in thousands):
Numberof
sharesOwnership
(%)
< Marketable securities >Tong Yang Investment Bank Co., Ltd. 927 0.0008% \ 1 \ 9,260 \ 9,260 \ 9,259 \ - \ -
1 9,260 9,260 9,259 - - < Non-marketable securities >McScience Inc. 6,000 5.90% 1,133,760 (*1) 1,133,760 - - - Nextelecom Co., Ltd. 11,000 1.20% 98,516 〃 98,516 - - - Kirin Music Publishing Co., Ltd. 51,868 12.06% 96,500 〃 96,500 - - - Korea Water Purifier Industry Cooperative 53 3.33% 5,300 〃 5,300 - - - Academy Infra Corp. 15,773 7.84% 165,100 〃 1 - 165,099 - Kwang Myung SG Co., Ltd. 4,000 4.00% 1,434,640 〃 1 - 1,434,639 - OpenSolution Co., Ltd. 250 0.05% 22,093 〃 1 - 22,092 - Korea Culture promotion Inc. 5,000 1.25% 25,000 〃 1 - 24,999 - Kizmam Co., Ltd.(*3) 15,885 34.00% 999,993 〃 999,993 - - - Construction Guarantee 336,693 〃 336,693 - - -
4,317,595 - 2,670,766 - 1,646,829 -\ 4,317,596 \ 9,260 \ 2,680,026 \ 9,259 \ 1,646,829 \ -
2010Acquisition
cost Fair valueBookvalue
Unrealizedholding gain
(*2)Up to2009
2010 Impairment loss
Numberof
sharesOwnership
(%)
< Marketable securities >Tong Yang Investment Bank Co., Ltd. 927 0.0008% \ 1 \ 11,124 \ 11,124 \ 11,123 \ - \ -
1 11,124 11,124 11,123 - - < Non-marketable securities >McScience Inc. 6,000 5.90% 1,133,760 (*1) 1,133,760 - - - Nextelecom Co., Ltd. 11,000 1.20% 98,516 〃 98,516 - - - Kirin Music Publishing Co., Ltd. 51,868 12.06% 96,500 〃 96,500 - - - Korea Water Purifier Industry Cooperative 53 3.33% 5,300 〃 5,300 - - - Academy Infra Corp. 15,773 7.84% 165,100 〃 1 - 165,099 - Kwang Myung SG Co., Ltd. 4,000 4.00% 1,434,640 〃 1 - 1,434,639 - OpenSolution Co., Ltd. 250 0.05% 22,093 〃 1 - 22,092 - Korea Culture promotion Inc. 5,000 1.25% 25,000 〃 1 - 24,999 - Construction Guarantee 336,693 〃 336,693 - - -
3,317,602 - 1,670,773 - 1,646,829 - \ 3,317,603 \ 11,124 \ 1,681,897 \ 11,123 \ 1,646,829 \ -
2009 Impairment loss
Acquisitioncost Fair value
Bookvalue
Unrealizedholding gain
(*2)Up to2008 2009
(*1) In assessing the fair value of these non-marketable equity investments, the Company could
not obtain sufficient information to perform a reliable estimation of the fair value of the investments. Therefore, investment in these equity securities were recorded at acquisition cost except when there was objective evidence that the equity securities were impaired in which case impairment losses were recognized.
(*2) Gain or loss on valuation of long-term investment securities amounting to \7,223 thousand (2009: \8,676 thousand) recognized in other comprehensive income as of December 31, 2010 represents the difference between acquisition cost and fair value of the investments of \9,259 thousand (2009: \11,123 thousand), net of the related tax effects.
(*3) Investments in this investee were not accounted for using the equity method of accounting as the investee’s total assets were less than \10,000 million threshold as of December 31, 2009 and the changes in carrying amount of investments was immaterial.
Woongjin Coway Co., Ltd. Notes to non-consolidated financial statements December 31, 2010 and 2009
22
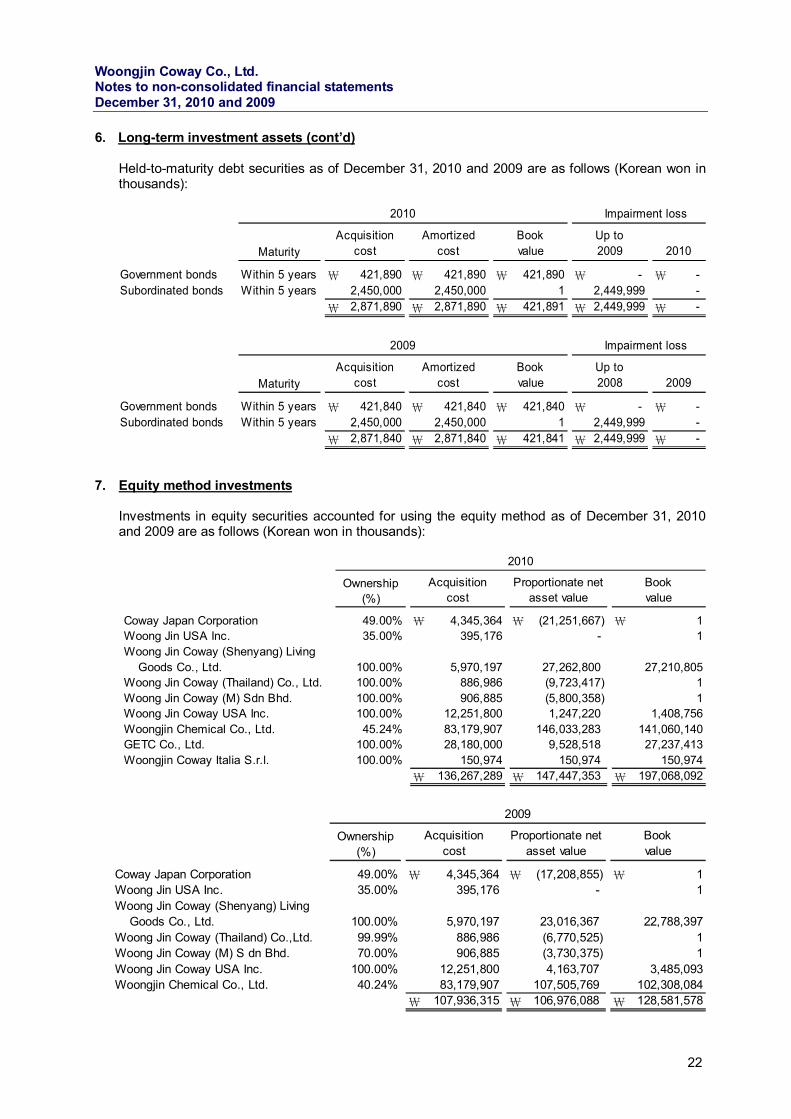
6. Long-term investment assets (cont’d) Held-to-maturity debt securities as of December 31, 2010 and 2009 are as follows (Korean won in thousands):
Maturity
Government bonds Within 5 years \ 421,890 \ 421,890 \ 421,890 \ - \ - Subordinated bonds Within 5 years 2,450,000 2,450,000 1 2,449,999 -
\ 2,871,890 \ 2,871,890 \ 421,891 \ 2,449,999 \ -
Acquisitioncost
Impairment loss2010
Up to2009 2010
Bookvalue
Amortizedcost
Maturity
Government bonds Within 5 years \ 421,840 \ 421,840 \ 421,840 \ - \ - Subordinated bonds Within 5 years 2,450,000 2,450,000 1 2,449,999 -
\ 2,871,840 \ 2,871,840 \ 421,841 \ 2,449,999 \ -
Impairment loss2009
Acquisitioncost
Amortizedcost
Bookvalue
Up to2008 2009
7. Equity method investments
Investments in equity securities accounted for using the equity method as of December 31, 2010 and 2009 are as follows (Korean won in thousands):
Ownership(%)
Coway Japan Corporation 49.00% \ 4,345,364 \ (21,251,667) \ 1Woong Jin USA Inc. 35.00% 395,176 - 1Woong Jin Coway (Shenyang) Living Goods Co., Ltd. 100.00% 5,970,197 27,262,800 27,210,805Woong Jin Coway (Thailand) Co., Ltd. 100.00% 886,986 (9,723,417) 1Woong Jin Coway (M) Sdn Bhd. 100.00% 906,885 (5,800,358) 1Woong Jin Coway USA Inc. 100.00% 12,251,800 1,247,220 1,408,756Woongjin Chemical Co., Ltd. 45.24% 83,179,907 146,033,283 141,060,140GETC Co., Ltd. 100.00% 28,180,000 9,528,518 27,237,413Woongjin Coway Italia S.r.l. 100.00% 150,974 150,974 150,974
\ 136,267,289 \ 147,447,353 \ 197,068,092
2010
Bookvalue
Proportionate netasset value
Acquisitioncost
Ownership(%)
Coway Japan Corporation 49.00% \ 4,345,364 \ (17,208,855) \ 1Woong Jin USA Inc. 35.00% 395,176 - 1Woong Jin Coway (Shenyang) Living Goods Co., Ltd. 100.00% 5,970,197 23,016,367 22,788,397Woong Jin Coway (Thailand) Co.,Ltd. 99.99% 886,986 (6,770,525) 1Woong Jin Coway (M) S dn Bhd. 70.00% 906,885 (3,730,375) 1Woong Jin Coway USA Inc. 100.00% 12,251,800 4,163,707 3,485,093Woongjin Chemical Co., Ltd. 40.24% 83,179,907 107,505,769 102,308,084
\ 107,936,315 \ 106,976,088 \ 128,581,578
2009
Acquisitioncost
Proportionate netasset value
Bookvalue

Woongjin Coway Co., Ltd. Notes to non-consolidated financial statements December 31, 2010 and 2009
23
7. Equity method investments (cont’d)
The summary of financial position of the investees as of December 31, 2010 and 2009, and the results of their financial performance for the years then ended, are presented as follows (Korean won in thousands):
Coway Japan Corporation (*) \ 7,243,879 \ 50,614,629 \ 8,724,800 \ (4,750,917)Woong Jin Coway (Shenyang) Living Goods Co., Ltd. (*) 38,088,063 10,825,263 46,377,411 3,995,583Woong Jin Coway (Thailand) Co., Ltd. (*) 6,449,673 16,173,090 7,014,006 (2,209,360)Woong Jin Coway (M) Sdn. Bhd. (*) 30,847,676 36,648,034 20,796,108 (2,447,913)Woong Jin Coway USA, Inc. (*) 11,771,363 10,524,143 10,140,153 (2,671,896)Woongjin Chemical Co., Ltd. 681,869,094 359,068,817 911,193,874 60,192,889GETC Co., Ltd. 22,608,281 13,079,763 25,445,142 1,025,068Woongjin Coway Italia S.r.l. 150,974 - - -
\ 799,029,003 \ 496,933,739 \ 1,029,691,494 \ 53,133,454
2010
Totalassets
Totalliabilities Sales
Net income(loss)
Coway Japan Corporation (*) \ 9,750,569 \ 44,870,680 \ 9,756,992 \ (3,578,993)Woong Jin Coway (Shenyang) Living Goods Co., Ltd. (*) 33,691,303 10,674,936 41,569,496 13,376,306Woong Jin Coway (Thailand) Co., Ltd. (*) 2,909,194 9,679,719 4,525,193 (1,340,842)Woong Jin Coway (M) Sdn. Bhd. (*) 15,298,241 20,627,348 10,809,026 (558,359)Woong Jin Coway USA, Inc. (*) 11,329,838 7,166,131 9,594,031 (2,475,647)Woongjin Chemical Co., Ltd. 620,741,739 353,577,178 803,174,786 10,182,466
\ 693,720,884 \ 446,595,992 \ 879,429,524 \ 15,604,931
Net income(loss)Sales
Totalliabilities
Totalassets
2009
(*) Audited financial statements of these investees were not available as of the Company’s audit opinion date and therefore unaudited financial statements signed by the investees’ management were used in applying the equity method.
Due to the differences indentified between the accounting policies adopted by Woong Jin Coway (Shenyang) Living Goods Co., Ltd. and those of the Company, the Company made adjustments to the investee’s financial statements. The details of the adjustments are as follows (Korean won in thousands):
Reportingdate
Woong Jin Coway (Shenyang) Living Goods Co., Ltd. Dec. 31, 2010 \ 28,334,376 \ (1,071,576) \ 27,262,800 \ 27,262,800
Reportingdate
Woong Jin Coway (Shenyang) Living Goods Co., Ltd. Dec. 31, 2009 \ 24,450,847 \ (1,434,480) \ 23,016,367 \ 23,016,367
2010
Net assetsbefore
adjustments Adjustments
Net assetsafter
adjustments
Proportionatenet assets
value
Net assetsbefore
adjustments Adjustments
Net assetsafter
adjustments
Proportionatenet assets
value
2009

Woongjin Coway Co., Ltd. Notes to non-consolidated financial statements December 31, 2010 and 2009
24
7. Equity method investments (cont’d) The changes in carrying amount of goodwill for the years ended December 31, 2010 and 2009 are as follows (Korean won in thousands):
Woongjin Chemical Co., Ltd. \ (5,139,532) \ - \ 213,608 \ (4,925,924)GETC Co., Ltd. - 19,676,550 (1,967,655) 17,708,895
\ (5,139,532) \ 19,676,550 \ (1,754,047) \ 12,782,971
Woongjin Chemical Co., Ltd. \ (5,353,140) \ - \ 213,608 \ (5,139,532)
Dec.31, 2009AdditionsJan.1, 2009 Amortization
2009
2010
AdditionsJan.1, 2010 Amortization Dec.31, 2010
The elimination of unrealized (gains) or losses arising from inter-company transactions for the years ended December 31, 2010 and 2009 are as follows (Korean won in thousands):
Inventories Provisions Total
Coway Japan Corporation \ (257,861) \ 1,269,834 \ 1,011,973Woong Jin Coway (Shenyang) Living Goods Co., Ltd. (844,601) 792,607 (51,994)Woong Jin Coway (Thailand) Co., Ltd. (1,003,155) - (1,003,155)Woong Jin Coway (M) Sdn Bhd. (1,297,835) - (1,297,835)Woong Jin Coway USA, Inc. (648,152) 809,688 161,536Woongjin Chemical Co., Ltd. (47,217) - (47,217)
\ (4,098,821) \ 2,872,129 \ (1,226,692)
2010
Inventories Provisions Total
Coway Japan Corporation \ (223,657) \ 1,269,834 \ 1,046,177Woong Jin Coway (Shenyang) Living Goods Co., Ltd. (1,157,926) 929,956 (227,970)Woong Jin Coway (Thailand) Co., Ltd. (333,783) - (333,783)Woong Jin Coway (M) Sdn Bhd. (1,052,458) - (1,052,458)Woong Jin Coway USA, Inc. (903,186) 224,572 (678,614)Woongjin Chemical Co., Ltd. (58,152) - (58,152)
\ (3,729,162) \ 2,424,362 \ (1,304,800)
2009

Woongjin Coway Co., Ltd. Notes to non-consolidated financial statements December 31, 2010 and 2009
25
7. Equity method investments (cont’d) The details of changes in carrying amount of equity method investments for the years ended December 31, 2010 and 2009 are as follows (Korean won in thousands):
Coway Japan Corporation (*2) \ 1 \ - \ - \ - \ 1Woong Jin USA, Inc. 1 - - - 1Woong Jin Coway (Shenyang) Living Goods Co., Ltd. 22,788,397 - 4,475,550 (53,142) 27,210,805Woong Jin Coway (Thailand) Co., Ltd. 1 87,485 - (87,485) 1Woong Jin Coway (M) Sdn Bhd. (*3) 1 4,329,984 (3,381,215) (948,769) 1Woong Jin Coway USA, Inc. 3,485,093 - (1,646,604) (429,733) 1,408,756Woongjin Chemical Co., Ltd. 102,308,084 31,000,562 25,882,731 (18,131,237) 141,060,140GETC Co., Ltd. - 28,180,000 (942,587) - 27,237,413Woongjin Coway Italia S.r.l. - 150,974 - - 150,974
\ 128,581,578 \ 63,749,005 \ 24,387,875 \ (19,650,366) \ 197,068,092
2010
Jan. 1, 2010Acquisition(disposals) Others (*1) Dec. 31, 2010
Equity inearnings (loss)
of investee
(*1) Refer to net changes in equity method investments due to the dividends received from the
investees and share of changes in capital surplus, capital adjustments, other comprehensive income or retained earnings of the investees in equity method during the year ended December 31, 2010.
(*2) Since the suspension of application of equity method, the Company has recognized further
share of losses in Coway Japan Corporation amounting to \2,375,036 thousand out of total share of losses amounting to \20,239,696 thousand as an allowance for doubtful accounts against long-term loans receivable as of December 31, 2010.
(*3) Since the suspension of application of equity method, the Company has recognized further
share of losses in Woong Jin Coway (M) Sdn Bhd. amounting to \6,797,555 thousand (including equity in loss of equity method investments of \96,389 thousand and changes in capital adjustments in equity method of \2,493,996 thousand) out of total share of losses amounting to \7,098,194 thousand as an allowance for doubtful accounts against long-term loans receivable as of December 31, 2010.
Coway Japan Corporation \ 1 \ - \ - \ - \ 1Woong Jin USA, Inc. 1 - - - 1Woong Jin Coway (Shenyang) Living Goods Co., Ltd. 10,385,818 - 14,054,384 (1,651,805) 22,788,397Woong Jin Coway (Thailand) Co., Ltd. 1 - - - 1Woong Jin Coway (M) Sdn Bhd. 1 - (226,960) 226,960 1Woong Jin Coway USA, Inc. 1,432,396 5,775,150 (3,317,201) (405,252) 3,485,093Woongjin Chemical Co., Ltd. 97,947,334 1,022,545 4,312,942 (974,736) 102,308,085
\ 109,765,552 \ 6,797,695 \ 14,823,165 \ (2,804,833) \ 128,581,579
2009Equity in
earnings (loss)of investee
Acquisition(disposals) Others Dec. 31, 2009 Jan. 1, 2009

Woongjin Coway Co., Ltd. Notes to non-consolidated financial statements December 31, 2010 and 2009
26
7. Equity method investments (cont’d) The details of changes in equity adjustments in equity method for the years ended December 31, 2010 and 2009 are as follows (Korean won in thousands):
Coway Japan Corporation \ 86,573 \ - \ 86,573Woong Jin Coway (Shenyang) Living Goods Co., Ltd. (*1) 1,355,282 (41,451) 1,313,831Woong Jin Coway (Thailand) Co., Ltd. 17,286 - 17,286Woong Jin Coway (M) Sdn Bhd. (350,026) (421,374) (771,400)Woong Jin Coway USA, Inc. 541,271 (429,733) 111,538Woongjin Chemical Co., Ltd. (*1) (1,643,900) (1,828,689) (3,472,589)
\ 6,486 \ (2,721,247) \ (2,714,761)
2010
Jan. 1, 2010 Net changes Dec. 31, 2010
Coway Japan Corporation \ 86,573 \ - \ 86,573Woong Jin Coway (Shenyang) Living Goods Co., Ltd. (*1) 3,096,977 (1,741,695) 1,355,282Woong Jin Coway (Thailand) Co., Ltd. 17,286 - 17,286Woong Jin Coway (M) Sdn Bhd. (*2) (576,986) 226,960 (350,026)Woong Jin Coway USA, Inc. 946,524 (405,253) 541,271Woongjin Chemical Co., Ltd. (*1) (1,132,308) (511,592) (1,643,900)
\ 2,438,066 \ (2,431,580) \ 6,486
Dec. 31, 2009Jan. 1, 2009 Net changes
2009
(*1) Deferred income tax effect was reflected in the current year adjustments for Woong Jin Coway
(Shenyang) Living Goods Co., Ltd. and Woongjin Chemical Co., Ltd.
The details of changes in capital surplus in equity method for the years ended December 31, 2010 and 2009 are as follows (Korean won in thousands):
Woong Jin Coway (Shenyang) Living Goods Co., Ltd. \ (21,173) \ - \ (21,173)Woongjin Chemical Co., Ltd. 11,692,645 - 11,692,645
\ 11,671,472 \ - \ 11,671,472
2010
Jan. 1, 2010 Net changes Dec. 31, 2010
Woong Jin Coway (Shenyang) Living Goods Co., Ltd. \ (27,145) \ 5,972 \ (21,173)Woongjin Chemical Co., Ltd. 11,692,645 - 11,692,645
\ 11,665,500 \ 5,972 \ 11,671,472
Jan. 1, 2009 Net changes Dec. 31, 2009
2009

Woongjin Coway Co., Ltd. Notes to non-consolidated financial statements December 31, 2010 and 2009
27
7. Equity method investments (cont’d)
The details of changes in capital adjustments in equity method for the years ended December 31, 2010 and 2009 are as follows (Korean won in thousands):
Woong Jin Coway (Thailand) Co., Ltd. (*1) \ - \ (87,485) \ (87,485)Woong Jin Coway (M) Sdn Bhd. (*2) - (3,021,391) (3,021,391)Woongjin Chemical Co., Ltd. (*3) (248,702) (12,313,676) (12,562,378)
\ (248,702) \ (15,422,552) \ (15,671,254)
Woongjin Chemical Co., Ltd. (*3) - (248,702) (248,702)\ - \ (248,702) \ (248,702)
Jan. 1, 2009 Net changes Dec. 31, 2009
2010
Jan. 1, 2010 Net changes Dec. 31, 2010
2009
(*1) The Company acquired additional 0.01% equity interest in Woong Jin Coway (Thailand) Co.,
Ltd. during the year ended December 31, 2010. At the acquisition, the difference which is the excess of the cost of the additional investment over the entity’s proportionate net asset value amounted to \87,485 thousand.
(*2) The Company acquired additional 30% equity interest in Woong Jin Coway (M) S dn Bhd.
during the year ended December 31, 2010. At the acquisition, the difference which is the excess of the cost of the investment over the entity’s proportionate net asset value amounted to \3,322,030 thousand. However, due to the suspension of equity method accounting, the Company only charged upto \3,021,391 in capital adjustment account, out of which \2,493,996 thousand is reserved in allowance for doubtful accounts against the related long-term loans receivable from Woongjin Coway (M) Sdn Bhd.
(*3) Deferred income tax effect was deducted from the current year adjustment for Woongjin
Chemical Co., Ltd.
As of December 31, 2010 and 2009, the unrecognized losses of the respective investees from which the application of the equity method of accounting has been suspended are as follows (Korean won in thousands):
Coway Japan Corporation \ (17,864,660) \ (16,162,677)Woong Jin Coway (Thailand) Co., Ltd. (10,726,573) (7,104,308)Woong Jin Coway (M) Sdn Bhd. (300,639) (382,884)
\ (28,891,872) \ (23,649,869)
2010 2009
The market value of investment of a listed investee as of December 31, 2010 and 2009 is as follows (Korean won in thousands):
Woongjin Chemical Co., Ltd. \ 258,646,131 \ 141,060,140 \ 218,604,540 \ 102,308,084
20092010
Market value Book value Market value Book value

Woongjin Coway Co., Ltd. Notes to non-consolidated financial statements December 31, 2010 and 2009
28
8. Government posted value of land owned The book value of the Company-owned land and the assessment value of land officially announced by the Korean government for tax administration purposes as of December 31, 2010 and 2009 are as follows (Korean won in thousands):
Land included in:
Property, plant and equipment- Factory land in Yoo-gu \ 27,366,809 \ 24,242,031 \ 16,442,450 \ 16,080,184- Rental building land in Ga-san 7,878,788 7,878,788 8,446,080 8,050,170
\ 35,245,597 \ 32,120,819 \ 24,888,530 \ 24,130,354
Publicly announced valueBook value
2010 2009 2010 2009
9. Property, plant and equipment
Changes in the net book value of property, plant and equipment for the years ended December 31, 2010 and 2009 are as follows (Korean won in thousands):
Land \ 32,120,819 \ - \ 209,768 \ (1,524) \ - \ 2,916,535 \ 35,245,598Buildings 17,719,015 - 45,071 - (541,826) - 17,222,260 Structures 469,042 - 52,898 - (85,151) - 436,789 Machinery and equipment 8,054,911 - 1,034,956 (12,605) (1,402,306) 2,129,071 9,804,027 Tools 30,817,432 - 12,040,461 - (10,989,851) 4,121,508 35,989,550 (Governmentsubsidy) (53,300) - - - 16,400 - (36,900)Research facility 4,057,162 - 2,000,079 - (2,549,967) 306,055 3,813,329 Rental assets 297,118,701 - 185,190,632 (52,032,958) (107,918,201) - 322,358,174 Furniture and fixtures 20,069,058 209,866 8,767,856 (305,290) (8,021,200) - 20,720,290 Vehicles 261,044 - - - (80,855) - 180,189 Construction- in-progress 7,570,252 - 13,778,513 - - (12,926,676) 8,422,089
\ 418,204,136 \ 209,866 \ 223,120,234 \ (52,352,377) \ (131,572,957) \ (3,453,507) \ 454,155,395
Dec. 31, 2010
2010
AdditionsDisposals /
impairment loss Depreciation Transfers (*1)Jan. 1, 2010Increase bycombination
(*1) Refers to transfer to long-term loans receivable.
Land \ 14,456,459 \ 14,826,915 \ 2,185,135 \ - \ - \ 652,310 \ 32,120,819 Buildings 10,643,187 6,613,220 922,010 - (459,402) - 17,719,015 Structures 181,220 297,236 - - (79,114) 69,700 469,042 Machinery and equipment 6,001,040 1,512,457 771,900 (36,881) (1,111,405) 917,800 8,054,911 Tools 26,087,992 405,925 11,397,803 (1,907) (9,326,741) 2,254,360 30,817,432 (Governmentsubsidy) (69,700) - - - 16,400 - (53,300)Research facility 3,318,526 98,437 1,623,151 (7,615) (1,995,326) 1,019,989 4,057,162 Rental assets 278,451,687 - 178,547,820 (51,885,977) (107,994,829) - 297,118,701 Furniture and fixtures 15,911,255 383,087 11,195,207 (340,181) (7,195,440) 115,130 20,069,058 Vehicles 338,461 14,356 9,500 (18,249) (83,024) - 261,044 Construction- in-progress 1,090,794 239,180 11,269,567 - - (5,029,289) 7,570,252
\ 356,410,921 \ 24,390,813 \ 217,922,093 \ (52,290,810) \ (128,228,881) \ - \ 418,204,136
2009
Jan. 1, 2009 AdditionsDisposals /
impairment loss Depreciation Transfers Dec. 31, 2009Increase by
merger

Woongjin Coway Co., Ltd. Notes to non-consolidated financial statements December 31, 2010 and 2009
29
10. Intangible assets
Details of intangible assets as of December 31, 2010 and 2009 are as follows (Korean won in thousands):
CostAccumulatedamortization Net book value
Goodwill \ 141,914,850 \ (52,392,202) \ 89,522,648Industrial property rights 199,821 (152,776) 47,045Others 63,175,872 (23,269,400) 39,906,472Construction-in-progress 4,148,273 - 4,148,273
\ 209,438,816 \ (75,814,378) \ 133,624,438
2010
CostAccumulatedamortization Net book value
Goodwill \ 136,954,850 \ (37,022,374) \ 99,932,476Industrial property rights 199,821 (137,925) 61,896Others 53,779,129 (16,546,716) 37,232,413Construction-in-progress 3,859,960 - 3,859,960
\ 194,793,760 \ (53,707,015) \ 141,086,745
2009
Changes in the net book value of intangible assets for the years ended December 31, 2010 and 2009 are as follows (Korean won in thousands):
Goodwill \ 99,932,476 \ 4,960,000 \ (15,369,828) \ - \ - \ 89,522,648 Industrial property rights 61,896 - (14,852) - - 47,044 Others 37,232,413 1,481,123 (6,828,784) 8,038,620 (16,899) 39,906,473 Construction- in-progress 3,859,960 8,326,933 - (8,038,620) - 4,148,273
\ 141,086,745 \ 14,768,056 \ (22,213,464) \ - \ (16,899) \ 133,624,438
DisposalsAmortization Transfers Dec. 31, 20102010
Jan. 1, 2010 Additions
Goodwill (*1) \ 24,631,434 \ 89,215,560 \ - \ (13,914,518) \ - \ - \ 99,932,476Industrial propertyrights 89,040 932 - (24,522) - (3,554) 61,896Others 40,136,717 709,694 2,300,099 (5,935,881) 73,750 (51,966) 37,232,413Construction- in-progress - - 3,933,710 - (73,750) - 3,859,960
\ 64,857,191 \ 89,926,186 \ 6,233,809 \ (19,874,921) \ - \ (55,520) \ 141,086,745
2009Jan. 1, 2009 Increase by Additions Amortization Transfers Disposals Dec. 31, 2009
(*1) Refers to the difference between fair value of net assets of the acquired entity and purchase consideration paid by the Company.
Woongjin Coway Co., Ltd. Notes to non-consolidated financial statements December 31, 2010 and 2009
30
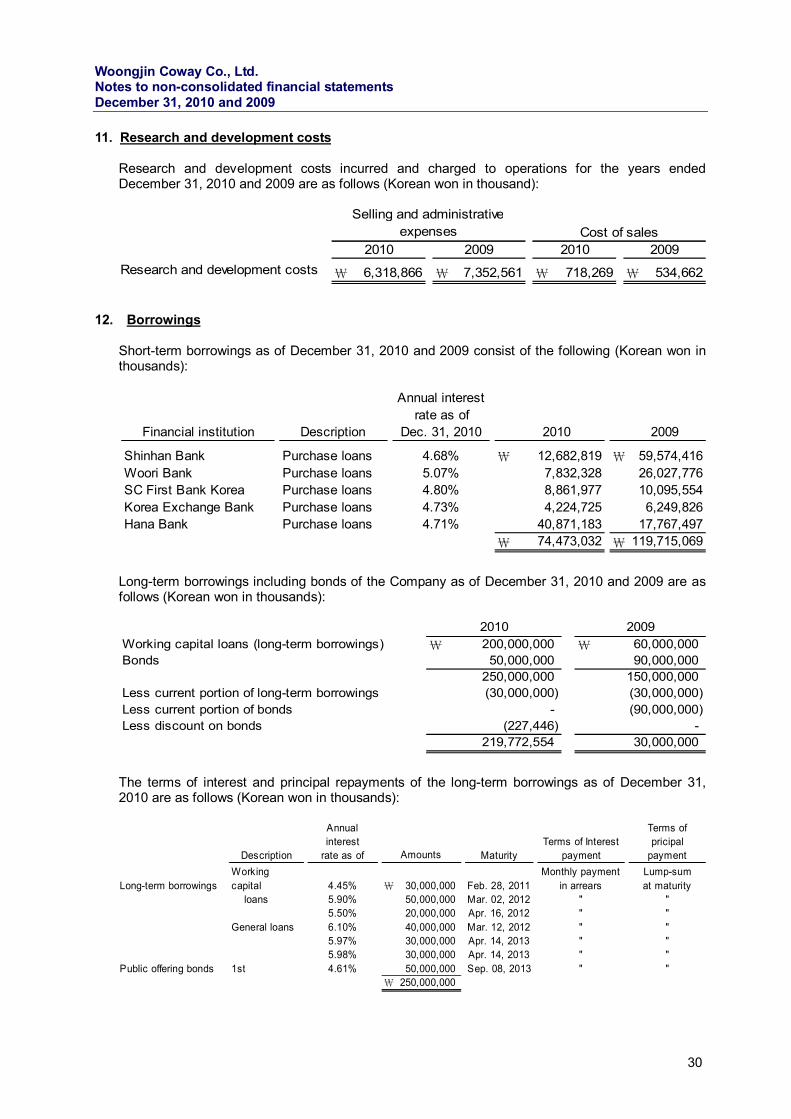
11. Research and development costs Research and development costs incurred and charged to operations for the years ended
December 31, 2010 and 2009 are as follows (Korean won in thousand):
Research and development costs \ 6,318,866 \ 7,352,561 \ 718,269 \ 534,662
Selling and administrativeexpenses Cost of sales
2010 2009 2010 2009
12. Borrowings
Short-term borrowings as of December 31, 2010 and 2009 consist of the following (Korean won in thousands):
Financial institution Description
Annual interestrate as of
Dec. 31, 2010 2010 2009
Shinhan Bank Purchase loans 4.68% \ 12,682,819 \ 59,574,416Woori Bank Purchase loans 5.07% 7,832,328 26,027,776SC First Bank Korea Purchase loans 4.80% 8,861,977 10,095,554Korea Exchange Bank Purchase loans 4.73% 4,224,725 6,249,826Hana Bank Purchase loans 4.71% 40,871,183 17,767,497
\ 74,473,032 \ 119,715,069
Long-term borrowings including bonds of the Company as of December 31, 2010 and 2009 are as follows (Korean won in thousands):
Working capital loans (long-term borrowings) \ 200,000,000 \ 60,000,000Bonds 50,000,000 90,000,000
250,000,000 150,000,000Less current portion of long-term borrowings (30,000,000) (30,000,000)Less current portion of bonds - (90,000,000)Less discount on bonds (227,446) -
219,772,554 30,000,000
2010 2009
The terms of interest and principal repayments of the long-term borrowings as of December 31, 2010 are as follows (Korean won in thousands):
Description
Annualinterest
rate as of MaturityTerms of Interest
payment
Terms ofpricipal
payment
Long-term borrowingsWorkingcapital 4.45% \ 30,000,000 Feb. 28, 2011
Monthly paymentin arrears
Lump-sumat maturity
loans 5.90% 50,000,000 Mar. 02, 2012 " "5.50% 20,000,000 Apr. 16, 2012 " "
General loans 6.10% 40,000,000 Mar. 12, 2012 " "5.97% 30,000,000 Apr. 14, 2013 " "5.98% 30,000,000 Apr. 14, 2013 " "
Public offering bonds 1st 4.61% 50,000,000 Sep. 08, 2013 " "\ 250,000,000
Amounts

Woongjin Coway Co., Ltd. Notes to non-consolidated financial statements December 31, 2010 and 2009
31
13. Reserve for agent losses In accordance with the contract between the Company and its sales agents, the Company provides a reserve by deducting a certain portion of commission fees payable to its sales agents to account for any unfavorable events that may result in losses to be absorbed by the Company due to the business conduct of the sales agents. All actual losses incurred are deducted against the reserve originally recognized.
14. Monetary assets denominated in foreign currencies Monetary assets denominated in foreign currencies as of December 31, 2010 and 2009 are as
follows (Korean won in thousands):
Assets: Cash and cash equivalents USD 6,694,511 \ 7,624,378 USD 3,875,806 \ 4,525,391
EUR 2,358,170 3,569,327 EUR 1,674,004 2,802,751JPY 3,000,026 41,913 JPY 3,000,019 37,885
Short-term loans receivable USD 2,070,000 2,357,523 USD 2,610,000 3,047,436JPY - - JPY 170,000,000 2,146,794USD 43,490,714 49,531,574 USD 22,824,792 26,650,227JPY 670,449,511 9,366,716 JPY 579,709,125 7,320,683THB 125,507,303 4,741,666 THB 132,207,303 4,629,900EUR 1,367,265 2,069,493 EUR - -
Other accounts receivable USD 105,351 119,984 USD 368,695 430,488 Accrued interest income (*1) USD 1,499,682 1,707,987 USD 949,695 1,108,864
JPY 33,352,602 465,963 JPY 16,622,616 209,914 Long-term loans receivable (*2) USD 5,968,527 6,797,555 USD 3,768,370 4,399,949
JPY 170,000,000 2,375,036 JPY - - Total USD 59,828,785 USD 34,397,358
EUR 3,725,435 EUR 1,674,004JPY 876,802,139 JPY 769,331,760THB 125,507,303 THB 132,207,303
20092010
Foreigncurrencies
Korean wonequivalent
Foreigncurrencies
Korean wonequivalent
Trade accounts and notes receivable
57,310,282\ 90,769,115 \
Gain on foreign currency translation for the years ended December 31, 2010 and 2009 amounted to \1,338,918 thousand and \21,757 thousand, respectively. Loss on foreign currency translation for the years ended December 31, 2010 and 2009 amounted to \1,712,446 thousand and \4,189,619 thousand, respectively.
(*1) Refers to income arising from loans receivables from subsidiaries and investees as of December 31, 2010, and they are fully (100%) reserved as an allowance for doubtful accounts.
(*2) Since the suspension of application of equity method, the Company has recognized further share of losses as an allowance for doubtful accounts against long-term loans receivable as of December 31, 2010 (Note 8)

Woongjin Coway Co., Ltd. Notes to non-consolidated financial statements December 31, 2010 and 2009
32
15. Severance and retirement benefits Changes in net carrying amount of severance and retirement benefits for the years ended
December 31, 2010 and 2009 are as follows (Korean won in thousands):
As of January 1, \ 37,808,985 \ 27,351,459Payments during the year (24,159,484) (13,866,684)Provision during the year 16,652,432 19,355,829Succeeded from merger - 862,380Transfer from related parties (75,579) 4,106,001
30,226,354 37,808,985Presented net of:Insurance deposits (93,929) (26,436,652)Defined benefit plan assets (*1) (23,385,400) - Accumulated prepayments to the NPS (23,508) (35,464)As of December 31, \ 6,723,517 \ 11,336,869
20092010
(*1) During the year ended December 31, 2010, the Company made a transition to defined benefit pension plans for its employees and most of previous insurance deposits were transferred to defined benefit plan assets and those are presented as a deduction from the provision for severance and retirement benefits.
16. Provisions Changes in the carrying amount of provisions for the year ended December 31, 2010 are as follows
(Korean won in thousands):
Provision for:
Product warranties (*1) \ 1,765,671 \ 1,243,016 \ - \ 3,008,687Return of goods sold (*1) 668,268 525,476 - 1,193,744Construction warranties 139,217 10,000 (57,401) 91,816
\ 2,573,156 \ 1,778,492 \ (57,401) \ 4,294,247
Jan. 1, 2010 ProvisionsUtilization /Reversal Dec. 31, 2010
(*1) The Company recognized the estimated liability to repair or replace products sold with one year
warranty as provision for product warranties and recognized the estimated liability for the return of goods sold within 10 months after sales of goods as a provision for return of goods sold as of December 31, 2010.
Woongjin Coway Co., Ltd. Notes to non-consolidated financial statements December 31, 2010 and 2009
33
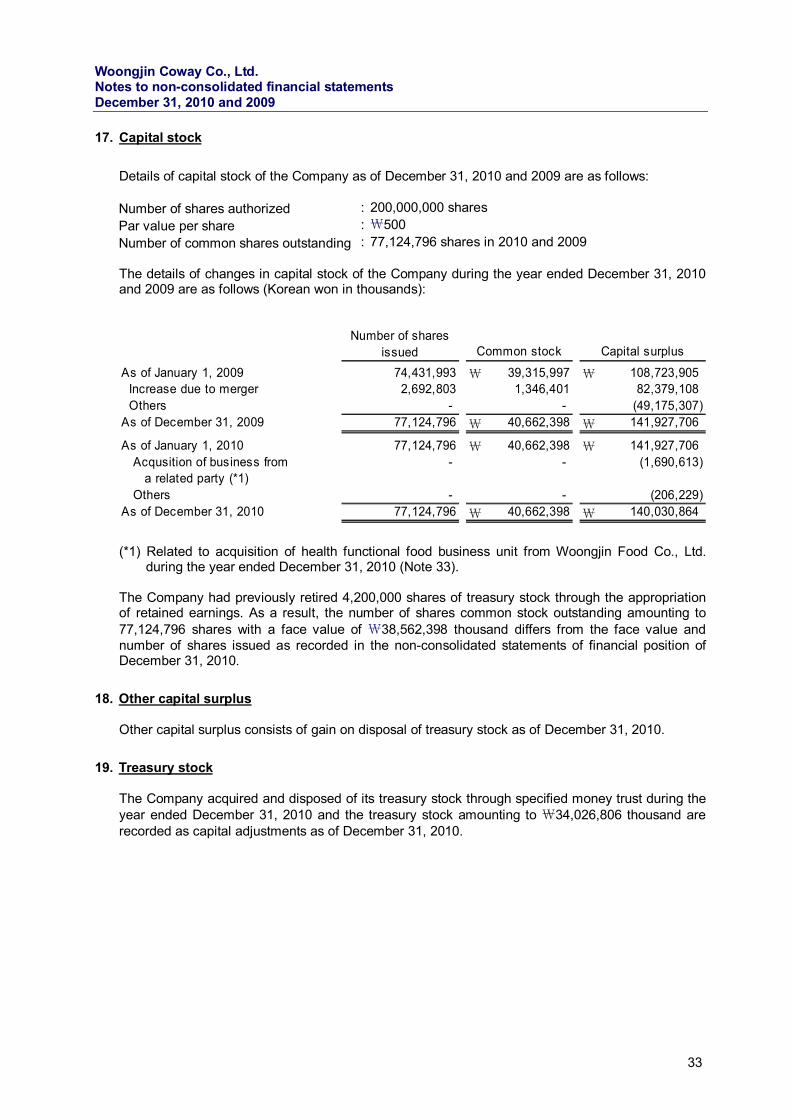
17. Capital stock
Details of capital stock of the Company as of December 31, 2010 and 2009 are as follows: Number of shares authorized : 200,000,000 shares Par value per share : \500 Number of common shares outstanding : 77,124,796 shares in 2010 and 2009 The details of changes in capital stock of the Company during the year ended December 31, 2010 and 2009 are as follows (Korean won in thousands):
Number of sharesissued
As of January 1, 2009 74,431,993 \ 39,315,997 \ 108,723,905 Increase due to merger 2,692,803 1,346,401 82,379,108 Others - - (49,175,307)As of December 31, 2009 77,124,796 \ 40,662,398 \ 141,927,706
As of January 1, 2010 77,124,796 \ 40,662,398 \ 141,927,706 Acqusition of business from - - (1,690,613) a related party (*1) Others - - (206,229)As of December 31, 2010 77,124,796 \ 40,662,398 \ 140,030,864
Capital surplusCommon stock
(*1) Related to acquisition of health functional food business unit from Woongjin Food Co., Ltd. during the year ended December 31, 2010 (Note 33).
The Company had previously retired 4,200,000 shares of treasury stock through the appropriation of retained earnings. As a result, the number of shares common stock outstanding amounting to 77,124,796 shares with a face value of \38,562,398 thousand differs from the face value and number of shares issued as recorded in the non-consolidated statements of financial position of December 31, 2010.
18. Other capital surplus Other capital surplus consists of gain on disposal of treasury stock as of December 31, 2010.
19. Treasury stock The Company acquired and disposed of its treasury stock through specified money trust during the year ended December 31, 2010 and the treasury stock amounting to \34,026,806 thousand are recorded as capital adjustments as of December 31, 2010.

Woongjin Coway Co., Ltd. Notes to non-consolidated financial statements December 31, 2010 and 2009
34
20. Retained earnings
Appropriated retained earnings of the Company as of December 31, 2010 and 2009 are as follows (Korean won in thousands):
Appropriated: Legal reserve (*1) \ 29,455,427 \ 21,755,427 Business development reserve (*2) 1,570,000 1,570,000 Business rationalization reserve 16,228 16,228 Voluntary reserve 421,719,807 352,959,807
\ 452,761,462 \ 376,301,462
20092010
(*1) In accordance with the Korean Commercial Code, an amount equal to at least 10% of cash
dividends is required to be appropriated as a legal reserve until the reserve equals 50% of paid-in capital. The legal reserve may not be utilized for cash dividends but may only be used to offset a deficit, if any, or be transferred to capital.
(*2) In accordance with the Korean Corporate Income Tax Law, the amount appropriated at the
annual ordinary stockholders’ meeting as a business development reserve can be deducted in the calculation of excess retained earnings for corporate income tax reporting purposes. The reserve may only be used to offset a deficit, if any, or may be transferred to capital without a reversal of the tax benefit. Effective from December 2001, such reserve is no longer required by the revised Tax Incentives Limitation Law (“TILL”).

Woongjin Coway Co., Ltd. Notes to non-consolidated financial statements December 31, 2010 and 2009
35
21. Related party disclosures
The related parties of the Company and nature of their relationship with the Company are as follows:
Company name Parent companyRelationship with the Company
Woongjin Chemical Co., Ltd. The Company SubsidiaryWoong Jin Coway (Shenyang) Living Goods Co., Ltd. The Company SubsidiaryWoong Jin Coway USA Inc. The Company SubsidiaryWoong Jin Coway (M) Sdn Bhd. The Company SubsidiaryGETC Co., Ltd. The Company Subsidiary
Significant transactions with related parties for the years ended December 31, 2010 and 2009 are as follows (Korean won in thousands):
Woongjin Chemical Co., Ltd. \ 1,071,660 \ 24,424,209 \ 3,933,832 \ 25,034,079 Woong Jin Coway (Shenyang) Living Goods Co., Ltd. 2,829,691 - 1,482,911 - Woong Jin Coway (M) Sdn Bhd. 12,930,614 - 2,632,867 - Woong Jin Coway USA Inc. 3,719,319 - 3,539,425 - GETC Co., Ltd. 1,000 - - - Coway Japan Corporation 1,388,849 1,462,368 1,721,112 1,010,078 Woong Jin Coway (Thailand) Co., Ltd. 4,440,469 - 1,370,630 - Woong Jin Coway (Hongkong) Co., Ltd. 47,720 - 206,418 - Woongjin Holdings Co., Ltd. 83,097 89,145,354 31,090 60,209,069 Woongjin Energy Co., Ltd. 3,387,392 - 266,622 - Kukdong Construction Co., Ltd. 4,362,680 6,633,719 5,278,996 - Woongjin ST Co., Ltd. 1,016,091 3,960,684 867,334 4,779,861 Woongjin Happyall Co., Ltd. (*1) - - 107,425 82,708,365 Woongjin Foods Co., Ltd. 32,562 7,863,043 28,214 4,226,011 Woongjin Cuchen Co., Ltd. - - 357,298 28,143,400 Booxen Co., Ltd. 7,369 22,570,138 8,423 22,718,653 Rexfield CC Co., Ltd. 99,622 647,938 23,273 552,932 Woongjin Thinkbig Co., Ltd. 73,666 672,002 89,379 670,788 Woongjin Polysilicon Co., Ltd. 572,699 - 6,110 - Woongjin Passone Co., Ltd. 44,693 358,232 62,095 413,481 Woongjin Homecare Co., Ltd. 1,030 33,842 20,548 255 Woongjin Capital Co., Ltd. 5,154 - 2,867 - Woongjin Playdoci Co., Ltd. 20,435 3,086,359 - - Woongjin Logistics Co., Ltd. - 452,578 - - Kizmam Co., Ltd. 938 27,500 - -
\ 36,136,750 \ 161,337,966 \ 22,036,869 \ 230,466,972
20092010
Sales andother
Purchases andother
Sales andother
Purchases andother
(*1) Woongjin Happyall Co., Ltd. was merged into Woongjin Holdings Co., Ltd., by disposing of its CS.DR business unit to the Company and spun off its other business to Woongjin Homecare Co., Ltd during the year ended December 31, 2009.

Woongjin Coway Co., Ltd. Notes to non-consolidated financial statements December 31, 2010 and 2009
36
21. Related party disclosures (cont’d) Outstanding balances with related parties as of December 31, 2010 and 2009 are as follows (Korean won in thousands):
Woongjin Chemical Co., Ltd. \ 78,814 \ 2,401,353 \ 33,976 \ 904,343 Woong Jin Coway (Shenyang) Living Goods Co., Ltd.
5,981,940 - 5,183,952 -
Woong Jin Coway (M) Sdn Bhd.30,517,581 - 18,727,306 -
Woong Jin Coway USA Inc. 9,342,553 - 6,124,697 - Coway Japan Corporation 12,213,536 53,267 10,035,319 66,457 Woong Jin Coway (Thailand) Co., Ltd. 14,493,042 - 7,659,125 - Woong Jin Coway (Hongkong) Co., Ltd. 1,077,057 - 1,834,586 - Woongjin Holdings Co., Ltd. 1,519,796 12,730,772 1,509,135 11,813,934 Woongjin Energy Co., Ltd. 10,531 - - - Kukdong Construction Co., Ltd. 1,182,460 - 1,642,043 10,000 Woongjin ST Co., Ltd. 223 354,986 - 1,333,095 Woongjin Foods Co., Ltd. 2,769 724,608 253 407,823 Booxen Co., Ltd. 1,351 2,143,475 115,471 2,034,165 Rexfield CC Co., Ltd. 4,395,714 68,951 4,305,037 67,851 Woongjin Thinkbig Co., Ltd. 122,589 64,022 5,894 69,204 Woongjin Polysilicon Co., Ltd. 63,891 - - - Woongjin Passone Co., Ltd. 5,585 84,144 - 18,874 Woongjin Homecare Co., Ltd. 172,683 44,947 175,783 7,721 Woongjin Capital Co., Ltd. 340 - - - Woongjin Playdoci Co., Ltd. 2,283 15,133 - - Woongjin Logistics Co., Ltd. - 74,867 - - Kizmam Co., Ltd. 247 - - -
\ 81,184,985 \ 18,760,525 \ 57,352,577 \ 16,733,467
2010 2009
Receivables Payables Receivables Payables
In addition to above receivable, short-term loans receivable from directors and employees as of December 31, 2010 and 2009 amounted to \548,198 thousand and \300,000 thousand, respectively. Allowance for doubtful accounts is reserved against the above receivable in the amount of \26,278,534 thousand and \15,244,842 thousand, as of December 31, 2010 and 2009, respectively.

Woongjin Coway Co., Ltd. Notes to non-consolidated financial statements December 31, 2010 and 2009
37
21. Related party disclosures (cont’d) As of December 31, 2010, there are no guarantees provided by related parties to the Company. Details of guarantee provided to related parties by the Company as of December 31, 2010 are as follows (Korean won in thousands):
Guarantee provided to Description of guaranteeWoong Jin Coway (M) Sdn Bhd. MYR 13,000,000 General loansWoong Jin Coway (Thailand) Co., Ltd. USD 2,000,000 General loansCoway Japan Corporation JPY 3,184,000,000 General loans
MYR 13,000,000USD 2,000,000JPY 3,184,000,000
Guaranteedamount
There are no assets pledged as collateral by the Company on behalf of related parties as of December 31, 2010. Key management personnel include standing directors and outside directors who have the authority and responsibilities for planning, operation and control of the business of the Company. Compensation for key management personnel for the years ended December 31, 2010 and 2009 is as follows (Korean won in thousands):
Salaries \ 3,546,613 \ 2,820,298Severance and retirement benefits (*1) 1,524,245 1,387,595Stock options (*2) 7,792,248 7,956,849
\ 12,863,106 \ 12,164,742
2010 2009
(*1) Accrued severance and retirement benefits for standing and outside directors for the years
ended December 31, 2010 and 2009 amounted to \495,194 thousand and \391,017 thousand, respectively.
(*2) Stock options represent the cumulative compensation expenses for stock options granted to
key management personnel as of December 31, 2010. During the years ended December 31, 2010 and 2009, stock-based compensation expense for key management personnel amounted to \2,123,845 thousand and \1,356,421 thousand, respectively.
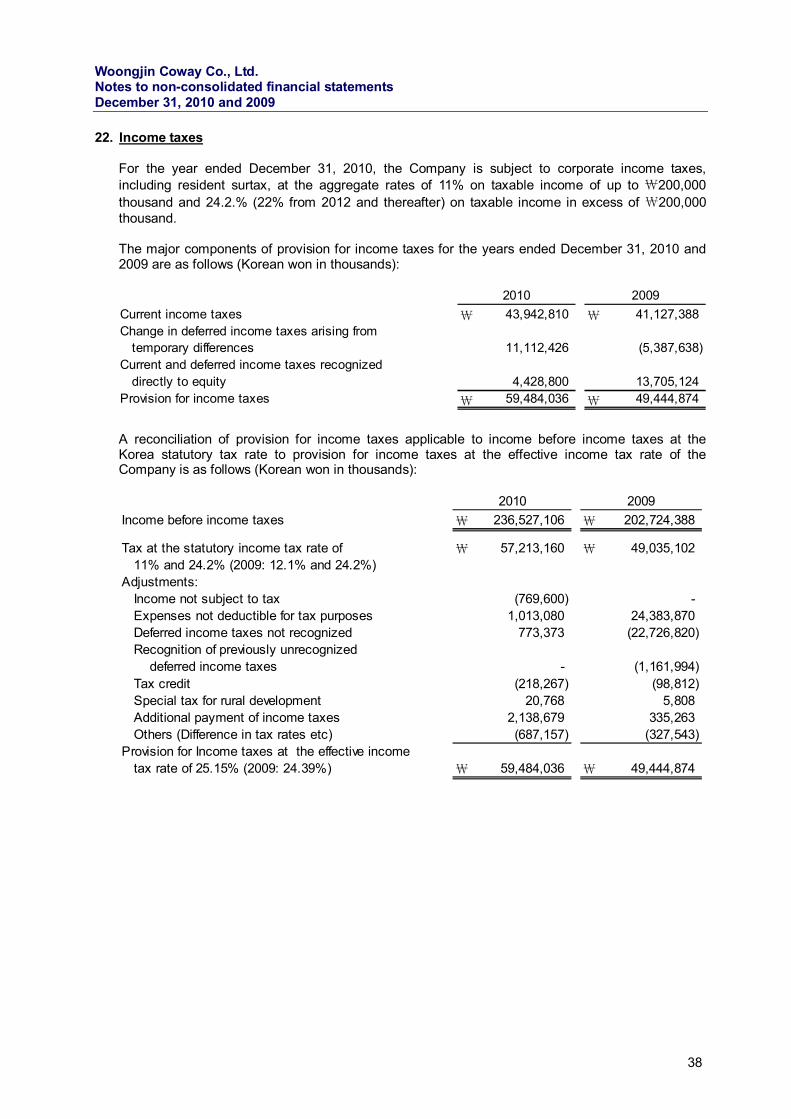
Woongjin Coway Co., Ltd. Notes to non-consolidated financial statements December 31, 2010 and 2009
38
22. Income taxes
For the year ended December 31, 2010, the Company is subject to corporate income taxes, including resident surtax, at the aggregate rates of 11% on taxable income of up to \200,000 thousand and 24.2.% (22% from 2012 and thereafter) on taxable income in excess of \200,000 thousand. The major components of provision for income taxes for the years ended December 31, 2010 and 2009 are as follows (Korean won in thousands):
Current income taxes \ 43,942,810 \ 41,127,388Change in deferred income taxes arising from temporary differences 11,112,426 (5,387,638)Current and deferred income taxes recognized directly to equity 4,428,800 13,705,124Provision for income taxes \ 59,484,036 \ 49,444,874
2010 2009
A reconciliation of provision for income taxes applicable to income before income taxes at the Korea statutory tax rate to provision for income taxes at the effective income tax rate of the Company is as follows (Korean won in thousands):
Income before income taxes \ 236,527,106 \ 202,724,388
Tax at the statutory income tax rate of \ 57,213,160 \ 49,035,102 11% and 24.2% (2009: 12.1% and 24.2%)Adjustments: Income not subject to tax (769,600) - Expenses not deductible for tax purposes 1,013,080 24,383,870 Deferred income taxes not recognized 773,373 (22,726,820) Recognition of previously unrecognized deferred income taxes - (1,161,994) Tax credit (218,267) (98,812) Special tax for rural development 20,768 5,808 Additional payment of income taxes 2,138,679 335,263 Others (Difference in tax rates etc) (687,157) (327,543)Provision for Income taxes at the effective income tax rate of 25.15% (2009: 24.39%) \ 59,484,036 \ 49,444,874
2010 2009

Woongjin Coway Co., Ltd. Notes to non-consolidated financial statements December 31, 2010 and 2009
39
22. Income taxes (cont’d) Deferred income taxes reflect the net tax effects of temporary differences between the carrying amounts of assets and liabilities for financial reporting purposes and the amounts used for corporate income tax reporting purposes. Significant changes in cumulative temporary differences and deferred income tax assets and liabilities for the years ended December 31, 2010 and 2009 are as follows (Korean won in thousands):
As of Jan. 1,2010 Net changes
As of Dec. 31,2010
Deferredincome taxes
recognized Current Non-current
< Deductible temporary differences >Short-term investment assets \ 70,310 \ - \ 70,310 \ - \ - \ - Accrued interest income 1,438 - 1,438 - - - Advanced receipts 94,298,606 (6,457,551) 87,841,055 21,257,535 21,257,535 - Inventory reserve 5,623,407 (288,071) 5,335,336 1,291,151 1,291,151 - Accrued expenses 6,587,521 2,356,347 8,943,868 2,164,416 2,164,416 - Provision for return of goods sold 668,268 525,476 1,193,744 288,886 288,886 - Provision for warranties 1,765,671 1,243,016 3,008,687 728,102 728,102 - Allowance for doubtful accounts 82,488,635 10,426,045 92,914,680 22,485,353 22,485,353 - Loss of foreign currency translation 4,186,619 (2,474,173) 1,712,446 414,412 414,412 - Government subsidy (current) 73,332 347,490 420,822 101,839 101,839 - Bad debt expenses 957,670 (103,850) 853,820 206,624 206,624 - Depreciation (rental assets) 549,543 (19,363) 530,180 116,640 - 116,640Depreciation (general) 2,570 - 2,570 - - - Impairment losses on rental assets 5,564,150 (941,881) 4,622,269 1,016,899 - 1,016,899Intangible assets 164,778 (104,070) 60,708 13,356 - 13,356Severance and retirement benefits 27,027,855 (2,922,333) 24,105,522 5,303,215 - 5,303,215Equity method investments 15,389,795 7,436,393 22,826,188 - - - Long-term Investment securities 4,546,000 1,863 4,547,863 475,150 - 475,150Goodwill (Woongjin Chemical) 14,092,996 (4,124,779) 9,968,217 2,193,008 - 2,193,008 Goodwill (Woongjin Happyall) 50,511,641 (12,627,910) 37,883,731 8,334,421 - 8,334,421Goodwill (Woongjin Food) - 1,977,211 1,977,211 434,986 - 434,986Government subsidy (non-current) 168,980 28,520 197,500 43,450 - 43,450Provision for repair of defects 139,217 (47,400) 91,817 20,200 - 20,200Suspense payment 1,457,564 386,718 1,844,282 405,742 - 405,742Deferred assets 29,048 - 29,048 - - - Miscellaneous Losses 54,521 - 54,521 - - -
\ 316,420,135 \ (5,382,302) \ 311,037,833 \ 67,295,384 \ 48,938,318 \ 18,357,066< Taxable temporary differences >Accrued interest income 44,270 (44,270) - - - -Prepaid expenses 150,624,404 5,654,362 156,278,766 37,819,461 37,819,461 -Gain of foreign currency translation - 10,754,048 10,754,048 2,602,480 2,602,480 -Equity method investments - 15,789,971 15,789,971 3,473,794 - 3,473,794Provision for advance depreciation (Woongjin Cuchen)Provision for temporary depreciation (Woongjin Cuchen)Provision for temporary depreciation - 69,700 69,700 15,334 - 15,334Insurance deposits 14,108,807 4,219,885 18,328,692 4,032,312 - 4,032,312Goodwill (Woongjin Cuchen)Goodwill 8,712,038 (2,453,103) 6,258,934 - - -
\ 173,489,519 \ 33,990,593 \ 207,480,111 \ 47,943,381 \ 40,421,941 \ 7,521,440Deferred income taxes recognized:Deferred income tax assets 18,379,483 67,295,384 48,938,318 18,357,066Deferred income tax liabilities - (47,943,381) (40,421,941) (7,521,440)
\ 18,379,483 \ 19,352,003 \ 8,516,377 \ 10,835,626
2010
Income taxes payable as of December 31, 2010 and 2009 amounted to \41,804,131 thousand and \40,792,125 thousand, respectively. And income taxes receivable before set-off with income taxes payable as of December 31, 2010 and 2009 amounted to \18,540,579 thousand and \17,277,609 thousand, respectively.

Woongjin Coway Co., Ltd. Notes to non-consolidated financial statements December 31, 2010 and 2009
40
22. Income taxes (cont’d)
As of Jan. 1,2009 Net changes
As of Dec. 31,2009
Deferredincome taxes
recognized Current Non-current
< Deductible temporary differences >Short-term investment assets \ 70,310 \ - \ 70,310 \ - \ - \ - Accrued interest income 1,438 - 1,438 - - - Advanced receipts 100,778,615 (6,480,009) 94,298,606 22,820,263 22,820,263 - Inventory reserve 5,674,818 (51,411) 5,623,407 1,360,864 1,360,864 - Accrued expenses 5,138,115 1,449,406 6,587,521 1,594,180 1,594,180 - Provision for return of goods sold 408,437 259,831 668,268 161,721 161,721 - Provision for warranties 1,411,512 354,159 1,765,671 427,292 427,292 - Allowance for doubtful accounts 68,635,013 13,853,622 82,488,635 19,962,250 19,962,250 - Loss on foreign currency translation 111,274 4,075,345 4,186,619 1,013,162 1,013,162 - Government subsidy (current) 61,138 12,194 73,332 17,746 17,746 - Bad debt expenses 853,820 103,850 957,670 231,756 231,756 - Depreciation (rental assets) 826,944 (277,401) 549,543 120,900 - 120,900Depreciation (general) 2,570 - 2,570 - - - Impairment losses on rental assets 7,784,495 (2,220,345) 5,564,150 1,224,113 - 1,224,113Intangible assets 268,848 (104,070) 164,778 36,251 - 36,251Severance and retirement benefits 19,296,672 7,731,183 27,027,855 5,946,128 - 5,946,128Equity method investments 11,727,153 3,662,642 15,389,795 - - - Long-term Investment securities 5,883,988 (1,337,988) 4,546,000 474,740 - 474,740Allowance for doubtful accounts (equity in loss of equity method investments) 3,718,955 (3,718,955) - - - - Goodwill (Woongjin Chemical) 18,217,776 (4,124,780) 14,092,996 3,100,459 - 3,100,459Goodwill (Woongjin Happyall) - 50,511,641 50,511,641 11,112,561 - 11,112,561Government subsidy (non-current) 69,700 99,280 168,980 37,176 - 37,176Provision for repair of defects 161,603 (22,386) 139,217 30,628 - 30,628Suspense payment - 1,457,564 1,457,564 320,664 - 320,664Deferred assets 29,048 - 29,048 - - - Miscellaneous Losses 54,521 - 54,521 - - - Others 4,200 (4,200) - - - -
\ 251,190,964 \ 65,229,172 \ 316,420,135 \ 69,992,853 \ 47,589,234 \ 22,403,619< Taxable temporary differences >Accrued interest income - 32,062 32,062 7,759 7,759 - Prepaid expenses 156,278,766 16,695,724 172,974,490 41,859,827 41,859,827 - Gain on foreign currency translation 10,754,048 (10,732,291) 21,757 5,265 5,265 - Equity method investments 15,789,971 15,680,974 31,470,945 6,201,566 - 6,201,566Appropriated retained earnings for treasury stock 3,230,000 (3,230,000) - - - - Provision for advance depreciation (Woongjin Cuchen) - 7,872,697 7,872,697 1,731,993 - 1,731,993 Provision for temporary depreciation (Woongjin Cuchen) - 812,019 812,019 178,644 - 178,644 Provision for temporary depreciation 69,700 (16,400) 53,300 11,726 - 11,726Insurance deposits 18,328,692 8,107,960 26,436,652 5,816,063 - 5,816,063Goodwill (Woongjin Cuchen) - 84,754,782 84,754,782 - - - Goodwill 6,258,934 (4,694,200) 1,564,734 - - -
\ 210,710,111 \ 115,283,327 \ 325,993,438 \ 55,812,843 \ 41,872,851 \ 13,939,992Deferred income taxes recognized:Deferred income tax assets 55,331,446 69,992,853 47,589,234 22,403,619Deferred income tax liabilities (48,725,041) (55,812,843) (41,872,851) (13,939,992)
\ 6,606,405 \ 14,180,010 \ 5,716,383 \ 8,463,627
2009

Woongjin Coway Co., Ltd. Notes to non-consolidated financial statements December 31, 2010 and 2009
41
22. Income taxes (cont’d)
Details of the amount of deductible (taxable) temporary differences arising from unrecognized deferred income tax assets (liabilities) as of December 31, 2010 and 2009 are as follows (Korean won in thousands):
Equity in loss of equity method investments (*1) \ 22,826,188 \ 15,389,795Equity in earnings of of equity method investments (exclusion of dividend income) (16,223,375) (3,282,010)Goodwill (*2) (75,833,226) (86,319,515)Others 2,545,980 2,545,980
\ (66,684,433) \ (71,665,750)
2010 2009
(*1) Deferred income tax assets arising from deductible temporary differences from equity method
investments were not recognized as it is not probable that the Company will be able to realize those deductible temporary differences in future periods.
(*2) The Company did not recognize the related deferred income tax, as the amortization expense
is not deductible according to the Corporate Income Tax Law. Details of deferred income taxes charged (credited) directly to equity for the years ended December 31, 2010 and 2009 are as follows (Korean won in thousands):
Paid-in capital in excess of par value \ - \ - \ 10,962,415 \ - \ - \ 14,213,020Gain on disposal of treasury stock 173,771 38,230 - 89,143 21,573 - Capital surplus in equity method - - (3,291,954) - - (3,291,954)Capital adjustments in equity method - - 3,543,235 - - 70,147Gain (loss) on valuation of long-term investment securities - - (2,037) - - (2,447)Equity adjustments in equity method - - (78,200) - - (89,892)Negative equity adjustments in equity method - - 979,448 - - 463,664
\ 173,771 \ 38,230 \ 12,112,907 \ 89,143 \ 21,573 \ 11,362,538
2010 2009
Before-taxamount
Income taxesrecognized
directly to equity
Deferredincome tax
assets(liabilities)
Before-taxamount
Income taxesrecognizeddirectly to
equity
Deferredincome tax
assets(liabilities)

Woongjin Coway Co., Ltd. Notes to non-consolidated financial statements December 31, 2010 and 2009
42
23. Per share amounts
The Company’s per share amounts for the years ended December 31, 2010 and 2009 are computed as follows:
Basic earnings per share
Net income \ 177,043,069,713 \ 153,279,513,697Weighted-average number of shares of common stock outstanding (*1) 76,097,700 75,348,868Basic earnings per share \ 2,327 \ 2,034
2010 2009
Number of sharesoutstanding Days
Weighted number ofshares outstanding
Beginning of the year 76,064,796 189 14,376,246,444Exercise of stock options 76,124,796 31 2,359,868,676Exercise of stock options 76,134,796 145 11,039,545,420
365 27,775,660,540Weighted-average number of shares of common stock outstanding 76,097,700
2010
Number of sharesoutstanding Days
Weighted number ofshares outstanding
Beginning of the year 74,431,993 181 13,472,190,733Increase by merger 77,124,796 16 1,233,996,736Repurchase of treasury stock (*1) 76,208,661 120 9,145,039,270Exercise of stock options 76,064,796 48 3,651,110,208
365 27,502,336,947Weighted-average number of shares of common stock outstanding 75,348,868
2009
(*1) Refer to average number of shares from July 17, 2009 to November 13, 2009.
The Company’s Diluted earnings per share amounts for the years ended December 31, 2010 and 2009 are computed as follows:
Diluted earnings per share
Net income attributable to common stock \ 177,043,069,713 \ 153,279,513,697Share-based compensation expense - - Net income attributable to common stock adjusted for the effect of dilution 177,043,069,713 153,279,513,697Weighted-average number of shares of common stock outstanding 76,097,700 75,348,868Adjustment for assumed exercise of stock options 105,410 137,274Weighted-average number of shares of common stock outstanding adjusted for the effect of dilution 76,203,110 75,486,142Diluted earnings per share \ 2,323 \ 2,031
2010 2009
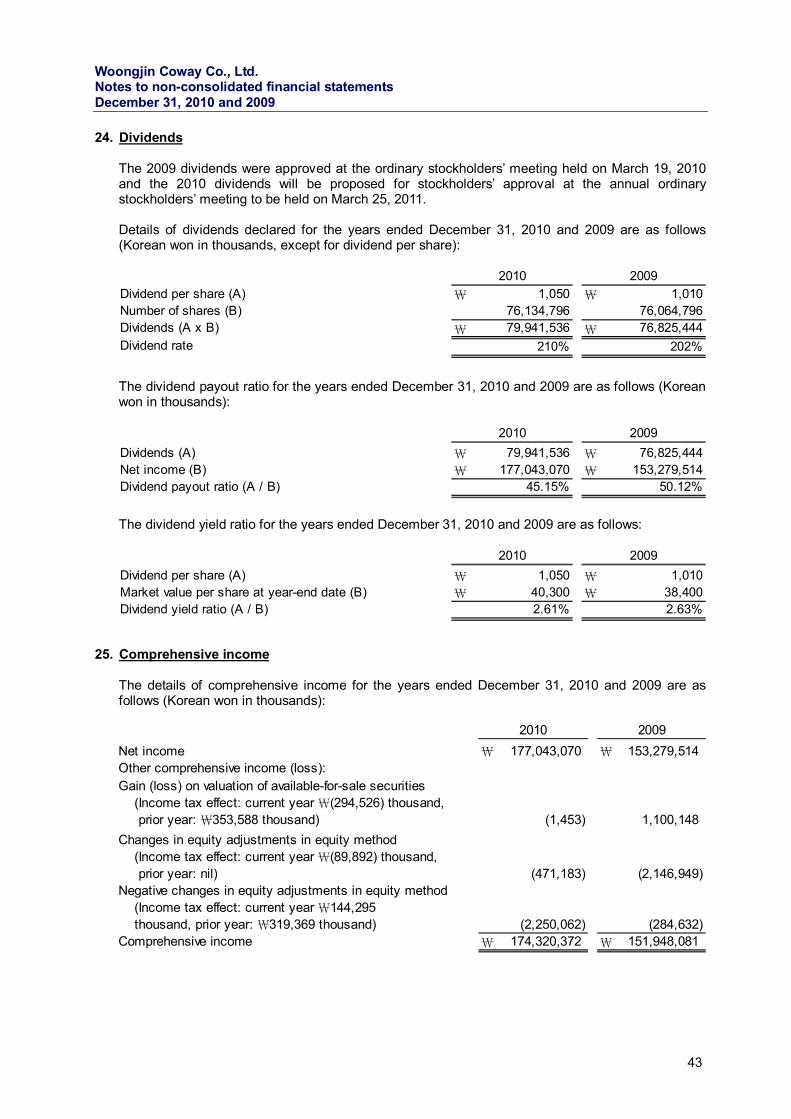
Woongjin Coway Co., Ltd. Notes to non-consolidated financial statements December 31, 2010 and 2009
43
24. Dividends
The 2009 dividends were approved at the ordinary stockholders’ meeting held on March 19, 2010 and the 2010 dividends will be proposed for stockholders’ approval at the annual ordinary stockholders’ meeting to be held on March 25, 2011. Details of dividends declared for the years ended December 31, 2010 and 2009 are as follows (Korean won in thousands, except for dividend per share):
Dividend per share (A) \ 1,050 \ 1,010Number of shares (B) 76,134,796 76,064,796Dividends (A x B) \ 79,941,536 \ 76,825,444Dividend rate 210% 202%
2010 2009
The dividend payout ratio for the years ended December 31, 2010 and 2009 are as follows (Korean won in thousands):
Dividends (A) \ 79,941,536 \ 76,825,444Net income (B) \ 177,043,070 \ 153,279,514Dividend payout ratio (A / B) 45.15% 50.12%
2010 2009
The dividend yield ratio for the years ended December 31, 2010 and 2009 are as follows:
Dividend per share (A) \ 1,050 \ 1,010Market value per share at year-end date (B) \ 40,300 \ 38,400Dividend yield ratio (A / B) 2.61% 2.63%
2010 2009
25. Comprehensive income
The details of comprehensive income for the years ended December 31, 2010 and 2009 are as follows (Korean won in thousands):
Net income \ 177,043,070 \ 153,279,514Other comprehensive income (loss):Gain (loss) on valuation of available-for-sale securities (Income tax effect: current year \(294,526) thousand, prior year: \353,588 thousand) (1,453) 1,100,148Changes in equity adjustments in equity method (Income tax effect: current year \(89,892) thousand, prior year: nil) (471,183) (2,146,949)Negative changes in equity adjustments in equity method (Income tax effect: current year \144,295 thousand, prior year: \319,369 thousand) (2,250,062) (284,632)Comprehensive income \ 174,320,372 \ 151,948,081
2010 2009

Woongjin Coway Co., Ltd. Notes to non-consolidated financial statements December 31, 2010 and 2009
44
26. Supplementary cash flow information
Significant transactions not involving cash flows for the years ended December 31, 2010 and 2009 are as follows (Korean won in thousands):
Acquisition of an equity method investment through a debt-for-equity swap \ - \ 5,775,150Transfer of short-term loans receivable to long-term loans receivable 5,347,565 - Transfer of current private bonds to long-term borrowings 40,000,000 - Transfer of current portion of long-term borrowings to long-term borrowings 30,000,000 - Reclassification of construction-in-progress to each class of property, plant and equipment 20,965,296 5,103,040Transfer of current portion of long-term borrowings 30,000,000 30,000,000
2010 2009
27. Insurance
Details of insured inventories and property, plant and equipment as of December 31, 2010 are as follows (Korean won in thousands):
Description Insured assets Insurance companyFire and other insurance Property, plant and equipment
and InventoriesSamsung Marins &Fire Insurance Co., Ltd.
\ 161,022,999
Coverage amount
In addition, the Company maintains product liability insurance, employee’s group insurance, fidelity insurance and vehicle insurance as of December 31, 2010.
28. Commitments and contingencies
As of December 31, 2010, the Company has seven pending lawsuits with total claims against the Company amounting to \1,539,186 thousand. Among seven lawsuits, the Company is a defendant in five lawsuits with total claims amounting to \469,897 thousand. The outcome of those pending lawsuits cannot presently be determined as of December 31, 2010. As of December 31, 2010, the details of available credit lines of the Company with various banks and financial institutions are as follows (Korean won in thousands): Credit provider Description of credit line
Shinhan Bank and five others \ 227,000,000 Purchase LoanKorea Development Bank and another \ 215,000,000 General borrowingsHana Bank \ 50,000,000 Private equity bondsMeritz Investment Bank and another \ 50,000,000 Commercial paperKorea Exchange Bank \ 3,000,000 Electronic promissory noteHana Bank and two others USD 7,600,000 Lines of credit (sight)
Limit
The Company has provided two blank promissory notes to Korea Development Bank as security in connection with a refinancing borrowing arrangement of Woongjin Chemical Co., Ltd. as of December 31, 2010.

Woongjin Coway Co., Ltd. Notes to non-consolidated financial statements December 31, 2010 and 2009
45
29. Share-based payment transactions The details of stock options granted by the Company as of December 31, 2010 are as follows:
Granted shares 440,000 150,000 50,000 185,000 330,000 132,120Remaining shares 160,000 120,000 - 185,000 330,000 132,120Grant date 2006.03.13 2006.08.01 2006.09.28 2008.03.21 2009.03.20 2010.03.19Exercise price \ 27,050 \ 20,780 \ 22,970 \ 28,690 \ 27,480 \ 35,260Vesting condition
Exercisable period
4th grant 5th grant 6th grant
Remain in service for a period of 3 years
2013.3.19~2017.3.182012.3.20~2016.3.19
Remain in service for a period of 2 years2010.3.21~2015.3.20
Remain in service for a period of 3 years
3rd grant1st grant 2nd grant
2008.3.13~2013.3.12 2008.8.1.~2013.7.31
Remain in service for a period of 2 years
Remain in service for a period of 2 years2008.9.28~2013.9.27
Remain in service for a period of 2 years
Rollforward of stock options during the year ended December 31, 2010 are as follows:
1st grant 2nd grant 3rd grant 4th grant 5th grant 6th grantOutstanding as of January 1, 2010 230,000 120,000 - 185,000 330,000 - Granted during 2010 - - - - - 132,120Exercised during 2010 (70,000) - - - - - Outstanding as of December 31, 2010 160,000 120,000 - 185,000 330,000 132,120Exercisable as of December 31, 2010 160,000 120,000 - 185,000 330,000 132,120
The exercise prices of stock options range from \20,780 to \35,260 and the weighted average remaining years till maturity are 4.3 years as of December 31, 2010. The fair value of stock options is estimated at the grant date by using the Black-Scholes option pricing model. The assumptions used under the Black-Scholes option pricing model for all grants made are as follows:
Stock price \ 28,500 \ 21,700 \ 22,800 \ 23,594 \ 25,543 \ 31,291Exercise price per share \ 27,050 \ 20,780 \ 22,970 \ 28,690 \ 27,480 \ 35,260Expected volatility 34.39% 33.35% 32.86% 44.66% 45.30% 40.25%Expected life of option 5 years 5 years 5 years 5 years 5 years 5 yearsExpected dividend per share \ 208 \ 208 \ 208 \ 780 \ 870 \ 1,010Risk-free interest rate 5.12% 4.86% 4.67% 5.23% 4.15% 4.30%
6th grant3rd grant1st grant 2nd grant 4th grant 5th grant
The share-based compensation expense recognized for the year ended December 31, 2010 is as follows:
Cumulative share-based compensation expense up to 2009 \ 4,313,077 \ 1,042,346 \ 337,060 \ 1,074,683 \ 1,004,099 \ - \ 7,771,265
Share-based compensation expense during 2010 - - - 586,191 1,204,919 435,034
2,226,144
Unrecognized share-based compensation expense - - - 97,698 1,405,739 1,131,087
2,634,524
4,313,077 1,042,346 337,060 1,758,572 3,614,757 1,566,121 12,631,933 Recognized share-based compensation expense 4,313,077 1,042,346 337,060 1,660,874 2,209,018 435,034 9,997,409Exercise of stock options (2,744,686) (208,469) (337,060) - - - (3,290,215)Stock options as of Dec. 31, 2010 \ 1,568,391 \ 833,877 \ - \ 1,660,874 \ 2,209,018 \ 435,034 \ 6,707,194
Total3rd grant1st grant 2nd grant 4th grant 5th grant 6th grant

Woongjin Coway Co., Ltd. Notes to non-consolidated financial statements December 31, 2010 and 2009
46
30. Value added information
In accordance with SKAS 21 Preparation and Presentation of Financial Statements, the “value added” items as defined by the standard, which are required to be disclosed by the Company for the years ended December 31, 2010 and 2009, are as follows (Korean won in thousands):
Labor costs \ 20,100,163 \ 16,084,839 \ 151,513,978 \ 150,847,189 \ - \ - \ 171,614,141 \ 166,932,028Severance and retirement benefits 1,949,365 1,077,632 14,703,067 18,278,197 - - 16,652,432 19,355,829Employee benefits 2,605,541 2,210,748 28,697,616 26,349,593 - - 31,303,157 28,560,341Rent 158,355 106,655 39,276,778 36,700,729 - - 39,435,133 36,807,384Depreciation 10,900,944 7,307,319 12,753,812 12,926,733 107,918,201 107,994,829 131,572,957 128,228,881Taxes and dues 69,393 32,764 1,884,140 1,504,647 - - 1,953,533 1,537,411
\ 35,783,761 \ 26,819,957 \ 248,829,391 \ 246,607,088 \ 107,918,201 \ 107,994,829 \ 392,531,353 \ 381,421,874
Selling and administrativeexpensesCost of sales
2010 2009 2010 2009
Depreciation ofrental assets Total
2010 2009 2010 2009
31. Segment information The Company has two main reportable business segments; rental division and product sales division. The following table presents the financial information of the Company by business segments for the years ended December 31, 2010 and 2009 (Korean won in thousands):
Sales \ 1,254,006,508 \ 205,572,131 \ 59,561,572 \ 1,197,020,387 \ 172,222,550 \ 42,679,379Cost of sales (348,224,740) (122,411,132) (23,436,196) (336,801,796) (96,655,687) (26,714,738)Gross profit \ 905,781,768 \ 83,160,999 \ 36,125,376 \ 860,218,591 \ 75,566,863 \ 15,964,641
2010 2009OthersProduct salesRentalOthersProduct salesRental
32. Cost of sales
The cost of sales for the years ended December 31, 2010 and 2009 are made up of the following (Korean won in thousands):
Beginning inventories \ 27,055,834 \ 23,075,583 \ 32,564,595 \ 19,672,503Cost of finished goods or merchandise purchased 121,081,863 421,550,402 103,175,314 281,117,707Transfer from other accounts 191,864,591 739,075,485 262,643,077 580,333,390Total 340,002,288 1,183,701,470 398,382,986 881,123,600Transfer to other accounts (258,619,581) (1,075,706,533) (327,652,954) (805,066,529)Ending inventories (32,244,019) (34,722,493) (27,055,833) (23,075,583)Cost of goods sold \ 49,138,688 \ 73,272,444 \ 43,674,199 \ 52,981,488
20092010Cost of
merchandise soldCost of finished
goods soldCost of
merchandise soldCost of finished
goods sold

Woongjin Coway Co., Ltd. Notes to non-consolidated financial statements December 31, 2010 and 2009
47
33. Selling and administrative expenses Selling and administrative expenses recognized for the years ended December 31, 2010 and 2009 are as follows (Korean won in thousands):
Salaries (Note 30) \ 151,513,978 \ 150,847,189Severence and retirment benefits (Notes 15, 21 and 30) 14,703,067 18,278,197Stock-based compensation expense (Notes 21 and 29) 2,226,143 1,590,290Sales commission 239,488,035 229,496,263Sales promotion 26,215,898 21,013,749Employee benefits (Note 30) 28,697,616 26,349,593Travel 6,090,933 4,595,548Communications 14,093,413 13,718,660Entertainment 656,165 809,235Conference 1,758,158 2,496,693Education and training 7,277,426 6,459,353Supplies 25,664,385 25,931,396Books and publishing 948,816 1,185,107Advertisements 56,119,801 39,902,660Water, electiricity and gas 1,185,296 1,045,160Rent (Note 30) 39,276,778 36,700,729Taxes and dues (Note 30) 1,884,140 1,504,647Insurance 473,407 625,429Transportation 1,770,445 1,678,236Fees and commissions 73,387,552 71,327,704Repairs and maintenance 4,181,350 3,104,844Vehicles 20,915 12,343Depreciation (Notes 9 and 30) 12,753,812 12,926,733Samples 262,854 306,312Amortization (Note 10) 22,062,530 19,801,685Research and development costs (Note 11) 6,318,866 7,352,561Bad debt expenses 11,418,855 5,982,597Loss on disposal of rental assets 40,854,478 38,135,698Provision for product warranties (Note 16) 1,243,016 354,159Compensation for customers 3,549,026 3,947,790Provision for construction warranties (Note 16) 167,210 12,132
\ 796,264,364 \ 747,492,692
2010 2009

Woongjin Coway Co., Ltd. Notes to non-consolidated financial statements December 31, 2010 and 2009
48
34. Acquisition and transfer of business
On September 3, 2010, the Company acquired the health functional food business unit from Woongjin Food Co., Ltd. The summarized statements of financial position of the acquired business unit as of December 31, 2010 are as follows (Korean won in thousands): .
Assets Current assets \ 1,010,556 Quick assets 468,946 Inventories 541,610 Non-current assets 812,746 Property, plant and equipment 209,866 Others 602,880Total assets 1,823,302Liabilities Current liabilities - Non-current liabilities - Total liabilities - Net assets \ 1,823,302
Dec. 31, 2010
The assets acquired and liabilities assumed were measured at the recorded book value of the consolidated financial statements of Woongjin Food Co., Ltd. at the date of acquisition on September 3, 2010. The purchase consideration the Company paid to acquire the division was \4,321,742 thousand and the difference between the purchase consideration and net assets assumed amounted to \2,498,440, before tax effects. The amount net of income taxes was recorded as a deduction against paid-in capital in excess of par value within capital surplus.
35. Operating results of the final interim period (unaudited)
Summary of operating results for the three months ended December 31, 2010 and 2009 are as follows (Korean won in thousands except per share amounts):
Sales \ 403,223,293 \ 371,409,958Cost of sales 124,495,284 122,430,392Gross profit 278,728,009 248,979,556Operating income 53,728,822 57,114,470Income before income taxes 54,976,338 53,115,032Net income 42,987,354 40,331,976Basic earnings per share (Korean won) 565 531
2010 2009Three months ended December 31,
(Unaudited)

Woongjin Coway Co., Ltd. Notes to non-consolidated financial statements December 31, 2010 and 2009
49
36. Normal business operating cycle and liquidity classification The Company classifies its account receivables and prepaid expenses in accordance with its normal business operating cycle. Receivables and prepaid expenses with maturities of more than one year from the reporting date and within one year from the reporting date which were classified as current assets as of December 31, 2010 are as follows (Korean won in thousands):
Description
\ 10,947,166 \ 24,537,389 Cost of rental57,281,883 129,412,012 Sales commissions2,402,970 - Advertisements and Insurance8,999,843 50,880,940 Receivable from export sales
202,221,773 - Others
\ 281,853,635 \ 204,830,341
Within one year Over one year
Trade account and note receivables
Prepaid expenses
37. Financial statement approval The non-consolidated financial statements of the Company for the year ended December 31, 2010 was approved by the Board of Directors on February 8, 2011.

Taeyoung Bldg., 10-2, Yeouido-dong,Yeongdeungpo-gu, Seoul 150-777 Korea Tel: +82 2 3787 6600 Fax: +82 2 783 5890 www.ey.com/kr
A member firm of Ernst & Young Global Limited
Internal control over financial reporting review report The Chief Executive Officer Woongjin Coway Co., Ltd. We have reviewed the accompanying management’s report on the operations of the internal control over financial reporting (“ICFR”) of Woongjin Coway Co., Ltd. (the “Company”) as of December 31, 2010. The Company’s management is responsible for the design and operations of its ICFR, including the reporting of its operations. Our responsibility is to review management’s ICFR report and issue a report based on our review. Management’s report on the operations of the ICFR of the Company states that “Based on the assessment results, I believe that the Company’s ICFR, as of December 31, 2010, is effectively designed and operating, in all material respects, in conformity with the Best Practice Guideline.” We conducted our review in accordance with the ICFR review standards established by the Korean Institute of Certified Public Accountants. These standards require that we plan and perform our review to obtain less assurance than an audit as to management’s report on the operations of the ICFR. A review includes the procedures of obtaining an understanding of the ICFR, inquiring as to management’s report on the operations of the ICFR and performing a review of related documentation within limited scope, if necessary. A company’s ICFR consists of an establishment of related policies and organization to ensure that it is designed to provide reasonable assurance on the reliability of financial reporting and the preparation of financial statements for external financial reporting purposes in accordance with accounting principles generally accepted in the Republic of Korea. However, because of its inherent limitations, the ICFR may not prevent or detect material misstatements of the financial statements. Also, projections of any assessment of the ICFR on future periods are subject to the risk that ICFR may become inadequate due to the changes in conditions, or that the degree of compliance with the policies or procedures may be significantly reduced. Based on our review of management’s report on the operations of the ICFR, nothing has come to our attention that causes us to believe that management’s report referred to above is not presented fairly, in all material respects, in accordance with the ICFR standards. We conducted our review of the ICFR in existence as of December 31, 2010, and we did not review the ICFR subsequent to December 31, 2010. This report has been prepared for Korean regulatory purposes pursuant to the Act on External Audit for Stock Companies, and may not be appropriate for other purposes or for other users. March 16, 2011 This report is annexed in relation to the audit of the financial statements as of December 31, 2010 and the review of internal accounting control system pursuant to Article 2-3 of the Act on External Audit for Stock Companies of the Republic of Korea.
50

51