word template - report document (office 2010) · web viewboth hotel and serviced accommodation...
TRANSCRIPT
Harris Street Village Summary Report 2012
City of SydneyTown Hall House456 Kent StreetSydney NSW 2000
Harris Street Village
Introduction
The City of Sydney undertakes its comprehensive Floor Space and Employment Survey (FES) every five years to coincide with the Australian Bureau of Statistics’ Census of Population and Housing. The latest FES is the second to encompass those areas amalgamated into the City of Sydney from the former South Sydney and Leichhardt Councils in 2004, and allows the City of Sydney to investigate and report on changes in workforce, businesses and floor space across Surveys.
The FES collects data on all businesses, floor space uses and employment numbers for every building or property within the City of Sydney local government area (LGA). It provides a snapshot of the built form, land uses and economic activity of the City of Sydney every five years. The field data captured for the current Survey was undertaken during 2012.
The data collection phase of the FES involves field surveyors visiting every business in the City of Sydney to determine what industry the business is in, how many workers are in each business, and the floor space use of each business through visual inspection and the use of existing floor space. Information for various capacity measures such as quantity of seating, parking, rooms and units are also collected. Residential uses are only surveyed from the street and validated by checking existing floor plans. The data is entered into a Geographic Information System (GIS) database to allow 2- and 3-dimensional mapping, analysis and reporting.
The data is used by both internal and external stakeholders as a basis for strategic planning, policy formulation, business development and forecasting.
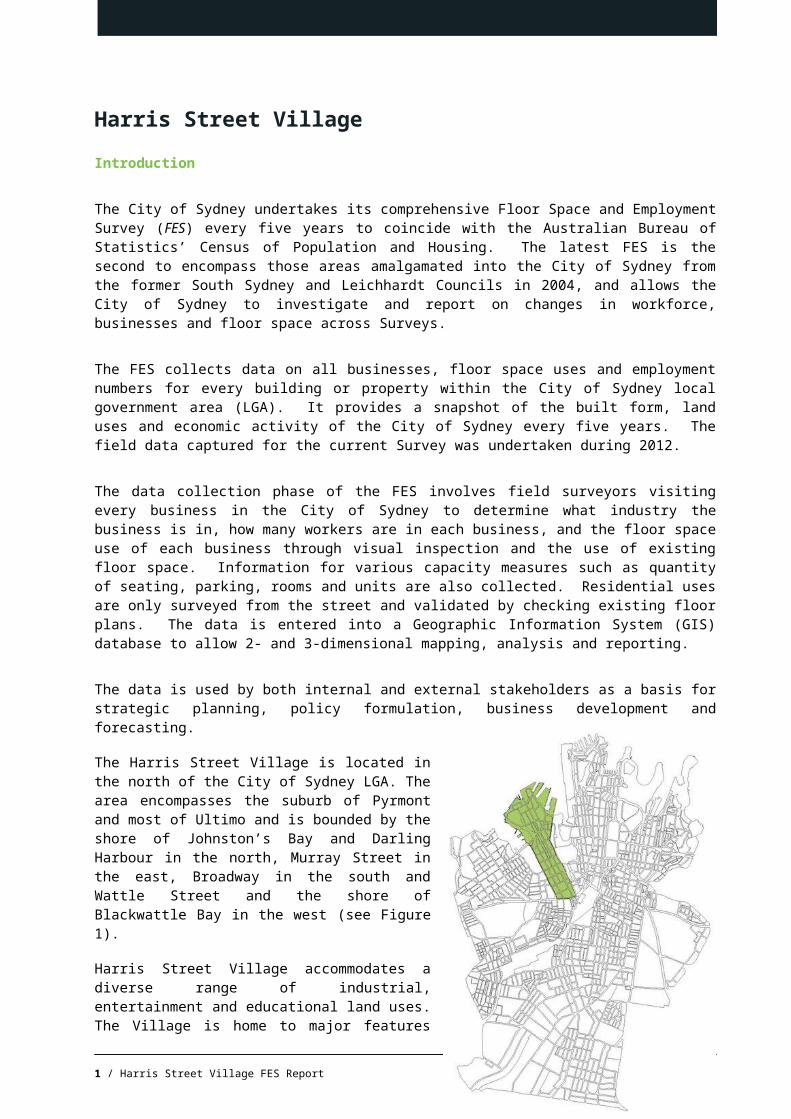
The Harris Street Village is located in the north of the City of Sydney LGA. The area encompasses the suburb of Pyrmont and most of Ultimo and is bounded by the shore of Johnston’s Bay and Darling Harbour in the north, Murray Street in the east, Broadway in the south and Wattle Street and the shore of Blackwattle Bay in the west (see Figure 1).
Harris Street Village accommodates a diverse range of industrial, entertainment and educational land uses. The Village is home to major features such as The Star (formerly the Star City Casino) located in the north, University of Technology, Sydney Institute of TAFE and Australian Broadcasting Corporation in the south west and Powerhouse Museum located in the centre.
The 2012 FES collected data from 1,062 sites in the Village, including 1,045 business premises. The total internal floor space surveyed was 2,956,100m², an increase of 8.9% from the previous Survey.
A further 657,211m² of external area (including parks, backyards, balconies, pools etc.) was also surveyed.
Figure 2 (following) depicts Harris Street Village, looking south-west. Residential uses are shown in dark red, and are predominantly high density, multi-unit apartments located in the north of the Village. Business uses are shown in light brown and are largely located in the southern section of the Village.
1 / Harris Street Village FES Report
Figure 1: Harris Street Village Location Map
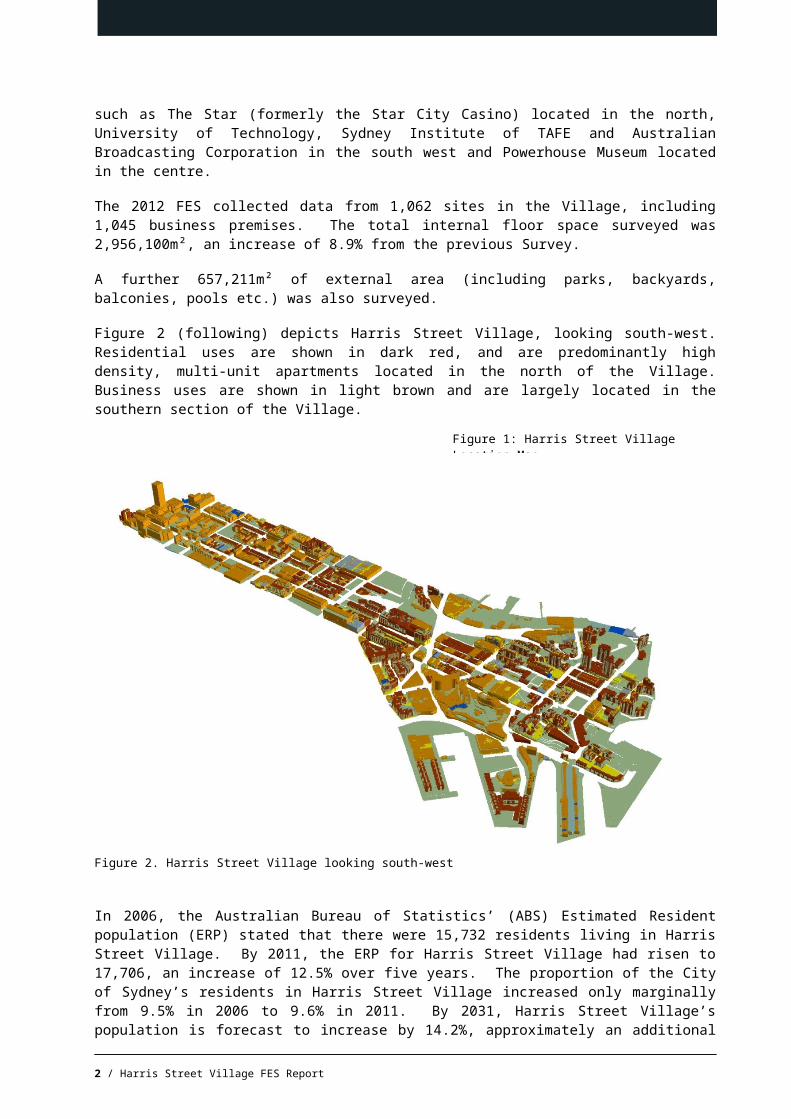
Figure 2. Harris Street Village looking south-west
In 2006, the Australian Bureau of Statistics’ (ABS) Estimated Resident population (ERP) stated that there were 15,732 residents living in Harris Street Village. By 2011, the ERP for Harris Street Village had risen to 17,706, an increase of 12.5% over five years. The proportion of the City of Sydney’s residents in Harris Street Village increased only marginally from 9.5% in 2006 to 9.6% in 2011. By 2031, Harris Street Village’s population is forecast to increase by 14.2%, approximately an additional 2,500 persons.1 Over 90% of dwelling stock in Harris Street Village comprises multi-storey apartments. Between 2007 and 2012, dwelling stock increased by 8.9%. Over the next 3-5 years, expansion of dwelling stock will continue with a number of medium to high density projects already approved and expected to deliver at least 300 new dwellings in Harris Street Village.2
Between the two surveys, employment in Harris Street Village increased by 46.0%, from 19,869 in 2007 to 29,010 in 2012. Whilst full-time employment increased by 38.6% or 6,384 workers, part-time employment, experienced a notable increase of nearly 83% or an additional 2,757 workers. In the latest survey in 2012, 1,045 businesses were counted, an increase of 37.1% since 2007. The average number of workers employed per business increased by 1.73 workers, from 26.07 workers per business in 2007 to 27.8 workers per business in 2012. Internal and external parking spaces in the Village increased by 963 spaces overall, representing an increase of 8.2% since 2007.
When looking at Visitor Accommodation in the Village, there has been a significant increase in the number of rooms between the Surveys, due to the opening of a new hotel at the Star. Both hotel and serviced accommodation capacity increased, together supplying an additional 624 rooms over the five year period.
1 City of Sydney Population Forecasts, Research performed by .id Consulting Pty Ltd. Available at: http://forecast2.id.com.au/Default.aspx?id=148&pg=5000 2 City of Sydney, Residential Monitor December 2012. Available at: http://www.cityofsydney.nsw.gov.au/__data/assets/pdf_file/0017/142514/Issue-no.-49-December-2012.pdf
2 / Harris Street Village FES Report
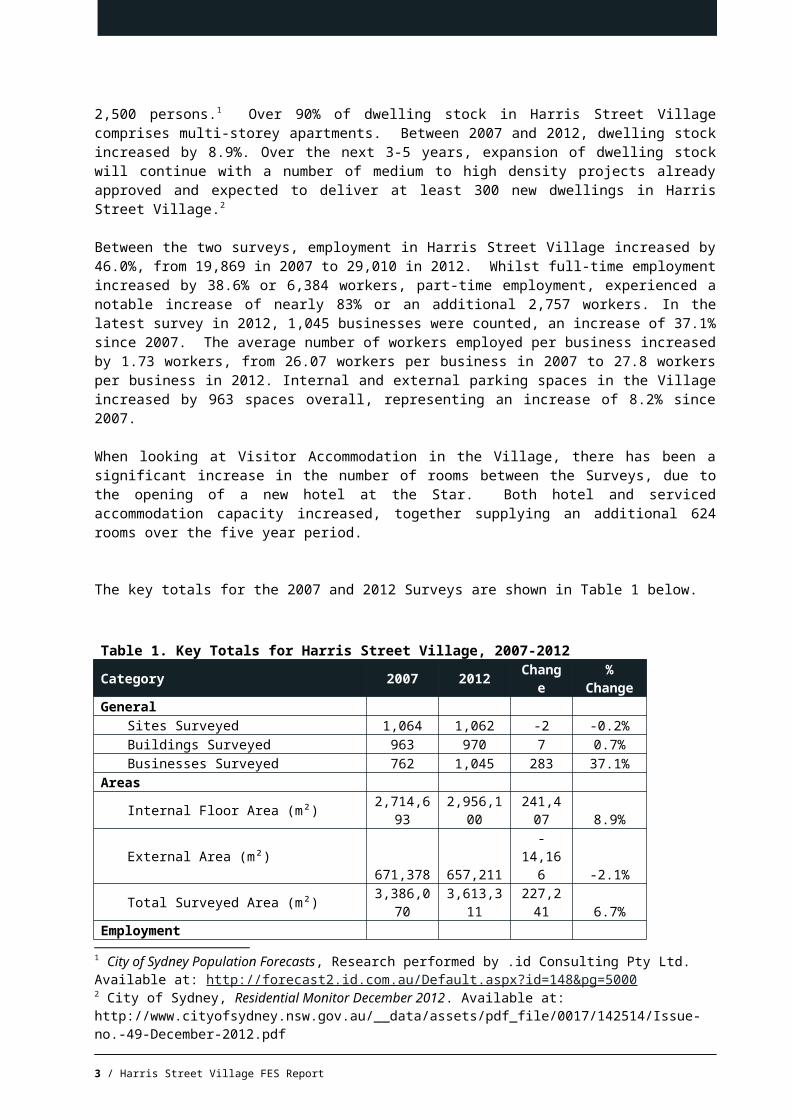
The key totals for the 2007 and 2012 Surveys are shown in Table 1 below.
Table 1. Key Totals for Harris Street Village, 2007-2012Category 2007 2012 Chang
e%
ChangeGeneral
Sites Surveyed 1,064 1,062 -2 -0.2%Buildings Surveyed 963 970 7 0.7%Businesses Surveyed 762 1,045 283 37.1%
Areas
Internal Floor Area (m²) 2,714,693
2,956,100
241,407 8.9%
External Area (m²) 671,378 657,211 -14,166 -2.1%
Total Surveyed Area (m²) 3,386,070
3,613,311
227,241 6.7%
EmploymentFull-time Employment 16,542 22,926 6,384 38.6%Part-time Employment 3,327 6,084 2,757 82.9%Total Employment 19,869 29,010 9,141 46.0%
ResidentialNumber of Dwellings 7,520 8,190 670 8.9%Buildings with Dwellings 752 739 -13 -1.7%Population 15,732 17,706 1,974 12.5%Occupancy Rate 2.09 2.16 - -
Tenant ParkingInternal Parking Spaces 10,666 11,492 826 7.7%External Parking Spaces 1,044 1,181 137 13.1%Total Parking Spaces 11,710 12,673 963 8.2%
Visitor AccommodationHotel Accommodation (Rooms) 431 945 514 119.3%Serviced Apartments (Units) 675 785 110 16.3%Backpacker Accommodation (Beds) 0 0 0 NA
3 / Harris Street Village FES Report

Industry Classification
The FES codes each business establishment based on a modified Australian and New Zealand Standard Industrial Classification (ANZSIC) – 2006. ANZSIC classifies the primary activity of a business into 16 ‘Divisions’ and then into 506 4-digit ‘Industries’. The Survey has further subdivided these into 644 unique business uses, allowing for more detailed analysis of business, employment and floor space uses.
The 644 business uses have been re-categorised into a ‘City-Based Industry Sector’ Classification based on the method used by the City of Greater London. This classification better reflects the mix of uses within the business community of city centres such as the City of Sydney. There are nineteen ‘business’ related industry divisions, and a further five ‘non-business’ related industry divisions within the City-Based Industry Sector Classification. This allows the analysis of industry groups such as Creative Industries, ICT (Information, Communications and Technology) and Tourist, Cultural and Leisure.
Table 2 following shows the breakdown by City-Based Industry of employment, businesses and (business) floor space for Harris Street Village in 2012. During the Survey, data was collected on 1,045 businesses occupying 1,241,247m² of internal floor space and employing 29,010 workers.
Similar to the Crown and Baptist Streets Village, the Creative Industries sector is a significant presence in Harris Street Village, having the largest number of workers (6,303) and the third largest number of businesses (153) and business floor area (207,581m²). Higher Education and Research had the second largest number of workers (5,253) followed by the Tourist, Cultural and Leisure sector with 4,534 workers. These three sectors combined make up over 55% of the Harris Street Village workforce. Whilst Higher Education and Research and Tourist, Cultural and Leisure occupy nearly half of (48.7%) of the Village’s business floor area, these two sectors together represent only 8.9% of total businesses, suggesting the concentration of business activity amongst a handful of industry players. Tables 3, 5 and 6 (following) show the changes in the number of businesses, employment and business floor space use by each of the City-Based Industry Sectors between 2007 and 2012.
Business Establishments
Between 2007 and 2012, the number of businesses in Harris Street Village increased by 37.1%, from 762 to 1,045 businesses. The largest growth of businesses occurred in the Professional and Business Services Industry, with 86 additional businesses counted in 2012. Businesses in the Food and Drink sector experienced the second largest increase of 57 additional businesses. Six of the nineteen industry sectors located in Harris Street Village experienced a loss in the number of businesses over a five year period. The Transport and Logistics and Higher Education and Research industry sectors decreased in business numbers, each losing 5 business establishments respectively.
Of the 1,045 businesses located in Harris Street Village in 2012, just over half (51.4%) were still operating in the same location since 2007. Amongst the top industry sectors which currently have over 30 businesses, the most stable was considered to be the Higher Education and Research sector with nearly 90% of businesses still operating in the same location since 2007.
The sectors which experienced the largest turnover of businesses were Food and Drink, Creative Industries, Professional and Business Services and ICT. Despite having the largest number of business establishments in the area, the Food and Drink sector experienced the highest business turnover with 52 establishments moving or ceasing operations over a five year period. Creative Industries also experienced relatively high business turnover of 28 establishments but the sector still experienced the third largest growth of businesses since 2007.
4 / Harris Street Village FES Report
5 / Harris Street Village FES Report
Table 2. Overview of City-Based Industry Sectors, Harris Street Village, 2012
City-Based Industry Sector Businesses
% of Total Businesses
Employment
% of Total Employment
Business Floor Area
% Business
Floor AreaCommunity 9 0.9% 134 0.5% 7,612 0.6%Creative Industries 153 14.6% 6,303 21.7% 207,581 16.7%Finance and Financial Services 52 5.0% 846 2.9% 25,775 2.1%Food and Drink 194 18.6% 2,441 8.4% 52,553 4.2%Government 1 0.1% 81 0.3% 7,319 0.6%Health 29 2.8% 166 0.6% 4,289 0.3%Higher Education and Research 35 3.3% 5,253 18.1% 286,115 23.1%ICT 94 9.0% 4,219 14.5% 118,240 9.5%Life Science (Bio-tech) 9 0.9% 271 0.9% 10,058 0.8%Manufacturing 15 1.4% 156 0.5% 6,191 0.5%Motor Vehicle 3 0.3% 12 0.0% 1,152 0.1%Natural Resource-Based Industries 0 0.0% 0 0.0% 0 0.0%Other* 0 0.0% 12 0.0% 0 0.0%Professional and Business Services 181 17.3% 2,800 9.7% 70,348 5.7%Property Development and Operation 55 5.3% 527 1.8% 16,718 1.3%Retail and Personal Services 93 8.9% 453 1.6% 16,454 1.3%Social Capital 21 2.0% 301 1.0% 7,489 0.6%Tourist, Cultural and Leisure 58 5.6% 4,534 15.6% 317,633 25.6%Transport and Logistics 40 3.8% 474 1.6% 67,360 5.4%Utilities 3 0.3% 27 0.1% 18,361 1.5%Total 1,045 100.0% 29,010 100.0% 1,241,247 100.0%
6 / Harris Street Village FES Report
*’Other’ industry sector data may include nil businesses, nil employment and/or nil business floor area. This is explained by: the inclusion of non-private households which employ staff, such as student accommodation and aged care facilities; and, workers counted in common areas of multi-tenanted buildings who are not directly linked to a business establishment.

Table 3. Business Mix By City-Based Industry Sectors, Harris Street Village, 2007-2012
City-Based Industry Sector 2007
% of 2007 Businesses 2012 % of 2012
BusinessesChange
2007-2012% Change 2007-2012
Community 6 0.8% 9 0.9% 3 50.0%Creative Industries 113 14.8% 153 14.6% 40 35.4%Finance and Financial Services 36 4.7% 52 5.0% 16 44.4%Food and Drink 137 18.0% 194 18.6% 57 41.6%Government 1 0.1% 1 0.1% 0 0.0%Health 14 1.8% 29 2.8% 15 107.1%Higher Education and Research 40 5.2% 35 3.3% -5 -12.5%ICT 70 9.2% 94 9.0% 24 34.3%Life Science (Bio-tech) 10 1.3% 9 0.9% -1 -10.0%Manufacturing 19 2.5% 15 1.4% -4 -21.1%Motor Vehicle 2 0.3% 3 0.3% 1 50.0%Natural Resource-Based Industries 2 0.3% 0 0.0% -2 -100.0%Other 1 0.1% 0 0.0% -1 -100.0%Professional and Business Services 95 12.5% 181 17.3% 86 90.5%Property Development and Operation 41 5.4% 55 5.3% 14 34.1%Retail and Personal Services 66 8.7% 93 8.9% 27 40.9%Social Capital 16 2.1% 21 2.0% 5 31.3%Tourist, Cultural and Leisure 45 5.9% 58 5.6% 13 28.9%Transport and Logistics 45 5.9% 40 3.8% -5 -11.1%Utilities 3 0.4% 3 0.3% 0 0.0%
Total 762 100.0% 1,045 100.0% 283 37.1%
7 / Harris Street Village FES Report
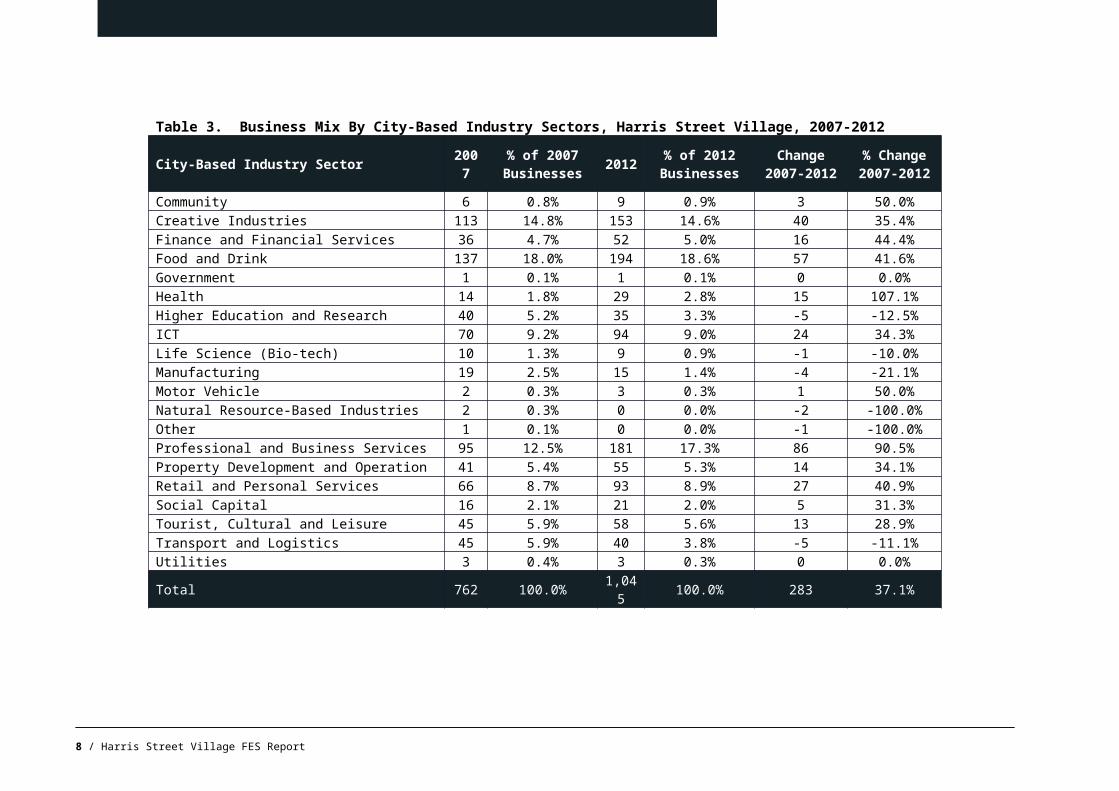
Table 4. Recent and Established Businesses By City-Based Industry Sectors, Harris Street Village, 2012
City-Based Industry Sector Established(Pre-2008)
Commenced2008-2012
% Established
Community 8 1 88.9%Creative Industries 85 68 55.6%Finance and Financial Services 24 28 46.2%Food and Drink 85 109 43.8%Government 1 0 100.0%Health 14 15 48.3%Higher Education and Research 31 4 88.6%ICT 46 48 48.9%Life Science (Bio-tech) 5 4 55.6%Manufacturing 12 3 80.0%Motor Vehicle 3 0 100.0%Natural Resource-Based Industries 0 0 NAOther 0 0 NAProfessional and Business Services 68 113 37.6%Property Development and Operation 31 24 56.4%Retail and Personal Services 50 43 53.8%Social Capital 9 12 42.9%Tourist, Cultural and Leisure 34 24 58.6%Transport and Logistics 30 10 75.0%Utilities 1 2 33.3%Total 537 508 51.4%
Figures 3a and 3b (following) show the percentage share of the top six City-Based Industry Sectors for Harris Street Village in 2007 and 2012. The Food and Drink Sector remains in the leading position as having the highest share of businesses and increasing its share marginally from 18% in 2007 to 18.6% in 2012. The Professional and Business Services sector experienced the largest change to business share, growing by 4.8% over five years to 17.3%. The Creative Industries sector slipped from second to third spot, with its business share declining by 0.2% to 14.6% in 2012.
Amongst the top six sectors, Food and Drink, Professional and Business Services and Retail and Personal Services were the only three sectors which increased their business share over five years. The combined business share of the top six industries has increased by 5%, representing 74% of all businesses in 2012. This trend suggests the industry mix in Harris Street Village has become less diverse over the last five years with the three largest sectors now comprising just over half of all businesses in 2012.
8 / Harris Street Village FES Report

9 / Harris Street Village FES Report
Figure 3a. Percentage Share of Top Six Industry Sectors, 2007
Figure 3b. Percentage Share of Top Six Industry Sectors, 2012

Employment
Between 2007 and 2012, employment in Harris Street Village increased by 46% and had the fastest growing village workforce in the City of Sydney. In 2012, Harris Street Village businesses employed 29,010 workers operating across nineteen different industry sectors. Seventeen industry sectors experienced employment growth in Harris Street Village, with ICT having the highest employment growth to 2012 of 3,023 additional workers. Another five sectors experienced employment growth of over 1,000 workers since 2007; including Professional and Business Services (1,278), Tourist, Cultural and Leisure (1,222) and Food and Drink (1,170) Higher Education and Research (1,091) and Creative Industries (1,087). The top four industry sectors for employment all gained additional businesses over the five years with the exception of the Higher Education and Research sector, which experienced a 26.2% increase in employment despite losing five businesses. The increase of employment numbers is driven by the presence of two major tertiary institutions – TAFE and University of Technology located in the Village.
Table 5 following shows the breakdown of employment by City-Based industry Sector for 2007 and 2012, with the percentage share of each sector and the change between Surveys. Both the ICT and Social Capital workforce more than tripled their respective workforces over five years.
The Finance and Financial Services sector experienced a 46% decline in employment despite an increase of 16 business establishments between the two Surveys. Natural Resource-Based Industries, which was previously represented by two businesses in 2007, ceased operating in the area and subsequently has no employment.
In 2012, businesses in Harris Street Village area employed 27.76 workers on average across all sectors. This represents an addition of 1.7 additional workers per business since 2007. The increase in the average number of workers per establishment is mainly driven by the extraordinary growth in employment experienced in the Higher Education and Research sector. Higher Education and Research had the highest number of workers per establishment (150.09), on average absorbing an additional 46 workers per establishment between the two Surveys. The Motor Vehicle sector recorded the lowest number of workers per establishment (4.0) followed by Retail and Personal Services (4.87) and Health (5.72).
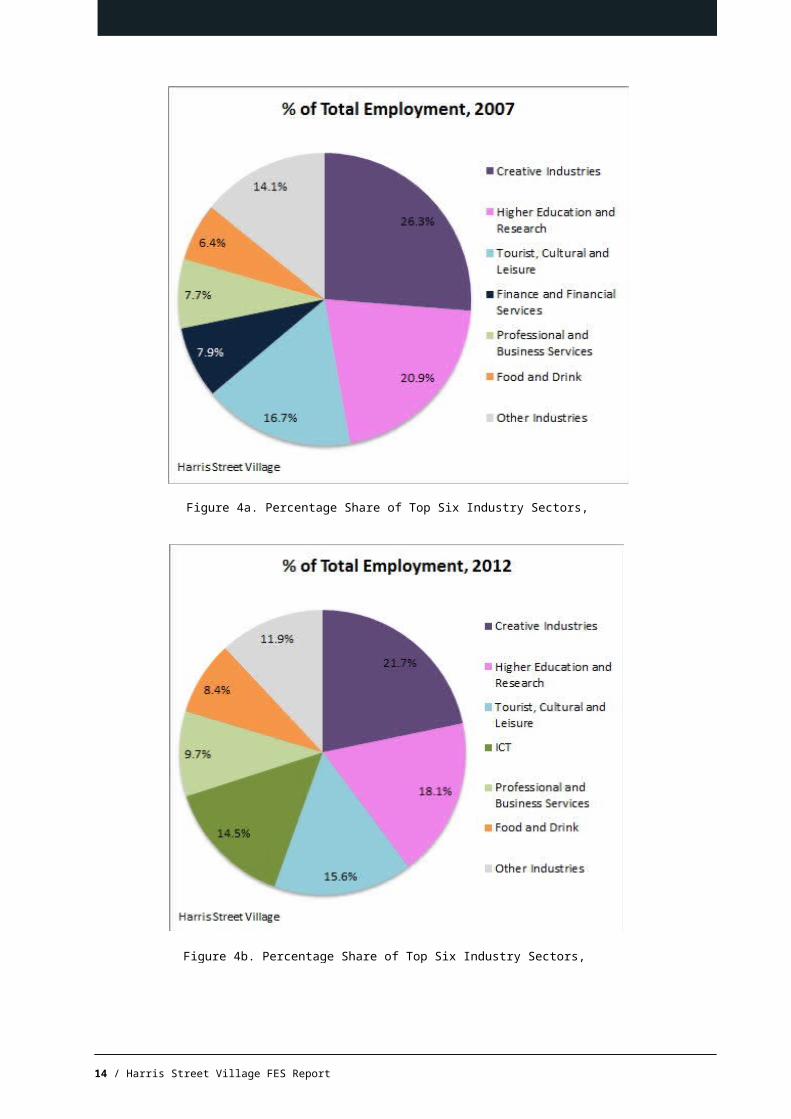
The following figures (4a and 4b) illustrate the proportion of employment across the top six industry sectors in 2007 and 2012 respectively. The Creative Industries sector had the highest proportion of employment in Harris Street Village in both 2007 and 2012. However, its percentage share decreased over the period, from 26.3% in 2007 to 21.7% in 2012 despite the industry employing an additional 1,087 workers.
Higher Education and Research continues to have the second highest share of employment, accounting for 18.1% of the total Harris Street Village area workforce in 2012.
The ICT industry sector had the highest growth in employment percentage share, up 8.5% to 14.5% in 2012 and jumping from seventh to fourth place. In contrast, Finance and Financial Services had the largest decline in percentage share, falling by 5.0%, from 7.9% to 2.9% and moving to seventh place.
In 2012, the top three industries became less dominant in terms of employment with their combined workforce share decreasing by 8.5% from 63.9% to 55.4%.
10 / Harris Street Village FES Report

Table 5. Employment By City-Based Industry Sectors, Harris Street Village, 2007-2012
City-Based Industry Sector 2007 % of 2007 Employment 2012 % of 2012
EmploymentChange
2007-2012% Change 2007-2012
Community 47 0.2% 134 0.5% 87 185.1%Creative Industries 5,216 26.3% 6,303 21.7% 1,087 20.8%Finance and Financial Services 1,576 7.9% 846 2.9% -730 -46.3%Food and Drink 1,271 6.4% 2,441 8.4% 1,170 92.1%Government 81 0.4% 81 0.3% 0 0.0%Health 110 0.6% 166 0.6% 56 50.9%Higher Education and Research 4,162 20.9% 5,253 18.1% 1,091 26.2%ICT 1,196 6.0% 4,219 14.5% 3,023 252.8%Life Science (Bio-tech) 111 0.6% 271 0.9% 160 144.1%Manufacturing 100 0.5% 156 0.5% 56 56.0%Motor Vehicle 8 0.0% 12 0.0% 4 50.0%Natural Resource-Based Industries 7 0.0% 0 0.0% -7 -100.0%Other 2 0.0% 12 0.0% 10 500.0%Professional and Business Services 1,522 7.7% 2,800 9.7% 1,278 84.0%Property Development and Operation 312 1.6% 527 1.8% 215 68.9%Retail and Personal Services 287 1.4% 453 1.6% 166 57.8%Social Capital 88 0.4% 301 1.0% 213 242.0%Tourist, Cultural and Leisure 3,312 16.7% 4,534 15.6% 1,222 36.9%Transport and Logistics 445 2.2% 474 1.6% 29 6.5%Utilities 16 0.1% 27 0.1% 11 NA
Total 19,869 100.0% 29,01
0 100.0% 9,141 46.0%
11 / Harris Street Village FES Report

12 / Harris Street Village FES Report
Figure 4a. Percentage Share of Top Six Industry Sectors, 2007
Figure 4b. Percentage Share of Top Six Industry Sectors, 2012

The following figures (5 and 6) show the distribution of employment by block in 2012 and the change in employment numbers by block between 2007 and 2012 respectively.
As can be seen in the first map, there is a distinct north – south polarisation of workforce activity in Harris Street Village area. Around 41% of the Harris Street Village workforce is located across 5 blocks located in the north eastern and north western halves of the Village. These blocks coincide with major players in the Creative, ICT and Tourist, Cultural and Leisure sectors including Google, Seven Network, Fairfax Digital, Channel 10 and Star City Casino. In the South, there are four blocks which represent nearly a quarter (23.7%) of the Harris Street Village workforce and largely represent the concentration of tertiary institutions (UTS and TAFE) and establishments linked to Higher Education and Research. Australian Broadcasting Corporation is also located in this southern pocket of Harris Street Village and represents a major employer in this area.
13 / Harris Street Village FES Report
Figure 5. Total Employment by Block, 2012
High levels of employment growth exceeding 1,000 workers have occurred mainly in the north east of Harris Street Village. The southern pockets of Harris Street Village have also experienced moderate employment growth with three blocks experiencing an overall increase of 1,457 workers. The predominant employment loss has occurred in two blocks located in the central east and south east pocket of Harris Street Village.
14 / Harris Street Village FES Report
Figure 6. Total Employment Change by Block, 2007 to 2012

Floor Area
The 2012 FES measured nearly three million square metres of internal floor space in Harris Street Village. Additionally, data was collected on approximately 660,000 square metres of external space, including parks, car parks, terraces and balconies. The measurements for the floor space uses were collected by creating spatial entities for each non-contiguous space, and attributing relevant attribute data such as employment numbers, capacity and vacancy to each. Every individual space is held in a Geographic Information System (GIS) database, and is related to the business that uses it. The GIS calculates the areas automatically, and allows 2-D and 3-D rendering of the data.
The Tourist, Culture and Leisure sector is the largest occupier of internal business floor area with 317, 633 m² and accounting for a quarter of total internal business floor area in Harris Street Village. Other industry sectors with significant floor space were Higher Education and Research (286,115m²), Creative Industries (207,581m²) and ICT (118,240m²). These four sectors combined represent almost 75% of business floor area in the Village.
The ICT sector had the highest increase in floor area used, with an additional 39,832m², representing an increase of 50.8%. The Finance and Financial Services sector had the largest fall in floor area, with 15,599m² lost, representing a 37.7% decline between the two Surveys. Overall, there was 67,479m² of net additional business floor space gained in Harris Street Village.
The amount of residential floor area increased by 103,511 m² or 10.8% between 2007 and 2012 and was mainly attributed to a number of high density developments completed in the last 5 years including Acacia and Distillery Hill on Jones Street, Pyrmont, and the Peter Johnson building at UTS. There was a net increase of 670 dwellings completed in this period. As of 2012, there was approximately 1,064,313 m² of floor area in the Residential sector.
Figures 7a and 7b (following) show the percentage share of business floor area for the top six industries in 2007 and 2012 respectively. Tourist, Cultural and Leisure had the highest share of floor space usage, accounting for 25.6% of total business floor area in the Village. Its share of business floor space has remained relatively stable over the five year period. Over the same period, the percentage share of floor space utilised by Higher Education and Research decreased by 1.5% but remained as the second highest occupier of internal floor space in 2012.
ICT and Professional and Business Services had the largest increase of internal floor areas, with their percentages shares growing by 2.8% and 1.6% respectively between the two surveys.
In 2012, the average business was approximately 1,188m² in size (for all space uses) across all sectors. Average business size in Harris Street Village has decreased by around 350m² per establishment over the five year period. When comparing space use across industry sectors with more than 10 business establishments, the Higher Education and Research sector had the highest average space use of 8,175m² per business. The Health sector had the lowest average space use of 148m² per business, which had decreased from 333 m² in 2007, a significant decline of more than 50% of internal floor space over the five year period.
15 / Harris Street Village FES Report

Table 6. Internal Floor Area By City-Based Industry Sectors, Harris Street Village, 2007-2012
City-Based Industry Sector 2007m²
% of 2007 Floor Space
2012m²
% of 2012 Floor Space
Change2007-2012
% Change 2007-2012
Community 7,173 0.6% 7,612 0.6% 439 6.1%Creative Industries 209,495 17.8% 207,581 16.7% -1,914 -0.9%Finance and Financial Services 41,374 3.5% 25,775 2.1% -15,599 -37.7%Food and Drink 51,589 4.4% 52,553 4.2% 964 1.9%Government 7,319 0.6% 7,319 0.6% 0 0.0%Health 4,666 0.4% 4,289 0.3% -376 -8.1%Higher Education and Research 288,978 24.6% 286,115 23.1% -2,864 -1.0%ICT 78,408 6.7% 118,240 9.5% 39,832 50.8%Life Science (Bio-tech) 3,296 0.3% 10,058 0.8% 6,762 205.2%Manufacturing 6,677 0.6% 6,191 0.5% -487 -7.3%Motor Vehicle 332 0.0% 1,152 0.1% 820 247.4%Natural Resource-Based Industries 201 0.0% 0 0.0% -201 -100.0%Professional and Business Services 47,559 4.1% 70,348 5.7% 22,790 47.9%Property Development and Operation 13,763 1.2% 16,718 1.3% 2,955 21.5%Retail and Personal Services 18,642 1.6% 16,454 1.3% -2,187 -11.7%Social Capital 5,067 0.4% 7,489 0.6% 2,422 47.8%Tourist, Cultural and Leisure 308,377 26.3% 317,633 25.6% 9,256 3.0%Transport and Logistics 62,681 5.3% 67,360 5.4% 4,679 7.5%Utilities 18,172 1.5% 18,361 1.5% 189 1.0%Total Business Floor Area 1,173,767 100.0% 1,241,247 100.0% 67,479 5.7%
Private Households 960,801 35.4% 1,064,313 36.0% 103,511 10.8%Non-Private Households 663 0.0% 591 0.0% -72 -10.8%Other 396,122 14.6% 530,944 18.0% 134,822 34.0%Redevelopment 61,759 2.3% 24,751 0.8% -37,008 -59.9%Vacant 121,580 4.5% 94,254 3.2% -27,326 -22.5%Total Businesses Floor Area 1,173,767 43.2% 1,241,247 42.0% 67,479 5.7%Total Floor Area 2,714,693 100.0% 2,956,100 100.0% 241,407 8.9%
16 / Harris Street Village FES Report
17 / Harris Street Village FES Report
Figure 7a. Percentage Share of Top Six Industry Sectors by Floor Area, 2007
Figure 7b. Percentage Share of Top Six Industry Sectors by Floor Area, 2012
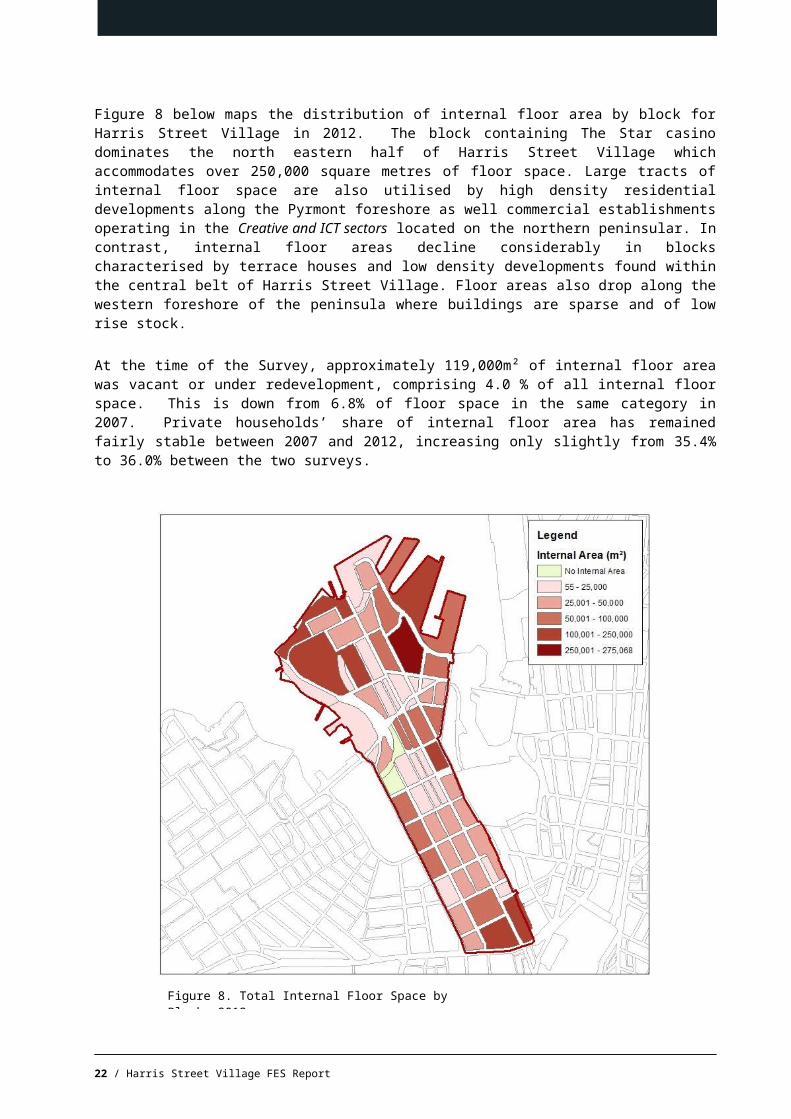
Figure 8 below maps the distribution of internal floor area by block for Harris Street Village in 2012. The block containing The Star casino dominates the north eastern half of Harris Street Village which accommodates over 250,000 square metres of floor space. Large tracts of internal floor space are also utilised by high density residential developments along the Pyrmont foreshore as well commercial establishments operating in the Creative and ICT sectors located on the northern peninsular. In contrast, internal floor areas decline considerably in blocks characterised by terrace houses and low density developments found within the central belt of Harris Street Village. Floor areas also drop along the western foreshore of the peninsula where buildings are sparse and of low rise stock.
At the time of the Survey, approximately 119,000m² of internal floor area was vacant or under redevelopment, comprising 4.0 % of all internal floor space. This is down from 6.8% of floor space in the same category in 2007. Private households’ share of internal floor area has remained fairly stable between 2007 and 2012, increasing only slightly from 35.4% to 36.0% between the two surveys.
18 / Harris Street Village FES Report
Figure 8. Total Internal Floor Space by Block, 2012

Space Use
The City of Sydney Floor Space and Employment Survey collects data in three levels, from individual ‘Space Units’ (space uses), which belong to ‘Establishments’, which are located in ‘Buildings’. The FES data classifies all floor area within the LGA according to the way in which the space is used. Each space use is assigned a code, which is categorised according to fourteen different space use divisions. Space use codes are also used to record employment, seating capacities, dwelling and room numbers and parking spaces. These space uses can then be related to the industry use of each establishment, and the location of each building. For Harris Street Village, there were 43,337 internal and 10,736 external individual space units recorded in 2012. This represents a 30% increase in the number of records collected compared to the 2007 Survey.
Table 7 following indicates the internal floor area by Space Use Division within Harris Street Village in 2007 and 2012. The predominant space type in Harris Street Village is dedicated to Residential use, increasing from 27.7% in 2007 to 28.0% in 2012. Residential use also had the largest increase to internal floor space, growing by 75,853 square metres in five years. The amount of space allocated to parking also increased by 11.7%, representing 18.9% of all space in the Village and mainly driven by the growth of Residential space. Office space use increased by 37,693 square metres or 7.2% over the same period.
When looking at specific space use types, Industrial use had the greatest loss of space between 2007 and 2012, with 2,023 square metres lost. At the same time, the amount of employment in Industrial space use actually increased over the same period from 599 to 783 workers.
Table 8 following shows the total employment by Space Use Division for Harris Street Village in both 2007 and 2012. Those Space Uses with no employment (or minor employment) have been aggregated into the Other category. The majority of employment in Harris Street Village is located in Office space uses, comprising 74.3% of all employment. The Entertainment/Leisure Space Use Division holds the second highest number of workers with 3,139 or 10.8% of the total employment. Employment across all space use divisions in the area have increased or remained stable with the exception of Storage which lost 22 workers.
The FES collects a number of capacity measures that are related to different types of space uses. The capacities are recorded for each individual space record. Table 9 following shows the capacity of restaurant seating, café seating, and meeting room / boardroom seating aggregated across the Village for 2007 and 2012.
In the five year period from 2007 to 2012, there was a 29.8% increase in the number of restaurant seats, rising by approximately 1,500 seats. The number of seats in cafés located in Harris Street Village also increased by 70.8%, representing an additional 578 seats since 2007. Between the Surveys in 2007 and 2012, the net number of restaurants rose from 29 to 62, whilst the net number of cafes grew from 34 to 57. Seats in meeting / board rooms grew by 2,531 seats however this is coupled by a relatively large expansion of office space compared to other spaces uses in the area.
19 / Harris Street Village FES Report

20 / Harris Street Village FES Report
Table 7. Internal Floor Area by Space Use Division, Harris Street Village, 2007-2012
Space Use Division 2007m²
% Floor Area 2007
2012m²
% Floor Area 2012
Change 2007-2012
% Change 2007-2012
Office 526,462 19.4% 564,155 19.1% 37,693 7.2%Shop/Showroom 38,231 1.4% 43,786 1.5% 5,555 14.5%Residential 750,985 27.7% 826,839 28.0% 75,853 10.1%Storage 120,686 4.4% 128,683 4.4% 7,997 6.6%Industrial 52,217 1.9% 50,195 1.7% -2,023 -3.9%Visitor Accommodation 79,715 2.9% 91,238 3.1% 11,524 14.5%Entertainment/Leisure 65,630 2.4% 91,224 3.1% 25,594 39.0%Restaurant/Eating 30,941 1.1% 47,066 1.6% 16,125 52.1%Community 62,731 2.3% 65,021 2.2% 2,289 3.6%Utilities 33,725 1.2% 47,005 1.6% 13,280 39.4%Parking 500,037 18.4% 558,548 18.9% 58,511 11.7%Transport 9,817 0.4% 10,661 0.4% 843 8.6%Common Area 339,259 12.5% 346,053 11.7% 6,795 2.0%Other 104,257 3.8% 85,627 2.9% -18,630 -17.9%Total 2,714,693 100.0% 2,956,100 100.0% 241,407 8.9%

Table 8. Employment Mix by Space Use Division, Harris Street Village, 2007-2012
Space Use Division 2007 % Employment 2007 2012 % Employment
2012Change
2007-2012% Change 2007-2012
Office 15,650 78.8% 21,554 74.3% 5,904 37.7%Shop/Showroom 417 2.1% 856 3.0% 439 105.3%Storage 257 1.3% 235 0.8% -22 -8.6%Industrial 599 3.0% 783 2.7% 184 30.7%Entertainment/Leisure 2,237 11.3% 3,139 10.8% 902 40.3%Restaurant/Eating 608 3.1% 2,040 7.0% 1,432 235.5%Community 72 0.4% 260 0.9% 188 261.1%Utilities 10 0.1% 21 0.1% 11 110.0%Transport 0 0.0% 29 0.1% 29 NAOther 19 0.1% 93 0.3% 74 389.5%Total 19,869 100.0% 29,010 100.0% 9,141 46.0%
Table 9. Selected Capacity Measures, Harris Street Village, 2007-2012
Capacity Measure 2007 2012 Change 2007-2012
% Change 2007-2012
Restaurant Seating 4,962 6,439 1,477 29.8%Cafe/Coffee Lounge Seating 816 1,394 578 70.8%Meeting Room/Board Room Seating 5,786 8,317 2,531 43.7%
21 / Harris Street Village FES Report
Work Space Ratios
Work Space Ratios (WSR) are an indication of the average number of square metres within which employees work for a particular industry. The ratio is determined by dividing the internal floor area (in square metres) of a categorised space grouping by the total number of employees recorded for that grouping. Ratios can be determined using the Industry Divisions, Space Use Divisions, Office space uses and Occupied Office space uses, where the floor area is divided by total employees. The ratios for each category can be used for projecting the anticipated population of new developments, and to determine how space uses are managed over time.
Table 10 following shows the industry-wide WSRs for Harris Street Village in 2007 and 2012. In any given industry division, where the WSR for 2012 is less than that of 2007, there has been an intensification of employment to space use for that industry. This means that a percentage of the growth of employment of any given area or industry may come from more intensive use of space, rather than solely from the take-up of new development space.
Overall, the average WSR for the Village fell from 59.1 in 2007 to 42.8 in 2012. By comparison, the overall WSR for the LGA was 41.5 in 2007 and 37.9 in 2012. The most intensive use of work space occurs in the Food and Drink sector, with 21.5m² for every worker. Space use in the Food and Drink sector also intensified significantly, with each worker losing, on average, 19.1m², since the 2007 Survey. When looking at major employers (employment>1,000) by sector, space use intensification over time has occurred most notably in the ICT sector, with WSR’s falling from 65.6 down to 28.0. The industries with the lower WSRs tend to have higher concentrations of office spaces, of in the case of the Health Division, doctor’s surgeries or waiting rooms. Those industries with higher WSRs tend to have very large areas with little or no employment, such as showrooms (Motor Vehicle), public spaces (Community) or areas dedicated to Utilities. In the case of Harris Street Village, the Utilities sector had the highest WSR with 680m² but again this sector is characterised by having large areas dedicated to infrastructure with relatively small employment numbers. The average WSR across all industry sectors for Harris Street Village was 18m² greater than the LGA average in 2007 (59.1 compared to 41.5), falling dramatically to only 4.9m² greater than the LGA average in 2012 (42.8 compared to 37.9).
The following table (Table 11) shows the WSRs for the nine main employment generating space use divisions. Space Use Divisions with minor employment levels have not been included; hence the totals for the table do not match the corresponding Village totals (for floor space and employment in Tables 7 and 8). As noted in other village areas, Restaurant/Eating Space Use Division had the lowest WSR (23.1) in Harris Street Village, closely followed by the Office division (26.2) and Entertainment/Leisure (29.1). WSRs have fallen across all space uses except Storage, this can be attributed to a combination of factors such as: a decline in employment for the Storage (Space Use Division) coupled with the growth of storage in commercial developments (e.g. office storage) and increases in ancillary storage uses in industry sectors such as Transport and Logistics.
In general, the Office Space Use Division is the most intensive of the space uses, and is usually a good indicator of future employment projections for a known quantum of floor space. The two main types of Office space defined are partitioned offices (predominantly walled offices with single occupants) and open plan offices (with workstations and multiple workers). In Harris Street Village, the average WSR for partitioned and open plan office spaces is 12.7 square metres per worker (Table 12). Differences between partitioned and open place WSR’s have narrowed over the 5 years, with the former offering only 1.3 square metres of extra space in 2012. It is important to note here that the WSR for Office space is higher (26.2 square metres) because it includes other spaces such as meeting rooms, reception areas, photocopy areas and breakout spaces in the calculations.
The 2012 Survey also collected the capacity of partitioned and open-plan offices and vacant office space to determine the maximum intensity of uses for these two office types. If all Office space was fully occupied at the current average work space ratio, there could be an additional 6,474 workers in Harris Street Village (Table 13).
22 / Harris Street Village FES Report

Table 10. Work Space Ratios by City-Based Industry Division, Harris Street Village, 2007-20122007 2012
City Based Industry Sector Internal Area Employment WSR Internal
Area Employment WSR
Community 7,173 47 152.6 7,612 134 56.8Creative Industries 209,495 5,216 40.2 207,581 6,303 32.9Finance and Financial Services 41,374 1,576 26.3 25,775 846 30.5Food and Drink 51,589 1,271 40.6 52,553 2,441 21.5Government 7,319 81 90.4 7,319 81 90.4Health 4,666 110 42.4 4,289 166 25.8Higher Education and Research 288,978 4,162 69.4 286,115 5,253 54.5ICT 78,408 1,196 65.6 118,240 4,219 28.0Life Science (Bio-tech) 3,296 111 29.7 10,058 271 37.1Manufacturing 6,677 100 66.8 6,191 156 39.7Motor Vehicle 332 8 41.4 1,152 12 96.0Natural Resource-Based Industries 201 7 28.8 0 0 NAProfessional and Business Services 47,559 1,522 31.2 70,348 2,800 25.1Property Development and Operation 13,763 312 44.1 16,718 527 31.7Retail and Personal Services 18,642 287 65.0 16,454 453 36.3Social Capital 5,067 88 57.6 7,489 301 24.9Tourist, Cultural and Leisure 308,377 3,312 93.1 317,633 4,534 70.1Transport and Logistics 62,681 445 140.9 67,360 474 142.1Utilities 18,172 16 1,135.7 18,361 27 680.0Total 1,173,767 19,867 59.1 1,241,247 28,998 42.8
Table 11. Work Space Ratios by Space Use Division, Harris Street Village, 2007-2012
23 / Harris Street Village FES Report

2007 2012
Space Use Division Internal Area Employment WSR Internal Area Employment WSR
Office 526,462 15,650 33.6 564,155 21,554 26.2Shop/Showroom 38,231 417 91.7 43,786 856 51.2Storage 120,686 257 469.6 128,683 235 547.6Industrial 52,217 599 87.2 50,195 783 64.1Entertainment/Leisure 65,630 2,237 29.3 91,224 3,139 29.1Restaurant/Eating 30,941 608 50.9 47,066 2,040 23.1Community 62,731 72 871.3 65,021 260 250.1Utilities 33,725 10 3,372.5 47,005 21 2,238.3Transport 9,817 0 NA 10,661 29 367.6Total 940,440 19,850 47.4 1,047,794 28,917 36.2
Table 12. Work Space Ratios by Office Space Use, Harris Street Village, 2007-20122007 2012
Office Type Internal Area Employment WSR Internal
Area Employment WSR
Partitioned Office 65,781 4,198 15.7 66,168 4,839 13.7Open Plan Office 201,400 10,753 18.7 196,185 15,835 12.4Total 267,182 14,951 17.9 262,353 20,674 12.7
24 / Harris Street Village FES Report

Table 13. Potential Maximum Capacity Work Space Ratios by Office Space Use, Harris Street Village, 2012
2012
Office Type Internal Area Employment Capacity WSR
Partitioned Office 66,168 5,128 12.9Open Plan Office 196,185 19,709 10.0Vacant Office 56,759 2,311 24.6Total 319,112 27,148 11.8
Occupied Office Employment (Actual) 20,674Additional Office Employment Capacity 6,474
Conclusion
Harris Street Village has strengthened its position as a key economic hub, experiencing substantial growth in workforce numbers, residential population and floor space. Local employment in the area increased by 9,141 or 46%, from 19,869 in 2007 to 29,010 in 2012.
The ICT sector experienced the highest growth rate in workforce of 252.8%, accounting for over 3,000 new jobs.
The top three sectors in the Harris Street Village retained their positions from 2007 to 2012 with the Creative Industries, Higher Education and Research and Tourist, Cultural and Leisure sectors continuing to employ over half the workforce.
Whilst employment growth occurred across most sectors, Finance and Financial Services experienced a significant contraction in workforce size despite a reasonable growth in businesses. A distinct spatial distribution of economic activity is apparent in Harris Street Village with the location of businesses in the Creative Industries heavily clustered in the north eastern and north western areas of the Village. Higher Education and Research, on the other hand, is concentrated in the southern pocket whilst Food and Drink establishments are relatively dispersed along Harris Street itself.
Business activity in terms of firm numbers has become less diverse in Harris Street Village, with the top three sectors; Food and Drink, Creative Industries and Professional and Business Services increasing their combined business share to represent over half of all establishments in the area.
The decline in WSRs has occurred across most industries in Harris Street Village. When looking at the larger industry sectors employing over 1,000 workers, the ICT sector experienced the largest intensification of average floor area dedicated to each worker.
The predominant space use type in Harris Street Village continued to be residential use and also contributed to the largest increase to overall internal floor space in the area. It is expected that growth in the Residential sector will slow down in the short term, given the large bulk of the dwelling growth in the last five years stemmed from high density development along the northern foreshore of Pyrmont which is now close to capacity.
25 / Harris Street Village FES Report