work life balance survey of the hong kong working
TRANSCRIPT

THE UNIVERSITY OF HONG KONG PUBLIC OPINION PROGRAMME
Work Life Balance Survey of the Hong Kong Working Population 2009
FFiinnaall RReeppoorrtt
Jointly compiled by
CHUNG Ting-Yiu Robert, PANG Ka-Lai Karie
and TONG Yuk-Wa Joseph
31 August 2009
Copyright of this report is held jointly by Community Business Limited and the Public Opinion Programme (POP) at the University of Hong Kong. Everything in this publication is the work of individual researchers, and does not
represent the stand of the University of Hong Kong. Dr Robert Chung is fully responsible for the work of the POP.

Public Opinion Programme, HKU Work Life Balance Survey 2009
Page 1
Contents I. Preamble 2II. Research Design 3III. Research Findings 5
Respondents’ Work and Living Patterns 5Problems Facing Work-Life Balance and Desired Solutions 8
IV. Concluding Remarks 14 Appendices 1. Calculation of Response Rate and Detailed Breakdown of Contact Information 2. Frequency Tables 3. Demographics of the Respondents 4. In-depth Analysis: Cross-tabulations for 2009 findings 5. In-depth Analysis: Cross-tabulation on yearly comparison 6. Questionnaire (Bilingual) 7. Definition of Occupation Categories

Public Opinion Programme, HKU Work Life Balance Survey 2009
Page 2
I. Preamble 1.1 The Public Opinion Programme (POP) was established in June 1991 to collect and study
public opinion on topics which could be of interest to academics, journalists, policy-makers, and the general public. POP was at first under the Social Sciences Research Centre, a unit under the Faculty of Social Sciences of the University of Hong Kong, it was transferred to the Journalism and Media Studies Centre in the University of Hong Kong in May 2000. In January 2002, it was transferred back to the Faculty of Social Sciences in the University of Hong Kong. Since its establishment, POP has been providing quality survey services to a wide range of public and private organizations, on condition that they allow the POP Team to design and conduct the research independently, and to bear the final responsibilities. POP also insists that the data collected should be open for public consumption in the long run.
1.2 In March 2006, the Community Business Limited commissioned POP to conduct a public
opinion poll entitled “Work Life Balance Survey of the Hong Kong Working Population 2006”. The primary objective of the survey was to gauge the current status of Hong Kong people’s work and personal life, their satisfaction of work-life balance as well as their expectation of a balanced life. The survey was repeated in July 2007 and 2008 to track changes in the local working population over time. In June 2009, the Community Business Limited again commissioned POP, for the fourth time, to conduct this “Work Life Balance Survey” to serve exactly the same purpose.
1.3 The research instrument used in this study was designed entirely by the POP Team after
consulting Community Business Limited, and the majority of questions were repeated from the last survey for direct comparison. Fieldwork operations and data analysis were also conducted independently by the POP Team, without interference from any outside party. In other words, POP was given full autonomy to design and conduct the survey, and POP would take full responsibility for all the findings reported herewith.

Public Opinion Programme, HKU Work Life Balance Survey 2009
Page 3
II. Research Design 2.1 This was a random telephone survey conducted by telephone interviewers under close
supervision. To minimize sampling bias, telephone numbers were first drawn randomly from the residential telephone directories as “seed numbers”, from which another set of numbers was generated using the “plus/minus one/two” method, in order to capture the unlisted numbers. Duplicated numbers were then filtered, and the remaining numbers were mixed in random order to produce the final telephone sample.
2.2 The target population of this survey was full time workers of age 15 or above who speak
Cantonese, English or Mandarin, and “full time workers” is defined as those who work at least 5 days a week, or total working time not less than 40 hours a week. When telephone contact was successfully established with a target household, one person of age 15 or above currently working full time was selected. If more than one subject had been available, selection was made using the “next birthday rule” which selected the person who had his/her birthday next.
2.3 Telephone interviews were conducted during the period of 20-31 July, 2009. A total of
1,013 full time workers of age 15 or above were successfully interviewed. The proportion between white collars and blue collars in this sample was around 70:30 (688 and 305 cases respectively), which was a natural distribution. Had the number of white collar subjects fallen significantly below the expected level, i.e. at least 60%, a booster sampling method would have been used at the final stage of the fieldwork to achieve a minimum quota of 600 cases. This standby procedure was not triggered. As shown from the calculation in Appendix 1, the overall effective response rate of this survey was 68.2% (Table 1), and the standard sampling error for percentages based on this sample was less than 1.6 percentage points. In other words, the sampling error for all percentages using the total sample was less than plus/minus 3.1 percentage points at 95% confidence level.
2.4 As shown in Table 2 of Appendix 1, among the 24,376 telephone numbers sampled for the
survey, 10,444 were confirmed to be ineligible, among them 1,180 were fax or data lines, 7,283 were invalid telephone numbers, 118 were call-forwarding numbers, while another 931 were non-residential numbers. Besides, 76 of them were invalidated due to special technological reasons, while 856 cases were voided because target respondents were unavailable at the numbers provided.

Public Opinion Programme, HKU Work Life Balance Survey 2009
Page 4
2.5 Meanwhile, a total of 5,846 telephone numbers were invalidated before the research team
could confirm their eligibility. Among them 397 were busy lines and 4,019 were no-answer calls after making a maximum of 5 times' recalls. 98 cases were diverted to answering devices while another 156 were blocked. Moreover, 417 cases were treated as unsuccessful because of language problems, while 695 interviews were terminated before the screening question and 64 cases were voided for other problems.
2.6 On the other hand, 7,073 cases failed to complete the interview. Among them 27 were
rejected at the household level, another 20 rejected the interview immediately after their eligibility was confirmed, 6,850 were unfinished cases with appointment dates beyond the end of fieldwork period. Besides, 35 cases were incomplete due to unexpected termination of interviews, 141 were classified as miscellaneous due to other non-contact problems, and the remaining 1,013 were successful cases (Table 2).
2.7 Statistical tests of “difference-of-proportions” and “difference-of-means” have been applied
whenever applicable, in order to check for significant differences between groups. Figures marked with double asterisks (**) indicated that the variation has been tested to be statistically significant at p<0.01 level, whereas those with single asterisk (*) denoted statistical significance at p<0.05 level.
2.8 Descriptions of findings marked with a spike (^) are subject to a very small sub-sample size
(<30). It should be noted that the smaller the sample size, the larger the sampling error. Hence, such findings should be treated as rough reference only.

Public Opinion Programme, HKU Work Life Balance Survey 2009
Page 5
III. Research Findings
The questionnaire comprised two major topics, namely, “respondents’ work and living patterns” and “problems of work-life balance and desired solutions”, ended by mapping some standard demographics of the respondents. The key findings are summarized below under these two main topics. All frequency tables referred to in this section can be found in Appendix 2.
(A) Respondents’ Work and Living Patterns 3.1 In order to understand respondents’ current working status, the survey began by asking
their actual working hours per week in the month past. Results showed that the majority of 51% said they worked for “41-50 hours” in a week while a respective of 22% and 18% said “31-40 hours” and “51-60 hours”. Only the change for the answer “31-40 hours” (from 2008’s 18% to 2009’s 22%) is proved to be statistically significant, p<0.05. Of 990 respondents who gave a definite answer to this question, the mean actual working time obtained was 48.4 hours per week. Since the survey started in 2006, this figure has shown a downward trend and dropped for 3 consecutive times, though only the difference between 2007 and 2006 is statistically significant (Table 3 and Figure 1).
Figure 1. Actual working hours per week
5.3%
1.0%
53.9%
2.0%
2.4%
22.1%
3.9%
2.4%
3.0%
5.1%
25.3%
49.5%
8.8%
2.1%
2.4%
5.2%
21.5%
48.2%
12.6%
3.9%
1.2%
1.0%
2.8%
3.7%
17.9%
17.6%
1.5%
1.1%
3.5%
17.6%
50.8%
1.0%
0% 10% 20% 30% 40% 50% 60%
Don't know/forgot/hard tosay
>80 hours
71 – 80 hours
61 – 70 hours
51 – 60 hours
41 – 50 hours
31 – 40 hours
<=30 hours
Percentage
2009
2008
2007
2006
2009 base: 1,005 2008 base: 1,006 2007 base: 1,007 2006 base: 1,512
Mean (2009): 48.4 hrs/week
Hou
rs

Public Opinion Programme, HKU Work Life Balance Survey 2009
Page 6
3.2 When it comes to the amount of time spent on their personal or private activities, such as
meeting friends and engaging in activities for leisure like sports and traveling, the results have remained very stable. In 2009, a total of 36% claimed that they spent “less than 1 hour a day” on these personal events, while 27% could afford “1-2 hours a day” and 13% could spare “>2-3 hours a day”. On average, each respondent spent 11.2 hours a week (or 1.6 hours a day) on their personal and re-energizing activities. No significant difference is located when compared to 2008. Judging from these figures, personal time and leisure activities still remain a luxury to most full time workers in Hong Kong (Table 4 and Figure 2).
3.3 Regardless of their current status, the survey continued to ask the respondents what would
be their preferred but realistic ratio between the time they wanted to spend on working and on private activities. This year’s results found that, despite changes in their relative rankings, the three most popular work-life ratios remained to be “70-75% to 25-30%” (also 1st in 2008), “50-55% to 45-50%” (3rd in 2008) and “60-65% to 35-40%” (2nd in 2008). Their respective percentages were 27%, 24% and 23% (Table 5 and Figure 3). In terms of the average ratio as provided by 950 workers, the ideal distribution between work and life remained as 62:38 (Table 6). When compared with the actual ratio which was 83:17
Figure 2. Time spent on private activities per day
0.5%
6.8%
1.9%
1.9%
1.7%
2.2%
4.6%
10.4%
25.4%
34.2%
10.9%
1.1%
6.3%
2.3%
2.7%
2.8%
4.9%
9.8%
27.2%
34.5%
8.5%
1.5%
4.8%
2.1%
3.2%
3.4%
12.1%
27.7%
34.8%
10.0%
4.5%
1.7%
0.8%
1.9%
4.3%
3.5%
12.9%
27.3%
35.5%
7.8%
0% 5% 10% 15% 20% 25% 30% 35% 40%
Don't know/forgot/Hard to say
>7 hours per day
>6 - 7 hours per day
>5 - 6 hours per day
>4 - 5 hours per day
>3 - 4 hours per day
>2 - 3 hours per day
1 - 2 hours per day
Less than 1 hour per day
No private activities at all
Percentage
2009
2008
2007
2006
Mean (2009): 11.2 hrs/week
1.6 hrs/day
Hou
rs

Public Opinion Programme, HKU Work Life Balance Survey 2009
Page 7
(calculated by dividing the actual working hours reported in Q1 by their leisure hours in Q2), a remarkable discrepancy continued to exist and no significant improvement was observed in this regard ever since the start of this survey in 2006 (Table 7 and Figure 4).
Figure 3. Preferred realistic work-life ratio
1.3%
24.2%
27.9%
5.2%
0.1%
1.4%
5.8%
0.1%
1.7%
8.9%
27.2%
25.5%
24.4%
3.6%
2.7%
0.2%
5.5%
0.2%
9.1%
23.9%
2.2%
0.4%
6.7%
0.1%
1.4%
10.4%
27.4%
24.9%
24.4%
3.0%
0.1%
0.3%
5.9%
1.3%
11.1%
27.4%
23.1%
24.2%
4.1%
2.3%
0.7%
0% 5% 10% 15% 20% 25% 30%
Don't Know
100% : 0%
90%-95% : 5%-10%
80%-85% : 15%-20%
70%-75% : 25%-30%
60%-65% : 35%-40%
50%-55% : 45%-50%
40%-45% : 55%-60%
30%-35% : 65%-70%
20%-25% : 75%-80%
10%-15% : 85%-90%
Percentage
2009
2008
2007
2006
Figure 4. Average actual work-life ratio
15.8%
17.4%
15.9%
16.8%
84.2%
82.6%
84.1%
83.2%
0% 20% 40% 60% 80% 100%
2006
2007
2008
2009
Percentage
Percentage onpersonal activities
Percentage onwork
2009 base: 1,010 2008 base: 1,010 2007 base: 1,007 2006 base: 1,511
Mean (2009): 62% vs 38%
2009 base: 948 2008 base: 947 2007 base: 897 2006 base: 1,363
Year
Public Opinion Programme, HKU Work Life Balance Survey 2009
Page 8
(B) Problems Facing Work-Life Balance and Desired Solutions
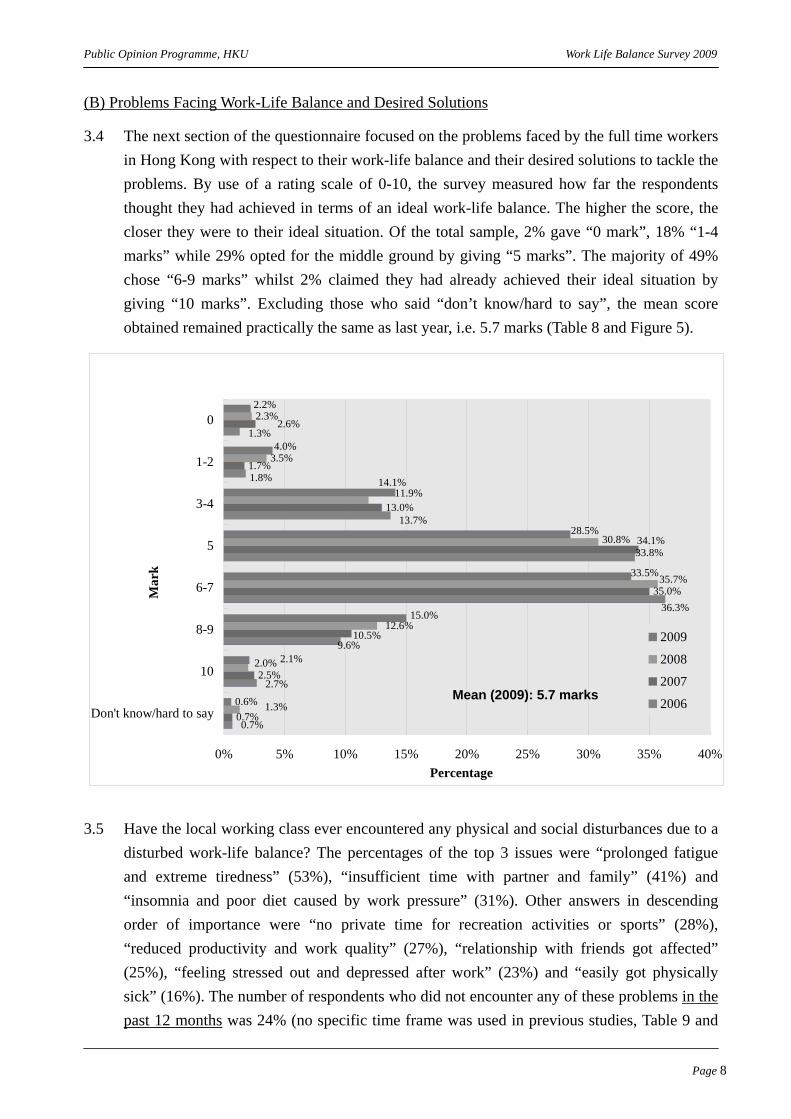
3.4 The next section of the questionnaire focused on the problems faced by the full time workers in Hong Kong with respect to their work-life balance and their desired solutions to tackle the problems. By use of a rating scale of 0-10, the survey measured how far the respondents thought they had achieved in terms of an ideal work-life balance. The higher the score, the closer they were to their ideal situation. Of the total sample, 2% gave “0 mark”, 18% “1-4 marks” while 29% opted for the middle ground by giving “5 marks”. The majority of 49% chose “6-9 marks” whilst 2% claimed they had already achieved their ideal situation by giving “10 marks”. Excluding those who said “don’t know/hard to say”, the mean score obtained remained practically the same as last year, i.e. 5.7 marks (Table 8 and Figure 5).
3.5 Have the local working class ever encountered any physical and social disturbances due to a
disturbed work-life balance? The percentages of the top 3 issues were “prolonged fatigue and extreme tiredness” (53%), “insufficient time with partner and family” (41%) and “insomnia and poor diet caused by work pressure” (31%). Other answers in descending order of importance were “no private time for recreation activities or sports” (28%), “reduced productivity and work quality” (27%), “relationship with friends got affected” (25%), “feeling stressed out and depressed after work” (23%) and “easily got physically sick” (16%). The number of respondents who did not encounter any of these problems in the past 12 months was 24% (no specific time frame was used in previous studies, Table 9 and
0.7%
2.5%
35.0%
13.0%
1.7%3.5%
2.3%
0.6%
0.7%
2.7%
9.6%
36.3%
33.8%
13.7%
1.8%
1.3%
10.5%
34.1%
2.6%
1.3%
2.0%
12.6%
35.7%
30.8%
11.9%
2.1%
15.0%
33.5%
28.5%
14.1%
4.0%
2.2%
0% 5% 10% 15% 20% 25% 30% 35% 40%
Don't know/hard to say
10
8-9
6-7
5
3-4
1-2
0
Percentage
2009
2008
2007
2006
Mar
k
Mean (2009): 5.7 marks

Public Opinion Programme, HKU Work Life Balance Survey 2009
Page 9
Figure 6). As there have been changes in both the question wordings and some answer options, no statistical test has been applied to this question.
Note: Figures for 2009 cannot be directly compared to the rest due to changes in the wording of the question and some answer options.
3.6 In this year’s WLB survey, “financial well-being/ wealth management” (14%) has replaced “long working hours” (12%) to become the number one work life balance challenge. “Long working hours” shared the 2nd place with a newly added item “increased workload due to company downsizing” (12%) while “leader’s attitude” (11%) followed closely behind. Meanwhile, relatively fewer respondents mentioned “job security” (8%), “not enough time for exercise and taking courses” (7%), “peer pressure and competition among colleagues” (6%), “lack of flexibility in working hours” (5%) and “taking care of children or family members” (5%) with corresponding percentages ranging from 5% to 8% (Table 10 and Figure 7). As one option was newly introduced while respondents were only allowed to choose one single response from the answers provided, no statistical test has been applied to this question.
Figure 6. Problems resulting from poor work-life balance
32.8%
33.1%
62.3%
0.3%
31.0%
40.8%
0.2%
15.1%
30.6%
28.8%
28.4%
33.4%
28.2%
41.3%
39.1%
61.0%
0.1%
13.6%
33.2%
29.9%
31.1%
35.6%
41.4%
43.7%
60.5%
14.2%
30.4%
28.4%
34.4%
37.7%
41.6%
49.3%
23.6%
15.7%
22.8%
24.6%
26.9%
27.5%
53.4%
0% 10% 20% 30% 40% 50% 60% 70%
Don't know/hard to say
None of the above
I get physically sick easily / I need to take more sick leave
I feel stressed out, depressed and exhausted after work.
My work has affected my relationship with my friends.
Productivity and work quality has reduced dramatically due tolong working hours.
I do not have any private time for recreation activities or sportsat all.
I have insomnia and poor diet as a result of work pressures
I don't have time staying with my partner and family.
Prolonged fatigue level, sleepiness and extreme tiredness.
Percentage
2009
2008
2007
2006
Prob
lem
s

Public Opinion Programme, HKU Work Life Balance Survey 2009
Page 10
Note: Since a new answer was introduced in 2009, direct comparison with figures in previous years may not be appropriate.
3.7 Consistent with the previous years’ findings, to achieve a better work-life balance, the 2
most desired arrangements continued to be “5-day work week” (27%) and “more paid annual leave” (19%). “Flexible working hours” (11%) came third, closely followed by “option to work from home sometimes” (9%) and “career breaks/unpaid leave” (9%). Other well-liked facilities or arrangements were “job share” (6%), “free sports facilities” (5%) and “work support services” (5%, Table 11 and Figure 8).
0.9%
8.6%
0.6%
2.0%
5.5%
10.5%
7.0%
6.4%
9.0%
11.7%
8.0%
16.0%
13.8%
1.2%
4.9%
0.6%
4.1%
6.2%
9.3%
5.8%
8.6%
7.9%
8.8%
8.7%
15.3%
18.6%
2.1%
8.0%
0.5%
3.5%
4.1%
5.1%
6.7%
7.8%
7.9%
8.6%
13.3%
17.5%
14.9%
0.5%
11.4%
0.7%
2.7%
3.8%
5.2%
5.4%
5.8%
7.2%
8.4%
11.4%
11.5%
12.1%
13.8%
0% 5% 10% 15% 20%
Don't know/ Hard to say
I do not find work balance is a challenge to me
Others (Please specify)
Work location
Personnel changes
Taking care of children or family members
Lack of flexibil ity in working hours
Peer pressure and competition among colleagues
Not enough time for exercise and taking courses
Job security
Leader's attitude
Increased workload due to company downsizing
Long working hours
Financial well-being/ Wealth management
Percentage
Figure 7. Obstacles to attaining work-life balance
2009
2008
2007
2006
2009 base: 1,0132008 base: 1,0112007 base: 1,0132006 base: 1,519
Cha
lleng
es

Public Opinion Programme, HKU Work Life Balance Survey 2009
Page 11
3.8 By means of a 0-10 rating scale again, the survey attempted to measure the efforts and
resources paid by respondents’ workplace/boss to promote work-life balance, with 0 representing no effort being made, 10 all possible efforts made and 5 being half-half. The ratings obtained have remained very stable since 2006. Specifically, 11% of the working class interviewed gave “0 mark” to their workplace/boss while 24% chose “1-4 marks”. Another 31% opted for a mid-point of “5 marks” and 30% appraised their workplace/boss positively by giving “6-9 marks”. Those who gave a full mark (10 marks) accounted for 2% only. Overall speaking, of the 983 valid raters, the mean score obtained by the workplace/boss was 4.7 marks, which fluctuated slightly within sampling errors over the past 3 years (Table 12 and Figure 9).
Figure 8. Desired Arrangements/Facilities To Achieve Better Work-life Balance
2.0%
5.9%
14.1%
0.9%
2.1%
1.6%
9.5%
0.6%
1.5%
2.5%
3.2%
8.9%
32.4%
11.2%
6.1%
3.8%
2.1%
22.4%
4.1%
3.1%
0.6%
6.1%
6.8%
8.0%
12.2%
18.3%
26.8%
5.3%
1.6%
2.0%
4.6%
6.3%
9.9%
9.2%
9.7%
19.7%
27.2%
1.8%
1.4%
0.8%
2.0%
4.5%
5.2%
6.3%
9.4%
10.8%
18.8%
26.9%
0% 5% 10% 15% 20% 25% 30% 35%
Don't know/Hard to say
Others (Please specify)
Longer maternity leave
Creche facilities/Child care
Parental leave
Work support services
Free sports facilities
Job-share
Career breaks/Unpaid leave
Option to work from home sometimes
Flexible working time
More paid annual leave
5-day work week
Percentage
2009
2008
2007
2006
Des
ired
Arr
ange
men
ts/F
acili
ties
2009 base: 1,011 2008 base: 1,009 2007 base: 1,006 2006 base: 1,515

Public Opinion Programme, HKU Work Life Balance Survey 2009
Page 12
3.9 A new question was added to ask all respondents if they thought it important for their
workplace/boss to pay effort to addressing the work-life balance issue. Findings indicated that over two-thirds (68%) considered it “important”, 19% opted for the middle ground by saying “neutral” while those who chose “not important” accounted for 12% of the total sample (Table 13 and Figure 10).
Figure 10. Importance of addressing the issue of WLB by theirworkplace/boss
Important67.8%
Neutral18.5%
Not important11.5%
Don't know/ Hard tosay
2.3%
Base: 1,011
Figure 9. Efforts and resources spent on work-life balance
5.0%
8.3%
16.8%
6.7%
4.2%
3.3%
8.8%
20.4%
27.2%
18.3%
6.6%
11.2%
2.3%
24.5%
26.3%
10.1%
3.4%
0.9%
8.4%
23.4%
28.9%
17.1%
7.2%
10.7%
2.8%
2.0%
8.3%
21.7%
30.5%
18.2%
6.1%
10.5%
0% 5% 10% 15% 20% 25% 30% 35%
Don't know/hard to say
10
8-9
6-7
5
3-4
1-2
0
Percentage
2009
2008
2007
2006
Mean (2009): 4.7 marks
Mar
k

Public Opinion Programme, HKU Work Life Balance Survey 2009
Page 13
3.10 Finally, the survey ended by asking all respondents if they would consider leaving their current job to achieve a better work-life balance. This year, 30% of the total sample gave an affirmative answer and said they would consider about it whereas the opposite sentiment, i.e. not leaving current job, has increased slightly from 67% to 68% this time (Table 14 and Figure 11).
Figure 11. Respondents' consideration if they would leave their currentjob for better WLB
0.9%
66.5%
32.6%
1.7%
68.2%
30.1%
0% 10% 20% 30% 40% 50% 60% 70% 80%
Don't know/Hard tosay
No
Yes
Percentage
2009
2008
2009 base: 1,013 2008 base: 1,010
Res
pons
e

Public Opinion Programme, HKU Work Life Balance Survey 2009
Page 14
IV. Concluding Remarks 4.1 This is the fourth consecutive year that we studied the work-life balance of Hong Kong’s
working population by means of representative random sample surveys comparable to international standards. In our first benchmark survey conducted in 2006, our sample size was controlled at 1,500+ successful cases. Thereafter it was controlled at 1,000+ successful cases. Sampling errors for percentage figures based on the full sample were therefore controlled to not more than plus/minus 3.1 percentage points at 95% confidence level.
4.2 Our latest survey of 2009 was conducted at a time of global economic recession, Hong Kong
included, and one might have expected significant changes in the work-life balance of the work force due to the recession. However, our latest findings have not depicted any such change, and we are tempted to conclude that work-life balance and economic development are separate issues. This may or may not be true, because the recession might have actually dampened the pace of work-life balance development, even if most statistics have remained more or less like those of last year.
4.3 For example, respondent’s preferred work-life ratios in 2006, 2007, 2008 and 2009 were
61:39, 60:40, 62:38 and 62:38 respectively, while their actual work-life ratio were 84:16, 83:17, 84:16 and 83:17 respectively. Both series of ratios seem to have remained rather stable. However, if we look at the difference between preferred versus actual ratio, taking “excessive work” as the indicator, then we can see that the figure has actually decreased across the years from 22.9% to 22.4% to 21.8% to 21.6%. The rate of change has slowed down this year, although variations are small. The more important finding, of course, is that there is still a big discrepancy between what is real and what is ideal, even though most respondents are fairly complacent with the current situation.
4.4 On a scale of 0-10, respondents on average gave themselves a score of 5.7 for their
achievement in work-life balance. They gave 4.7 to their employers’ effort to promote work-life balance. These ratings have remained very stable throughout the years, meaning that there is a continued need for employers to step up their effort in this aspect. Under the current economic conditions, over two-thirds of the respondents considered it important for their employers to address the issue of work-life balance.
4.5 To conclude, in the midst of economic recession, the work-life balance of Hong Kong’s work
force has not changed much. Respondents are on the whole quite complacent with the current situation, but there is still ample room for improvement, because a significant gap still exists between people’s preferred work time of 62% and their actual work time of 83%.

Public Opinion Programme, HKU Work Life Balance Survey 2009
Page 15
4.6 We have by now conducted four annual surveys, accumulating more than 4,500 successful
samples. Other than tracking respondents’ work-life balance over time, we now have much bigger database to compile benchmarks for different industries and demographic groups. This would probably become another focus for our future studies.

Public Opinion Programme, HKU Work Life Balance Survey 2009
Page 16
Appendix 1
Contact Information

Public Opinion Programme, HKU Work Life Balance Survey 2009
Page 17
Table 1 Calculation of effective response rate Effective response rate
Successful cases ______
= Successful cases + Partial interview + Refusal cases by eligible respondents* + Refusal cases by prorated-eligible respondents^ 1,013
= 1,013 + 35 + 47 + 695 [(1,013 + 35 + 47) / (1,013 + 35 + 47 + 856)]^
= 68.2%
* Including “household-level refusal” and “known respondent refusal” ^ Figure obtained by prorata Table 2 Breakdown of contact information of the survey Frequency Percentage
Respondents’ ineligibility confirmed 10,444 42.8%Fax/ data line 1,180 4.8%
Invalid number 7,283 29.9%
Call-forwarding/ mobile/ pager number 118 0.5%
Non-residential number 931 3.8%
Special technological difficulties 76 0.3% No eligible respondents 856 3.5%
Respondents’ ineligibility not confirmed 5,846 24.0%
Line busy 397 1.6%
No answer 4,019 16.5%
Answering device 98 0.4%
Call-blocking 156 0.6%
Language problem 417 1.7%
Interview terminated before the screening question 695 2.9% Others 64 0.3%
Respondents’ eligibility confirmed, but failed to complete the
interview 7,073 29.0%
Household-level refusal 27 0.1% Known respondent refusal 20 0.1%
Appointment date beyond the end of the fieldwork period 6,850 28.1%
Partial interview 35 0.1% Miscellaneous 141 0.6%
Successful cases 1,013 4.2%
Total 24,376 100.0%

Public Opinion Programme, HKU Work Life Balance Survey 2009
Page 18
Appendix 2 Frequency Tables

Public Opinion Programme, HKU Work Life Balance Survey 2009
Page 19
Note: Figures marked with double asterisks (**) in this section indicate that the variation has been tested to be statistically significant at p<0.01 level, whereas those with single asterisk (*) denote statistical significance at p<0.05 level.
A. Respondents’ Work and Living Patterns
Table 3 [Q1] Take the last month as an example, how many hours a week do you ACTUALLY work on average for your full time job? 2006 2007 2008 2009
% (Base=1,512) % (Base=1,007) % (Base=1,006) Frequency % (Base=1,005)
<=30 hours 2.1% 3.9%** 2.0%* 10 1.0% 31 – 40 hours 8.8% 12.6%** 17.6%** 222 22.1%* 41 – 50 hours 49.5% 48.2% 53.9%* 511 50.8% 51 – 60 hours 25.3% 21.5%* 17.9%* 177 17.6% 61 – 70 hours 5.1% 5.2% 3.7% 35 3.5% 71 – 80 hours 3.0% 2.4% 2.8% 24 2.4% >80 hours 2.4% 1.0%** 1.0% 11 1.1% Don’t know/ forgot/ Hard to say 3.9% 5.3% 1.2%** 15 1.5%
Total 100.0% 100.0% 100.0% 1,005 100.0%
Missing 7 7 5 8
Mean 51.3 hrs/week 49.2 hrs/week** 48.8 hrs/week 48.4 hrs/week Standard error 0.32 hr 0.36 hr 0.33 hr 0.30 hr
Base 1,453 954 994 990 * Statistically significant at p<0.05 level ** Statistically significant at p<0.01 level

Public Opinion Programme, HKU Work Life Balance Survey 2009
Page 20
Table 4 [Q2] Take the last month as an example, how many hours a week do you ACTUALLY spend on doing some personal or private activities, like meeting friends and engaging in activities for leisure such as sports and traveling? [Answers are presented in hours per day]
2006 2007 2008 2009
% (Base=1,507) % (Base=1,008) % (Base=1,011) Frequency % (Base=1,011)
No private activities at 10.9% 8.5% 10.0% 79 7.8% Less than 1 hour per day 34.2% 34.5% 34.8% 359 35.5% 1 - 2 hours per day 25.4% 27.2% 27.7% 276 27.3% >2 - 3 hours per day 10.4% 9.8% 12.1% 130 12.9% >3 - 4 hours per day 4.6% 4.9% 3.4% 35 3.5% >4 - 5 hours per day 2.2% 2.8% 3.2% 43 4.3% >5 - 6 hours per day 1.7% 1.1% 2.1% 19 1.9% >6 - 7 hours per day 1.9% 2.7% 0.5%** 8 0.8% >7 hours per day 1.9% 2.3% 1.5% 17 1.7% Don’t know/forgot/Hard
to say 6.8% 6.3% 4.8% 45 4.5%
Total 100.0% 100.0% 100.0% 1,011 100.0% Missing 12 6 0 2
Mean 11.1 hrs / week 12.0 hrs / week 10.4 hrs/ week** 11.2 hrs / week
Standard error 0.36 hr 0.47 hr 0.35 hr 0.37 hr Base 1,404 945 962 966
* Statistically significant at p<0.05 level ** Statistically significant at p<0.01 level

Public Opinion Programme, HKU Work Life Balance Survey 2009
Page 21
Table 5 [Q3] In your view, what would be the PREFERRED but REALISTIC ratio between the time you want to spend on working and the time you want to spend on personal or private activities? Please based on your realistic number of working hours and exclude sleeping time (the ratio must add up to 100%)
2006 2007 2008 2009 Working : Leisure % (Base=1,511) % (Base=1,007) % (Base=1,010) Frequency % (Base=1,010)
10%-15% : 85%-90% 0.0% 0.1% 0.3% 0 0.0% 20%-25% : 75%-80% 0.2% 0.4% 0.1% 7 0.7%* 30%-35% : 65%-70% 2.7% 2.2% 1.4% 23 2.3% 40%-45% : 55%-60% 3.6% 5.2% 3.0%* 41 4.1% 50%-55% : 45%-50% 24.4% 27.9%* 24.4% 244 24.2% 60%-65% : 35%-40% 25.5% 23.9% 24.9% 233 23.1% 70%-75% : 25%-30% 27.2% 24.2% 27.4% 277 27.4% 80%-85% : 15%-20% 8.9% 9.1% 10.4% 112 11.1% 90%-95% : 5%-10% 1.7% 1.3% 1.4% 13 1.3% 100% : 0% 0.1% 0.2% 0.1% 0 0.0% Don't Know 5.8% 5.5% 6.7% 60 5.9%
Total 100.0% 100.0% 100.0% 1,010 100.0% Missing 8 7 1 33
* Statistically significant at p<0.05 level ** Statistically significant at p<0.01 level Table 6 [Q3_mean] In your view, what would be the PREFERRED but REALISTIC ratio between the time you want to spend on working and the time you want to spend on personal or private activities? Please base on your realistic number of working hours and exclude sleeping time (the ratio must add up to 100%)
2006 2007 2008 2009
% on work % on personal activities % on work % on personal
activities % on work % on personal activities % on work % on personal
activities Mean 61.3% 38.7% 60.2%* 39.9%* 62.3%** 37.7%** 61.6% 38.4% Standard error 0.33 0.33 0.41 0.41 0.40 0.40 0.42 0.42 Base 1,424 1,424 952 952 942 942 950 950 Missing 95 95 62 62 69 69 63 63
* Statistically significant at p<0.05 level ** Statistically significant at p<0.01 level

Public Opinion Programme, HKU Work Life Balance Survey 2009
Page 22
Table 7 [Q1 & Q2] The ACTUAL ratio between the time respondents spent on working and the time on personal or private activities. The number was based on ACTUAL working hours and ACTUAL personal time (the ratio is added up to 100%).
2006 2007 2008 2009
% on work % on personal activities % on work % on personal
activities % on work % on personal activities % on work % on personal
activities Mean 84.2% 15.8% 82.6%* 17.4%* 84.1%* 15.9%* 83.2% 16.8% Standard error 0.37 0.37 0.49 0.49 0.43 0.43 0.43 0.43 Base 1,363 1,363 897 897 947 947 948 948 Missing 156 156 117 117 64 64 65 65
* Statistically significant at p<0.05 level ** Statistically significant at p<0.01 level B. Problems Facing in terms of Work-Life Balance and Desired Solutions Table 8 [Q4] Using 0-10, how much have YOU achieved in terms of an ideal work-life balance? 0 represents the worst case possible, 10 represents already ideal, and 5 being half-half.
2006 2007 2008 2009
% (Base=1,516) % (Base=1,012) % (Base=1,010) Frequency % (Base=1,013)
0 1.3% 2.6%* 2.3% 22 2.2% 1-2 1.8% 1.7% 3.5%* 41 4.0% 3-4 13.7% 13.0% 11.9% 143 14.1% 5 33.8% 34.1% 30.8% 289 28.5% 6-7 36.3% 35.0% 35.7% 339 33.5% 8-9 9.6% 10.5% 12.6% 152 15.0% 10 2.7% 2.5% 2.0% 21 2.1% Don’t know/ Hard to say 0.7% 0.7% 1.3% 6 0.6%
Total 100.0% 100.0% 100.0% 1,013 100.0%
Missing 3 2 1 0
Mean 5.7 5.6 5.7 5.7
Standard Error 0.04 0.06 0.06 0.06 Base 1,505 1,005 997 1,007
* Statistically significant at p<0.05 level ** Statistically significant at p<0.01 level

Public Opinion Programme, HKU Work Life Balance Survey 2009
Page 23
Table 9 [Q5] Over the past 12 months^, have you encountered any of the following problems due to a disturbed work-life balance? (Read out each answer, order to be randomized by computer and multiple responses allowed)
2006 2007 2008 2009^^
Answer Code
% of valid sample
(Base=1,519)
% of valid sample
(Base=1,011)
% of valid sample
(Base=1,011)Frequency % of total response
(Base=2,700) % of valid sample
(Base=1,013)
1 61.0% 60.5% 62.3% 541 20.0% 53.4% 2 39.1% 43.7%* 49.3%* 413 15.3% 40.8% 3 41.3% 41.4% 41.6% 314 11.6% 31.0% 4 28.2% 35.6%** 33.1% 279 10.3% 27.5% 5 33.4% 32.8% 37.7%* 272 10.1% 26.9% 6 28.4% 31.1% 34.4% 249 9.2% 24.6% 7 28.8% 29.9% 28.4% 231 8.6% 22.8% 8 30.6% 33.2% 30.4% 159 5.9% 15.7% 9 15.1% 13.6% 14.2% 239 8.9% 23.6% 10 0.2% 0.1% 0.0% 3 0.1% 0.3% Total -- -- -- 2,700 100%
Missing 0 3 0 0 * Statistically significant at p<0.05 level ** Statistically significant at p<0.01 level ^ Question wordings used in 2006-08 were “Have you ever encountered any of the following problems due to a disturbed work-life balance?”. ^^ Since there have been changes in the question wordings and some answer options, no statistical test has been applied. Code Answer 1 Prolonged fatigue level, sleepiness and extreme tiredness. 2 I don’t have time staying with my partner and family. 3# I have insomnia and poor diet as a result of work pressures 4 I do not have any private time for recreation activities or sports at all. 5 Productivity and work quality has reduced dramatically due to long working hours. 6 My work has affected my relationship with my friends. 7 I feel stressed out, depressed and exhausted after work. 8## I get physically sick easily / I need to take more sick leave 9 None of the above 10 Don’t know/Hard to say # The option wordings for surveys prior to 2009 were “Work pressure creates insomnia and poor diet”. ## The option wordings for surveys prior to 2009 were “I get physically sick easily and frequently due to heavy workload”.

Public Opinion Programme, HKU Work Life Balance Survey 2009
Page 24
Table 10 [Q6] Under the current economic conditions#, which of the following would you consider to be the most difficult work life balance challenge for yourself? (Read out each answer, order to be randomized by computer, single response only)
2006 2007 2008 2009##
% (Base=1,519) % (Base=1,013) % (Base=1,011) Frequency % (Base=1,013) Financial well-being/ Wealth
management^ 13.8% 18.6%** 14.9%* 140 13.8%
Long working hours 16.0% 15.3% 17.5% 123 12.1% Increased workload due to
company downsizing -- -- -- 117 11.5%
Leader’s attitude 8.0% 8.7% 13.3%** 115 11.4% Job security 11.7% 8.8%* 8.6% 85 8.4% Not enough time for exercise
and taking courses^^ 9.0% 7.9% 7.9% 73 7.2%
Peer pressure and competition among colleagues 6.4% 8.6%* 7.8% 59 5.8%
Lack of flexibility in working hours 7.0% 5.8% 6.7% 55 5.4%
Taking care of children or family members 10.5% 9.3% 5.1%** 53 5.2%
Personnel changes 5.5% 6.2% 4.1%* 39 3.8% Work location 2.0% 4.1%** 3.5% 27 2.7% Others (Please specify) 0.6% 0.6% 0.5% 7 0.7% I do not find work balance is
a challenge to me 8.6% 4.9%** 8.0%** 115 11.4%
Don't know/Hard to say 0.9% 1.2% 2.1% 5 0.5%
Total 100.0% 100.0% 100.0% 1,013 100.0% Missing 0 1 0 0
* Statistically significant at p<0.05 level ** Statistically significant at p<0.01 level ^ The option wordings for 2006’s survey were ‘Financial management’. # Question wordings used in 2006-08 were “Which of the following would you consider to be the most difficult work life balance challenge for yourself?”. ^^ The option wordings for 2006’s survey were ‘Time for personal well-being such as exercise and re-education’, and “Not enough time for personal well-being such as exercise and re-education” in 2007& 2008. ## Since an option, namely “Increased workload due to company downsizing”, has been introduced in 2009’s survey, no statistical test, therefore, has been applied.

Public Opinion Programme, HKU Work Life Balance Survey 2009
Page 25
Table 11 [Q7] Under the current economic conditions^, in order to help you achieve a better work-life balance, what type of work facility/arrangement would help you best? (Read out each answer, order to be randomized by computer, single response only)
2006 2007# 2008 2009
% (Base=1,515) % (Base=1,006) % (Base=1,009) Frequency % (Base=1,011) 5-day work week 32.4% 26.8% 27.2% 272 26.9% More paid annual leave -- 18.3% 19.7% 190 18.8% Flexible working time 22.4% 12.2% 9.7% 109 10.8% Option to work from home
sometimes 14.1% 9.5% 9.2% 95 9.4%
Career breaks/Unpaid leave^^ -- 8.0% 9.9% 90 8.9% Job-share -- 6.8% 6.3% 64 6.3% Free sports facilities 11.2% 6.1% 5.3% 53 5.2% Work support services (e.g.
employee counseling scheme, stress management training)
6.1% 4.1% 2.5% 46 4.5%*
Parental leave 5.9% 1.6% 1.6% 18 1.8% Crèche facilities/Child care 2.1% 2.1% 1.5% 14 1.4% Longer maternity leave -- 0.6% 0.6% 8 0.8% Others (Please specify) 2.0% 0.9% 2.0% 20 2.0% Don’t know/Hard to say 3.8% 3.1% 4.6% 32 3.2%
Total 100.0% 100.0% 100.0% 1,011 100.0% Missing 4 8 2 2
* Statistically significant at p<0.05 level ** Statistically significant at p<0.01 level ^ Question wordings used in 2006-08 were “In order to help you achieve a better work-life balance, what type of work facility/arrangement would help you best?”. # Since the answer options in 2007’s survey are different from those in 2006’s survey, only rough comparison can, therefore, be made, and no statistical test has been applied. ^^ The option wordings for surveys prior to 2009 were ‘Career breaks”.

Public Opinion Programme, HKU Work Life Balance Survey 2009
Page 26
Table 12 [Q8] In terms of the effort and resources required to balance work and life, how much effort do you think your WORKPLACE/BOSS has/have paid to promote work-life balance? Please use a scale of 0-10 to measure it, with 0 representing no effort at all, 10 representing all possible efforts have been made, and 5 being half-half.
2006 2007 2008 2009 % (Base=1,513) % (Base=1,008) % (Base=1,006) Frequency % (Base=1,011)
0 11.2% 10.1% 10.7% 106 10.5% 1-2 6.6% 6.7% 7.2% 62 6.1% 3-4 18.3% 16.8% 17.1% 184 18.2% 5 27.2% 26.3% 28.9% 308 30.5% 6-7 20.4% 24.5%* 23.4% 219 21.7% 8-9 8.8% 8.3% 8.4% 84 8.3% 10 3.3% 2.3% 0.9%* 20 2.0%* Don’t know/Hard to say 4.2% 5.0% 3.4% 28 2.8%
Total 100.0% 100.0% 100.0% 1,011 100.0%
Missing 6 6 5 2
Mean 4.7 4.7 4.6 4.7 Standard Error 0.07 0.08 0.08 0.08
Base 1,449 958 972 983 * Statistically significant at p<0.05 level ** Statistically significant at p<0.01 level Table 13 [Q9] Under the current economic conditions, how important is it that your workplace/boss addresses the issue of work-life balance? [Interviewers to probe intensity] 2009 Frequency % (Base=1,011)
Very important ) 253 ) 25.0% ) Quite important ) Important 432 ) 685 42.7% ) 67.8%
Neutral 187 18.5% Not quite important ) 80 ) 7.9% ) Not important at all ) Not important 36 ) 116 3.6% ) 11.5%
Don’t know/ Hard to say 23 2.3%
Total 1,011 100.0% Missing 2

Public Opinion Programme, HKU Work Life Balance Survey 2009
Page 27
Table 14 [Q10] Would you consider leaving your current job for better work-life balance?
2008 2009 Frequency % (Base=1,010) Frequency % (Base=1,013)
Yes 329 32.6% 305 30.1% No 672 66.5% 691 68.2% Don’t know/Hard to say 9 0.9% 17 1.7%
Total 1,010 100.0% 1,013 100.0%
Missing 1 0

Public Opinion Programme, HKU Work Life Balance Survey 2009
Page 28
Appendix 3
Demographics

Public Opinion Programme, HKU Work Life Balance Survey 2009
Page 29
Demographics
Table 15 Gender
2006 2007 2008 2009
% (Base=1,519) % (Base=1,014) % (Base=1,011) Frequency % (Base=1,013)
Male 54.0% 51.3% 54.0% 524 51.7% Female 46.0% 48.7% 46.0% 489 48.3%
Total 100.0% 100.0% 100.0% 1,013 100.0%
Table 16 Age Group 2006 2007 2008 2009
% (Base=1,511) % (Base=1,004) % (Base=965) Frequency % (Base=997) 15-29 years old 18.4% 23.8% 16.9% 205 20.6% 30-39 years old 26.5% 23.3% 22.3% 222 22.3% 40-49 years old 35.3% 33.0% 35.8% 301 30.2% 50-59 years old 17.5% 17.3% 20.9% 212 21.3% 60 years old or above 2.3% 2.6% 4.1% 57 5.7%
Total 100.0% 100.0% 100.0% 997 100.0%
Missing 8 10 46 16

Public Opinion Programme, HKU Work Life Balance Survey 2009
Page 30
Table 17 Education Attainment 2006 2007 2008 2009
% (Base=1,513) % (Base=1,007) % (Base=993) Frequency % (Base=1,008)
Primary school or below 6.1% 6.4% 8.1% 78 7.7% Secondary school 48.2% 47.6% 47.1% 420 41.7% Matriculated 7.4% 7.4% 6.7% 67 6.6% Tertiary, non-degree course 8.2% 6.2% 6.6% 65 6.4% Tertiary, degree course 23.8% 23.8% 23.9% 278 27.6% Master's Degree 6.0% 7.5% 7.6% 92 9.1% Doctor's Degree 0.3% 1.1% 0.0% 8 0.8%
Total 100.0% 100.0% 100.0% 1,008 100.0%
Missing 6 7 18 5
Table 18 Position
2006 2007 2008 2009
% (Base=1,493) % (Base=998) % (Base=998) Frequency % (Base=993)
White collar: Professional/Manager/Executive
25.1% ) 27.9% ) 24.0% ) 283 ) 28.5% )
White collar: Trader/Proprietor
6.0% ) 5.2% ) 5.2% ) 23 ) 2.3% )
White collar: Office: skilled 21.6% ) 18.7% ) 22.5% ) 219 ) 22.1% )White collar: Office:
unskilled 16.7% )
69.4%
18.2% )
70.0%
19.3% )
71.1%
163 )
688
16.4% )
69.3%
Blue collar: Factory/Shop/Outdoor: skilled Manual worker
14.5% ) 14.1% ) 15.7% ) 150 ) 15.1% )
Blue collar: Factory/Shop/Outdoor: unskilled Manual worker
16.1% )
30.6%
15.8% )
30.0%
13.1% )
28.9%
155 )
305
15.6% )
30.7%
Total 100.0% 100.0% 100.0% 993 100.0%
Missing 26 16 13 20
Public Opinion Programme, HKU Work Life Balance Survey 2009
Page 31
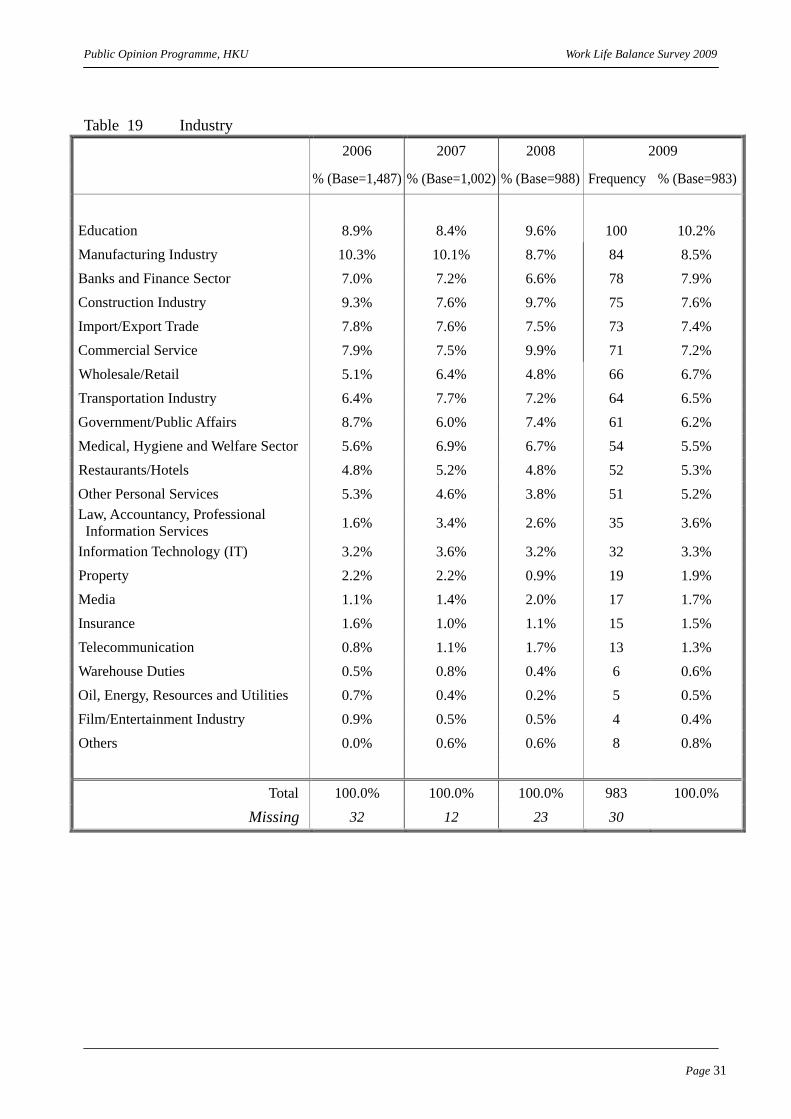
Table 19 Industry
2006 2007 2008 2009
% (Base=1,487) % (Base=1,002) % (Base=988) Frequency % (Base=983)
Education 8.9% 8.4% 9.6% 100 10.2% Manufacturing Industry 10.3% 10.1% 8.7% 84 8.5% Banks and Finance Sector 7.0% 7.2% 6.6% 78 7.9% Construction Industry 9.3% 7.6% 9.7% 75 7.6% Import/Export Trade 7.8% 7.6% 7.5% 73 7.4% Commercial Service 7.9% 7.5% 9.9% 71 7.2% Wholesale/Retail 5.1% 6.4% 4.8% 66 6.7% Transportation Industry 6.4% 7.7% 7.2% 64 6.5% Government/Public Affairs 8.7% 6.0% 7.4% 61 6.2% Medical, Hygiene and Welfare Sector 5.6% 6.9% 6.7% 54 5.5% Restaurants/Hotels 4.8% 5.2% 4.8% 52 5.3% Other Personal Services 5.3% 4.6% 3.8% 51 5.2% Law, Accountancy, Professional Information Services 1.6% 3.4% 2.6% 35 3.6%
Information Technology (IT) 3.2% 3.6% 3.2% 32 3.3% Property 2.2% 2.2% 0.9% 19 1.9% Media 1.1% 1.4% 2.0% 17 1.7% Insurance 1.6% 1.0% 1.1% 15 1.5% Telecommunication 0.8% 1.1% 1.7% 13 1.3% Warehouse Duties 0.5% 0.8% 0.4% 6 0.6% Oil, Energy, Resources and Utilities 0.7% 0.4% 0.2% 5 0.5% Film/Entertainment Industry 0.9% 0.5% 0.5% 4 0.4% Others 0.0% 0.6% 0.6% 8 0.8%
Total 100.0% 100.0% 100.0% 983 100.0%
Missing 32 12 23 30

Public Opinion Programme, HKU Work Life Balance Survey 2009
Page 32
Table 20 Personal monthly income
2006 2007 2008 2009 % (Base=1,459) % (Base=971) % (Base=947) Frequency % (Base=930)
HK$ 10,000 or below 28.4% 27.1% 28.8% 251 27.0%
HK$ 10,001∼20,000 40.4% 42.2% 38.4% 337 36.2%
HK$ 20,001∼30,000 14.1% 13.3% 14.3% 139 14.9%
HK$ 30,001∼40,000 6.9% 6.5% 5.7% 84 9.0%
HK$ 40,001∼50,000 3.6% 3.6% 3.6% 37 4.0%
HK$ 50,001 or above 6.6% 7.3% 9.2% 82 8.8%
Total 100.0% 100.0% 100.0% 930 100.0% Missing 60 43 64 83
Table 21 Language of interview
2006 2007 2008 2009
% (Base=1,519) % (Base=1,014) % (Base=1,011) Frequency % (Base=1,013)
Cantonese 95.5% 94.5% 95.0% 959 94.7% Putonghua 0.1% 0.2% 0.2% 0 0.0% English 4.5% 5.3% 4.8% 54 5.3%
Total 100.0% 100.0% 100.0% 1,013 100.0%
Table 22 District of residence
2006 2007 2008 2009
% (Base=1,505) % (Base=1,003) % (Base=1,003) Frequency % (Base=1,006) Hong Kong Island 19.9% 20.5% 20.5% 234 23.3% Kowloon East 15.7% 13.9% 15.9% 174 17.3% Kowloon West 12.6% 12.0% 15.4% 162 16.1% New Territories East 25.9% 27.4% 22.6% 226 22.5% New Territories West 25.9% 26.2% 25.6% 210 20.9%
Total 100.0% 100.0% 100.0% 1,006 100.0%
Missing 14 11 8 7

Public Opinion Programme, HKU Work Life Balance Survey 2009
Page 33
Appendix 4 In-depth Analysis: Cross-tabulation
for 2009 findings

Public Opinion Programme, HKU Work Life Balance Survey 2009
Page 34
Note: The results of in-depth analyses described in this appendix should be read in addition to the analyses described in the research findings in the main part of this research report. Items marked with (^) are subject to a sub-sample size <30. As the smaller the sample size, the larger the sampling error, findings of these items can be for rough reference only. When looking at the sub group analyses by industry, “other industries” is excluded as the nature of different items within this group can vary a lot.
Cross-tabulation by Demographic Variables for 2009 Findings (The differences of the listed items are proved to be statistically significant.)
1. Actual working hours
1.1 Sub-group analyses showed that, same as previous years, males (49.5 hours) actually worked longer hours than females (47.2 hours) in general, p<0.01.
1.2 A trend has developed when looking at the age group analysis. The elder the
respondents, the longer hours they worked per week (aged 15-29: 47.3 hours; aged 30-39: 47.5 hours; aged 40-49: 48.3 hours; aged 50-59: 50.0 hours and aged 60 or above: 50.5 hours), p<0.05.
1.3 People belonging to “restaurants/ hotels” (56.4 hours), “property”^ (52.2 hours) and
“other personal services (51.8 hours) worked relatively longer hours. Those from “insurance”^ (41.6 hours), “oil, energy, resources and utilities”^ (44.2 hours) and “education” (45.3 hours) had actually worked fewer hours when compared with other industry groups, p<0.01.
1.4 People with the lowest income (HK$ 10,000 or below: 50.1 hours) worked longer
hours than other income groups. The weekly working hours for other income groups were around 47 or 48 hours, p<0.05.
2. Amount of time spent on private activities
2.1 The youngest generation (aged 15-29: 13.2 hours) spent more time on leisure activities whilst the eldest (aged 60 or above) only had 7.8 hours a week. Respondents aged 30-39, 40-49 and 50-59 spent about 11 hours for their personal activities, p<0.05.
2.2 In line with the previous observation, respondents earning HK$ 10,000 or below (9.1
hours) enjoyed the least leisure time among different income groups while the high income groups (HK$ 40,001∼50,000: 15.6 hours and HK$ 50,001 or above: 11.8 hours), plus people with monthly income of HK$ 10,001∼20,000 (11.9 hours) tended to have more time on private activities, p<0.01.
Public Opinion Programme, HKU Work Life Balance Survey 2009
Page 35
3 Actual work-life ratio
3.1 The youngest respondents (aged 15-29: 80:20) tended to achieve a more balanced work-life ratio than the other age groups, especially the eldest one (aged 60 or above: 88:12), p<0.01.
3.2 “Government/ public affairs” (79:21), “medical, hygiene and welfare sector” (79:21)
and “Insurance”^ industries (80:20) seemed to enjoy a more balanced work-life ratio. Highly imbalanced ratio, on the other hand, was found for respondents from the “film / entertainment”^ (94:6), “warehouse duties”^ (90:10) and “restaurants / hotels” (89:11) industries, p<0.01.
3.3 The high income groups were able to achieve a more balanced work-life ratio (HK$
40,001∼50,000: 79:21 and HK$ 50,001 or above: 81:19) than the lowest income group (HK$ 10,000 or below: 86:14), p<0.01.
4 Degree to which respondents have achieved their ideal work-life balance
4.1 Respondents within “government / public affairs” (6.5 marks), “property”^ (6.1 marks) and “banks and finance sector” (6.1 marks) claimed to have achieved a higher level of work-life balance when compared with other industries. On the other hand, people working in “film / entertainment industry “^ (4.0 marks), “warehouse duties”^ (5.2 marks) and “restaurants / hotels” (5.2 marks) were lagging behind in this aspect, p<0.01.
4.2 Lower income groups tended to give themselves a lower work-life-balance rating
(HK$ 10,000 or below: 5.4 marks and HK$ 10,001∼20,000: 5.6 marks) than those with higher income (HK$ 50,001 or above: 6.3 marks), p<0.01.
5 Problems arisen from disturbed work-life balance
5.1 Across all age groups, “prolonged fatigue level, sleepiness and extreme tiredness” was the most common problem encountered by the respondents, especially among the younger groups (aged 15-29: 64% and aged 30-39: 53%). On the other hand, younger respondents were less likely to report they encountered “none” of the problems mentioned (aged 15-29: 17%, aged 30-39: 23% and aged 40-49: 22%) than the elder age groups (aged 50-59: 30% and aged 60 or above: 32%), p<0.01.

Public Opinion Programme, HKU Work Life Balance Survey 2009
Page 36
5.2 Similarly, a rather large proportion of respondents across all income groups suffered
from “prolonged fatigue level, sleepiness and extreme tiredness” but it was most common among people earning HK$ 40,001∼50,000 (65%) and HK$ 10,001∼20,000 (60%), p<0.01.
6 Most difficult WLB challenge
6.1 More people from the “warehouse duties”^, “insurance”^, “import/ export trade”, “construction industry”, “wholesale/retail”, “commercial service” “transportation industry” and “banks and finance sector” complained against their “financial well-being/wealth management”, with the industry “warehouse duties” (33%) topping the list. As for the WLB challenge “long working hours”, it was most common among the “film/ entertainment industry”^, “information technology (IT)”, “restaurants/hotels”, “education” and “law, accountancy, professional information services”, while the situation for people working in the “film/ entertainment industry” and “information technology” (both at 25%) was most serious. At the same time, a larger proportion of respondents from “government/ public affairs”, “medical, hygiene and welfare”, “property”^, “media”^ and “law, accountancy, professional information services” picked “leader’s attitude” as their main WLB challenge and the highest percentage went to “government/ public affairs” (30%), p<0.01.
7 Facilities or arrangements desired most
7.1 Same as previous years, “5-day work week” continued to be the most desired
arrangement across all age groups for achieving a better work-life balance (aged 15-29: 25%, aged 30-39: 29%, aged 40-49: 25%, aged 50-59: 30% and aged 60 or above: 27%). Yet, one-fourth of respondents aged 15-29 mentioned “more paid annual leave”, which was relatively more than other age groups (aged 30-39: 15%, aged 40-49: 21%, aged 50-59: 14% and aged 60 or above: 18%). In the meantime, relatively more respondents aged 15-29 (10%), 30-39 (13%) and 40-49 (12%) longed for “option to work from home sometimes” for better work-life balance when compared with their elder counterparts (aged 50-59: 3% and aged 60 or above: 4%), p<0.01.
7.2 Significantly more respondents coming from the low and middle income groups desired
for “5-day-work week” (HK$ 10,000 or below: 32%, HK$ 10,001∼20,000: 26%, HK$ 20,001∼30,000: 32% and HK$ 30,001∼40,000: 31%) whereas more people of the higher income groups opted for “more paid annual leave” (HK$ 40,001∼50,000: 30%) and “option to work from home sometimes” (HK$ 50,001 or above: 22%). At the same time, “option to work from home sometimes” as a means to achieve better work-life

Public Opinion Programme, HKU Work Life Balance Survey 2009
Page 37
balance was less popular among the low income groups (HK$ 10,000 or below: 4% and HK$ 10,001∼20,000: 7%) than other income groups (HK$ 20,001∼30,000: 12%, HK$ 30,001∼40,000: 14%, HK$ 40,001∼50,000: 14% and HK$ 50,001 or above: 22%), p<0.01.
8 Effort and resources spent on work-life balance
8.1 Consistent with other findings, the lower income groups tended to assess their workplace/boss less favorably in terms of their effort/resources paid to work-life balance (HK$ 10,000 or below: 4.5 marks and HK$ 10,001∼20,000: 4.4 marks) when compared to the higher income groups (“HK$ 40,001∼50,000” and “HK$ 50,001 or above” scored 5.1 and 5.5 marks respectively), p<0.01.
9 Importance of workplace/boss to address work-life balance
9.1 Significantly more young respondents (aged 15-29: 71% and aged 30-39: 74%) considered it important for their workplace/boss to pay effort to addressing the work-life balance issue than their elder counterparts (aged 50-59: 59% and aged 60 or above: 54%), p<0.01.
10 Tendency to leave current job for better work-life balance
10.1 A trend has developed over years that the younger the respondents, the more likely they would consider leaving their current job for better work-life balance (aged 15-29: 48%, aged 30-39: 36%, aged 40-49: 24%, aged 50-59: 21% and aged 60 or above: 12%), p<0.01.

Public Opinion Programme, HKU Work Life Balance Survey 2009
Page 38
Appendix 5
In-depth Analysis: Cross-tabulation On yearly comparison

Public Opinion Programme, HKU Work Life Balance Survey 2009
Page 39
Note: The results of in-depth analyses described in this appendix should be read in addition to the analyses described in the research findings in the main part of this research report. Sub-Group Yearly Comparison (Other than the trend mentioned in the following, the differences of the listed items are proven to be statistically significant.)
All in all, the HK working population's WLB seemed to have remained rather stable in the year past as only a few significant changes have been located. In the meantime, it is encouraging that an increasing number of respondents claimed they have not encountered any problems in the past 12 months arising from a disturbed WLB. This probably means the previous efforts in promoting work-life balance begin to pay. Yet, there is still room for further improvement as evident by the large discrepancy between respondents’ actual work-life ratio and their preferred but realistic one. Remarks: Yearly sub-group comparisons are included, while items marked with (^) are subject to a sub-sample size <30. As the smaller the sample size, the larger the sampling error, findings of these items can be for rough reference only. Subgroups marked with double asterisks (**) indicated that the variation has been tested to be statistically significant at p<0.01 level, whereas those with single asterisk (*) denoted statistical significance at p<0.05 level.
I) Respondents’ Work and Living Patterns 1. Actual working hours 1.1 When looking at the data from 2006 to 2009, a downward trend is observed for the mean
working hours among the working population interviewed, which has decreased for 3 consecutive times from 2006’s 51.3 hours to 48.4 hours per week in this year’s survey but is it noteworthy that only the change between 2007 and 2006 is statistically significant.
1.2 Comparing to 2008’s findings, the actual number of working hours for respondents aged
30-39* dropped notably from 49.8hrs to 47.5 hrs. 1.3 Significant changes were observed in the year past within “medical, hygiene and welfare
sector”* and “restaurants / hotels”*, but in different direction. Respondents in the former industry actually worked 45.7 hrs a week, down by over 3 hours from 2008 (48.8 hrs). On the contrary, those working in the “restaurants / hotels” industry worked significantly longer hours than last year (from 50.7 hrs to 56.4 hrs).

Public Opinion Programme, HKU Work Life Balance Survey 2009
Page 40
2. Actual work-life ratio 2.1 When compared with 2008, the actual work-life ratio within “medical, hygiene and welfare
sector”* (from 85:15 to 79:21), “transportation industry”* (from 88:12 to 82:18) and “wholesale / retail”* (from 89:11 to 84:16) appeared to have significantly improved. However, the ratio for respondents working in “film / entertainment industry”^* got worse in this regard (from 80:20 to 94:6).
3. Degree to which respondents have achieved their ideal work-life balance 3.1 People working in the “telecommunication”^*industry tended to have achieved a better
work-life balance (from 4.8 marks to 6.0 marks) this year. On the other hand, the picture of those within “law, accountancy, professional information services“* became less favorable (from 6.6 marks to 5.5 marks).
3.2 The WLB self-rating given by the HK$ 30,001∼40,000** income group dropped notably
from 6.5 marks in 2008 to 5.6 marks in 2009. II) Problems Facing in terms of Work-Life Balance and Desired Solutions 4. Facilities / Arrangements for better work-life balance 4.1 The popularity of “free sports facilities” seemed to drop continuously from 2006 to 2008 and
stabilize in 2009 (2006: 11%, 2007: 6%, 2008: 5% and 2009: 5%).

Public Opinion Programme, HKU Work Life Balance Survey 2009
Page 41
Appendix 6
Bilingual Questionnaires

Public Opinion Programme, HKU Work Life Balance Survey 2009
Page 42
Work Life Balance Survey of the Hong Kong Working Population 2009
Questionnaire (English)
Final Draft
27 April 2009

Public Opinion Programme, HKU Work Life Balance Survey 2009
Page 43
P a r t 1 I n t ro d u c t i o n
Good evening, sir/madam, this is Mr/Ms X, an interviewer from the Public Opinion Programme of the University of Hong Kong. We would like to ask for your opinion on some work life issues which would only take you a couple of minutes. Please be rest assured that your phone number is randomly selected by our computer and your information provided will be kept strictly confidential. (R1) Verification of telephone number (R2) Living district (R3) Household size The target of this interview is full time worker of age 15 or above who speak Cantonese, English or Mandarin.
P a r t 2 S e l e c t i o n o f R e s p o n d e n t s
(S1) Is there any full time worker in your household of age 15 or above? Since we need to conduct random sampling, if there is more than one available, I would like to speak to the one who will have his / her birthday next. (If the target is not available at the moment, make an appointment to recall.) Yes No Refuse to answer (S2) Are you currently working full time? (Interviewers read out: “Full time workers” can be defined as those who work at least 5 days a week, or total working time not less than 40 hours a week.) Yes No Refuse to answer Terminate interview, skip to end.
Terminate interview, skip to end.

Public Opinion Programme, HKU Work Life Balance Survey 2009
Page 44
I. Respondents’ Work and Living Patterns [Q1] Take the last month as an example, how many hours a week do you ACTUALLY work on average for your full time job?
________ hours (Insert exact figures) Don’t know / Hard to say Refuse to answer
[Q2] Take the last month as an example, how many hours a week do you ACTUALLY spend on doing some personal or private activities, like meeting friends and engaging in activities for leisure such as sports and traveling?
________ hours (Insert exact figures) Don’t know / Hard to say Refuse to answer
[Q3] In your view, what would be the PREFERRED but REALISTIC ratio between the time you want to spend on working and the time you want to spend on personal or private activities? Please base this on your realistic number of working hours and exclude sleeping time (the ratio must add up to 100%)
______% on work and ______% on private life Don’t know / Hard to say Refuse to answer
II. Problems Facing in terms of Work-Life Balance and Desired Solutions [Q4] On a scale of 0-10, how much have YOU achieved in terms of an ideal work-life balance? 0 represents the worst case possible, 10 represents already ideal, and 5 being half-half.
_________(Exact figure from 0-10) Don’t know / Hard to say Refuse to answer
P a r t 3 O p i n i o n Q u e s t i o n s

Public Opinion Programme, HKU Work Life Balance Survey 2009
Page 45
[Q5] Over the past 12 months, have you encountered any of the following problems due to a disturbed work-life balance? (Read out each answer, order to be randomized by computer and multiple responses allowed) [Interviewers read out: I am going to read out a few options, and you can choose multiple answers]
Productivity and work quality has reduced dramatically due to long working hours. Prolonged fatigue level, sleepiness and extreme tiredness. I get physically sick easily / I need to take more sick leave I do not have any private time for recreation activities or sports at all. My work has affected my relationship with my friends. I don’t have time staying with my partner and family. I feel stressed out, depressed and exhausted after work. I have insomnia and poor diet as a result of work pressures None of the above Don’t know / Hard to say Refuse to answer
[Q6] Under the current economic conditions, which of the following would you consider to be the most difficult work life balance challenge for yourself? (Read out each answer, order to be randomized by computer, single response only) [Interviewers read out: I am going to read out a few options, and you can choose one answer only]
Job security Long working hours Lack of flexibility in working hours Work location Leader’s attitude Peer pressure and competition among colleagues Personnel changes Taking care of children or family members Not enough time for exercise and taking courses Financial well-being / Wealth management Increased workload due to company downsizing I do not find work life balance is a challenge to me Others (Please specify) Don’t know / Hard to say Refuse to answer

Public Opinion Programme, HKU Work Life Balance Survey 2009
Page 46
[Q7] Under the current economic conditions, in order to help you achieve a better work-life balance, what type of work facility/arrangement would help you best? (Read out each answer, order to be randomized by computer, single response only) [Interviewers read out: I am going to read out a few options, and you can choose one answer only]
Flexible working time 5-day work week Option to work from home sometimes Free sports facilities Crèche facilities/Child care Work support services (e.g. employee counseling scheme, stress management training) Paternity leave Longer maternity leave (for internal ref only: 10 weeks by law) Job-share (for internal ref only: split up one full-time job to more than 1 staff) Career breaks / Unpaid leave More paid annual leave Others (Please specify) Don’t know / Hard to say Refuse to answer
[Q8] In terms of effort and resources required to balance work and life, how much effort do you think your workplace/boss has paid to promote work-life balance? Please use a scale of 0-10 to measure it, with 0 representing no effort at all, 10 representing all possible efforts have been made, and 5 being half-half.
_________(Exact figure from 0-10) Don’t know / Hard to say Refuse to answer
[Q9] Under the current economic conditions, how important is it that your workplace/boss addresses the issue of work-life balance? [Interviewers to probe intensity]
Very important Quite important Neutral Not quite important Not important at all Don’t know / Hard to say Refuse to answer
[Q10] Would you consider leaving your current job for better work-life balance? Yes No Don’t know / Hard to say Refuse to answer

Public Opinion Programme, HKU Work Life Balance Survey 2009
Page 47
We would like to ask you some personal information for further analyses. (DM1) Gender
Male Female (DM2a) Age
_____ (Exact age) Do not want to tell
(DM2b) 【For those who do not want to tell their exact age】Age interval (Interviewer can read out the intervals)
15-19 20-24 25-29 30-34 35-39 40-44 45-49 50-54 55-59 60 years old or above Do not want to tell (DM3) Education Attainment Primary school or below Secondary school Matriculated Tertiary, non-degree course Tertiary, degree course Master’s degree Doctor’s degree Refuse to answer
P a r t 4 D e m o g r a p h i c s

Public Opinion Programme, HKU Work Life Balance Survey 2009
Page 48
(DM4) Position (Pls refer to attached “occupation” sheet for detailed categorizations) White collar: Professional / Manager / Executive Trader / Proprietor Office: skilled Office: unskilled Blue collar: Factory/Shop/Outdoor: skilled Manual worker Factory/ Shop/Outdoor: unskilled Manual worker Refuse to answer (DM5) Industry Banks and Finance Sector Commercial Service Construction Industry Education Film / Entertainment Industry Government / Public Affairs Import / Export Trade Information Technology (IT) Insurance Law, Accountancy, Professional Information Services Manufacturing Industry Media Medical, Hygiene and Welfare Sector Oil, Energy, Resources and Utilities Other Personal Services Property Restaurants / Hotels Telecommunication Transportation Industry Warehouse Duties Wholesale / Retail Others (Please specify) Refuse to answer
Public Opinion Programme, HKU Work Life Balance Survey 2009
Page 49
(DM6) Your personal monthly income, including bonus, is…? HK$ 10,000 or below HK$ 10,001∼20,000 HK$ 20,001∼30,000 HK$ 30,001∼40,000 HK$ 40,001∼50,000 HK$ 50,001 or above Refuse to answer Thank you for your time. If you have any questions regarding this interview, you can call XXXX-XXXX to talk to our supervisor Ms Louise Pun, or the Human Research Ethics Committee for Non-Clinical Faculties of the University of Hong Kong at XXXX-XXXX during office hours to verify this interview's authenticity and confirm my identity. Good-bye!
***** End of questionnaire *****

Public Opinion Programme, HKU Work Life Balance Survey 2009
Page 50
香港在職人士的生活及工作平衡調查 2009
問卷(定稿)
2009年 6月 26日

Public Opinion Programme, HKU Work Life Balance Survey 2009
Page 51
第一部分 自我介紹
你好,我姓 X,我係香港大學民意研究計劃既訪問員,我地宜家做緊一項意見調查,想訪問你一 D有關個人生活及工作既問題,我地只會阻你幾分鐘時間,請你放心,你既電話號碼係經由我地既電腦隨機抽樣抽中既,而你提供既資料係會絕對保密,請問可唔可以呢? [R1] 核實電話號碼 [R2] 居住地區 [R3] 住戶人數 呢個調查既訪問對象係 15歲或以上操粵語、國語或英語既香港全職人士。
第二部分 選出被訪者
[S1] 請問你屋企有冇 15 歲或以上既全職人士係度,因為我地要隨機抽樣,如果多過一位,請你叫即將生日果位黎聽電話。(如被訪者暫未能接受訪問,訪問員另約時間再致電。) 有 冇 拒答 [S2] 請問閣下宜家係唔係全職工作人士?【訪員讀出:全職的定義為每星期最少工作 5天,或一星期總工作時間不少於 40小時】 係 唔係 拒答
訪問完成,多謝合作,拜拜。(結束訪問)
訪問完成,多謝合作,拜拜。(結束訪問)

Public Opinion Programme, HKU Work Life Balance Survey 2009
Page 52
一. 被訪者的生活及工作模式 [Q1] 就以你上個月既全職工作為例,你平均每個星期實際工作咗幾多個鐘頭?
________ 小時 (入實數) 唔知/難講 拒答
[Q2] 就以上個月為例,你每個星期實際有幾多個鐘頭參與個人或私人既活動,好似同朋友聚會或者參加一 D閒餘活動,例如運動以及旅行?
________ 小時 (入實數) 唔知/難講 拒答
[Q3] 對你黎講,你覺得最理想但合乎現實既工作同埋私人活動既時間分配比例應該係點樣?時間分配必須係一個合乎現實既比例,以及扣除瞓覺時間。(比例相加必須等如 100%)
______%工作及_____%私人活動 唔知/難講 拒答
二. 生活及工作平衡所面對的問題及理想解決方法 [Q4] 請用 0-10分評價一下你自己,達到最理想生活及工作平衡方面既邊個階段?0分代表現時情況非常差,10分代表已達到非常理想階段、5分代表一半半。
______[入實數] 唔知/難講 拒答
第三部分 意見部分

Public Opinion Programme, HKU Work Life Balance Survey 2009
Page 53
[Q5] 係過去既 12 個月,你有冇試過因為生活及工作失去平衡而遇到以下既問題?【訪員依照電腦排序讀出首 8項答案,可選多項】(訪員讀出:我宜家會讀出一 D答案,你可以選出多項) 因長時間工作而令生產力及工作質素嚴重下降 經常感到疲累,渴睡及極度疲倦 我很容易生病/我要請多左病假 我完全冇私人時間進行閒餘活動或運動等 我既工作影響我同朋友既關係 我冇足夠時間同自己既伴侶或家人相聚 每次工作後我感到身心崩潰、抑鬱及氣餒 因為工作壓力導致我失眠及冇胃口 以上全部沒有 唔知/難講 拒答
[Q6] 係現時既經濟環境下,你認為以下邊一項係對你達到生活及工作平衡既最大既障礙呢?【訪員依照電腦排序讀出首 11項答案,只選一項】(訪員讀出:我宜家會讀出一 D答案,你只可以選出一項)
工作既穩定性 長時間既工作 工作時間無彈性 工作地點 上司既態度 同事壓力及競爭 公司人事變動 照顧幼兒/家人 運動及進修時間不足 財政狀況/財富管理 公司精簡人手而增加工作量 我覺得冇特別既障礙 其他 (請註明) 唔知/難講 拒答

Public Opinion Programme, HKU Work Life Balance Survey 2009
Page 54
[Q7] 係現時既經濟環境下,為咗達到一個較佳既生活及工作平衡,你最希望得到以下邊一
項工作既安排或者設施?【訪員依照電腦排序讀出首 11項答案,只選一項】(訪員讀出:我宜家會讀出一 D答案,你只可以選出一項)
彈性上班時間 5天工作週 間中可選擇在家工作 免費運動設施 托兒所/幼兒照顧服務
就業支援的服務(如情緒輔導計劃,壓力管理訓練) 男士產假 更長的女士產假 (現法例規定產假為 10星期) 工作共享 (即由多於一位員工分擔同一個全職職位)
短暫休假/停薪留職/無薪假期 享有更多有薪假期 其他(請註明) 唔知/難講 拒答
[Q8] 以你公司/上司所付出既資源黎講,你覺得佢地有幾努力去提昇公司員工係生活及工作既平衡?請用 0-10分評價,0分代表完全冇付出任何努力、10分代表付出很多努力、5分代表一半半。
______[入實數] 唔知/難講 拒答
[Q9] 係現時既經濟環境下,你認為你公司/上司會處理生活及工作平衡對你黎講重唔重要呢?(訪問員追問程度)
非常重要 幾重要 一半半/中立 幾唔重要 完全唔重要 唔知/難講 拒答

Public Opinion Programme, HKU Work Life Balance Survey 2009
Page 55
[Q10] 你會唔會考慮辭職或者轉工以達到更好既生活及工作平衡?
會 唔會 唔知/難講 拒答

Public Opinion Programme, HKU Work Life Balance Survey 2009
Page 56
我想問你些少個人資料,方便分析。 [DM1] 性別 男 女 [DM2a] 年齡 (Age) _______(準確數字) 唔肯講 [DM2b] 【只問不肯透露準確年齡被訪者】年齡 (範圍)[訪問員可讀出範圍] 15-19歲 20-24歲 25-29歲 30-34歲 35-39歲 40-44歲 45-49歲 50-54歲 55-59歲 60歲或以上 唔肯講 (DM3) 教育程度
小學或以下
中學
預科
專上非學位 專上學位
碩士學位
博士學位
拒答
第四部分 個人資料

Public Opinion Programme, HKU Work Life Balance Survey 2009
Page 57
(DM4) 職位(Pls refer to attached “occupation” sheet for detailed categorizations) 白領: 專業人士/經理/行政人員 商人/東主 辦工室:技術白領人士 辦工室:非技術白領人士 藍領: 工廠/舖位/户外:技術藍領人士 工廠/舖位/户外:非技術藍領人士 拒答
(DM5) 行業
銀行及金融 商業服務 建造業 教育 電影/娛樂事業 政府/公共事務 出入口貿易 資訊科技 保險 法律、會計、專業資訊服務 製造業 傳媒 醫療、衞生及福利 石油及能源 其他個人服務 房地產 食肆/酒店 通訊業 運輸 倉務 批發/零售 其他(請註明) 拒答

Public Opinion Programme, HKU Work Life Balance Survey 2009
Page 58
(DM6) 請問你既個人每個月既平均收入大約係....?(包括花紅) HK$ 10,000或以下 HK$ 10,001∼20,000 HK$ 20,001∼30,000 HK$ 30,001∼40,000 HK$ 40,001∼50,000 HK$ 50,001或以上 拒答 問卷已經完成,多謝你接受訪問。如果你對呢個訪問有任何疑問,可以打熱線電話
XXXX-XXXX同我地既督導員潘小姐聯絡,或者係辦公時間打 XXXX-XXXX向香港大學操守委員會查詢今次訪問既真確性同埋核對我既身分。拜拜!
*****問卷完*****
Public Opinion Programme, HKU Work Life Balance Survey 2009
Page 59
Appendix 7 Definition of Occupation Categories

Public Opinion Programme, HKU Work Life Balance Survey 2009
Page 60
Definition of Occupation Categories: Working: Prof (Professional)/ Mgr (Manager)/ Exec (Executive) 專業人士/經理/行政人員 - company directors and managers - members of recognised professions/ university and secondary school
teachers - administrative and executive officers in the civil service - gazetted officers in the uniformed services - editors/ journalists - technologists - artists/ actors/ musicians/ designers Trad (Trader)/ Prop (Proprietor) 商人/東主 - self-employed merchants - owners of shops and other properties Office: skilled 技術白領人士 - office supervisors - secretaries - nurses - kindergarten and primary school teachers/ private tutors - inspectors and sergeants in public services - reporters - models - singers - sales representatives - auditing, account and surveyor clerks Office: unskilled 非技術白領人士 - general clerks - receptionists - typists Factory/Shop/Outdoor : skilled 技術藍領人士 - factory supervisors - carpenters - cooks - drivers - foremen

Public Opinion Programme, HKU Work Life Balance Survey 2009
Page 61
- farmers/ fishermen/ gardeners - blacksmiths/ mechanics - policemen/ soldiers - tailors/ shoemakers/ barbers - photographers - captains (hotel/ restaurant) - monks - outdoor sales - life guards - soccer players - detectives - escorts/ tourist guides - jockeys - herbalists Factory/ Shop/ Outdoor: unskilled 非技術藍領人士 - factory workers - cleaners - labourers - messengers - postmen - seamen - servants - waiters - shop assistants - hawkers - security guards - shop sales - cashiers Non-working: Retired/ Unemployed - exclude non-working housewives Student - includes full-time students only - those that claim to be full-time students but have part-time jobs are also considered in this category
Full-time housewife - not working