work package1: becoming a smart energy city,...
TRANSCRIPT

Page 1
Work Package1: ‘Becoming a smart Energy City, state of the art and ambition’
July 30, 2014 Including:
Definition of Smart Energy City Deliverable 1.2 Definition, key elements and indicators
Becoming a Smart Energy City Deliverable 1.1 State of the art of the 6 TRANSFORM cities
Comparative analysis based on SWOT Deliverable 1.3 Systematic of Intake Workshops, comparative analysis

Page 2
TABLE OF CONTENT
Introduction ................................................................................................. 3
1. General introduction .................................................................................................. 3
2. WP1 objectives and deliverables ............................................................................... 6
Part 1: Definition of a Smart Energy City .................................................. 8
1. Definition of a Smart Energy City (SEC) .................................................................... 8
2. Key Elements ............................................................................................................ 9
3. ‘Key Performance Indicators’ (KPI’s) – two perspectives ......................................... 10
Part 2: Becoming a Smart Energy City – state of the art of the 6
TRANSFORM cities ................................................................................... 11
1. Introduction ............................................................................................................. 11
2.‘Soft’ Key Performance Indicators ............................................................................ 11
3. ‘Hard’ Key Performance Indicators – the baseline analysis ..................................... 13
Appendix A: State of the art reports ............................................................................ 14
Appendix B. Baseline - Providing context for Smart Energy Cities .............................. 14
Part 3: Comparative analysis based on SWOT ...................................... 15
1. Introduction ............................................................................................................. 15
2. Purpose & systematic of the Intake Workshops ...................................................... 16
2.1 Background, purpose & objective of the Intake workshops ................................ 16
2.2 What was the systematic - the intake workshops point by point ......................... 20
2.3 Example of a standard agenda .......................................................................... 23
3. Comparative analysis based on the SWOT ............................................................. 24
3.1 Short sum up of the results of the Cities SWOTs ............................................... 24
3.2 Analyzing: What are the common key issues the cities identifies? What are the
differences? ............................................................................................................. 26
3.3 Summing up – why and what can we learn/conclude from similarities and
differences? ............................................................................................................. 33
4. Conclusion – pointing to WP2 ................................................................................. 35
Appendix C: Intake reports of the 6 cities .................................................................... 36
Appendix D: Intake Workshop and SWOT methodology (PPs) ................................... 36

Page 3
Introduction 1. General introduction
TRANSFORM is a European Commission initiative within the European Research
Framework program FP7. The TRANSFORM goal is to drastically reduce CO2
emissions in cities, in order to realize local, and EU 20-20-02 targets; 20% lower
carbon emissions, 20% of energy from renewables and 20% increase in energy
efficiency by 2020. More specific, TRANSFORM is about finding the barriers that
block progress in reaching the 20-20-20 targets. TRANSFORM operates within the
broader perspective of Smart Urban City Development. And TRANSFORM aims to
enable cities to transform into low carbon, or Smart Energy, Cities.
TRANSFORM because…
TRANSFORM aims to find new models of city development and city redevelopment in
order to become Smart Energy Cities. This done by developing methods, sharing best
practices, sharing visions, sharing solutions and breaking down barriers that block
initiatives in order to reach these extensive and ambitious targets. TRANSFORM goes
further than only ambitions and aims, and will define actions to be taken in the
TRANSFORM cities and other cities within Europe to reach climate goals.
From their own experience, Transform cities know that solutions towards low carbon city
development have impediments. These impediments can have a political, economic,
social, financial, legal or technical background. The core of TRANSFORM is finding these
impediments. This is done by research; by comparing different solutions, by acquiring
knowledge from industrial partners, by the contribution from research partners. This is
done for example by collecting massive data, by making data visible in city mapping, by
building tools to analyze data, by stakeholder management, by indicating barriers and
seeking for solutions, by sharing best practices and experiences in different cities and by
building Decision Support Environment tools. Solutions and actions to overcome these
barriers will result in a Transformation Agenda for every TRANSFORM city and
Implementation Plans for city districts. Moreover, TRANSFORM will deliver
recommendations for future EU policies in the field of Smart Cities and Communities.

Page 4
TRANSFORM is…
A consortium of:
Leading European SMART Cities including, Copenhagen, Genoa, Hamburg, Vienna,
Grand Lyon and Amsterdam. The cities are committed to strengthen their low-carbon
energy agendas – all with ambitious targets to reduce CO2, increase renewables and
improve energy efficiency.
The six cities are supported by energy companies, grid companies, commercial
partners and knowledge institutions on a quantitative and qualitative level to improve
and integrate the cities current energy strategies, and to help cities to find and
implement new strategies and actions needed for sustainable transformation in the
urban context.
Figure 1 All partners of TRANSFORM
TRANSFORM does…
TRANSFORM will give insight into smart city development; deliver methodologies for
cities to change, build and improve energy strategies, and urban energy development
plans. Strategy and operations will be brought together in different levels and scale: the
level of the city, the regional level, and the level of the neighborhood.

Page 5
TRANSFORM Setup
The whole program of TRANSFORM is divided into six “Work Packages”, led by the
different partners as shown below.
Figure 2: Work Package Structure (own illustration)
Work Package Brief description:
- Work Package 1 focuses on the definition of SMART cities, The state of the art of
cities, on Key Performance Indicators (KPI’s) on analyses bases on SWOT.
- Work Package 2 focuses on Transformation Agenda’s (TA) per city, on a generic
transformation agenda, on Key Considerations and it offers a framework for the
city to improve their existing energy policies. It integrates experiences and results
of WP1 and WP3 in order to step by step become a Smart Energy City. The aim
of WP2 is to build a Qualitative Decision Tool, to support governmental and
entrepreneurial decision making.
- Work Package 3 is about building city information maps, based on energy
datasets and all related items like building quality, wind potentials, solar potentials,
heat sources, storage possibilities, big energy consumers etc. This package will
build a web-based tool to make quantitative decisions for change. It will deliver a
game to support transition and integral decision making for stakeholders.
- Work Package 4 studies a Smart Urban Lab in each of the cities, i.e. a district,
with a transformation project. The places where cities are learning or experiencing
transitional challenges, solutions and problems. The lessons learned are used in
other work package.

Page 6
- Work Package 5 is about communicating, disseminating and promoting the
replication of the Transform process in other cities called “Buddy Cities”.
- Work package 6 coordinates the TRANSFORM project
2. WP1 objectives and deliverables This report summarizes the work undertaken under the EU co-funded FP7 project
Transformation agenda for low carbon cities under Work Package 1: Becoming a Smart
Energy City, state of the Art and Ambition.
This report reports the work undertaken during the Work Package 1 period. Furthermore,
it serves as a starting point for the replication of the methods developed in this work
package with regards to defining and making a starting point for cities’ transformation
towards becoming smart energy cities.
The overall objective of Work Package 1 is to define what a Smart Energy City (SEC) is
and to provide cities with methods to assess how ‘smart’ one’s own city is (a state of the
art report and a baseline analysis). Furthermore the objective is to establish a
methodology for a SWOT analysis of the cities in order to establish “a starting point” for
the transformation of the city to becoming a Smart Energy City. In this way, Work
Package 1 makes a starting point for Work Package 2, the making of a Transformation
Agenda.
Work Package 1 has three deliverables, all collected in this report:
D.1.2: Development of a definition of what a smart energy city is, including a set of
Key Performance Indicators
D.1.1: Making a clear outline of each of the participating cities and their state of the art
in integrated energy planning.
D.1.3: Making a comparative analysis of the participating cities based on a SWOT
analysis of each of the cities. Outline of the report
Part 1 starts with establishing a definition of what a Smart Energy City is seen from the
TRANSFORM perspective. It furthermore describes what the main Key Performance
Indicators (KPI’s) are that should be observed to become a smart energy city.
Additionally it describes how this definition of a Smart Energy City and the KPI’s will be
used throughout the TRANSFORM project to guide the work.

Page 7
Part 2 gives a clear outline of the status of each of the participating cities in
TRANSFORM. This part summarizes the overall method and the conclusions regarding
establishing the state of the art and a baseline report for the participating cities.
In annex A, the ‘The state of the art of the cities’ and the ‘soft’ KPI’s (see description later)
are described. In annex B, the ‘Baseline Analysis Report’ and the ‘hard’ KPI’s (see
description later) are described, including the context in each of the participating cities in
terms of climate, energy assets, ambitions, targets and main possibilities in terms of
energy efficiency, flows and energy production.
Part 3 describes the systematic of making a SWOT analysis (Strength, Weakness,
Opportunities and Threats) of the relevant “action areas” for becoming a Smart Energy
City, through the steps in the so called ‘Intake workshops’, bridging the initial analysis and
the “Transformation agenda”. For definition of these elements, see later. Furthermore part
3 contains a comparative analysis of the 6 cities in the TRANSFORM project based on
these SWOT analyses. The reports of the Intake Workshops from each of the
participating cities are included in annex C.
The sum up: The work in Work Package 1 can be described as a sort of process where a
mirror is held up before each of the participating cities. It examines the cities’ current
performance across a range of sectors, and shows the needs to improve in order to get to
a well-defined state of being a Smart Energy City (SEC). The idea of the TRANSFORM
project is not to compare the results or performance between the 6 cities but to help the
cities in improving their transformation process toward a SEC.
Some cities already have detailed sustainable Energy Action Plans (SEAPs) and some
cities will be just at the beginning of the road of establishing sustainable energy plans, city
improvement etc. In TRANSFORM, the aim is to establish a generic concept on how to
become a SEC by the help of a Transformation Agenda. And in doing this, some cities
will realize that they more or less have started the way of transforming towards a SEC
and will be able to go into the methodology in a quite late stage, while other cities will
have to start at the very beginning.
The results from Work Package 1 will be the input for Work package 2 and 3, where the
State of the Art report will provide an input for the Transformation agenda in Work
Package 2 and the State of the Art and the SWOT analysis will provide a basis for the
decisions to be tested in work package 3.

Page 8
Part 1: Definition of a Smart Energy City
1. Definition of a Smart Energy City (SEC) Many have tried to define “Smart Energy Cities” (SEC) but there is no general consensus
on a definition. In particular the definition can be more or less technical and it can be
defined at varying degrees of abstraction. Since there is no general agreement on what a
Smart Energy city is, it has been needed in the TRANSFORM project to make a definition
to guide the following work.
Following this, the TRANSFORM definition of a Smart Energy City is as follows:
“The Smart Energy City is highly energy and resource efficient, and is increasingly powered by renewable energy sources; it relies on integrated and resilient resource systems, as well as insight-driven and innovative approaches to strategic planning. The application of information, communication and technology are commonly a means to meet these objectives. The Smart Energy City, as a core to the concept of the Smart City, provides its users with a liveable, affordable, climate-friendly and engaging environment that supports the needs and interests of its users and is based on a sustainable economy.”
As it can be seen, the Smart Energy City has been defined very concrete. This because
there has been a need to measure the level of “smartness” and at the same time there
has been a need to find some key elements which are crucial for becoming a Smart
Energy City.
The 8 key elements, included in the definition, are:
• Resource system integration
• Access to energy services
• Resilience
• Energy Efficiency
• Renewable Energy
• Active and engaged users
• Sustainable Economy
• Smart Governance These key elements are elaborated below. In the following Figure 1, the relations between the definition of a smart, City, a Smart Energy city and the key elements are illustrated.

Page 9
Figure 1: Illustration of the relations between the definition of a smart, City, a Smart Energy city and the key elements.
As it can be seen, to become a ‘Smart Energy City’ and to have Smart projects, it is
needed to provide Smart City infrastructure, based on ICT, resource systems, strategic
planning, energy city objectives etc. Using the Smart City infrastructure will provide the
city with means to achieve the needed efficiency for energy and resources, promote the
sustainable energy production and ensure the social and financial basis.
2. Key Elements As stated above, to define the Smart Energy City a number of key elements were
identified. In total, eight key elements were identified. These eight elements have formed
the basis of the analysis of the 6 cities in the TRANSFORM project and are furthermore
recommended to be the key areas of interest of other cities that want to become a Smart
Energy City. The reason for this can in brief be explained as follows:
• Resource system integration: It is strongly believed that any system in a city in
the future cannot be seen as an isolated system; heating and cooling are two sides of the same coin, waste is closely related to energy and resources, energy is not only electricity, gas, heating but a combination of these sources.
• Access to energy services: If no services are provided, no system, no city is present.
• Resilience: With the expected changes in climate, resilience to any kind of changes is a key factor.
• Energy Efficiency: Since energy sources for some will be scarce, for other very expensive, and others again will have great impact on the climate, energy efficiency will be a key factor.
• Renewable Energy: Renewable energies will be a need to prevent further climate changes.

Page 10
• Active and engaged users: If the users of systems are not involved, taken responsibility, active and engaged, the systems will not provide the expected results.
• Sustainable Economy: If it isn’t economical feasible for the users of a city to use the provided services of energy etc., the systems will not be sustained.
• Smart Governance: The users of the city shall have a direct and immediate influence on the needed decisions, both on their own situations and their possible solutions and also on the overall governance of the city. This can only be provided through new interactive intelligent decision systems.
3. ‘Key Performance Indicators’ (KPI’s) – two perspectives In connection with the definition of a Smart Energy City and the key elements a number of
Key Performance Indicators (KPI’s) were established. The reason for this was a need to
measure how far the cities were from the ideal situation - the Smart Energy City level. If a
city wants to become a Smart Energy City, it is also needed to know, where it is situated
today.
In the project it very early became clear that the actual situation, or level of “smartness” of
a city, can be described in two ways: 1) The actual situation on energy performance,
measured on consumption or activities, or 2) The actual situation on a policy scale,
measured on policies, strategies and visions. The TRANSFORM project therefore found it
relevant to operate with both sets of KPI’s
The KPI’s for the actual situation/energy performance were given the nickname “hard
KPI’s”, since they were based on measureable facts (also called a baseline analysis). The
KPI’s for measuring the actual political actions and involvement were given the nickname
“soft KPI’s” (which – together with the baseline analysis – forms the description of the
‘state of the art of the cities’). The description of these KPI’s and how they have been -
and can be - used to make an analysis of cities, is the subject of Part 2 “Becoming a
Smart Energy City – state of the art of the 6 TRANSFORM cities”.

Page 11
Part 2: Becoming a Smart Energy City – state of the art of the 6 TRANSFORM cities
1. Introduction The State of the Art report is to be a snapshot in time of a city, in this case the six cities
in the TRANSFORM project. This is the reference point, from which the establishment or
improvement of the Transformation Agenda will start, and can be used at any time to find
the progress achieved during the transformation of the city to a Low Carbon city.
The Transformation Agenda is the topic of Work Package 2 but can here just be
described as the political adopted set of goals, linked to specific actions, which will lead to
achievement of the European Union’s 20-20-20 goals:
A 20% reduction in EU greenhouse gas emissions from 1990 levels;
Raising the share of EU energy consumption produced from renewable resources
to 20%;
A 20% improvement in the EU's energy efficiency.
The KPI’s then provide a set of parameters or metrics against which a city can monitor
their progress towards becoming a Smart Energy City (defined in Part 1), aiming to
achieve the 20-20-20 goals.
As explained above, the TRANSFORM project found it relevant to establish two sets of
KPI’s to make this ‘State of the Art’ report/description of a city’s level of ‘smartness’: 1)
The ‘soft’ KPI’s, focusing on the actual situation on a policy scale, measured on policies,
strategies and visions and 2) The ‘hard’ KPI’s, focusing on the actual situation on energy
performance, measured on consumption and activities. These are both dealt with below.
2.‘Soft’ Key Performance Indicators When working with the definition of the SEC and the key elements (cf. above) it very soon
became clear that cities were working with the key elements on different levels - ranging
from “no consideration” to “fully implemented policies and strategies”. It also became
clear that the different approaches and political commitment in cities had a significant
influence on the actual level of “smartness” or the transformation of the city, from a
“modern and mature city” to a city using the new possibilities for data driven development
(a “smart city approach”).

Page 12
This lead to establishing an approach for measuring a city’s performance within the area
of the definition of a SEC, dividing the “maturity” of the city in four levels: From level 1
(which represents a rough position due to smartness) through level 2, 3 and up to level 4
(which represents the level of the Smart Energy City). This methodology can be used by
cities to make a self assessment to define their level of “smartness” and at the same time
to provide the city with inspiration for developing a way to become a Smart Energy City.
In the following table a description of this level 1 - 4 is made. In the Appendix A, the full
table of all key elements and the four levels are shown.
Key Element: Access to energy services Access to reliable, affordable and sustainable energy services for all energy users, which includes electricity, heating, cooling and gas. Affordable energy is defined as total energy bills not amounting to more than 10% of total household income. The Smart Energy City uses strategies and future planning to increase the affordability of energy to all its citizens, while decreasing future price risks. Furthermore, the City may offer new services to its inhabitants to help decrease individual energy use, and maximise efficiencies.
KPI Categories
KPI (Level 1/rough)
(Level 2)
(Level 3)
(Level 4/smart)
2.1 Access to affordable energy services
Decision to develop strategy to improve access to energy services, incl. electricity, heating and/or cooling networks.
Develop and publish city strategy to increase accessibility to energy services, incl. electricity, heating, and/or cooling networks.
Imp. of City strategy to increase accessibility energy services ( (incl. pilot projects - public, private and PPP)
City-wide-roll-out of projects to increase access to energy services, and extended cooperation in form of PPP as well as public and private initiatives on-going
Low affordability of people’s access to energy services and/or decision to develop programme to address low affordability.
Develop and publish programme to address low affordability
Imp. of programme to address low affordability (incl. pilot projects - public, private and PPP)
City-wide-roll-out of programmes for making affordable access to energy services.
Table 1: Illustration of the four levels connected to the Key Element “Access to energy services”

Page 13
The above Level 1 – 4 tool (the ‘soft’ KPI’s), together with the “hard” KPI’s in the “baseline
reports” (below) have been used to create a ‘state of the art’ description of each of the
participating cities. These descriptions can be found in the Appendix A. Here is also
shown a blank questionnaire that could be used by any city to make a self assessment on
ones city’s ‘state of the art’ in relation to becoming a Smart Energy City (Appendix C).
3. ‘Hard’ Key Performance Indicators – the baseline analysis The so called ’hard’ KPI’s provide a set of parameters or metrics against which a city can
monitor their progress towards becoming a smart energy city. And at the same time the
city can use the KPI’s to measure its performance to other cities situated within the same
geographical and climatic conditions. The information on cities KPI’s can be obtained
from many of the surveys published each year in different magazines etc.
To make this baseline analysis, questions have been asked regarding the cities status
across six sectors: Energy, Waste, Water, Transport, Buildings and ICT. The questions
have been selected as follows:
• To provide a broad coverage across the cities sectors; • Answers could be easily provided by the cities, using existing data with minimal
calculation or analysis; and • In line with previous work carried out by ARUP and Accenture on Smart Cities The questionnaire also contained a ‘powers’ assessment tool; this is used to establish a
city authority’s level of influence in each sector. For each of the six sections, the cities
were to report their level of influence over the visions, budget and policies.
The findings of the ‘hard’ KPI evaluation are summarised in six reports; one for each city
(See Appendix B, Providing context for Smart Energy Cities). These findings will –
together with the ‘soft’ KPI’s - be one of the starting points from which the cities will begin
its transition to a Smart Energy City, reporting on as well the present performance of the
city with in the energy area (among others areas) as well as the present situation on
plans and strategies for Smart City initiatives.

Page 14
Appendix A: State of the art reports Amsterdam
Copenhagen
Hamburg
Genoa
Lyon
Vienna
Appendix B. Baseline - Providing context for Smart Energy Cities Baseline analysis method manual
Baseline Analysis reports of the 6 cities

Page 15
Part 3: Comparative analysis based on SWOT
1. Introduction The aim of this third part of WP 1 has been to link the work on State of the Art data
collection and the Key Performance Indicators (KPIs) to defining the main areas of
improvement due to energy related issues and bring these to the WP2/Transformation
Agendas.
This third part of the WP1 report thus describes the method to perform the SWOT
analysis (Strength, Weakness, Opportunities and Threats) and introduces two new
elements in the WP1 and WP2 work: the Intake Workshop and the PESTLEGS analysis
(Political involvement, Economics (financial feasibility market development), Social
(stakeholder engagement and acceptance), Technological enablers, Legislation,
Environment, Governance and Spatial opportunities). In this way, it forms the bridge from
the work in the WP1 to the WP2 (TA).
During the work in WP1 and in starting up the WP2, it namely became clear that a
systematic approach was needed, to bring all the information collected during the work
with the KPI’s and the gathered knowledge from the SWOT analysis to the next step of
forming the Transformation agenda. And that it was needed to do this in a focused way,
so that not too many visions and goals were brought to the table.
This approach became the so called ‘Intake Workshop’ which in its basis is a two day
guided workshop where the findings from the State of the Art city report and the
established level of ‘Smart City’ness’ goes through a structured process with the aim to
focus on the most important and applicable energy related themes for the city. Thereby,
the number of themes is “down sized” to a manageable number (3 – 5). It was also
decided to identify overarching themes, which are relevant for all cities. These are called
Key Considerations (KC) (in the DoW named “cross cutting themes”). The KCs are further
defined and analysed in WP 2.
Therefore, in this last part of the WP1 report, the systematic for the Intake Workshop,
including the SWOT and PESTLEGS approaches will be dealt with, an analysis of the
approach will be given and the results from the 6 Intake Workshops in the 6
TRANSFORM cities will be attached.
Page 16
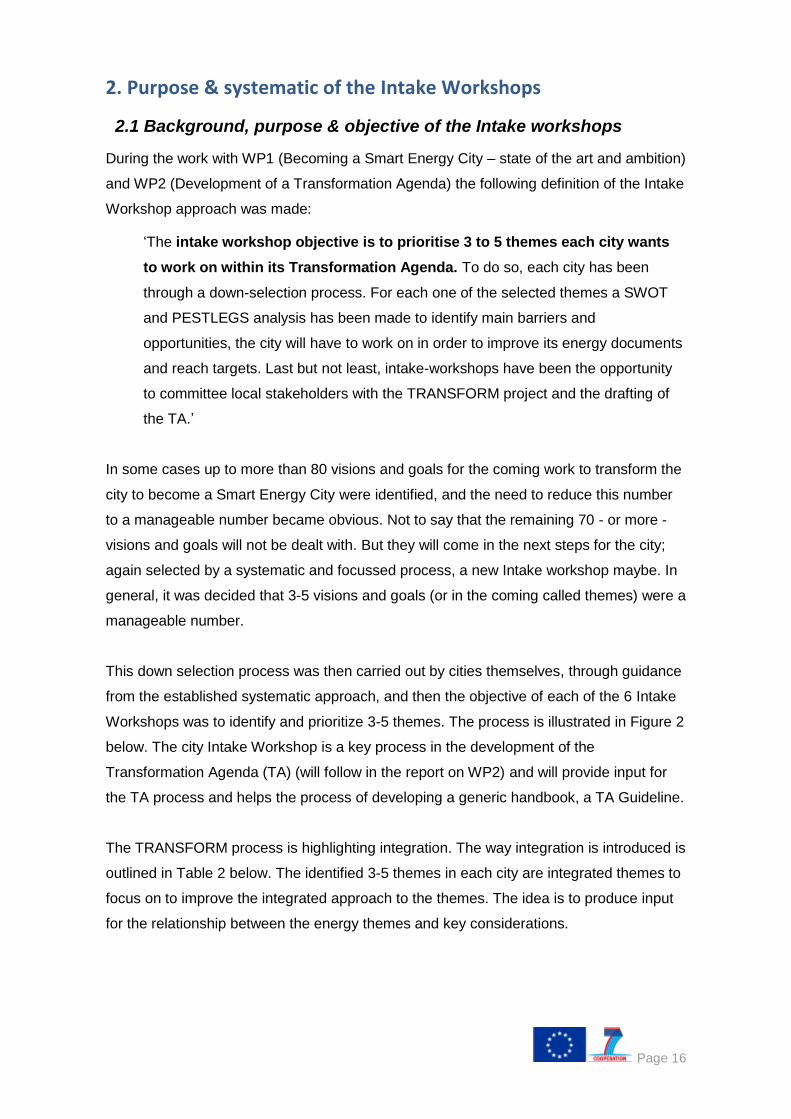
2. Purpose & systematic of the Intake Workshops
2.1 Background, purpose & objective of the Intake workshops
During the work with WP1 (Becoming a Smart Energy City – state of the art and ambition)
and WP2 (Development of a Transformation Agenda) the following definition of the Intake
Workshop approach was made:
‘The intake workshop objective is to prioritise 3 to 5 themes each city wants
to work on within its Transformation Agenda. To do so, each city has been
through a down-selection process. For each one of the selected themes a SWOT
and PESTLEGS analysis has been made to identify main barriers and
opportunities, the city will have to work on in order to improve its energy documents
and reach targets. Last but not least, intake-workshops have been the opportunity
to committee local stakeholders with the TRANSFORM project and the drafting of
the TA.’
In some cases up to more than 80 visions and goals for the coming work to transform the
city to become a Smart Energy City were identified, and the need to reduce this number
to a manageable number became obvious. Not to say that the remaining 70 - or more -
visions and goals will not be dealt with. But they will come in the next steps for the city;
again selected by a systematic and focussed process, a new Intake workshop maybe. In
general, it was decided that 3-5 visions and goals (or in the coming called themes) were a
manageable number.
This down selection process was then carried out by cities themselves, through guidance
from the established systematic approach, and then the objective of each of the 6 Intake
Workshops was to identify and prioritize 3-5 themes. The process is illustrated in Figure 2
below. The city Intake Workshop is a key process in the development of the
Transformation Agenda (TA) (will follow in the report on WP2) and will provide input for
the TA process and helps the process of developing a generic handbook, a TA Guideline.
The TRANSFORM process is highlighting integration. The way integration is introduced is
outlined in Table 2 below. The identified 3-5 themes in each city are integrated themes to
focus on to improve the integrated approach to the themes. The idea is to produce input
for the relationship between the energy themes and key considerations.

Page 17
A key part of the integrated process of down selecting themes is to involve stakeholders
in the process. This is done through the city Intake Workshop. The city Intake Workshop
should then lead to city implementation plans and development of the city TA’s.
The SWOT and a PESTLEGS analysis were used at each of the 6 city Intake Workshops
to identify main barriers and opportunities for each of the selected themes. The objective
of using the SWOT and PESTLEGS analysis was to eventually identify commitments and
responsibilities in achieving a successful outcome for each of the themes.
Table 2. Outline of inputs to the city intake workshops
TA guideline Intake workshop input
1) Integrated themes Produce 3 integrated themes to focus on to
improve integrated approach to the themes.
Produce input for relationship between energy
theme and key considerations (e.g. technology
enablers, citizen participation, financial models
etc.) through SWOT
2) Integrated process Set up and test integrated process by inviting
external stakeholders into the decision-making
process
Test SWOT methodology and down-selection
methodology
3) Integrated action Set up actionable next steps to lead to
implementation plans
Set governance structure for the next steps within
the Transformation Agenda
The preparation of the Intake Workshops started up to 2-3 month before the actual
workshop was performed, following the approach described in the presentation in
appendix D. The city prepared a long list of possible themes and this long list was
reduced to a “short list” containing around 10-20 themes, that were discussed during the
Intake Workshop.
Beside the work with the long and the short list, the city invited relevant internal and
external stakeholders for collaboration on the themes to the Intake Workshop. The
process is illustrated in Figure 2.
Page 18
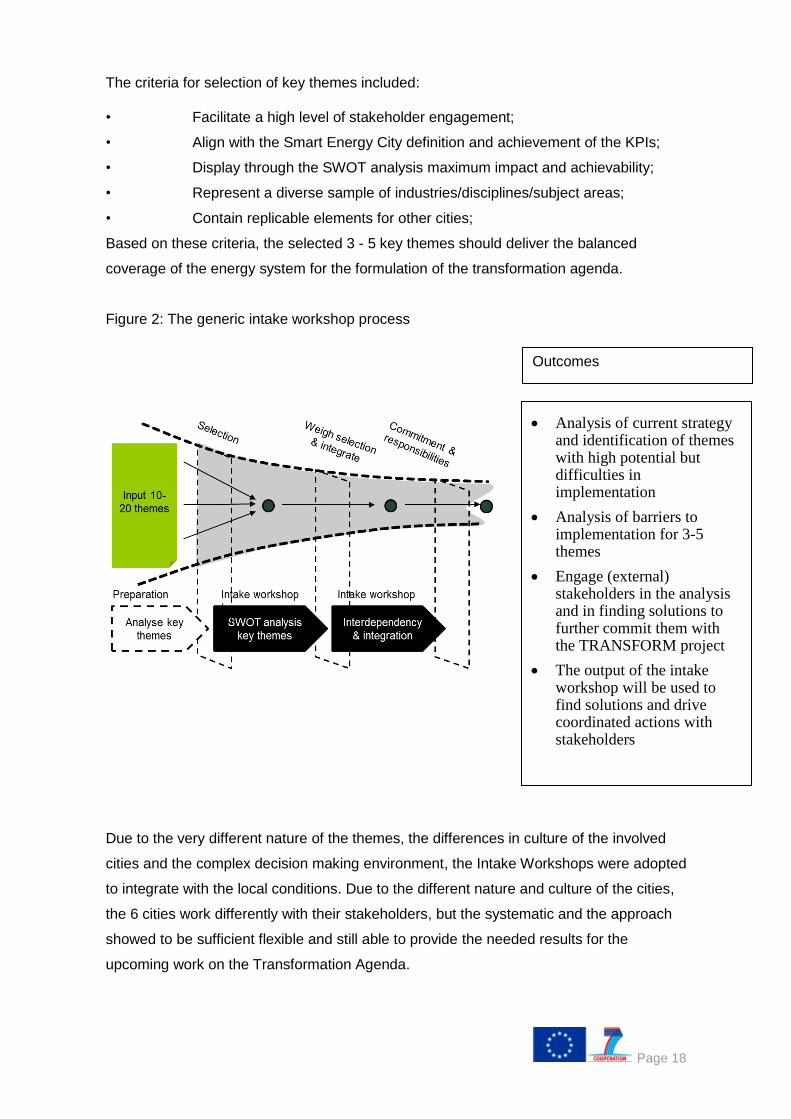
The criteria for selection of key themes included:
• Facilitate a high level of stakeholder engagement;
• Align with the Smart Energy City definition and achievement of the KPIs;
• Display through the SWOT analysis maximum impact and achievability;
• Represent a diverse sample of industries/disciplines/subject areas;
• Contain replicable elements for other cities;
Based on these criteria, the selected 3 - 5 key themes should deliver the balanced
coverage of the energy system for the formulation of the transformation agenda.
Figure 2: The generic intake workshop process
Due to the very different nature of the themes, the differences in culture of the involved
cities and the complex decision making environment, the Intake Workshops were adopted
to integrate with the local conditions. Due to the different nature and culture of the cities,
the 6 cities work differently with their stakeholders, but the systematic and the approach
showed to be sufficient flexible and still able to provide the needed results for the
upcoming work on the Transformation Agenda.
Analysis of current strategy and identification of themes with high potential but difficulties in implementation
Analysis of barriers to implementation for 3-5 themes
Engage (external) stakeholders in the analysis and in finding solutions to further commit them with the TRANSFORM project
The output of the intake workshop will be used to find solutions and drive coordinated actions with stakeholders
Outcomes

Page 19
The down selection process:
One of the focus areas of the TRANSFORM project is on themes that have a relatively
high impact and are difficult to implement. This is illustrated in Figure 2. The
Transformation Agenda will focus on themes, including processes and projects which
have a high impact on reducing of CO2 emissions, increase of renewable energy and
increase in energy efficiency. These specific impacts are outlined in the “Box 1” on the
right side of the figure. The vertical level illustrates an increasing level of impact. The
horizontal level reflects the “ability to implement”. A high ability to implement means that
they are easy to implement and the lower ability to implement means the projects are
harder to implement. The topics which cover “ability to implement” are listed in ”Box 2”
(PESTLEGS) on the right side of Figure 3.
Figure 3: The Impact/Ability relationship in TRANSFORM.
1. Impact on KPI’s
% Carbon reduction
% Renewably energy
% Energy Efficiency
…and other values concerning city sustainability (economy, society, environment)
2. Ability to implement
Political involvement
Economics (Financial feasibility / Market development)
Social (stakeholder engagement and acceptance)
Technological enablers
Legislation
Environmental governance
Governance (E-Governance)
Spatial opportunities
Impact
No Brainers Focus TRANSFORM
Low impact / longer term
issues Low hanging fruit
Cycling scheme / pilot
Retrofitting buildings
Ability 2
1

Page 20
2.2 What was the systematic - the intake workshops point by point
The main objective of the city intake workshop was for the city to identify and evaluate 3-5
themes in collaboration with their stakeholders. Table 3 is in number of themes summing
up the differences in the down-selection process among cities; from initial brainstorm of
down-selection process before the intake workshop to the final selection of 3-5 themes on
the intake workshops.
Table 4 shows the detailed questioned the cities were asked to fill out for each of the
themes. The aim was to try to elaborate on the themes as consistently as possible.
Table 5 is an illustration of a table in which the experiences of evaluation of the
PESTLEGS via SWOT analysis was captured. For each theme, the strengths,
weaknesses, opportunities and threats were evaluated on PESTLEGS. The evaluation for
each of the themes selected by the cities is included in the intake workshop report in
Appendix C.
The combination of reports will provide material (together with status quo reports) for the
strategic working group and for the organization and identification of Key Consideration
working groups (part of WP2). In order to produce the Transformation Agenda, the cities
will continue to work on the 3-5 themes with local stakeholders. Starting from the Intake
Workshop, cities will have about one year to work on the 3-5 themes with the objective to
come up with concrete measures, business plans and stakeholders commitment.
Table 3: How the down-selection process happened in numbers in each city
AMS Lyon CPH Gen HAM VIE
Initial brainstorm 28 28 22 8
Down selection before
Intake Workshop
3 8 6 3
Selection at Intake
Workshop
3 3 3 3

Page 21
Table 4: The table to be filled out at the city Intake Workshop for each theme
Name of the theme Theme X
Category [To which of the 6 categories, (Existing buildings, Waste
Management, Public Land Use, Water, Energy Supply, Transport) the
theme belongs?]
Description of the theme [What is the frame of the theme (please make the description
specific)? What are the main challenges that will be addressed?
What is the expected impact/outcome of the theme?]
Contribution to main KPI:
- Energy demand reduction
- CO2 reduction
- Renewable energy
production
- Energy efficiency
[What is the contribution of the selected theme to each of the main
KPIs? If you don’t have an exact value, explain how will you proceed
during project development to evaluate this contribution]
Value of the theme:
- Environmental
- Economic
- Social
[What is the contribution of the selected theme to each of the
presented values? How will you measure it?]
Other motivations for selecting
this theme
[Explain any other motivations that lead you to choose this theme]
Municipality involvement/
competencies
[Which departments of the municipality will be involved? What will be
their role?]
Key-actors [Who are the stakeholders (institutional actors, utilities, grid
operators, private companies) that are especially relevant to work on
this theme and that will be associated to the drafting of the TA (for
example by participating to working groups on this specific theme)?
What is the specific role of these key-actors? What is their respective
interest?]
Other actors [Is there any other actors that will be impacted/involved in this theme
but will not be necessarily associated to the TA drafting?]
Interaction between
stakeholders
[How do you think the stakeholders will be/are interacting between
each other?]

Page 22
Table 5: The table used to gather information at the city intake workshops to evaluate the
PESTLEGS using a SWOT analysis.
Theme X Leading question Strengths Weaknesses Opportunities Threads
Political Is the intervention
political supported?
Economical Is the intervention
economically feasible?
(is there a business
case)?
Social Will the intervention be
socially accepted?
Technical Is the intervention
technically feasible?
Legal Is the intervention in
coherence with the
existing legal
framework, is it
impacted by any legal
barrier?
Environmental Has the intervention
impact on energy
reduction, energy
efficiency, renewable
energy and/or CO2
reduction?
Governance Are all relevant
stakeholders involved
in the planning
process?
Spatial Is spatial design
(space and program)
part of the
intervention?

Page 23
Governance:
It is fundamental for the TRANSFORM process to involve local stakeholders as much as
possible in making of the TA. Each city will therefore have to identify a governance model
which will be used in their particular city. The city has the flexibility to define their own
process.
Leading questions:
How will stakeholder involvement be ensured during the entire process of the TA making?
Provide as much as possible information about the governance and participation process:
who will be the involved partners? At which steps of the process are they needed? How
will their inputs be included? How do you foresee the stakeholder commitment on the
implementation of measures (sign a Memorandum of understanding? Sign a concrete
action plan? Other?)?
The actual governance models decided in the cities have not been reported in the cities
Intake Workshops as cities are still working on this.
2.3 Example of a standard agenda
In table 6 the standard agenda for the city intake workshops is listed. Although the intake
workshops varied, the agenda was set up in general terms to be useful to all cities. The
Intake Workshop typically lasted 2 days in each city (See also Annex D).
Table 6: Outline of the generic agenda used by the cities for the Intake Workshop.
Introduction Presentation facilitator WP1
Introduce TRANSFORM
project & individual intro‘s
Present Baseline report /
KPIs and SEC definition
Set expectations & explain
TRANSFORM goals
Themes and objectives Presentation City Coordinator
The generic framework for
the TA, Focus Areas
Presenting the list of Tier
II themes considered
Understanding how
TRANSFORM can help to
achieve goals of the city
Plotting the themes Plenary exercise: Plotting the
themes
Plotting themes: cost
effectiveness versus
ability to implement
Initial analysis of what
themes face the largest
challenges

Page 24
Group discussion to select
main themes to SWOT
SWOT Group exercise (per Energy
theme)
Discuss SWOT per theme
with post-it notes
Consensus on the strengths,
weaknesses, opportunity and
threats
Discussion Synthesis and plenary
discussion
Designated group leader
presents SWOT
Discussion around
linkages and combined
opportunities
Overall consensus on main
barriers and identify linkages
between themes
Enabling environment Group exercise (per Cross-
cutting theme)
Formulation of hypothesis
to increase ability to
implement
Discuss governance
issues regarding
implementation
Identify clear mandate for
qualitative decision support:
Wrap-up Presentation WP2
Wrap-up from
TRANSFORM team.
What to expect in the next
year and a half of the
programme
Clear expectation setting for
stakeholders and
TRANSFORM next steps
3. Comparative analysis based on the SWOT
3.1 Short sum up of the results of the Cities SWOTs
The overarching theme of the TRANSFORM process is energy. It includes reduction in
CO2 emissions, increase use of renewable energy, reduced energy consumption and
increased energy efficiency. As these are the overarching themes they are not included
directly in the down-selection process of identifying and analyzing 3-5 themes.
The focus is to improve the integrated approach to the themes. The idea is to produce
input for the relationship between the energy themes and cross-cutting themes leading to
the city implementation plans and development of the city TAs.

Page 25
In Table 7 the 3-5 themes are listed for the 6 cities. Energy is – further to the themes
listed – to be seen as a target included in all the themes.
Table 7: List of themes selected by the 6 cities
An initial consideration of survey results show that the message has been positively
received by those participants that attended most of the Workshop. The cities may
connect the TA work with local strategies, which is one reason why the TAs will be
different among the cities. This may weaken the overall integration of how the TAs looks
for the 6 cities, but the flexibility allows the cities a higher integration with the current
situation in the city. Therefore this flexibility will eventually increase the success rate of
the TA’s.
The interconnectedness with local policies is outlined in Table 8. In the case of Vienna for
instance, the primary ambition of the Intake Workshop was to communicate the role of the
Smart City framework strategy of the city to major stakeholders in Vienna´s urban
governance regime.

Page 26
Judged purely on the basis of the attendees at the Vienna Intake Workshop the set up in
an international context (i.e. TRANSFORM) has proven to have a draw-in effect for local
actors. The Intake Workshop provided the possibility for otherwise segregated actors to
meet in a more or less neutral context.
Table 8: Outlines the policy initiatives with which the TRANSFORM process is integrated
for each city.
Main document Details TA integration
Amsterdam Amsterdam Energy
Strategy and year
program (2013)
Energy strategy, :
actualization 2013-
2014
The TA will be
addressing points of
improvement for the
city’s Energy
Strategy
Lyon Grand Lyon SEAP Year 2011
Timeframe for the
action plan 2020
Copenhagen CPH 2025 Climate
Plan
Target year 2025 The TA will be
addressing points of
improvements for
the CPH Climate
Plan
Genoa SEAP Baseline Year 2005,
Target year 2020
TA is a sort of
advancement of the
SEAP (how
implement it)
Hamburg
Vienna Vienna´s Smart City
Framework strategy
Year: 2014
Timeframe: 2050
The TA is integrated
with the strategy
3.2 Analyzing: What are the common key issues the cities identifies?
What are the differences?
Table 9 sums up similarities and differences identified through the city intake workshop
process. The comments are very generic in nature, but the aim of Table 9 is to give
generic comments and the aim was to only include a maximum of three comments on
each part of PESTLEGS

Page 27
Table 9: Outlines the summing up of similarities and differences between the cities based
on the PESTLEG issues
Issues Similarities Differences
Political Strong political will
Long tradition for strategic planning
Commitments on %CO2 reduction, RE and EE
Different degree of local vs. national/state political power
Some large cities are their own “state”
Different degree of control over local energy production and transport infrastructure
Economical Complexity of funding system
Financial Crisis still contributing to tight budgets
Cities are affected by the Financial Crisis at different degree
Social Stronger consciousness of
benefits
Decreasing affordability
Ageing population
Some cities are increasing in population and others are shrinking
Technical Development of better RE and
EE Technologies
Open Data initiatives
Introduction of smart meters
Quality of data
Data transparency
Difference is requirement for heat and cooling in the different cities
Legal Legal issues using RE
technologies (i.e. solar panels on roof tops)
Complexity and fragmentation of ownership structures
Legal boundaries to local energy markets
Ownership structures different among cities due to historic and cultural traditions
Environmental Lack of lifecycle approach
Commitments towards reduction of CO2 emissions
Commitments towards changing mobility patterns towards low carbon systems
Some cities already have a huge percentage of transportation with bicycles
Cities have different environmental settings with regard to air pollution exposure
Governance Lack of integrated approach
Accept of benefit of stakeholder involvement
Historically different level of stakeholder involvement in the cities

Page 28
Accept that the smart city concept requires intergovernmental cooperation and integration
Historically different level of intergovernmental cooperation and integration in the cities
The cross-analysis of the themes selection during each city’s Intake Workshop Session
and Intensive Lab Session (WP4), puts forward 6 relevant topics, named Key
Consideration.
The identification of these Key Considerations is based on:
- Transversal issues several cities are struggling with, - Good practices that a city have on theses issues and that can benefit to others
cities, - Competencies and interest knowledge and industrial partners are willing to
bring to the project.

Page 29
Key Consideration working groups have been set-up at the level project to help cities and
their partners to identify common barriers as well as good practices to share.
This work will contribute to the following deliverables:
- Transformation Agenda (D.2.2), - Qualitative decision support model (D.2.1) - Implementation Plans for each SUL (D.4.2)
A comparison between SWOT and PETSLEGS analysis extracted from city’s Intake
Workshop Report emphasizes the following challenges, barriers, strength and practices
on each KC topics.
Challenges Barriers Strength Practices
KC1:
Stakeholder
Management
- Optimize the energy planning
- Share a vision on urban holistic development
- Overcome barriers & improve process efficiency
- Lack of upstream dialog between actors
- Lack of shared goals & visions
- Existing misaligned interests: land price, energy price, …
- Recession period and standards regulations are not in favor of transition & innovation
- Political supported
- Win-win approach
- Practices developed on advanced Smart Cities
- Energy Atlas of Amsterdam
- Nordhavnen project
Page 30
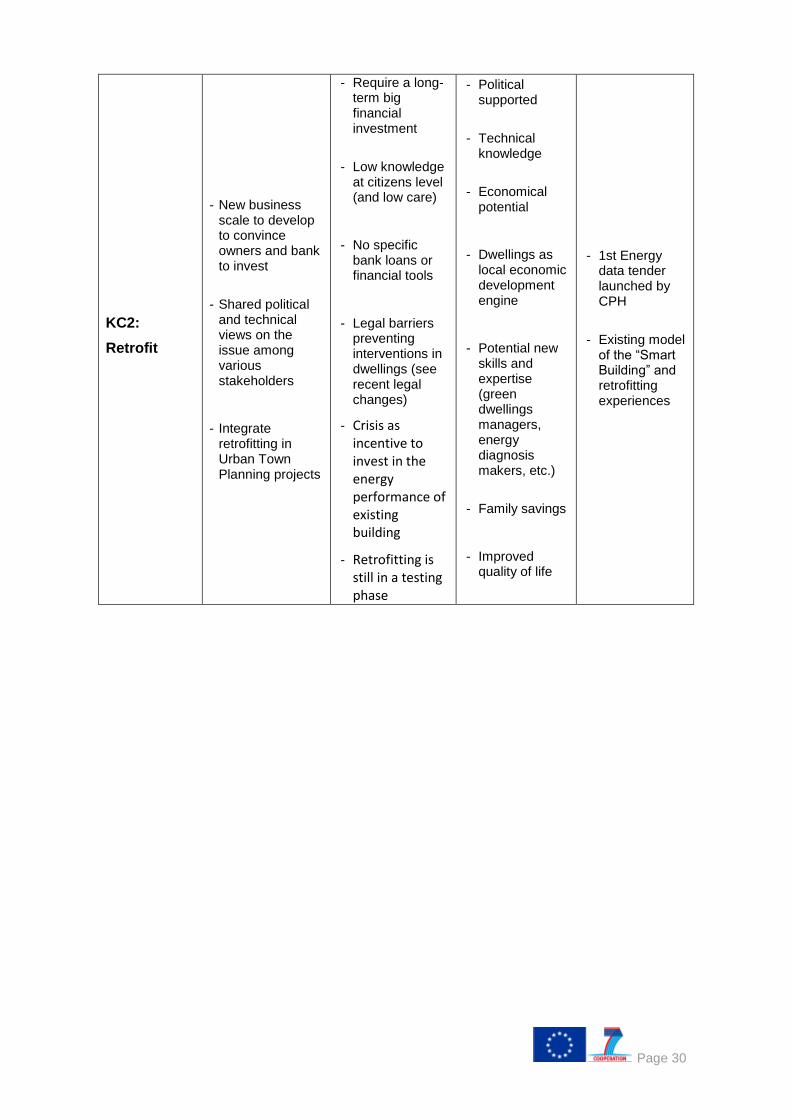
KC2:
Retrofit
- New business scale to develop to convince owners and bank to invest
- Shared political and technical views on the issue among various stakeholders
- Integrate retrofitting in Urban Town Planning projects
- Require a long-term big financial investment
- Low knowledge at citizens level (and low care)
- No specific bank loans or financial tools
- Legal barriers preventing interventions in dwellings (see recent legal changes)
- Crisis as incentive to invest in the energy performance of existing building
- Retrofitting is still in a testing phase
- Political supported
- Technical knowledge
- Economical potential
- Dwellings as local economic development engine
- Potential new skills and expertise (green dwellings managers, energy diagnosis makers, etc.)
- Family savings
- Improved quality of life
- 1st Energy data tender launched by CPH
- Existing model of the “Smart Building” and retrofitting experiences

Page 31
KC3:
Smart Grids
- Integrate different energy systems
- Optimize use of energy and reduce peak load, hence CO2- reduction potentials
- Facilitate integration of RES and lower GHG emissions and energy consumption
- Combined open data to facilitate the energy monitoring
- SG may have benefits on the territory: local energy balance, territorial monitoring knowledge, jobs opportunities, new economical area, innovation, etc.
- Business model to be set up to clear the vision
- Low energy prices contradicts the energy consumption saving strategy
- Lack of technical skills among local authorities
- No vision on the potential energy consumption flexibility to be shared
- Difficult to quantify energy flexibility
- Unclear framework for privacy and data protection
- Lack of legislative frameworks
- Political supported & commitment
- Industrial & research involvement: Clusters, demonstrators, public partnerships, …
- Interest of the Energy operators
- SG projects re running and feedbacks are positives
- Abilities to build SG integrated networks
KC4:
Integrated
Planning
- Political implication on Energy: SEAP, Smart City, RES Programs, …
- Elaborate a Energy Master Plan to match locally the 3x20 targets
- To create knock-on effects on others policies and a cross-sectorial approach on energy issue
- Gaining Energy data (missing) is a complicate challenge: financial, legally, regulatory,...
- Actual local politics are not enough energy oriented, considered as a national issue
- Few local financial and fiscal incentives to support energy policy
- Stakeholders have been identified and involved in the process
- Territory quality Coordination of infrastructure planning
- Territorial expertise integration
- Energy master plan from European cities

Page 32
- Opportunity to involve others identified stakeholders in the process (Region, cities, universities,....)
- To develop incentives tools linked with energy policy
- To develop a specific energy monitoring system based on open data
- Lack of internal intersectoral dialogue
- IGS model to be adapted & developed to the city scale
KC5:
District
Heating and
Cooling
- Develop the use of geothermal/soil energy
- Develop small scale initiatives on waste heat
- Need to reinforce the governance on the Heating & Cooing Energy
KC6:
Mobility
- Alignment to European programs (Horizon2020)
- Improvement of the intermodal transport system
- Development of new transversal relationships (liaisons)
- Participation of the citizens to the public decisions
- Decision Support System
- More environmentally friendly vehicles in the public transport fleet
- Overall traffic plan metropolitan region
- Planning based on demand
- Rail-bound public transport
- Low quality of bicycle parking infrastructure
- Multimodality for old people and families
- Financing agreements between city and federal level lead to suboptimal decisions in transport planning
- Limited budgets
- Spread knowledge of the territorial characterization
- System of infrastructures
- Transversal competences among industry /university /public administration
- Citizens commitment
- Free space connection system
- Long tradition of strategic planning in public transport
- Alignment to European programs (Horizon2020)

Page 33
- Decreasing share of motorized vehicles per inhabitant
- Population and traffic growth
- Acceptability of free floating car sharing services
3.3 Summing up – why and what can we learn/conclude from
similarities and differences?
In terms of hard results, the Intake Workshops were valuable in contributing to the
refinement of the objectives and possible measures to be adapted for the TRANSFORM
process. So far, it is too early to say whether this will ensure a concrete cooperation or
involvement within the TA. The intake workshop made it possible to get in-depth with the
specific themes and to point out the main challenges. This could provide important results
for the linkage between strategies and implementation.
The intake workshops are thus seen as a good methodology to select for working on
themes. However, this concept has to take into account the local working process within a
city. For example, some themes are worked out separately by other stakeholders, other
themes need to be taken at a later stage because of internal coordination aspects,
circumstances might change unexpectedly, etc. So the 3-5 analyzed themes during the
intake workshops are the relevant themes at that time, but might not always be realized
and continued as foreseen. This is not due to the intake methodology itself, but due to the
political nature of a city and of course has to be taken into account.
One important first result is the similitude of the focus selected by the cities. Actually the 6
cities made their intake workshop in parallel with little interaction between cities. But the
results are that most of the cities focused on very similar themes (cf. table 7). This shows
that the challenges of the Smart city are very similar from one city to another.
In addition, selected themes are very in line with the definition of the Transformation
Agenda, foreseen in the DOW:
“The Transformation Agenda addresses the city as a whole and the main components
influencing the chain of energy production and consumption at city level (incl. energy
efficiency in flows of water, waste, IT and mobility). It includes urban planning procedures
& regulation and the participation of end users”
Page 34
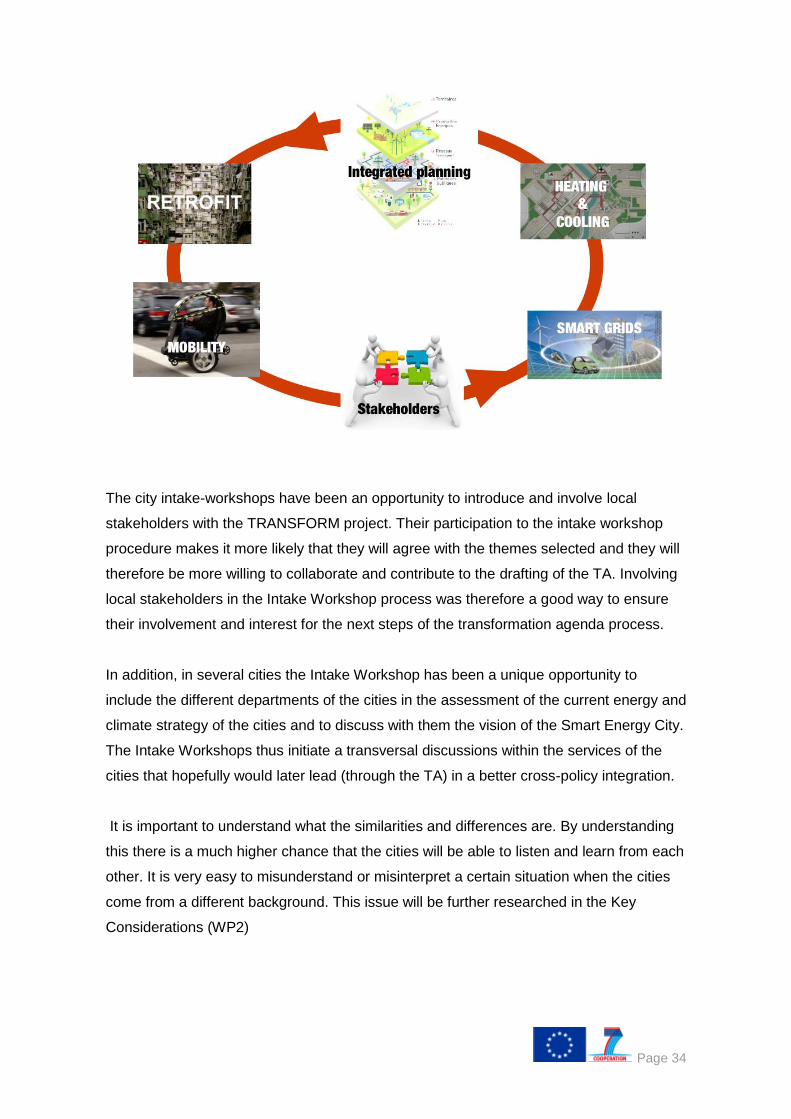
The city intake-workshops have been an opportunity to introduce and involve local
stakeholders with the TRANSFORM project. Their participation to the intake workshop
procedure makes it more likely that they will agree with the themes selected and they will
therefore be more willing to collaborate and contribute to the drafting of the TA. Involving
local stakeholders in the Intake Workshop process was therefore a good way to ensure
their involvement and interest for the next steps of the transformation agenda process.
In addition, in several cities the Intake Workshop has been a unique opportunity to
include the different departments of the cities in the assessment of the current energy and
climate strategy of the cities and to discuss with them the vision of the Smart Energy City.
The Intake Workshops thus initiate a transversal discussions within the services of the
cities that hopefully would later lead (through the TA) in a better cross-policy integration.
It is important to understand what the similarities and differences are. By understanding
this there is a much higher chance that the cities will be able to listen and learn from each
other. It is very easy to misunderstand or misinterpret a certain situation when the cities
come from a different background. This issue will be further researched in the Key
Considerations (WP2)

Page 35
There is a common understanding of the benefit of involving stakeholder among the cities
for achieving the smart city goals. However, the nature and culture of the stakeholder
involvement has been different in the past and it is also expected to be different in the
future. The change in attitude is not only needed from the cities but also from the
stakeholders. So when the cities now accept a higher level of stakeholder involvement,
the stakeholders are also becoming more willing to get involved in working on cities’
goals. One cannot do without the other in achieving the smart city goals. (In this relation,
it would be relevant to look at the ‘power assessment’ in the baseline analysis.)
4. Conclusion – pointing to WP2 The aim of the third part of the first work package has been to link the work on state of the
art data collection and the process oriented (‘soft) KPIs to defining the themes to the
Transformation Agendas in the cities. The D 1.3 report above presents the results of the
down-selection methods that enable cities to take the number of themes from 80+ to 3-5
themes for each city. These 3-5 themes from each city are the themes that a city will be
working on for the Transformation Agenda. It also reports on the SWOT and PESTLEGS
analysis that have been carried out in an intake workshop in each city.
The report above outlines how the information from each of the intake workshops have
been reported and the full reports of the city intake workshops are attached to this report
in Appendix C.
An important learning point from the city Intake Workshops is that there are differences as
well as similarities among the cities. Major differences and similarities are outlined in
Table 7 above. This is illustrated by the great variety of 3-5 themes selected by the cities
for their transformation agenda.
It is therefore also clear that the transformation agendas for each city will be very different
even if there are some key points that will be addressed by most of the cities (networks,
integrated planning, stakeholder involvement, etc.). The cities start at different levels and
therefore they will also have different strategic decisions to make.
During the next 12 months the cities will focus on improving the dynamic process of the
most important and relevant energy 3-5 themes they have selected during the intake
workshop. Based on the conclusion of the SWOT and PETLEGS analysis made during
the intake workshop, the cities will assess the gap between the current situation and the
Smart Energy Cities they envisioned, and they will work out on a comprehensive action
plan.

Page 36
This will lead to a comprehensive action plan for each theme that will involve:
measures and enabling measures that have been chosen to set up from key considerations perspective;
first conclusions of measures and enabling measures that have been started within project timeframe;
implementation strategy and specific agenda for measures beyond the time horizon of the TRANSFORM project;
detailed project management tools (how to ensure that objectives are achieved or set up corrective measures in order to meet them?).
For the overall TRANSFORM project, 6 Key Considerations have been selected as the
overarching themes to be analysed in all cities. These 6 Key Considerations are:
Stakeholder involvement; Smart Grids; Integrated spatial energy planning; Next
generation of Heating & Cooling solutions; Retrofit; Mobility.
Working groups have been set-up for each Key Consideration and they are composed of
both cities and industrial partners. The objective of the Key Consideration working groups
is to make ground for a mutual exchange of experience between the cities and
local/industrial partners.
By doing so they will provide insights/inputs to the cities to support them in the
drafting of their Transformation Agendas (WP2) /Implementation Plans (WP4) by
learning from the experience of other cities (ex. successful project, good practices, etc.)
as well as from the expertise of industrial partners.
In addition the conclusions and findings of the Key Considerations working groups will be
consolidate to provide recommendations to EC policies, identify needs for future research
programs as well as communicate about Key Consideration findings and lessons learnt to
other European cities.
Appendix C: Intake reports of the 6 cities
Amsterdam
Copenhagen
Hamburg
Genoa
Lyon
Vienna
Appendix D: Intake Workshop and SWOT methodology (PPs)