work, places and people in western sydney the centre for western sydney work, places and people in...
TRANSCRIPT

TheCentre forWesternSydney
Work, Places and Peoplein Western Sydney

2
contents
contents 2
publication details 4
acknowledgements 5
executive summary 6
introduction 13
chapter one | the significance of the location of Greater Western Sydney 15
figure 1: Greater Western Sydney Local Government Areas 16
chapter two | jobs and local labour markets: why are they important? 18
chapter three | the location of employment in Western Sydney:
suburban and economic change in the ‘global city’ 20
section 3.1 suburban and economic change in the global city 20
section 3.2 GWS as a region of production: agriculture and manufacturing 23
table 1: Location quotients for industry sectors employment by workplace in LGAs 2011 25
figure 2: Loss of national manufacturing employment in Australia 27
section 3.3 changes in the service economy 29
section 3.4 employment in health care and social assistance 30
section 3.5 information, finance, property and business services 31
chapter four | Western Sydney’s changing resident labour force:
demands for local, regional and metropolitan jobs 33
table 2: Population in LGAs GWS 2001-2011 34
section 4.1 Changing labour forces in GWS 35
table 3: Resident labour forces in LGAs GWS 2001-2011 36
section 4.2 Employment profiles of resident labour forces 37
section 4.3 qualifications of GWS resident labour forces 42
figure 3: Residents aged 25-34 years with university degrees | Sydney by LGA 2011 43
figure 4: Resident males aged 25-34 years with university degrees | Sydney by LGA 2011 45
table 4: Qualifications of residents aged 25-34 years GWS 2011 46

3
chapter five | regionalisation and ‘self-sufficiency’ in Western Sydney’s labour market 47
table 5: Journey-to-work: resident labour forces, GWS by LGAs 2001-2011(%) 49
chapter six | changing access to employment in GWS:
spatial and social mismatches in local labour markets 50
section 6.1 a model of access to employment 50
figure 5: Access to employment in local labour markets 51
section 6.2 the geography of unemployment in GWS 53
table 6: Unemployment rates: resident labour forces, GWS by LGAs 2001-2011 (%) 55
section 6.3 gender and age differences in unemployment 56
table 7: Youth unemployment rates for resident labour forces, GWS by LGAs 2011(%) 58
section 6.4 changing participation in the labour force 59
table 8: Resident labour force participation rates, GWS by LGAs 2011(%) 60
section 6.5 segmentation in the CWS labour markets 62
figure 6: Unemployment, GWS by collector districts 2001 66
chapter seven | income and wealth inequalities 67
figure 7: Taxable income, Sydney by postcode 2009-10 68
chapter eight | perspectives on employment policy 70
references 80
appendix 1 employment in manufacturing 82
appendix 2 employment by occupation 83
appendix 3 resident labour force by industry 84
appendix 4 resident labour forces by occupation 85
appendix 5 a note on unemployment 86

4
TheCentre forWesternSydney
Work, places and people in Western Sydney: changing suburban labour markets 2001-2014
Robert Fagan and Phillip O’Neill
February 2015
Centre for Western Sydney
University of Western Sydney
© 2015
This report was prepared for the Centre for Western Sydney by Professor Bob Fagan, Department of Geography and Planning, Macquarie University and Centre for Western Sydney, University of Western Sydney and Professor Phillip O’Neill, Director, Centre for Western Sydney, University of Western Sydney.
For further information please contact:
Professor Bob FaganDepartment of Geography and PlanningMacquarie UniversityNSW [email protected]
Professor Phillip O’NeillDirectorCentre for Western SydneyUniversity of Western SydneyNSW [email protected]
publication details

5
Unless otherwise stated the tables included in the report, and on which the analysis is based, have been derived from three principal sources: first, socio-economic data published by the Australian Bureau of Statistics (ABS) from its censuses; second, data from the ABS monthly labour market surveys and quarterly estimates of unemployment published by the Economic and Labour Market Analysis Branch of the Australian Department of Employment and Workplace Relations; and, third, data analysis in R. Fagan, R. Dowling and J. Langdale, Suburbs in the Global City: An Employment Profile of Greater Western Sydney, WSROC, February 2004.
The authors wish to acknowledge invaluable assistance in data extraction by Dr Phillip Toner of the University of Sydney. Thanks also to Judy Davis for preparing Figure 5. Any errors in the report are the responsibility of the authors.
acknowledgements
6
This report analyses labour market change in Western Sydney over the last three decades. There are two significant contexts for the analysis. These contexts are drivers of the demand and supply of labour.
One is the economic role of Western Sydney within the global city of Sydney, one of the world’s standout urban success stories of modern times. Certainly Western Sydney has received growth impetus from Sydney’s globalisation. Yet there are ill-effects especially on certain manufacturing sub-sectors, with significant and sustained impacts on employment. Being insufficiently attached to global growth sectors also means Western Sydney has insufficient economic drivers, and a paucity of the infrastructures and political institutions that would typify such large concentration of people elsewhere in Australia.
The other context is population growth fuelled by immigration and high rates of local family formation. Western Sydney was home to nearly 2 million in 2011, which was 44% of the population of Greater Metropolitan Sydney (GMS). As such, Greater Western Sydney (GWS) is one of Australia’s largest metropolitan sub-regions.
The study presented here focuses on the spatial-social mismatches in Western Sydney’s regional labour market. This is an important issue because labour market outcomes have major social and economic impacts, an observation which exposes the insufficient attention given to labour market outcomes by Sydney’s urban planners.
The study’s target region is Greater Western Sydney (GWS), an over-arching planning region now comprising 14 local government areas (LGAs). The region has experienced continuous suburbanisation of population and economic activity in the post-WW2 period, with highly significant growth in the manufacturing sector from the late1950s. The Report records a more recent divergence of economic activity, however, across Western Sydney’s LGAs with much of this traceable to national economic restructuring, especially of the manufacturing sector.
The report adopts a segmentation theory approach in exploring the complex ways that economic change in Western Sydney intersects with urban Australia’s most diverse multicultural and demographic communities. This diversity is closely associated with segmented labour markets. Entry to labour market segments, and mobility of workers between them, are shown to be shaped by people’s gender, age, skills, ethnicity and employment histories. In turn labour market segments commonly show differences in wages, hours worked, job security and commuting distances.
The report draws attention to the social and economic impacts of labour market processes and draws implications for appropriate urban and regional policies.
executive summary

7
The location of jobs in GWS
Industrialisation and de-industrialisation have been significant drivers of employment change in GWS from the 1950s to the present. Three stages can be identified.
• From the 1950s, manufacturers shifted to Western Sydney from the city’s historical manufacturing centre on western and southern fringes of the CBD in search of lower-cost land and access to both labour and markets arising from the westward shift of population. These processes also drove the suburbanisation of jobs in services especially in retailing and other household services.
• National and regional restructuring of Australia’s manufacturing sector from the mid-1970s to the mid-1990s brought dramatic job-shedding in the manufacturing sector to GWS. The region shed a net 10,000 manufacturing jobs between 1981 and 1996.
• In the last two decades, labour market outcomes for GWS show continued deindustrialisation of the region’s inner LGAs yet continued suburban growth of manufacturing jobs in outer LGAs
The implications of national and regional deindustrialisation in the 21st century
Australian manufacturing has entered new period of accelerated job-loss over the last decade. This has been the result of:
• continued productivity rises and organisational change across the sector
• on-going impact of imports from East Asia
• the debilitating effects on manufacturers of the relatively high value of the Australia dollar
• national economic turbulence after the 2007-2008 global financial crisis.
There are new spatial manifestations of these changes in manufacturing. Net job-shedding from manufacturing in GWS is now faster (2006-2011) than for the metropolitan area as a whole, indicating an end to processes that have forced the net western movement of manufacturing jobs in the past. ‘Net’ is a crucial word here: processes of westward movement have not come to an end but are now being overshadowed by new rounds of job-losses—especially in the inner LGAs of GWS—and continued growth of the labour force. There are also widening differences between LGAs: between 2006 and 2011 there was a net job-loss from manufacturing in all inner LGAs except Liverpool (which was static) but net manufacturing job-growth in all outer LGAs except Blue Mountains.
Nonetheless, the manufacturing sector remains crucial within the GWS employment profile.

8
Changes in service employment since 2001
GWS has followed Greater Metropolitan Sydney (GMS) with growth of regional jobs in health care and education outstripping retailing, transport and construction in most LGAs. But there are intra-regional trends that bear attention. By 2011 the proportion of jobs in fast-growth professional (business) services was below the metropolitan level in all LGAs except The Hills. Significantly, the lowest growth rates for employment in professional (business) services was in the industrialised inner LGAs. In the financial services sector, job growth remained below the metropolitan level in all LGAs except Parramatta and Auburn. Reflecting the disappointing growth-rates of employment in high value adding services sectors, by 2011 faster-growing, higher-wage, graduate-entry jobs remain weakly developed across GWS as a whole.
Changes in GWS’s resident labour force
The above section summarises the changing location of jobs in Western Sydney. The section below summarises changes in the region’s resident labour force. Population growth-rates vary widely between LGAs in GWS with fastest rates between 2001 and 2011 in outer LGAs (Camden, The Hills) and on GWS’s inner edge (Auburn). Because of such variations, labour forces are growing at different rates across the region with above-average growth found in both inner and outer LGAs compared to Greater Metropolitan Sydney (GMS) as a whole.
Significantly, the report finds that between 2001 and 2011, the resident labour force in GWS outgrew regional jobs, which is a sharp contrast to the 1980s and 1990s. By 2011 all inner LGAs had higher proportions of overseas-born workers (especially from CALD communities) while outer LGAs had much lower proportions.
De-industrialising the labour force
The effect of a declining manufacturing sector is important but manifests in different ways across the region. Since 1991 the proportion of resident workers in manufacturing jobs has fallen in all LGAs in GWS, although by 2011 12 of the 14 LGAs had proportions of manufacturing workers which still exceeded the average metropolitan proportion, meaning that the manufacturing labour force remained highly significant in Western Sydney. Yet there have been specific changes that merit attention:
• Jobs in manufacturing accessible to workers resident in GWS have been skewed towards jobs with specific technical skills or specialist trades areas but also to unskilled jobs.
• Job-shedding from manufacturing has been borne most heavily by older males, the overseas-born and by unskilled youth.
• Numbers of GWS resident workers in transport, construction and retailing continued to grow between 2001 and 2011 albeit at a falling rate in retailing.

9
• While the number of resident retailing workers grew, GWS shed retailing jobs between 2006 and 2011 in the region as a whole and in most LGAs, so a growing proportion of resident retail workers travelled further afield for work by 2011.
• Since 2001 the fastest-growing employment sectors for resident workers in GWS have been health care and education, mirroring metropolitan trends.
Resident labour forces in business services
Growth in the numbers of resident workers in financial and professional services across GWS is still falling behind the rest of the city. Between 2001 and 2011 only the resident labour forces of Parramatta and The Hills had proportions of information service workers near the metropolitan average. For the businesses services sector for 2011:
• There are nearly twice as many resident workers in GWS working in the information services sector employment as there are jobs in this sector in the region meaning large commuting flows for these workers to other parts of the city.
• Higher-salary managerial and professional occupations were below the average metropolitan level in all LGAs in GWS except The Hills.
In summary, the report finds that between 2001 and 2011 there has been an increasing disconnect between the employment of resident workers and jobs in GWS LGAs.
Regionalisation of GWS labour markets
The growth of jobs in GWS outgrew the growth of the labour force from the mid-1960s, meaning there was a gradual increase in the proportion of resident workers finding jobs in the region. This proportion rose remarkably from 59% in 1981 to a 64% by 1991. Yet by 2001 the proportion of resident workers with jobs in the region remained at 64%, suggesting regionalisation of the jobs market had plateaued. By 2011, however, a lower proportion – 60.8% – of resident workers in GWS had jobs in the region. The period from 2001 to 2011, then, is the first decade for which the ratio of regional jobs to regional workers has fallen since the early 1950s.
Moreover, no LGA in GWS maintained its 2001 level of regionalisation by 2011. Falls in jobs ratios were highest in inner LGAs plus The Hills and Wollondilly on the south-western fringe. The proportion of workers travelling out of GWS daily rose from 36% to 39% between 2001 and 2011, most likely including an increased flow to the Sydney CBD.
The trends run counter to explicit NSW government planning objectives and strategies since 1988.
The report compared proportions of the population in GWS aged 25-34 holding at least bachelor degree qualifications with the 40% benchmark adopted as a policy goal by the Australian Government in 2008. While central and northern regions of metropolitan Sydney had all reached this target,

10
Changing unemployment by gender and age between 2001 and 2011
From 2001 to 2011 unemployment fell to 5.7% for GMS while GWS fell to 6.6%. By 2011 8 LGAs in GWS – again all inner LGAs plus Campbelltown – had higher rates than GMS. Camden had GWS’s lowest rate by 2011 at 4%.
In 2001 unemployment rates in GWS for men exceeded those for women in 11 of the region’s 14 LGAs, a pattern of unemployment incidence observable since 1991. This gender pattern was substantially reversed by 2011 when rates for men were less than rates for women in 10 of the 14 LGAs.
For youth, unemployment has been rising in GWS between 2001 and 2011. The rates grew faster than growth for GMS in all inner LGAs plus Campbelltown (again). However rates in all other outer LGAs were lower than the average GMS level.
Diversity in participation rates
Participation rates are a key indicator of the state of the labour market. Between 2001 and 2011 participation rates in GWS remained lower than for GMS as a whole (62%). Yet in 2011 there was wide variation in participation rates between LGAs in GWS especially in inner LGAs (Fairfield, at
in GWS only The Hills and northern parts of Parramatta had reached 40% by 2011. The proportions for resident men in the 25-34 age-group were below 20% in a mix of inner and outer LGAs. These proportions in GWS are not attractive to employers seeking to recruit well-qualified workers for growing business and financial service sectors.
Spatial and social mismatches: unemployment in GWS
Most LGAs in GWS shared the national condition of ‘full employment’ during the 1950s and the 1960s. However, restructuring crises arising from national and international events commencing in the mid-1970s caused dramatic rises in unemployment and widening gaps between LGAs until the mid-1990s. While the unemployment rate for GMS passed 10% in June 1992, it reached 17% in Liverpool and 23% in Fairfield, one of the highest rates in Australia at the time. The Hills recorded only 4% unemployment at that time, one of the nation’s lowest.
The national boom after 1996 took the unemployment rate for GMS down to 6% by 2001. Rates fell throughout GWS during the same period, assisted by the Sydney 2000 Olympics construction boom. Yet by 2001 8 of 14 GWS LGAs still had rates above the metropolitan average. These included all GWS’s inner LGAs and Campbelltown.

11
Policy reflections
The report discusses policy issues arising from key findings of the analysis. It notes that net job-growth will continue in GWS as continued suburban population growth attracts additional private and public sector investments. The principal labour market issue thus involves the adequacy of employment growth to meet the needs of GWS’s growing labour forces. These needs have two components:
i. Quantity: are there enough jobs accessible to job seekers both in GWS and within reasonable commuting distances?
ii. Quality: is the range of jobs broad enough to avoid the continuation of structural unemployment issues and the marginalisation of some people and places?
Moreover, quantity and quality issues need to be considered alongside the question of access. Access to employment for resident workers in GWS will continue to depend not only on adequacy of employment growth but on adequate provision of social services and a range of transport and social infrastructures.
The report also discusses broader questions relating to jobs provision in GWS. One is the over-emphasis in planning documents on Sydney’s so-called global arc or global economic corridor. This spatial metaphor can produce a mindset in planning and policy development which overlooks the importance of GWS to the functioning of Sydney as a global city.
51%, having one of the lowest in Australia) compared with outer LGAs (Camden with a participation rate of around 70% recording the highest rate in GWS).
Low participation rates in the inner LGAs like Fairfield, Auburn and Bankstown suggest high levels of disguised unemployment.
By 2011 male participation rates remained below the GMS average in all inner LGAs of GWS and above the GMS average in most outer LGAs, although male participation rates fell between 2001 and 2011 in every LGA in GWS except Auburn. Female participation rates remained below the GMS average in all inner LGAs and in Campbelltown (with the lowest recorded by Fairfield at 43%) and was higher in outer LGAs. Female rates rose between 2001 and 2011 in 11 of 14 LGAs while the equivalent rates fell (at the same rate) in Liverpool and The Hills.
Labour market segmentation in GWS
The report finds that segmentation in GWS labour markets has become more complex over the last decade with different effects on workers from CALD communities, women and men, and youth. Differences in workers’ access to employment underlie these complexities and explain in large part the highly-clustered pattern of unemployment across the GWS region. The report notes that the spatial pattern of these high unemployment clusters in GWS has changed little since 1996.

12
The issue of market adjustment is also addressed. The report notes a lack of empirical evidence to support the proposition that labour markets ‘left to their own devices’ will deliver the most efficient or socially-desirable outcomes, either quantitative or qualitative. The high social and personal costs for GWS residents when there is failure to meet reasonable employment needs are self-evident. However, it is not only GWS but also GMS more broadly that bears these costs and consequences of rising inequality external to the household, and the responsibility for dealing with the social and cultural problems and resentments generated.
Finally, the report acknowledges that no single scale of government can deliver the mix of policies and strategies needed to address the needs of growing GWS labour forces. Each level of government – federal, state and local – has a crucial role.
Some specific policy directions
While the primary purpose of the report is to analyse the labour market changes being experienced by Western Sydney, the report includes a brief discussion of potential policy interventions. This discussion is a preamble to the call for response to the report so ideas for pathways to better labour market outcomes can be generated.
The report briefly reviews experience and research in Australia and internationally and identifies the importance for suburban development of the following:
• Long-term support for clustering of economic activity in key locations serviced by well-functioning social and transport infrastructure. This recommendation stems directly from the conclusion that there are significant consequences in GWS of failure to generate employment concentrations of sufficient size and diversity coinciding with public transport provision and concentrations of affordable housing.
• Development of human capital through appropriate social and community services that directly support employment participation, and increased investment in education including provision of affordable higher education places.
• Capture of regional advantages arising from cultural diversity including embracing and supporting knowledges and skills in ethnic businesses, combined with addressing sharply uneven impacts of recent economic and labour market changes on CALD communities.
• Long-term commitment by governments to multi-level strategies.

13
Greater Western Sydney (GWS) is a distinctive metropolitan region. It could also be Australia’s most important. With a population reaching just under 2 million by the 2011 census, it is one of Australia’s largest urban regions in an era when cities have become the paramount drivers of income and employment generation for national economies (Kelly et al., 2014: 1). Yet GWS is also integral to Greater Metropolitan Sydney (GMS), Australia’s largest city, through a myriad of daily social, economic and cultural flows, alongside longer-term migration movements of people, and established social, economic and cultural relationships which connect GWS to both the rest of Australia and the global economy.
In addition, the economic and social fortunes of GWS are shaped by the polices of the Australian and NSW governments, with the state government in particular responsible for urban planning and infrastructure decisions as part of its overall strategies for metropolitan Sydney. In this sense, GWS competes for both national and state government attention – such as for infrastructure investment – against northern, central and southern parts of the city, especially the Sydney central business district. No other urban region in Australia has this combination of characteristics. Yet, while being a crucial part of a Sydney as a ‘global city’, GWS lacks the range of economic drivers, hard and soft infrastructures and regional political institutions afforded to cities like Brisbane or Perth which have similar populations. Even Adelaide, with barely half the population of GWS, hosts the substantial part of three major universities compared to just one – the University of Western Sydney – in GWS.
This report explores economic and social change in GWS during the past two decades with a focus on experiences in its labour market. Along with the housing market, the labour market is a major determinant of social well-being for households in Sydney’s suburban areas. The context of growth is important here with the GWS regional economy growing steadily since the 1950s as Sydney’s population and economic activity have suburbanised. Yet the impacts of global and national economic fluctuation on people and places have been sharply uneven for GWS. While economic prosperity benefits many GWS households in the early 21st century, differential access to employment opportunities continues to underpin significant social and spatial inequalities for parts of GWS especially compared to more prosperous parts of the metropolis.
introduction

14
After discussing the importance of labour markets at local scale, the report explores the changing geography of employment across the region’s 14 local government areas (LGAs) concentrating on the uneven impacts of globalisation and deindustrialisation and the continued suburbanisation of Sydney’s population. We show how changing employment profiles are an important ingredient in the labour market experiences of resident labour forces in the region over the past two decades; and reveal how changes in people’s access to jobs over time do not simply reflect the location, nature and growth-rates of employment locally, regionally and in the wider metropolis, but are also shaped by access to transport and social infrastructure in GWS and exacerbated by lags in the provision of services, all of which have direct and indirect impacts on people’s labour market experiences. The resulting social and spatial mismatches in local and regional labour markets are explored through trends in unemployment and workforce participation for different groups of people and places in the region.
Finally, the report discusses policies for improving access to employment for GWS households especially through evaluations of metropolitan planning strategies and approaches by successive NSW governments and the opportunities presented by international experience and research.
GWS is integral to Greater Metropolitan Sydney (GMS), Australia’s largest city, through a myriad of daily social, economic and cultural flows, alongside longer-term migration movements of people, and established social, economic and cultural relationships which connect GWS to both the rest of Australia and the global economy.
15
Since the 1980s, GWS has been recognised by the NSW government as one of the city’s primary metropolitan planning regions. This report uses the state government’s definition of GWS which comprises the 14 western and south-western local government areas (LGAs) of Auburn, Bankstown, Blacktown, Blue Mountains, Camden, Campbelltown, Fairfield, Hawkesbury, Holroyd, Liverpool, Parramatta, Penrith, The Hills and Wollondilly (figure 1). GWS covers a significant part of Greater Metropolitan Sydney (GMS), accounting in 2011 for 44% of Sydney’s population, a small increase from its 43% share in 2001.
This significant position arises from continuous growth in population and economic activity on Sydney’s western and south-western outskirts throughout the 20th century. From the early 1950s, manufacturing moved westward from its historic concentrations near Sydney’s historic centre. Firms sought lower-cost production sites which also brought them closer to growing labour pools and the westward-moving centre of the metropolitan area’s consumer market. In addition, both middle-income and lower-income families sought more affordable housing in the new suburbs. The industrial and demographic changes produced diverse economic and social geographies across GWS although these were often buried by widespread social typecasting of the region. Western Sydney emerged as Sydney’s working-class ‘other’ in the popular press, media and film, and in the consciousness of more ‘cosmopolitan’ inner city and eastern suburbs residential communities and across the more prosperous north shore.
Such othering of Western Sydney was reinforced by deepening multicultural diversity as successive waves of overseas migration brought new residents to GWS, attracted by growing employment opportunities throughout the 1950s and 1960s; and, especially, by access to more affordable housing in Australia’s least-affordable capital city. Then, after national economic crises in the mid1970s and 1980s, stereotypes of struggling households were reinforced by rising socio-economic disadvantage in many parts of GWS. Even though social and economic life in different parts of GWS became more diverse during this time, images of the ‘westie’ seeped into public consciousness and discourse about life in the outer western suburbs. As Sydney entered the 21st century, however, stereotypes about the presence of of social disadvantage and socio-cultural deficit at the core of life within GWS were unsettled – partly through a growing consciousness within the region of strengths arising from cultural and economic diversity, but also from the growing political power of Western Sydney to shape fortunes of the major political parties and thus of both Australian and NSW governments.
By 2015, GWS is characterised by economic, social and cultural diversity comprising LGAs with three distinct suburban histories. The first is observable in the inner western LGAs of Auburn, Parramatta, Holroyd and Bankstown which were substantially industrialised during the national economic boom of the 1950s and 1960s. During the 1970s, the business district of Parramatta began to grow as a CBD for the wider western region. Successive metropolitan planning strategies from 1988 identified it as a ‘second CBD’ for the metropolis because of its clustering of public and private sector offices and nodal transport infrastructure investments.
chapter onethe significance of the location of Greater Western Sydney

16
Figure 1: Greater Western Sydney Local Government Areas

17
The second takes place in the LGAs of Blacktown, Fairfield and Liverpool which were the primary hosts of population and economic suburbanisation during the 1970s and 1980s. Together with Auburn, Parramatta, Holroyd and Bankstown, these LGAs constituted the industrial core of GWS by the mid-1980s, although industrial development also extended to large, low-cost industrial sites in the outer LGAs of Penrith and Campbelltown.
The third takes place in the outer LGAs, Sydney’s major peri-urban zones, and the sites of rapid population and economic development over the past 25 years. Along with Penrith and Campbelltown, Sydney’s periphery now extends to Hawkesbury and The Hills to the northwest; Blue Mountains, forming part of the western topographic boundary of the Sydney Basin; and Camden and Wollondilly to the southwest. These seven outer LGAs retain significant peri-urban agricultural production but are also places where new housing estates and commercial developments have leap-frogged GWS’s inner LGAs.
Even though social and economic life in different parts of GWS became more diverse during this time, images of the ‘westie’ seeped into public consciousness and discourse about life in the outer western suburbs.

18
Labour markets are the main vehicle for bringing together workers in search of income from wages or salaries, with owners or managers of capital seeking workers for their business enterprises (Peck, 1996:1). In addition, jobs in the public sector are also made available through labour markets and other wage-work is generated by not-for-profit organisations such as those providing ‘community’ services. These also employ significant numbers of additional, unwaged workers as volunteers.
For most households in highly-urbanised societies a majority of income derives from their labour through wages, salaries and bonuses, although earnings from non-wage work remain significant. This work might involve, for example, in-kind payment and reciprocal work, where people ‘gift’ their labour to address particular needs and circumstances (Gibson-Graham et al, 2013:30). Workers also derive income from owning capital, such as through interest on savings, dividends from shareholding, and capital gains and rents from property ownership. Although these can be important supplementary sources of income, employment in wage-work, and for some households transfer payments from the state, are principal determinants of a household’s standard of living in cities. Hence labour market experiences directly affect standards of living and are arguably the major cause of inequality (see discussion in Saunders 2002).
In contrast to these straight-forward definitions and distinctions, there is nothing simple about urban labour markets in practice. Urban labour markets exist in complex relationships with housing markets and with markets for goods, services and finance, with significant implications for the distribution of income among households and
individuals. Rising prices and falling affordability in housing, finance and product markets can erode the purchasing power of earned incomes and reduce household standards of living. Moreover, all these markets are structured by a variety of institutions, with some people and organisations considerably advantaged over others, often on the basis of social and cultural identities. There are also varying degrees of government regulation and supervision which have a significant effect on both market efficiencies and fairness. Important for efficiency and fairness in labour markets are the frameworks for bargaining between employers and workers over rates of pay, conditions of work and orderly procedures for termination of employment.
Outside of formally supervised and regulated labour markets, various kinds of precarious employment endure in Australia, as in all capitalist societies, often in what are called secondary labour markets. Precarious employment involves insecure, casual part-time or intermittent work, often on short-term or poorly-defined contracts.
Pressures for deregulation of labour markets have intensified over the last three or four decades in Australia –one reason for the growth of secondary labour markets and the increased prevalence of precarious employment both in once well-regulated sectors like manufacturing, and in sectors like retailing where there are concentrations of low-skill service jobs. Labour market inequalities have increased sharply through differences in rates of remunerations and other benefits between more precarious jobs and jobs in high-skill, high-productivity occupations earning high wages (Leigh 2013). Over the past 30 years these pressures have affected labour market experiences of workers resident in
chapter two
jobs and local labour markets:why are they important?

19
GWS to no small degree.
It is important to understand that regional labour markets are not simply geographical containers for universal processes operating in the national labour market (Peck, 1996:86). While national economic conditions have major implications for employment experiences of people in regions like GWS, all labour markets are locally constituted in particular times and places for individual workers (Peck, 1989). Establishing fixed boundaries for regional labour markets, for example based on average commuting flows around urban concentrations of employment, can have limited relevance at times, ‘because it amounts to trying to draw a line around complex and dynamic social processes’ (Peck, 1996:88). The processes Jamie Peck refers to here include ways in which people’s gender, age, ethnicity, qualifications and skills help determine their access to jobs. In regions like GWS, local and regional factors interact with national economic conditions and regulatory frameworks to determine people’s experience of waged-work or its absence.
Finally, exploring labour markets at local scales helps break down the idea of a rigid separation between workplaces and home or household, a problem often encountered in labour market studies among orthodox economists. In reality, relationships between home and work are at the heart of local labour markets (Hanson and Pratt, 1995:4) with people’s employment experiences shaped in important ways by their domestic or household circumstances. These include: the ways household divisions of labour commonly produce different roles for women and men, for example in relation to child-raising and care of the elderly;
ways in which educational attainment are affected by household circumstances and practices; and the effects of a mismatch between skills developed in domestic life and those required in workplaces. These home-based dimensions of employability are influenced strongly by cultural factors, but they also change over time as society changes and according to people’s accumulated labour market experiences.
Regional labour markets are not simply geographical containers for universal processes operating in the national labour market.
20
This chapter explores the location of employment in GWS and how it has changed over time, beginning with accelerating suburbanisation of Sydney’s population during the 1950s and 1960s, the associated decentralisation of jobs to Sydney’s suburban regions, and the emergence of GWS as Sydney’s most important manufacturing region.
In 2012 the NSW government’s two action plans (NSW Department of Premier and Cabinet 2012a, 2012b) for GWS described the region as ‘one of Australia’s economic powerhouses’, a phrase indicating the extent to which perceptions of Sydney’s outer suburbs have changed over the past 30 years. In Australia’s largest cities, suburbanisation of population and economic activity after 1950 became a driver not just of metropolitan economic growth, but also a central reason for the boom in the nation’s manufacturing sector, with rising investment and output focused on basic metals and metal fabrications, building materials, motor vehicles, processed foods and beverages, electrical appliances and household goods like furniture and furnishings. Sydney’s suburban growth was thus a major contributor to buoyant national economic conditions.
Post-war suburbanisation changed Sydney’s economic geography dramatically. Immediately following the second world war, migrants of non-English-speaking backgrounds,
settling in the major cities in increasing numbers as part of the post-1950 immigration program, sought lower-cost housing around inner-city industrial areas and commonly found employment in manufacturing. In Sydney, while many of the growing workforce living on the suburban fringes found employment locally – mostly in service industries like building and construction, retailing and personal services – there were also large flows of commuters to employment-rich inner parts of the city. As a result most LGAs in what is now GWS experienced the Australian condition of ‘full employment’ from 1950 to the mid-1970s, with unemployment rates nationally rarely exceeding 2% − although rates were lower for men than for women. Suburban population growth was also accompanied by social changes which brought increasing numbers of women into wage-work often, especially in the outer suburbs of those days, entering the labour force through service sectors such as retailing, and industrial sectors like textiles and clothing manufacturing and food processing, where access to jobs by women was looked on favourably.
By the late 1950s and early 1960s major changes in the geography of employment were underway, the most significant being the decentralisation of manufacturing jobs away from the old central industrial area (CIA) south and west of Sydney’s CBD, the crucible in which the city’s manufacturing activity had been forged in late 19th and early 20th centuries. The CIA included inner suburbs such as Zetland, Waterloo, Pyrmont, Balmain, Alexandria and Erskineville. By the late1950s, larger and less expensive industrial sites suitable for new or expanded industrial production became available in western LGAs like Auburn, Parramatta, Bankstown and Holroyd. In addition, growing suburban populations provided a labour force near the new factories. Alongside significant Australian industrial
chapter three
the location of employment in Western Sydney: suburban and economic change in the ‘global city’
Section 3.1 suburban and economic change in the global city

21
firms like AWA, Westinghouse, Dunlop and James Hardie corporations, large transnational corporations (TNCs), already with footholds in Australia’s booming and protected post-war economy, relocated plants to, or started afresh in, these western LGAs. The TNCs included the Ford motor vehicle assembly plant along Parramatta Road at Flemington, the Shell refinery at Camellia near Rosehill, the Borg Warner transmission and axle plant at Fairfield and the Alcan aluminium rolling mills at Granville (see Rich 1988).
The Bankstown LGA, for example, developed as one of the nation’s largest concentrations of manufacturing jobs. In addition, new manufacturing firms began to locate in other inner-GWS LGAs to serve growing suburban markets especially with products related to home-making. By 1971 the CIA’s share of Sydney’s total manufacturing employment had fallen below 50% while the share of middle-ring suburban LGAs like Bankstown, Holroyd, Parramatta and Auburn in GWS, had grown to more than one-third. Thus by the early 1970s, GWS had begun its long transformation towards its contemporary position as Sydney’s major industrial production space. Its factories provided employment to increasing numbers of the region’s resident workers but also to commuters from the city’s northern, central and southern regions. These changes shattered prevailing ideas about Sydney’s outer suburbs as being primarily spaces of consumption. GWS had become a core part of the national manufacturing sector at the same time as providing a place where lower-income households could be given a stake in the expanding economic system through suburban home-ownership.
Then from the mid-1970s the Australian economy pitched into a long period of industrial restructuring accompanied by rapidly-rising rates of unemployment which passed 10% nationally by 1983. From 1975 onwards most Australian manufacturing sectors shed labour – although levels of output continued to grow in most sectors. This reflected a complex mix of changes including: impacts of new global trade flows, including increased imports of manufactured goods from newly-industrialising countries in East Asia, especially clothing and electrical appliances; changing global location strategies of TNCs; emergence in the 1980s of a newly globalised financial system; significant changes in global labour migration; and technological and organisational changes in manufacturing which allowed production levels to be maintained or increased with fewer workers. Such profound changes combined to create in the Australian mindset awareness, indeed acceptance, that Australia was part of a globalised economy, even though forces for change came from national and local sources as well as those from the global scale.
An upside of such consciousness was that by the 1990s Sydney was being identified as Australia’s first ‘global city’, both internationally and among local politicians, urban policy-advisers, academics and popular writers. The seductive metaphor summoned for Sydney the role as key command post for the Australian economy, the principal centre for national corporate headquarters, the pre-eminent Australian centre for finance and business services, and the national node for emerging global networks of information flows. In common with other global cities, Sydney became a destination not only for internal and international movements of high-status information and professional workers but also a magnet for streams of global labour migration more broadly, with recent arrivals also occupying
22
lower-income and more precarious segments of the labour market.
In Sydney, as in many other global cities, the role of suburban regions like GWS was either ignored or misunderstood as the idea of Sydney as a global city came to dominate the thinking of the NSW government and its planners and the development of economic strategies for the city. The accompanying idea of there being a global economic corridor, or ‘global arc’, was also born; the corridor being represented as a set of globally-linked (and thriving) economic ventures stretching from the so-called ‘gateway’ functions surrounding Port Botany and Kingsford Smith airport, through the CBD, and then in a neat curve from North Sydney to the cluster of professional services firms at Macquarie Park and North Ryde. However impossible this spatial representation of Sydney, it does draw attention to the exclusion or marginalisation of Sydney’s outer suburbs from participation in the global economy, even though changes on the ground – for both the global arc and for GWS – have been more complicated than what the spatial metaphor conjures.
In fact, far from there being a single experience of globalisation’s ill-effects in GWS during the industrial changes of the 1980s and 1990s, economic and social experiences of restructuring among LGAs within GWS varied significantly. In particular, GWS’s inner LGAs – those which had industrialised during the long boom – experienced severe impacts of job-shedding from vulnerable manufacturing sectors. Along with associated jobs in transport and storage, manufacturing in these LGAs had provided major sources of employment for workers in
less-skilled occupations living in Sydney’s western suburbs. These jobs were also a magnet for recently-arrived migrants from culturally and linguistically diverse (CALD) groups who had settled in low-cost housing areas in Fairfield and Liverpool LGAs, the then peri-urban LGAs, as gentrification of the housing stock around the former inner city industrial areas (the CIA) forced up housing prices.
Many studies at the time demonstrated the highly-uneven impacts of job-shedding, both socially and geographically, in GWS, with some households bearing a disproportionate share of disruption to livelihoods and standards of living (for example see Fagan 1986, Stilwell 1989). For these households the chances of shifting to employment in growing economic sectors was diminished by national economic slowdowns and rising unemployment, especially in the early 1980s and again in the early 1990s. Frank Stilwell’s (1989 p.4) observations were finely focussed:
“In 1981 the highest rates of unemployment [in Sydney] were concentrated in two areas: inter- city areas like the City of Sydney, Leichhardt and Marrickville and outer western and south-western areas like Blacktown, Fairfield and Liverpool. By 1986 Canterbury, Waverley and Auburn had also joined this league. Looking at the percentage change between 1981 and 1986, the most rapid deterioration appears to have taken place in Auburn, Canterbury and Fairfield (where unemployment rates more than doubled) and in Botany, Blacktown, Bankstown, Marrickville and Rockdale (where they nearly doubled). These areas form a broad band from the inner city to the west.”

23
At the regional scale, however, impacts of deindustrialisation of the labour force were offset partly by net effects of continued suburbanisation of jobs in service industries such as retailing while manufacturing continued to grow strongly in some parts of GWS because of continued suburban population growth, westward shifts in suburban markets, the continued growth of the residential labour forces and the opening-up of new, cheap employment lands. By 1981 Sydney’s CIA contained only 25% of Sydney’s manufacturing jobs while middle zone suburbs had increased their relative share to 45%. New suburban industrial estates furthest from the CBD, in LGAs like Blacktown, Liverpool and Penrith, collectively contained 28% of Sydney’s manufacturing jobs by 1981. During the 1980s, inner LGAs like Auburn, Bankstown and Parramatta suffered net loss of jobs in the textiles and clothing, electrical appliances, motor vehicles and components, industrial machinery and metal fabrications sub-sectors. Eventually there were large-scale factory closures in GWS’s inner LGAs, Bankstown alone shedding more than 10,000 manufacturing jobs (net) between 1981 and 1996 (Appendix 1), almost half the region’s net manufacturing jobs loss. Large numbers of jobs were also shed by manufacturing firms in Parramatta and Auburn.
By contrast LGAs further west and southwest, such as Blacktown, Fairfield, Liverpool and Campbelltown, continued to industrialise during the 1980s and 1990s through food processing and production of building materials, fabricated metals and machinery. Much of this growth involved small and medium-sized enterprises serving regional or metropolitan markets, but TNCs were also involved, some establishing branch-plants on new industrial estates to serve metropolitan and national markets. Yet, even in these LGAs, some TNCs had already
begun to down-scale production or shed-labour through technological change.
By 1991 the CIA contained only one-fifth of Sydney’s remaining manufacturing jobs while the share of middle zone suburbs fell to 40% largely because of job losses in Auburn, Bankstown and Parramatta. Suburban industrial estates in GWS collectively hosted nearly 40% of Sydney’s manufacturing jobs by 1991, equalling the share held by the CIA in 1970. During the two decades of economic restructuring, then, the geography of Sydney’s manufacturing sector was reversed from inner to outer parts of the city and GWS became one of the largest manufacturing regions in Australia. By 2001 the region’s share of Sydney’s manufacturing jobs had passed 50%.
The relative importance of GWS as Sydney’s principal production region has increased even further in the early 21st century, partly because continued suburban industrial growth means the region’s manufacturing sector has shed labour more slowly than in the metropolis as a whole. The continuing importance of jobs in agriculture and manufacturing, and the supporting sectors involving utilities, construction, transport and storage, can be illustrated readily with location quotients. These are measures used to indicate sectors in the employment profiles of each LGA which are relatively ‘over-represented’ or ‘under-
Section 3.2 GWS as a region of production: agriculture and manufacturing
During the two decades of economic restructuring, then, the geography of Sydney’s manufacturing sector was reversed from inner to outer parts of the city and GWS became one of the largest manufacturing regions in Australia.

24
represented’ compared with metropolitan levels.
Not surprisingly, location quotients (Table 1) show GWS is most significantly over-represented in agricultural employment, with very high LQs in the peri-urban LGAs of Hawkesbury, Camden and Wollondilly, the latter also hosting the region’s major mining activity (coal). By 2001 GWS contained two-thirds of Sydney’s jobs in agriculture and the peri-urban fringes remain significant sites of poultry farming and horticulture, notably producing leaf vegetables and mushrooms, although there is also significant employment in non-food farming activities such as growing turf and cut-flowers, and stabling horses. Significantly, especially in view of recent concerns about Australia’s future food security, employment in agriculture declined by 10% in GWS between 2006 and 2011, continuing a long-term trend.
The conditions of national economic prosperity from the mid1990s brought about some recovery in manufacturing employment in GWS in some LGAs (Appendix 1). While most inner LGAs in GWS continued net shedding of jobs in manufacturing, de-industrialisation of the employment profile slowed during this period especially in Bankstown and Parramatta, the latter developing as a major centre for soft drink bottling and small-scale pharmaceutical production. Jobs continued to grow on the ample industrial lands of Blacktown throughout this period.
What is a location quotient?
The location quotient (LQ) is a ratio comparing the regional proportion of a measure, such as employment or value-added, with the proportion in a larger spatial unit used as a benchmark (often the national economy). In this report LQs are calculated comparing LGA proportions of employment in each sector against those for Greater Metropolitan Sydney (GMS). LQ =% employment in LGA/% employment in GMS. LQ>1 means the sector is over-represented in the LGA employment profile while LQ<1 means the sector is under-represented.

25
Table 1: Location quotients for industry sectors employment by workplace in LGAs 2011
a values for Greater Sydney = 1.00
Source: derived from ABS, Census Community Profiles, 2011

26
Since mid-2008, however, Australian manufacturing has entered another period of accelerated decline involving further rounds of job-loss (see Weller and O’Neill 2014). Figure 2 shows a significant decline in national employment since mid-2008 with 100,000 manufacturing jobs lost nationally, more than 10% of the sector’s national workforce. Tens of thousands more jobs will disappear over the next few years with the exit of the nation’s three remaining automobile manufacturers, General Motors, Ford and Toyota. An important question for manufacturing across economically-advanced nations like Australia is whether the sector is suffering inexorable decline.
There are various explanations for ongoing deindustrialisation of the labour force in the advanced nations. One highlights the significant productivity rises over the past 25 years through technological change and investment in new machinery, invariably involving labour displacement, and major organisational and work changes stretching back through supply chains into production of basic inputs. Another explanation is falling demand for locally-produced manufactured goods in favour of imports especially from East Asia. In some sectors both TNCs and Australian firms have relocated domestic production to lower-cost sites overseas. Finally the high value of the Australian dollar relative to the world’s major trading currencies, especially since 2010, and the high volatility of the real trade-weighted dollar over the past decade (Australia: Dept of Treasury, 2012:5) have made it more difficult for manufacturing in its attempts to compete against imports and maintain, let alone increase, the sector’s share of global trade in manufactured goods.
In response, industrial policies in Australia have consistently emphasised the need for increased competitiveness at the level of the manufacturing firm. Gone, forever it seems, is government willingness to maintain various kinds of protection against imports which still operate in a majority of industrialised countries including direct subsidy or market-preference for domestic manufacturers (for example through import quota systems). Local production survives, therefore, in circumstances where a local producer can demonstrate quality or price benefits to local buyers, or through successfully entering the growing global trade in manufactured goods.
As a result of these national and global changes, including impacts of turbulence and economic uncertainty since the global financial crisis (GFC) of 2008, employment in Sydney’s manufacturing sector declined from 12.6% of total metropolitan employment (2001) to 10.6% in 2006 and only 8.8% by 2011. This indicates the extent of structural change, job-shedding and deindustrialisation of the metropolitan labour force since the early 1970s when manufacturing contributed 30% of Sydney’s total employment (Rich, 1982:95). Such dramatic changes, even those since 2006, have been of major significance for GWS. By 2011 the region hosted nearly 60% of Sydney’s remaining manufacturing employment making it one of Australia’s largest regional concentrations of manufacturing with nearly 93,000 jobs (Appendix 1). The highest LQs (Table 1) for manufacturing jobs in 2011 were recorded by Holroyd (2.92), Bankstown (2.63) and Fairfield (2.47) with 12 of the 14 LGAs in GWS having LQs above 1.00 (the metropolitan level). Even in The Hills (LQ = 0.97) there is a significant, specialist manufacturing cluster on the Norwest Business Park, leaving only Blue Mountains as an insignificant supplier of manufacturing jobs in GWS.

27
Figure 2: Loss of national manufacturing employment in Australia
Source: Mitchell 2014

28
The consequences of impacts of industrial change in GWS since 2001 remain an outcome of the contradictory forces outlined earlier: job-shedding from manufacturing and related industries, especially in GWS’s inner LGAs, with continued growth of suburban employment in some firms and sectors offsetting some of this job-loss. Such jobs growth has occurred not only through firms locating or re-locating in outer LGAs, notably in new industrial estates of The Hills and Campbelltown, but also though net job-growth on industrial estates in Blacktown, Liverpool and Fairfield especially involving food processing, but also in transport and logistics.
Since the GFC in 2008, however, all of GWS’s inner LGAs have shed manufacturing jobs with a single exception, Liverpool. Having lost more than 13,000 such jobs between 1981 and 2006 (a 46.6% loss), Bankstown had lost a further 2,540 jobs by 2011, by which time Blacktown LGA, with just over 13,000 jobs, hosted the largest number of manufacturing jobs among all LGAs in Greater Sydney. This is a startling change from the early 1980s when Bankstown had nearly three times the manufacturing employment of Blacktown. Falling manufacturing employment was also notable in Holroyd from 2006 to 2011 with jobs shed from machinery and equipment firms once major suppliers to national markets as well as from some of Sydney’s remaining metal-rolling and fabricating sectors. While there was offsetting job-growth in food processing in both Bankstown and Holroyd, these two inner GWS LGAs accounted for two-thirds of all job-loss in GWS manufacturing between 2006 and 2011.
By contrast, all outer LGAs experienced net employment growth in manufacturing between 2006 and 2011 albeit at slower rates than during the 1990s (Appendix 1). The fastest growth-rate, albeit from a small base, was recorded by Camden, involving small machinery and engineering firms and firms manufacturing building products targeted at new residential developments. In adjacent Campbelltown, net growth of employment in manufacturing has been continuous since 1981, most recently through the manufacture of packaging materials, small plastic products and processed foods. By 2011 Campbelltown had the largest manufacturing sector among outer LGAs in GWS. While Penrith had a larger manufacturing sector than Campbelltown in 1996, employment growth plateaued in the Penrith LGA in the 2000s because growth in food processing and building products industries was offset by major declines in the metals industries which had first grown at the city’s outer fringe in the late 1940s. The Hills continued to experience net growth of manufacturing jobs in the 2006 to 2011 period, especially on its Norwest Business Park, but at a slowing rate across the LGA more generally. The Hills LGA hosts the region’s second largest cluster of small-scale pharmaceutical and cosmetics firms (after Parramatta), while employment has also grown in high-technology production of scientific and medical equipment, electronic components and small machine tools. By 2011 the outer LGAs – based around Campbelltown, Camden, Penrith and The Hills – hosted 26.4% of regional manufacturing jobs, up from 20.8% in 1996.
Continued economic stimulus from population growth and the importance of GWS as a national manufacturing region underpin the NSW government’s description of the region as a national economic ‘power house’ (NSW Department of Premier and Cabinet 2012a, 2012b). Yet turbulence
29
in the manufacturing sector since mid-2008 has made many LGAs in GWS, especially in inner parts of the region, vulnerable to economic downturn or restructuring resulting in increases in unemployment, precarious employment and under-employment. It is important to remember changes in the availability of jobs over time are the net result of jobs created minus those disappearing from a region or locality. A simple focus on numerical change, however, disguises qualitative shifts in labour market experiences. During the period since 2006 – where accelerated job loss from manufacturing since 2006 is observable, for example –jobs created and jobs disappearing have involved different wages, conditions and skill-requirements. Job-shedding has been concentrated among firms operating mostly in what are known as ‘primary’ labour markets, where compliance with regulations associated with higher rates of trade unionism, ensures better wages and conditions. In contrast, growth sectors have been more often linked to secondary labour markets where casual, non-unionised and insecure jobs are prevalent. In this respect, metals and engineering industries, including automotive and aeronautical manufacturing, have experienced heavy job-losses from GWS’s inner LGAs. Apart from being male-dominated, these jobs have more often involved higher-wages and required greater skills. Certainly there are growth firms – for example those manufacturing scientific and medical equipment concentrated in The Hills – which pay above-average wages for the sector. Yet other growth firms like those in food processing offer lower-skill, lower-wage work, with the growth of these jobs being widespread throughout GWS since 2001.
It should be noted that firms in the region’s manufacturing sectors also have significant supply chain linkages with regional component and supplies manufacturers and a wide range of service industries, especially firms supplying so-called ‘producer services’ sold dominantly to business rather than consumers. These activities, including legal, financial, marketing, training and computing services, have been among the fastest-growing employment sectors in Greater Sydney’s economy since the mid-1980s. In GWS, regional manufacturing firms together constitute a large share of the regional market for such producer-services, including where they are delivered by firms located primarily in the Sydney CBD. Thus manufacturing also has a significant indirect impact on the stock of jobs in GWS beyond the manufacturing sector itself, as well as on jobs and economic activity outside the region.
Service industries have always contributed the largest shares of value-added and employment to Sydney’s urban economy. Services include those supplied to firms, the producer-services noted earlier, and those consumed by households and individuals. The fastest-growing services since the mid-1970s have been those based on creating, processing and controlling information and, among these, services supplied to other firms have grown most rapidly.This is a direct result of technological and organisational changes in industrial production but also results from the globalisation of things like trade and financial flows, corporate decision-making and from growth in the media
Section 3.3 changes in the service economy

30
and communications industries. The largest household service sectors in 2011 for GWS were: health care and social assistance (11.3% of GWS employment); retail trade (10.1%); and education and training (8.8%), which by 2011 employed as many workers in Greater Sydney as manufacturing. While employment levels in retailing levelled off after 2006, reflecting conditions of economic uncertainty since the GFC, employment in both education and health/social assistance have continued to grow rapidly, the latter reflecting both Sydney’s ageing population and the rising importance of child-care in supporting access to employment, especially for women.
Since the early 1990s the GWS share of metropolitan employment in many of the household service sectors, driven directly by growth of local and regional markets, has converged on the proportion of the city’s population now resident in GWS (44% in 2011). Continued suburbanisation has ensured most LGAs in GWS have similar proportions of jobs in service, clerical and sales occupations to those in the metropolitan area as a whole (Appendix 2 occupations), while employment levels in education and training services by 2011 were above the metropolitan level in 11 LGAs, but below the metropolitan level in the inner GWS LGAs of Auburn and Holroyd. Jobs in transport and construction sectors are also important across the region with construction jobs prominent in outer LGAs like Wollondilly (LQ=2.11), Camden (LQ=2.04) and Hawkesbury while jobs in transport and storage were over-represented in the employment profiles of Holroyd and Blacktown.
By 2011, employment in wholesaling showed important regional concentrations in Auburn (LQ=2.24), where firms take advantage of the LGA’s central position in metropolitan distribution networks, and in Holroyd for similar reasons. In retailing employment, 11 LGAs had LQs greater than 1.00 (Table 1). They were highest in: The Hills (1.94), an LGA with high disposable incomes and clusters of retailers specialising in home-making and lifestyle; and Camden (1.52) with its rapid growth of households on new estates. Reflecting recent economic uncertainty, however, the retailing sector in GWS shed jobs between 2006 and 2011 with significant job-losses from LGAs with important large-scale regional shopping centres especially Parramatta, Penrith, Bankstown and Campbelltown. Employment stagnation in the retailing sector is also an outcome of changing organisation and technologies among large-scale retailers over the past decade, including new point of sale technologies (such as self-service checkouts) and stock handling systems.
Employment in health care and social assistance includes hospitals and other health care services, aged-care and child-care services, and social welfare delivery. Significantly, employment in Greater Sydney employment for this sector passed that for retailing by 2011. Retailing had previously been the metropolitan area’s largest employer for many years measured by number of workers. This Sydney-wide growth in health care and social assistance employment has been matched in GWS with the sector growing
Section 3.4 employment in health care and social assistance

31
at just below the metropolitan rate to become GWS’s second largest employer after manufacturing. Yet jobs in health care and social assistance are unevenly distributed across GWS LGAs, with the sector’s geography shaped by location of hospitals and clustering of services around health care hubs. This is reflected in above-average levels of employment in Parramatta, around the Westmead health cluster, and in Liverpool, Penrith and Campbelltown around major public hospitals. The only notably low proportions of jobs in this sector by 2011 were recorded by inner GWS LGAs Auburn (LQ=0.47) and Holroyd, both being adjacent to Parramatta, the most significant regional centre for jobs in this sector.
The census reports business employment in four industry sectors: information media and telecommunications; financial and insurance services; rental, hiring and real estate services; and professional, scientific and technical services Taken together, the information, finance, property services and the professional, scientific and technical services sectors provided nearly one-quarter of Greater Sydney’s jobs by 2011, up from one-fifth in 2006. Professional, scientific and technical services (mostly to business) employed 10.2% of all workers, the second largest employment sector in the city after health care and social assistance and one of its fastest-growing. This sector contains scientific research services, architecture and design, legal, accounting and advertising services, computer systems services and other technical services.
While some of these services are sold to households, a majority are provided to businesses. Some of the sector’s growth can be explained by structural changes in sectors like manufacturing since the 1980s associated in particular with the outsourcing of professional services rather than maintaining in-house expertise using office workers who would been classified by the census as manufacturing workers.
The professional, scientific and technical services sector also employs large numbers of university graduates and includes some of Sydney’s highest-wage jobs. Yet while employment in population-related sectors of health care and education grew in GWS at similar rates to the metropolis, growth of employment in the business-oriented services in GWS continued to lag the rest of the city, thus limiting the extent to which growing employment in producer-services has offset job-loss from manufacturing.
Indeed by 2011 employment concentration in GWS was lowest in these professional services compared to all other employment sectors. LQs in professional services were below 1.00 in 13 out of 14 GWS LGAs (Table 1). Metropolitan averages were exceeded only in The Hills (LQ = 1.11) following 20 years of growth in scientific and research firms, business services like market research, and other professional services. This employment growth stems directly from the growth since 2001 of high-technology manufacturing and equipment wholesaling on The Hills’ Norwest Business Park. Similarly, LQs for financial services were below 1.00 in 12 GWS LGAs with significant concentrations only in Parramatta (LQ = 1.43), the regional CBD, and Auburn (1.19) where firms providing
Section 3.5 information, finance, property and business services
While employment in population-related sectors of health care and education grew in GWS at similar rates to the metropolis, growth of employment in the business-oriented services in GWS continued to lag the rest of the city.

32
such services have grown recently on employment lands at Sydney Olympic Park. Both Parramatta and Auburn LGAs are easily accessible to Sydney’s central CBD and there are significant commuter flows into Parramatta and Auburn from outside GWS. Parramatta also had the GWS’s highest LQ for employment in public administration (2.37) having been developed specifically as a regional centre for legal administration, public sector agencies and state enterprises from the late 1970s.
The continued growth of financial, professional and technical service firms, especially in Parramatta and The Hills but also elsewhere in the region (though from smaller bases), has helped bring about significant changes in the occupational profile of employment in GWS (Appendix 2). Auburn, on the inner edge of GWS, has experienced the most significant occupational change overall as its employment profile has moved away from manufacturing. By 2011 Auburn had developed one of greater Sydney’s most important concentrations of jobs in storing, administering and distributing goods reflecting its nodal position in metropolitan transport networks and the newly-developed employment lands of Sydney Olympic Park. The number of jobs in finance and insurance services tripled in Auburn between 2006 and 2011, with significant increases in managerial, professional and clerical jobs observable in the LGA such that, by 2011, Auburn had displaced The Hills as the second largest concentration of such jobs in GWS after Parramatta. By contrast, the proportions of labouring jobs continued to fall in Auburn; and by 2011 concentrations of jobs in community and personal services and sales were below metropolitan levels.
Such changes in employment profiles across LGAs in GWS since the mid-1990s have had paradoxical impacts on patterns of household incomes and levels of social well-being and social disadvantage. This reflects differences between changing profiles of employment in the Region and the jobs held by resident labour forces in its LGAs. We discuss these issues in Chapter 7.

33
Whereas Chapter 3 discussed changes in the supply of actual jobs in GWS, this chapter explores changing characteristics and employment experiences of workers resident in GWS, defined as the ‘resident labour force’. Some of these workers find employment locally or within the wider GWS region, while others work elsewhere in the metropolis and beyond. Thus for each LGA, the resident labour force consists of workers living in the LGA rather than people working in the LGA, as was the focus of Chapter 3.
The growth of resident labour forces is generated by demographic change. The population of GWS at the 2011 census was 1,923,699, an increase of 134,742 persons since 2006, at a growth-rate of 1.47% per annum. The NSW Department of Planning projects GWS’s population will reach 2,919,550 by 2031, at an average annual growth rate of 1.9%. This projected rate is nearly 50% higher than the projected annual population growth rate for Australia over the same period (see ABS cat. 3236.0). The reasons for population growth in GWS are manifold. They include: rising numbers of children especially due to high rates of family formation among young adults; in-migration of younger families, notably from inner regions of Sydney; continued arrival of migrants from overseas, with some migrant groups having higher birth-rates than the Australian-born; and rising numbers of retirees as a consequence of increases in life-expectancy among existing Western Sydney residents.
Table 2 shows changes in populations of LGAs between 2001 and 2011. Although the significantly higher rates of population growth in GWS compared with the rest of Greater Sydney have not been sustained since 2001, the
region still grew faster than the metropolis between 2006 and 2011, accounting for half of all metropolitan population growth. GWS still contains LGAs with some of the fastest-growing populations in NSW such as Auburn (with 32.2% growth between 2001 and 2011) and Camden (28.2%). Overall, eight LGAs in GWS experienced population growth above the metropolitan level 2001-2011; while there was slow growth, by metropolitan standards, in Fairfield, Bankstown and the outer LGAs of Penrith, Hawkesbury, Campbelltown and Blue Mountains.
Overseas migration has played a significant role in the economic growth of GWS both directly through its net contributions to population growth and indirectly through the role of migration in sustaining the long boom of the city’s industrialisation after 1950, which helped increase the size of both the labour force and Sydney’s consumer population. Initially, migrants were attracted to the inner edge LGAs of Auburn, Parramatta and Bankstown but, from the mid-1980s, settled in larger numbers in lower-cost housing in Fairfield and Liverpool.
Across the decades, international migrants have come to GWS from a changing mix of sources in Europe, Asia and the Middle East (see Hugo 2014). In addition, especially in the later decades of the twentieth century, families of migrants relocated to medium- and lower-cost housing in GWS as gentrification of the inner city’s former industrial suburbs forced up housing prices (Burnley et al, 1997). By 2001 GWS was home to a diverse mix of CALD communities and in 2012 the NSW government’s Regional Action Plans for both sub-regions in GWS claimed as significant competitive advantages the ‘diverse and dynamic ethnic
chapter four
Western Sydney’s changing resident labour force: demands for local, regional and metropolitan jobs

34
Table 2: Population in LGAs GWS 2001-2011
Source: derived from ABS, Census Community Profiles, 2011

35
mix’ and ‘large multicultural workforce’ (NSW Department of Premier and Cabinet, 2012a and 2012b).
GWS accommodated 41.5% of Sydney’s labour force in 2011, compared with 43.8% of Sydney’s population. The share of the Sydney’s labour force resident in GWS changed little since 2001 when it was 41.2%. Nevertheless, the region’s demographic structure, especially in faster-growing LGAs, ensures the outer suburban labour force will continue to grow well into the future.
There are wide differences, however, in rates of labour force growth between LGAs (Table 3). From 2001 to 2011, eight LGAs recorded rates of growth of resident workers greater than growth rates for the metropolitan area as a whole with the fastest growth in LGAs on opposite sides of GWS namely in Auburn (45.9% growth), with its rapidly-growing population and high proportion of overseas-born, and outer area Camden (31.5%) with high population growth pushed by in-migration of younger Australian-born families over the past decade. Resident labour forces also grew above the metropolitan rate in outer LGAs Wollondilly and The Hills but also in inner areas Blacktown, Parramatta, Liverpool and Holroyd – so there is no longer a simple pattern of slower growth in inner areas of GWS and faster growth on the fringes. Over this decade, resident labour forces grew more slowly than Greater Sydney’s labour force in six LGAs: Bankstown and Fairfield among inner LGAs but also outer LGAs, Campbelltown, Hawkesbury, Penrith and Blue
Mountains, with this LGA experiencing the lowest growth of just 2.4%.
A major observation here is that between 2001 and 2011 the region’s labour force grew faster than the number of regional jobs. This is in contrast to the situation in both the 1980s and 1990s when the reverse was the norm. Again, though, differences between GWS’s inner and outer LGAs were marked. Labour forces grew faster than employment opportunities in all inner LGAs except Liverpool where employment continued to grow somewhat faster than the LGA’s residential labour force. And while there was significant job-growth in Auburn and Blacktown, since 2001 the labour forces in these LGAs have grown even faster. In Parramatta, while employment grew slowly, its labour force grew quickly as people continued to move into residential redevelopments especially in central Parramatta during the decade. Then, each of Fairfield, Bankstown and Holroyd LGAs shed jobs over the decade while their labour forces continued to grow slowly. By contrast in all seven outer LGAs growth of employment outstripped growth of resident labour forces, except for Liverpool, the trends of the 1980s and 1990s continuing only at the fringes.
By 2001 the region’s resident labour force had a younger age profile than Greater Sydney’s with 10 LGAs having higher proportions of workers in the 15-19 years age-group and eight with higher proportions in the 20-24 years bracket. In 2011 the highest proportions in the 15-19 years age-group were found in the outer LGAs of Hawkesbury, Wollondilly, Camden and Penrith. The lowest were found in Auburn, where the labour force participation rate for the 15-19 years age-group was below that for Greater Sydney, and in Parramatta where the proportion of couple-only households has been rising. Proportions of labour
Section 4.1 Changing labour forces in GWS

36
Table 3: Resident labour forces in LGAs GWS 2001-2011
Source: derived from ABS, Census Community Profiles, 2011
‘Resident Labour Force’ defined as residents of the LGA over 15 years of age employed, unemployed or looking for work

37
forces in the 20-24 years age-group by 2011 were highest in Fairfield, Campbelltown and Penrith reflecting lower participation rates in full-time education or training than in most of Sydney’s inner-west, inner, eastern and northern regions (see Section 4.3). Overall, however, a significant ageing of the GWS labour force has also become apparent in the early 21st century, in parallel with the metropolitan trend, although happening more slowly. The proportions of workers in the over 55 years age-group, for example, increased in every LGA in GWS from 2001 to 2011, the highest proportion found in Blue Mountains reflecting its popularity as a destination for pre-retirement migrants from the city. These proportions were also above the metropolitan level in The Hills and Hawkesbury.
Finally the ethnic composition of resident labour forces continues to vary significantly across GWS. By 2001, all GWS’s inner LGAs had proportions of overseas-born workers higher than the metropolitan level of one-third, reflecting these areas’ significantly industrialised labour forces and greater proportions of lower-cost housing. The highest proportions of overseas-born workers were in Fairfield (47.2%), Auburn (42.5%) and Bankstown (41.0%) with above-average levels in Parramatta, Holroyd and Liverpool. But, again for 2001, levels below the metropolitan were found in all outer LGAs.
By 2011, the proportion of Greater Sydney’s labour force born overseas had risen to 36.4% while levels above this were still observable in all GWS’s inner LGAs – but this group was joined by The Hills, reflecting growing levels of business-migration to this high-income outer area. By 2011, the proportion of overseas-born workers in the labour force
had risen to 70.4% in Auburn, and over 50% in Fairfield and Parramatta. For 2011, very low levels of overseas-born workers by Australian standards were recorded in Wollondilly (13.2%) and Hawkesbury (13.7%) but also in Camden, Blue Mountains and Penrith.
Despite continued suburbanisation of jobs since the 1960s, in 2011 many more workers were resident in GWS (848,621) than there were jobs located there (622,567). One key consequence of this deficit is that in most LGAs the profiles of the resident labour forces are much less narrow than the profiles of local jobs. GWS workers have already commenced the switch away from the production sectors, and ‘blue collar’ occupations, towards occupations and jobs in the growing service sectors.
But this switching has not occurred at a sufficient pace to match metropolitan-wide economic trends, nor has it been evenly distributed across GWS LGAs. The structural economic changes during the 1980s and 1990s explored in this report have increased differences both among LGAs in GWS, and between GWS and the metropolis. The most obvious difference with Greater Sydney is the persistence right across GWS of higher proportions of resident workers employed in production sectors, especially by firms involved in manufacturing, construction, transport and storage of goods. By 2011, 12 LGAs in GWS had higher proportions
Section 4.2 Employment profiles of resident labourforces

38
of manufacturing workers in their resident labour forces than the proportion for Greater Sydney (Appendix 3). GWS continues to host the city’s largest resident manufacturing labour force despite manufacturing workers comprising only 11.8% of the region’s resident labour force in 2011 compared with 16.1% in 2001. Over the past 20 years in GWS the proportion of resident workers employed in manufacturing has fallen in all LGAs, even in Camden and Wollondilly where the number of manufacturing jobs in the LGAs has continued to grow.
It is important to remind the reader that jobs in the manufacturing sector in GWS have always been available to both the region’s resident labour force and to commuters from other parts of Sydney. The jobs accessible to these commuting manufacturing workers have been skewed traditionally towards those jobs requiring specific technical skills plus those involving relatively low-skilled machinery-operation and unskilled labouring. To this supply of manufacturing labour from outside the region one adds the growing supply of manufacturing workers from suburban population growth from the 1950s onwards, fed continuously by households seeking lower cost housing including relatively large CALD populations. Indeed, even after more recent labour force switching out of the sector, explained above, the demand for manufacturing jobs in GWS as a whole in 2011 continued to exceed the region’s stock of manufacturing jobs – the region containing 100,300 resident manufacturing workers compared with 92,708 manufacturing jobs.
This sector-specific jobs-deficit was marked in outer LGAs, being largest in Camden where in 2011 there were only 47
manufacturing jobs for every 100 resident manufacturing workers despite a rapid growth rate for such jobs since the 1980s. Even in Blacktown, the LGA with the largest number of manufacturing jobs, there are only 76 for every 100 resident manufacturing workers. A relative surplus of manufacturing jobs, however, remained in the inner LGAs of Auburn, Bankstown, Holroyd and Parramatta, all of which are convenient destinations for manufacturing workers commuting from elsewhere in GWS and from other parts of Sydney. In short, these major differences between LGAs mean recent job-shedding from manufacturing has had markedly uneven impacts on different groups within the regional labour force and on different parts of the region.
Job-loss from manufacturing since 2011 has mostly affected men across the region, but especially in inner GWS LGAs, and especially from the machinery and equipment, basic metals and metal fabrications sub-sectors. In the established manufacturing LGAs, including Auburn, Bankstown and Fairfield, the most affected are workers in middle to older age-groups, with some staying in the sector through part-time or casual employment. Part-time work has grown much faster for men in the labour force as a whole than for women since 2006 in the inner LGAs of Auburn, Bankstown, Holroyd and Parramatta. Overseas-born workers have borne disproportionate impacts of these changes, especially those recently-arrived, especially in Auburn, Fairfield and Blacktown. The shedding of low-skill jobs in areas accessible by public transport networks has also had a disproportionate impact on young workers and contributed to significant rises in youth unemployment across the region since 2006, especially in inner GWS LGAs.

39
In contrast to the manufacturing sector as a whole, the food processing sub-sector has continued to grow across GWS offsetting some of the job-loss in male-dominated sub-sectors such as metal trades and equipment manufacturing. Across the region, women commonly take between 40% and 50% of jobs in the food industries, although these are often part-time or casual positions. The growth in food processing has reduced the dominance of full-time male workers in manufacturing in most inner GWS LGAs. In addition, recent growth of small pharmaceutical and cosmetics firms in LGAs like Parramatta, The Hills and Campbelltown has further reduced male-dominance of manufacturing jobs in these LGAs. Even though in 2011 more than 70% of manufacturing jobs in GWS overall were still held by men, the proportion had fallen to 61% in The Hills and 65% in Parramatta.
By the mid-1990s, wholesaling, retail trade, health and community services were the most regionalised employment sectors in GWS with local employers recruiting large majorities of their workers from the region. Yet because GWS’s retailing sector actually shed jobs between 2001 and 2011, the region’s retail workers were going further afield to find work by 2011. Although the location of jobs in health care and social assistance varied widely between LGAs, by 2011 the proportion of residents working in that sector was remarkably even between LGAs. Only Blue Mountains was home to a higher proportion of health and social workers than the metropolis, many of them commuting to the adjacent LGA Penrith, while Fairfield was the only LGA lagging significantly behind others for resident workers in this crucial sector.
While Parramatta became the first significant concentration of office employment in GWS during the 1980s and 1990s, this report finds that growth of the resident labour force employed in professional (business) service work in GWS has fallen behind that of Sydney as a whole over the last 20 years. By 2011 the aggregated ‘information, finance, property and business’ (IFPB) group was under-represented in the resident labour forces of 12 LGAs and most notably in the outer LGAs of Wollondilly (9.5% compared with 21.4% in greater Sydney), Hawkesbury, Penrith, Camden and Campbelltown. Only The Hills (20.9%) and Parramatta (19.6%) had proportions of information service workers close to metropolitan levels. Despite this, every LGA except inner edge Auburn had more resident information workers than jobs by 2011, more evidence of residents moving away from work in the production sectors. This job-deficit was most significant in Holroyd and Blacktown, LGAs where local job profiles remain oriented towards industrial production. In Holroyd, adjacent to Parramatta, the IFPB group contributed only 6.2% of jobs located in the LGA yet 16.5% of its resident labour force worked in IFPB. Similarly in Blacktown, IFPB jobs made up 5.9% of local jobs yet 14.3% of the resident labour force worked in the IFPB group. These large divergences mean information, property, professional and business service workers living in GWS commute in increasingly complex ways to regional job-centres, notably to Parramatta, The Hills and Auburn, but also to employment centres in inner Sydney including the CBD and centres along the so-called global economic corridor.
The proportion of resident labour forces from GWS working in finance approached the metropolitan average only in Parramatta and the adjacent LGAs of Holroyd, Auburn and The Hills, with these workers over-supplying the region’s

40
service centres and so commuting to inner parts of the city and elsewhere. By 2011 there was more than twice the number of finance jobs located in Auburn than resident finance workers. This is another illustration of the mismatch between Auburn’s employment profile and the type of jobs sought by or accessible to its residents.
By 2011 there were nearly twice as many residents of GWS working in the fast-growing professional (business) services sector as there were jobs located in the region – so clearly a significant proportion of these workers commute to inner parts of the city or elsewhere. A consequence is that the proportions of the GWS resident labour force employed in professional services differed little between LGAs and were well below metropolitan levels in 12 LGAs. The lowest levels were recorded in Fairfield, Liverpool, and Campbelltown, LGAs with the highest proportions of resident manufacturing workers. Among outer LGAs, only The Hills had any significant numbers of resident finance workers.
The changes discussed in this section have steadily altered the balance between full-time and part-time workers in GWS. Women entered the labour force in increasing numbers in the 1980s and 1990s often through part-time work in household-oriented services like retailing but also through part-time (often casual) jobs in restructured manufacturing firms. By 2001, 30.0% of both the GWS and metropolitan labour force worked in part-time jobs, a proportion retained in 2011 for both Greater Sydney and GWS as a whole. Yet the importance of part-time work had increased in all inner LGAs in GWS by 2011, most significantly in Auburn, Bankstown and Fairfield, caused largely by rising numbers of male part-time workers especially in manufacturing. In Fairfield LGA higher proportions of women worked
part-time through casual jobs in industries such as food processing but also low-paid services. By contrast the importance of part-time work fell in all outer LGAs, for both men and women, reflecting continued growth of local full-time jobs in manufacturing, construction and household-services although, after 2008, part-time jobs in outer LGAs began to disappear especially in retailing.
By 2011 women held two-thirds of part-time jobs in Greater Sydney but proportions differed significantly between LGAs in GWS. The lowest levels of part-time female workers remained in inner GWS LGAs most notably in Auburn, the only LGA with more male than female part-time workers by 2011. The highest proportion of part-time workers, male plus female (37.6%), was found in Blue Mountains where 53% of resident female workers had part-time jobs. This reflected the availability of part-time jobs in local tourist-oriented services and the nature of pre-retirement work being undertaken by ‘tree-changers’ in that LGA.
Appendix 4 provides an occupational view of resident labour forces across GWS. In 2011 higher-salaried managerial and professional occupations were significantly under-represented in most GWS LGAs. This has changed little since the mid-1990s even though proportions of managers and professionals have steadily increased for Greater Sydney over this period. Only outer LGAs Camden, Wollondilly, Hawkesbury and Blue Mountains showed proportions of the resident workforce in managerial occupations approaching metropolitan levels, which reflects the prevalence of owner-managed small businesses in the economic profile of these LGAs as well as a significant pool of residents from outer LGAs commuting to managerial jobs on the inner edges of GWS and to Sydney’s CBD and elsewhere. The overall metropolitan proportion of managers in the workforce was
Because GWS’s retailing sector actually shed jobs between 2001 and 2011, the region’s retail workers were going further afield to find work by 2011.

41
exceeded only in The Hills with its more-expensive housing and lifestyle developments despite the need for most of these managers to commute to workplaces elsewhere in GWS, inner parts of the city and elsewhere. Meanwhile, professional occupations were over-represented only in resident labour forces of The Hills and Blue Mountains, again reflecting relatively high proportions of workers with professional credentials commuting from those parts of GWS with higher-status housing and attractive local amenity.
By contrast, occupations involving sales and community or personal service work matched metropolitan levels in virtually all LGAs. This suggests sales, community and personal service workers throughout GWS had widespread access to jobs either in the region or through commuting to other parts of the metropolitan area.
Technicians and tradespeople, however, were over-represented in all LGAs except The Hills. Likewise, resident machinery-operators and drivers were over-represented in most LGAs, the exceptions being The Hills, Blue Mountains and fast-growing Camden, while labouring occupations were over-represented in 12 LGAs. The highest proportions of labourers lived in Fairfield (14.8% compared with 7.3% for Greater Sydney), Auburn and Blacktown, but they were under-represented in The Hills (with only 4.5%) and Blue Mountains. Hence by 2011 GWS maintained an over-representation in those occupations and sectors with lower hourly wage-rates and histories of more precarious (‘secondary’) segments of regional and local labour markets. Over the past 20 years more insecure employment conditions have become more common in community and
personal service occupations and sales work (Baird et al 2012).
A key observation is that occupational characteristics of local jobs have been diverging from occupational profiles of resident workers, particularly in inner LGAs. This is most apparent in Auburn where, despite rapid growth of managerial jobs over the decade 2001-2011, management-related occupations are significantly under-represented among resident workers. In addition by 2011 there were more than twice as many clerical jobs located in Auburn as clerical workers living there, not surprising in an LGA with high proportions of recent-migrant workers from CALD backgrounds. Auburn also offers more jobs for technicians and tradespeople than there are resident workers but significantly fewer labouring jobs than the proportion of resident labourers, many of whom by 2011 must be commuting to other LGAs for work.
Holroyd LGA also had a higher proportion of managerial jobs than resident managers. While in 2011 Holroyd had only half the metropolitan proportion of professional jobs in its employment profile, the proportion of professionals in its resident labour force was similar to the metropolitan level. Similarly, while by 2011 Holroyd had three times the metropolitan proportion of jobs for machinery operators in its employment profile the proportion of machinery operators in Holroyd’s resident labour force was close to the metropolitan level. In other words, over the past 20 years Holroyd’s resident labour force has become significantly more deindustrialised than has its stock of local jobs. This is the converse of the situation in Auburn where the stock of local jobs has deindustrialised much faster than its resident labour force especially since 2001. The changes in both LGAs point in the direction of greater commuting both to

42
other parts of the region and to other regions of the city.
Throughout the economic history of industrialised countries like Australia, the presence of concentrations of qualified workers has been a primary location factor for jobs. In particular, over the past 30 years job creation in advanced economies has clustered in regions with high concentrations of workers with skills and experience in information-based industries, commonly workers with higher education qualifications. Recognising this, the Bradley Review in 2008 set Australia a target of raising higher educational achievement in cities and regions of Australia. The recommended goal was that in any population cohort aged 25 to 34 years, 40% will have completed a bachelor degree or better. The Australian Government adopted the Bradley targets, moving first with enthusiasm with funded plans to encourage greater participation in higher education among the nation’s youth. GWS was the nation’s key target region with the University of Western Sydney one of the key implementing institutions.
Figure 3 shows where GWS stood in 2011 in relation to Bradley targets. In brief, while the central and most of the northern regions of Greater Sydney had achieved or exceeded the Bradley target by 2011, in GWS only the northern parts of Parramatta LGA and The Hills LGA had reached the 40% target. Moreover, less than half the Bradley
target has been reached by 2011 in all outer LGAs except The Hills and Blue Mountains. The lowest higher education achievement rates were lowest in the Penrith East SLA (15%), and in the Campbelltown South SLA, Wollondilly and Hawkesbury SLAs (all 16%). Proportions for inner GWS LGAs clustered around 20% except in Auburn and Holroyd where they approached the Bradley level.
The 2011 patterns of tertiary qualifications among 25 to 34 year-olds across GWS mirrored the low proportions of resident labour forces working in information, finance, property and professional-business service sectors (IFPB) – where tertiary qualifications are usually required – except in The Hills and Parramatta. One consequence of the relatively low proportion of 25 to 34 year-olds across GWS with tertiary qualifications has been a brake on regional private sector investment and job-growth in information services.
Of concern is that higher education achievement rates among young men in GWS lags those of young women across the region. Figure 4 compares the qualifications of young men in GWS against Bradley’s 40% target. The proportions of 25 to 34 year-old men with degrees resident in Fairfield LGA ranged from 15% to 18%; from 16% to 17% in Liverpool; 15% in Bankstown; from 11% to 13% in Penrith; and 14% in Camden. Hawkesbury recorded only 9% of 25 to 34 year-old men with degrees. These are not proportions attractive to employers seeking to recruit well-qualified workers for information-based industries. Based on the 2011 labour force, our calculations show that if the Bradley target was met for GWS as a whole an additional 220,000 GWS workers would have degrees.
Section 4.3 qualifications of GWS resident labour forces

43
Figure 3: Residents aged 25-34 years with university degrees | Sydney by LGA 2011
Source: Urban Research Centre, University of Western Sydney
44
Training in the non-university sector, especially in technical and further education (TAFE) colleges, is also a significant factor in the ability of GWS resident labour forces to attract employment growth in skill-intensive, higher-wage jobs. Table 4 shows the extent of technical qualifications for LGAs in GWS in 2011. Overall, outer LGAs recorded the highest proportions of 25-34 year olds holding TAFE technical certificates with Hawkesbury and Wollondilly reaching the highest levels (around 34%). This compared with much lower proportions in more established GWS LGAs like Bankstown and Fairfield, and even Blacktown. The data show no LGAs with significant proportions of 25 to 34 year-olds with university degrees and high levels of certificated technical skills. Indeed we find for GWS LGAs that there is a negative correlation between rates of bachelor degree attainment and rates of technical certification.
A simple explanation for this strong inverse relationship, often heard, is that young people exercise a direct choice between post-school technical and post-school higher education pathways. This explanation is not supported by the data. An increase in the proportion of the 25 to 34 year-old cohort in an LGA holding a bachelor qualification is associated with a substantial fall in the proportion holding no post-school qualifications . In other words, across the LGAs in GWS higher levels of bachelor completion are strongly associated with higher qualification levels across the cohort irrespective of whether they are technical or bachelor qualifications. On the other hand, where there are higher levels of technical qualifications without higher levels of bachelor degrees the proportion of the cohort without post-school qualifications rises substantially . In 2011 the highest proportions of 25-34 year olds without a post-school qualification were recorded in the inner GWS SLAs of Bankstown Northeast, Fairfield East and
Blacktown Southwest where levels exceeded 60%. Only The Hills and Parramatta had proportions without a post-school qualification below 40% (Table 4). The data show that increased participation of young people in training for bachelor degrees does not diminish participation in technical training. The data suggest the more qualifications are valued and pursued, with access problems resolved, the more the skill-levels of young adults increases across the board.
The data suggest the more qualifications are valued and pursued, with access problems resolved, the more the skill-levels of young adults increases across the board.

45
Figure 4: Resident males aged 25-34 years with university degrees | Sydney by LGA 2011
Source: Urban Research Centre, University of Western Sydney

46
Table 4: Qualifications of residents aged 25-34 years GWS 2011
Source: Author’s calculations from ABS data
47
Earlier studies of labour markets in GWS (Fagan et al., 2004; Urban Research Centre, 2008) showed journeys-to-work by resident workers were becoming increasingly regionalised as a rising proportion of resident workers found jobs somewhere in the region. This regionalisation process began in earnest during the 1970s as jobs in manufacturing and services grew in GWS and the western suburbs ceased to be simply dormitory suburbs for job-rich eastern parts of the city. By 1981 59% of workers resident in GWS worked in the region and, as suburbanisation of employment continued to more than offset impacts of deindustrialisation during the 1980s, this proportion had reached a remarkable 64.0% by 1991. By 2001, however, the level had remained at 64.2% suggesting regionalisation had plateaued by the start of the 21st century (Table 5).
Our calculations show there was a clear distinction between GWS’s inner and outer LGAs in the pattern of regionalisation. By 2001 the lowest proportions of residents working in GWS were recorded in eastern LGAs like Auburn, Bankstown and Parramatta where residents found a variety of accessible employment centres both in GWS and in Sydney’s central and southern regions. These three LGAs also hosted large numbers of commuters from outside GWS such that in some sectors, notably manufacturing and information services, competition for local jobs was high. In contrast, the region’s GWS’s outer LGAs recorded the highest levels of regionalisation by 2001.
Yet across the GWS region in 2001 35.8% labour force still travelled out of the region to work especially to jobs in financial and professional (business) services. Many workers travelled by car to the commercial centres and industrial
zones of central and southern Sydney and employment centres along the Macquarie Park corridor. The largest single flow of GWS residents, however, was to jobs in Sydney’s CBD, travelling especially by train, and involving more than 10% of workers resident in Auburn, Parramatta, Bankstown and Holroyd. Interestingly, 10.5% of resident workers in The Hills also commuted to Sydney’s CBD despite poor public transport connections. This reflected higher proportions of The Hills’ information service workers able to search further afield for higher-paid professional and managerial occupations.
Table 5 also shows changes in commuting rates over the decade. By 2011 60.8% of the resident labour force worked within GWS so, clearly, the level of regionalisation had fallen rather than maintaining the 64% plateau of the 1990s. Indeed, by 2011 no LGA in GWS had maintained its 2001 level of regionalisation with all inner GWS LGAs experiencing significant falls except Liverpool. Despite significant net job-growth in Auburn during the decade, as we have observed above, there was significant job-shedding from the manufacturing, transport and wholesaling sectors. Many local residents previously employed locally in these sectors were thus forced further afield to find work. By contrast Holroyd experienced total net job-loss during the decade 2001 to 2011 with, in addition, its resident workers seeking employment increasingly in finance, professional/business services and health care. With each of these sectors under-represented in Holroyd’s employment profile but widely available in inner parts of Sydney, rising levels of out-commuting were generated. Falls in regionalisation were generally lower for outer LGAs although there were significant falls in The Hills and Wollondilly, with these outer LGAs acting increasingly as dormitories for workers employed in the rest of Greater Sydney but also in the case
chapter five
regionalisation and ‘self-sufficiency’ in Western Sydney’s labour market

48
of Wollondilly in adjacent Southern Highlands towns like Mittagong and Bowral.
The falling level of regionalisation of the labour market since 2001 runs counter to NSW government metropolitan planning strategies in place since the late 1980s. This is illustrated by examining the ‘self-sufficiency’ ratio of an LGA or region. This ratio is the number of jobs in the area divided by the number of workers resident there. For the GWS region, the self-sufficiency ratio rose from 0.67 (67 jobs per 100 resident workers) in 1971 to 0.80 by 1991. The suburbanisation of jobs clearly outstripped growth of the labour force during these 20 years despite job-shedding from manufacturing in the seven industrialised LGAs in inner GWS. This rising jobs availability thus underpinned rising regionalisation of journeys-to-work. However, despite a return of buoyant economic conditions from the mid-1990s with ongoing economic growth in GWS, rising employment self-sufficiency has not been sustained, the ratio falling to 0.70 by 2001, below its level of 1981. By 2006 a surge in employment growth, reflecting national economic prosperity, increased the ratio to 0.76 but by 2011 it had fallen back to 0.70 (70 jobs per 100 workers).
The biggest falls in self-sufficiency from 2001 to 2011 were recorded by inner GWS LGAs Bankstown, Holroyd and Auburn. Self-sufficiency rose significantly in three outer LGAs: Camden, where employment in both manufacturing and service sectors continues to grow; Campbelltown, were the rising ratio is partially explained by the LGA recording GWS’s slowest labour force growth rather than by significant local jobs growth; and The Hills, an LGA consolidating its role as a growth-centre for specialist
services and manufacturing jobs. Except in these outer LGAs, employment self-sufficiency has fallen as a result of processes of suburbanisation of manufacturing and service jobs on the one hand and periodic job-shedding especially from the manufacturing sector on the other. Jobs in finance, business and professional services have sustained high growth-rates in the metropolitan economy contributing strongly to the idea of Sydney as a global city. Yet in most parts of GWS growth in these high-order services jobs has lagged well behind other parts of Sydney and has played little part in offsetting net job-losses from manufacturing.
The falling level of regionalisation of the labour market since 2001 runs counter to NSW government metropolitan planning strategies in place since the late 1980s.

49
Table 5: Journey-to-work: resident labour forces, GWS by LGAs 2001-2011(%)
Source: derived from ABS, Census Community Profiles, 2001 2011
50
Figure 5 depicts ways in which local resident labour forces in GWS gain access to jobs locally, regionally or in the wider metropolitan labour market. The figure builds on earlier observations that people’s employment experiences are forged in overlapping market segments in which workers can become trapped from time to time or from which they can be excluded. People’s entry to segmented labour markets is shaped strongly by their gender, age, ethnicity or race, qualifications and skills, and employment histories. Household factors also affect people’s access to particular jobs in various market segments and include: divisions of labour within the household based on gender or age; arrangements for child-rearing and the performance of other family responsibilities; social conditioning and education; support for work, including transport and care during illness; security (food and shelter); and resource-sharing within households or families. Women, for example, can be trapped in unstable or less desired labour market segments until household divisions of labour become more compatible with employment in the primary labour market (Peck, 1996:67). Older workers can be trapped because of difficulties in re-training if jobs appropriate to their skills and experiences disappear and are replaced by those requiring different skills, experiences or formal credentials. Young people can be trapped or excluded because of inexperience or ‘unreadiness’ for work (real or perceived). Minority CALD groups can face discrimination, language barriers to occupations like clerical work, and lack of employer recognition of qualifications and experiences gained in their places of origin.
The availability of jobs locally and in the wider labour market plays a central role in people’s access to work and this changes over time according to rates of enterprise formation, business or agency closure, relocations and retrenchments. Employment can also change qualitatively because of casualisation and alterations in hours of work or shift-patterns.
Figure 5 suggests the stock of jobs available in specific regions arises from the balance between recruitment and retrenchment within local private sector businesses, public sector employers and ‘community’, not-for-profit organisations. The latter, the so-called ‘third sector’ organisations, have increased in importance over the past 25 years in developed countries like Australia, partly as a response by community groups to uneven impacts of economic restructuring but mainly because of changes in public sector service provision with increased out-sourcing to public-private partnerships or community not-for-profit providers.
chapter six
changing access to employment in GWS: spatial and social mismatches in local labour markets
Section 6.1 a model of access to employment

51
Figure 5: Access to employment in local labour markets

52
Local resident labour forces are at the heart of Figure 5 with their access to employment in the region or wider metropolitan area affected by gender, age, skills and ethnicity through locally segmented labour markets. Figure 5 also highlights the importance of social infrastructure and services provided by all three sectors, including transport, education and training, adequate housing, child-care and health-care. Importantly, access to infrastructure and services mediates the extent to which attributes like gender, age, ethnicity, skills and qualifications determine people’s access to employment.
The adequacy and cost of child care have a major impact on the way gender splits or segments regional labour markets, mostly affecting women. Indeed, poor provision of any the social services listed above can reinforce labour market segmentation. Poor services provision and inadequate support, be it from within or outside the household, have a major impact on the ‘competitiveness’ of a regional labour force against workers from elsewhere in the metropolis (or beyond), both for local or regional jobs and those seen otherwise as within reasonable regular commuting distances.
Finally, recent studies in Sydney of barriers to job-search among people experiencing long-term unemployment show people’s perceptions of personal insecurity both in workplaces, and while searching for jobs or travelling to work, are frequently-rated problems (Roseanna et al 2013, Milner et al 2014) especially for people who must use public transport.
Figure 5 suggests four issues of major importance in 21st century cities like Sydney.
1. While stocks of job opportunities have a crucial impact on people’s employment experiences the provision of social services and infrastructure is also of major significance in determining people’s access to work.
2. The adequacy and affordability of transport is of central importance in shaping people’s access to jobs.
3. Public sector fiscal policies directly affect people’s access to work especially though their impact on service provision. The geography of public and private investment in economic and social infrastructure is also important. Since the early 1990s these investments have favoured Sydney’s central region justified by the perceived need to support Sydney’s role as a global city.
4. Growth or decline of employment in specific localities or regions is always the net result of new jobs being created and existing jobs being shed, across private, public and community sectors . These processes of creation and destruction reflect local and regional factors but they are also the consequence of macro-economic conditions, the social policies of governments, and changes at more global scales. Over time, bedsides affecting the number of jobs available, such forces generate significant qualitative changes, such as increasing the size of secondary labour market segments, which affect people’s employment choices.

53
Throughout the post-1950 long boom in the national economy, most LGAs in GWS shared the national condition of ‘full employment’ meaning unemployment rates fluctuated around 2.0%. In the late 1970s after the onset of widespread economic restructuring globally and nationally unemployment rates across GWS began to rise faster than national rates. This restructuring levied a heavy toll on workers employed in vulnerable sectors like manufacturing especially by reducing availability of lower-waged, sometimes lower-skilled, jobs. These once provided growing employment opportunities for resident workers in inner GWS LGAs like Bankstown, Auburn and Parramatta and, after further suburbanisation of industry, in Holroyd, Fairfield and Liverpool. Manufacturing also provided secure employment to disproportionate numbers of people from CALD communities attracted to settle in these LGAs by lower-cost housing and expectations of access to growing employment opportunities.
After a decade of restructuring, Greater Sydney’s unemployment rate (see definition in Appendix 5) reached 9% in June 1984 but passed 16% in Fairfield, was more than 12% in Auburn and Liverpool, and exceeded 10% in Bankstown, the LGA with Sydney’s largest concentration of manufacturing jobs. Rates of unemployment were much lower in LGAs near the metropolitan fringes.
Thus began a long period of rising differences between LGAs on the industrialised inner portion of GWS and those on the fast-growing outer fringes. A severe downturn in the national economy in June 1992 took Sydney’s metropolitan unemployment rate past 10%, a rate unprecedented since 1950. By then the rate had jumped to 23% in Fairfield, one of the highest urban unemployment levels ever in post-Depression Australia, and exceeded 17% in Liverpool. Rates above metropolitan levels were also found in Holroyd, Campbelltown and even in Parramatta despite the cluster of jobs in its growing commercial and business centre.
At the same time, however, most outer LGAs maintained unemployment rates below metropolitan averages as suburbanisation continued to stimulate economic growth. In June 1992 The Hills (then Baulkham Hills) recorded a rate of 4.2%, one-fifth the rate for Fairfield. In GWS as a whole, though, as in Australia, high rates of unemployment in the early 1990s became a major political issue especially because rates for men substantially exceeded rates for women following retrenchments from male-dominated sectors especially manufacturing.
By June 2001, eight LGAs in GWS stood out for the extent to which their unemployment rates exceeded a surprisingly high metropolitan level of 6.1% after the return of buoyant conditions in the national economy after 1996 (Table 6). Fairfield experienced the highest rate at12.7%, although half of its 1992 level, with Auburn recording 11.9%. Unemployment rates in Campbelltown (8.5%), Liverpool (8.3%), Bankstown (7.9%), Blacktown (7.7%), Holroyd (7.5%) and Parramatta (7.2%) also remained significantly above Greater Sydney’s. By contrast, below average rates
Section 6.2 the geography of unemployment in GWS

54
were found in all outer LGAs except the more industrialised Campbelltown. The lowest unemployment rates were in The Hills (3.2%), Camden (4.1%) and Hawkesbury (4.7%). By 2001 GWS represented the complete spectrum of unemployment rates for Greater Sydney with the city’s highest (Fairfield) and lowest rates (The Hills). Even though the national economic boom reduced unemployment in the most vulnerable areas of GWS, clearly the benefits of economic recovery were unevenly distributed socially and geographically.
Between the 2001 and 2011 censuses unemployment rates (Table 6) fell from 6.1% to 5.7% in Greater Sydney and slightly more in GWS as a whole, from 7.3% to 6.6%. Yet by 2011 8 LGAs continued to experience higher rates than Greater Sydney, the highest still in Fairfield (9.7%) and Auburn (8.6%). Rates also remained significantly higher in LGAs where manufacturing was over-represented in resident labour forces. Again, below average unemployment rates was recorded for all outer LGAs except Campbelltown, although by 2011 the lowest unemployment rate in GWS was in Camden (4.0%), the fastest-growing outer LGA labour market in during this decade. The Hills was the only LGA in GWS to record an increase in unemployment rate between 2006 and 2011, rising from 3.2% to 4.2%, but still a low rate by Sydney and Australian standards.
Older workers can be trapped because of difficulties in re-training if jobs appropriate to their skills and experiences disappear and are replaced by those requiring different skills, experiences or formal credentials. Young people can be trapped or excluded because of inexperience or ‘unreadiness’ for work (real or perceived).
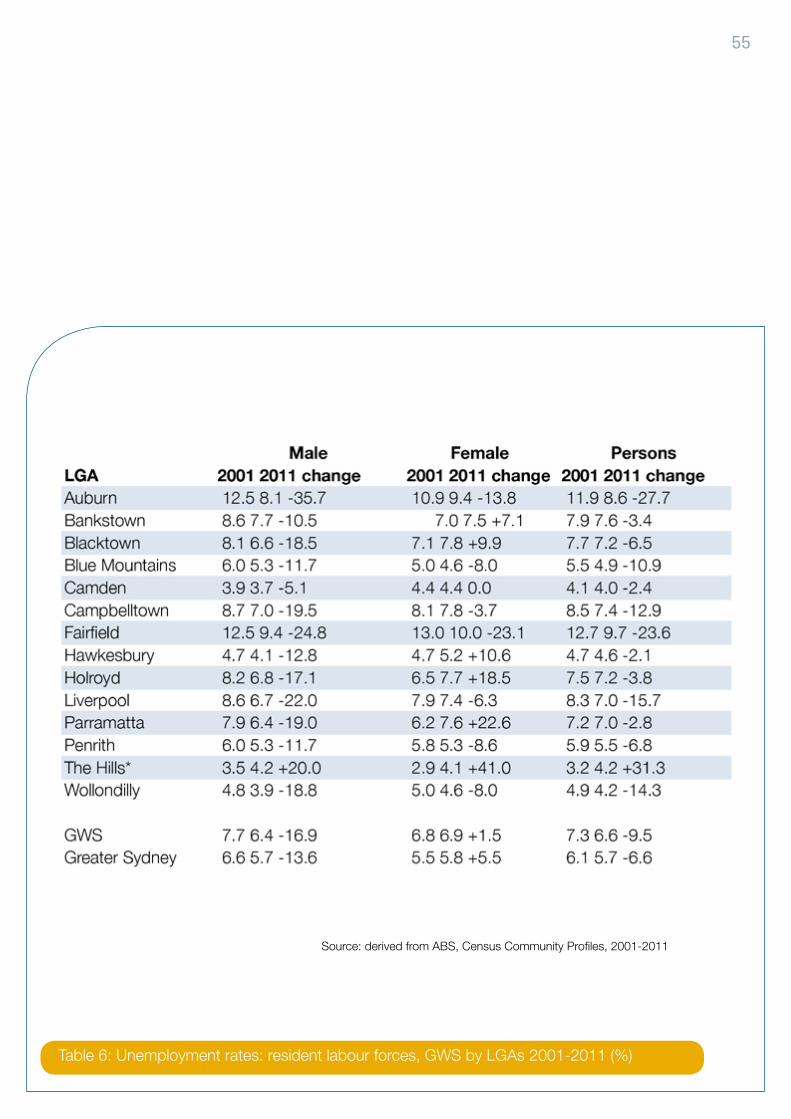
55
Table 6: Unemployment rates: resident labour forces, GWS by LGAs 2001-2011 (%)
Source: derived from ABS, Census Community Profiles, 2001-2011
56
Despite unemployment rates being low in GWS throughout the 1950s and 1960s, they were consistently higher for women than men. However, the economic restructuring of the 1980s reversed this gender difference in GWS, as it did in the national economy. Greater numbers of women entered the labour force during the 1980s, especially into traditional female employment sectors like retailing, clerical work, and health and personal services, all of which were growth sectors in the metropolitan economy. As we have seen, males suffered high rates of retrenchment from manufacturing during the 1980s while women increased their participation in that sector through an expansion of part-time or casual positions in some manufacturing sub-sectors, notably food processing and clothing manufacture, and including the rise of home-working. Not surprisingly, then, the impacts of industrial restructuring from the mid-1980s to 1990s in GWS were borne disproportionately by men in the inner LGAs which had the most industrialised resident labour forces.
By 2001 metropolitan unemployment rates had fallen to 6.6% for men and 5.5% for women reflecting buoyant conditions in the national and, especially, the Sydney metropolitan economy during the previous five years (Table 6). Yet in GWS unemployment rates for men remained higher than for women in 10 LGAs. Fairfield had the region’s highest rates in 2001 for both men (12.5%, shared
with Auburn) and women (13.0%). Unemployment rates for women also remained very high in Auburn by national standards (10.9%). Employment in the resident labour forces of both Fairfield and Auburn remained skewed towards economically-vulnerable trades and labouring occupations and male-dominated sectors such as transport, storage and manufacturing. In Camden low female unemployment rates (4.4%) were nevertheless higher than for men (3.9%), in an outer LGA still industrialising; and unemployment rates for women and men were similarly low in the outer LGAs of Hawkesbury and Wollondilly.
Between 2001 and 2011 there were significant changes in the incidence of unemployment and these intensified after 2006. While the unemployment rate for men in Greater Sydney had fallen to 5.7% by the 2011 census, it increased slightly for women to 5.8% over this decade. Significant gender differences remained between LGAs in GWS. Auburn and Fairfield retained the highest male unemployment rates although experiencing the region’s biggest fall as men moved away from manufacturing and increased their presence in sectors like construction, professional services and health care; and, in Auburn, wholesale and retail trade. The lowest unemployment rates for men in 2011 were in Camden and Wollondilly, while all outer LGAs except Campbelltown had lower rates for men than the metropolitan average for men. In Campbelltown the proportion of resident workers with jobs in manufacturing in 2011 was highest among outer LGAs. Finally, for men, by 2011 all inner LGAs had higher male unemployment than the metropolitan level.
Unemployment for women for 2011 remained highest
Section 6.3 gender and age differences in unemployment

57
in Fairfield and Auburn, although these LGAs also experienced the biggest relative falls over the decade. Unemployment rates for men fell more than for women in 8 LGAs while female unemployment rates actually rose in The Hills (a 41.0% increase, albeit from its low base) and Hawkesbury, among outer GWS LGAs; and Parramatta, Holroyd, Blacktown and Bankstown among inner GWS LGAs. Taken together, these changes reversed the pattern of lower unemployment rates for women which had persisted in GWS since the early 1990s. By 2011 female unemployment rates were higher than for males in 10 LGAs across both inner and outer areas, a reversal of the pattern in 2001. This reflects some significant changes in labour market interactions as pictured in Figure 5.
Finally, unemployment rates in GWS are differentiated strongly according to both age and gender. By 2011 youth unemployment had become a significant issue in GWS with major increases during the decade from 2001. At the 2011 census, Greater Sydney recorded unemployment rates of 17.5% for the 15-19 year age-group – nearly three times its overall rate of 5.7% – and 10.2% for the 20-24 years group. By comparison GWS recorded higher rates than Greater Sydney for both of these age-groups (Table 7) and especially for young women in the 20-24 age-group.
Youth unemployment rates varied widely between LGAs in the region, however, especially in the 15-19 years age-group. All inner GWS LGAs had unemployment rates greater than metropolitan level for this age-group, the highest being in Fairfield and Auburn where each had one-quarter of 15-19 year-olds in its resident labour force unemployed. Campbelltown, the LGA with the highest proportions of
resident workers in manufacturing and transport sectors, also had more than one-fifth of its labour force in the 15-19 years age-group unemployed. All other outer LGAs had rates below metropolitan level for 15-19 year-olds, with the lowest rates in Hawkesbury and The Hills (each just over 13%).
The same pattern was recorded for the 20-24 years age-group with higher rates than for Greater Sydney in all inner GWS LGAs and lower rates in all outer LGAs except Campbelltown. The highest rates for the 20-24 years age-group were again recorded in Auburn and Fairfield (each more than 13%) and the lowest in Wollondilly (5.9%) and Camden (6.7%).
Rates of youth unemployment in 2011 were clearly highest in LGAs with profiles of resident labour forces skewed towards industrial sectors and broadly blue-collar occupations, and those with the highest proportions of CALD residents. Yet the rates were lowest in outer areas where more entry-level jobs were available in growing sectors like manufacturing and household services.
Overall, youth unemployment rates for men in 2011 exceeded those for women in 12 out of 14 LGAs in GWS, the exceptions being the outer LGAs of Hawkesbury and Wollondilly where rates for young women were higher. In both youth age-groups the highest unemployment rates for men were recorded in Fairfield, with the second highest in Auburn, while Auburn had the highest rates for women in both youth groups.

58
Table 7: Youth unemployment rates for resident labour forces, GWS by LGAs 2011(%)
Source: derived from ABS, Census Community Profiles, 2001 2011

59
Labour force participation rates (defined in Appendix 5) in particular places are affected by a range of circumstances. Economic factors include: national, local and personal economic conditions affecting labour markets, including availability of jobs; levels of income and wealth shaping people’s decisions to seek work or suspend participation in it by undertaking further education and training; regional unemployment rates, which directly affect these decisions either through local experiences of job-search or overall expectations of success; economic constraints on mobility which limit the spatial extent of job-search; and economic decisions about retirement. Demographic factors include high population growth-rates leading to rising proportions of young people seeking work, or lower growth-rates leading to ageing of the labour force. Social and cultural factors include: decisions about home-making and division of household responsibilities between men and women; decisions about further education; and behaviours affecting mobility in job-search. All these factors are affected strongly by government economic and social welfare policies. Because of this complex mix of reasons, participation rates change over the longer-term and vary significantly from place to place.
In Australia, participation rates for women rose nationally from 43.6% of women of working age in mid-1979 to 55.5% by 2001. Over the same period, participation rates
for men fell from 78.4% to 72.2% partly reflecting ‘early retirement’ which, for some men, was related directly to economic restructuring and net job-loss in traditionally male-dominated sectors such as manufacturing. In particular places unemployed men over 55 often found themselves trapped in unstable or precarious segments of local labour markets and often withdrew from the labour force early rather than seek employment through longer-distance commuting or relocation.
By 2001 the overall participation rate in GWS remained just below the metropolitan rate (60.9% compared with 61.5% in Greater Sydney) having been significantly lower throughout the 1980s and 1990s. In those decades GWS witnessed falling participation of men in industrialised LGAs combined with significant discouragement of women who found difficulty finding jobs in sectors and occupations compatible with their domestic circumstances and who, for the reasons discussed above, confined job-searches to over-supplied local labour markets.
Auburn had the lowest participation rate for GWS in 2001 (49.1%) while Fairfield’s rate slumped from 61.5% in the mid-1980s to 52.7% by 2001 (Table 8). The inner-outer split between LGAs in labour force participation was retained without significant change by 2011. After 2008, however, participation rates were affected by uneven impacts of the global financial crisis and a return to conditions of national economic uncertainty.
Section 6.4 changing participation in the labour force

60
Table 8: Resident labour force participation rates, GWS by LGAs 2011(%)
Source: derived from ABS, Census Community Profiles, 2001 2011

61
While the overall participation rate for Greater Sydney had increased by 2006 to 65.6% it fell back to 61.7% in 2011, just above its 2001 level. GWS followed this pattern with significant increases in overall participation by 2006, falling back by 2011 albeit more slowly than for Greater Sydney. Participation rates well below metropolitan levels remained in Fairfield (50.8%), one of the lowest urban rates in Australia, and in Bankstown and Auburn. Higher labour force participation rates persisted in outer LGAs, especially in Camden (69.8%) and The Hills (68.2%), with all other outer LGAs having participation rates exceeding the metropolitan level.
Fairfield and Auburn also had the highest unemployment rates in GWS by 2011, demonstrating the connection between rates of unemployment and participation. In 2011 Camden had GWS’s lowest unemployment rate at 4.0%, some 2.4 times lower than in Fairfield (Table 8). Fairfield also had GWS’s lowest labour force participation rate (50.8%) and employment to population ratio (45.9%). In Camden these rates were 69.8% and 66.9%. One implication of these observations is that if labour force participation in Fairfield was similar to that in Camden the unemployment rate would be a great deal higher. Clearly there is a high level of disguised unemployment in inner LGAs of GWS especially Fairfield, Auburn and Bankstown.
Like for unemployment, the wide differences between LGAs in rates of participation for men and women remained by 2011. Reflecting long term trends in advanced nations worldwide, the male rate for Greater Sydney fell from 69.2% in 2001 to 67.7% by 2011 while in GWS the average male participation fell from 69.8% to 67.3%, just below the
metropolitan rate. But male participation remained well below metropolitan levels in Fairfield and Auburn reflecting further job-shedding both locally and in the wider region from manufacturing and from blue-collar occupations in other sectors. Somewhat paradoxically, even though by 2011 male participation rates had fallen in every other LGA in GWS, inner and outer, as we have observed, the rate rose in Auburn from 57.0% to 60.1%, the largest regional improvement in what remained one of the region’s lowest participation levels.
Changes in participation rates for women were quite different. In common with Greater Sydney, the overall female rate for GWS rose somewhat over the decade although growth was slower than for the metropolis as a whole. Female participation remained low in Fairfield and Bankstown, with neither LGA sharing in the general trend of rising participation by women during the decade. While female participation remained low in Auburn, it rose rapidly from 41.3% (2001) to 46.2% (2011) in the LGA, the region’s biggest increase, approached only by Wollondilly on the outer fringe. Overall, female participation rates rose in 11 LGAs, while falling somewhat in industrialised Liverpool to a rate well below the metropolitan level; and falling at the same rate in The Hills, although participation there remained high. In general, then, these patterns strongly suggest changes in participation rates for men and women in GWS have been determined by different combinations of predominantly local factors.
By 2011, youth participation rates showed similar diversity across GWS. In all inner LGAs except Blacktown, rates of participation in the labour force for 15-19 year-olds were

62
significantly lower than the metropolitan level (39.6%), falling to 22.8% in Auburn. They were significantly higher in all outer LGAs rising above 50.0% in Camden, Hawkesbury, Penrith and Wollondilly. Similarly, all LGAs in GWS except Blacktown recorded significantly lower participation rates than the metropolitan level (71.9%), falling to 58.0% in Auburn. They were significantly higher in outer LGAs rising above 80.0% in Camden, The Hills and Wollondilly. For Greater Sydney participation rates in 2011 for both youth age-groups were higher for males than females, a pattern repeated for all LGAs in GWS except Wollondilly where participation rates for young women were higher than for young men.
Fully understanding the processes depicted in Figure 5 would require more detailed information than is available from ABS censuses and monthly labour market surveys. Yet the trends give a broad understanding of how multiple factors shape people’s access to employment in GWS. Access to employment and the way it changes over time are rarely determined by any single factor but by combinations of: access to transport and social services; people’s gender, age and ethnic background; and their employment skills and qualifications. All these help determine people’s access to the jobs available within commuting ranges that also vary according to such factors.
A good example is provided by experiences of people from CALD backgrounds for which there are above-average proportions in resident labour forces of all inner LGAs in GWS. Successive migration streams over the past 40 years have generated increased cultural and language diversity in these LGAs, rightfully seen by the NSW government in their recent regional plans for GWS as potential regional competitive advantages. Ethnic diversity can lead to growth of employment, for example in more specialist retailing and hospitality including what Ghassan Hage (1997) has called ‘cosmo-multicultural’ retailing – providing ethnically-diverse experiences to people from majority cultural groups both within GWS and from other regions of the city. Such businesses are commonly started by people from CALD
Section 6.5 segmentation in the CWS labour markets

63
groups who initially entered local labour markets through unskilled jobs in manufacturing or services, and later established small retailing or food-related businesses often to escape low-income or precarious labour market segments (Collins, 2000), or to pursue entrepreneurial practices seen as common to a particular ancestry group (Wray et al 2011).
Over time, however, ethnicity can also act as a brake on successful participation in the labour market or in business management. Outright discrimination, most notably towards recent arrivals including refugees, has been one of the most cited constraints on access to employment opportunities in large cities (OECD 2008). Discrimination can exclude people from access to jobs or trap them in unstable or precarious segments including when their home-nation post-school qualifications are ignored or not granted Australian equivalence. A wide range of anecdotal evidence, especially reported by social workers and community service-providers in GWS, confirms discrimination is a significant force segmenting suburban labour markets over the past decade yet there has been less recent, systematic academic research into these kinds of discrimination than into impacts of gender, age and skills. Most Australian research evidence deals with impacts of language.
Even for those in work, the lack of proficiency in spoken or written skills in English can trap people of CALD backgrounds into unskilled production or service jobs. Developing English proficiency in both workplaces and non-working lives opens up new sectors and occupations. For many migrant workers, strengthening English often
depends on patterns of social contact which are shaped strongly by cultural differences and the nature of workplaces in particular sectors. Some women of CALD backgrounds, undertaking a majority of child care and other household responsibilities, experience the slowest development of English language even though they may be fluent in several other languages and have backgrounds in service sector or information-based industries in their countries of origin. For such people, employment choices in inner LGAs of GWS have often been restricted to casual and unskilled jobs such as cleaning, factory work or domestic work, either in other people’s houses or clothing outworking in the home.
Recent job-loss in GWS from manufacturing, and from unskilled work generally, has levied disproportionate impacts on both women and men of migrant background especially in LGAs such as Fairfield and Holroyd where there are high proportions of people from CALD groups and where above-average proportions of the labour forces remain constrained to seek jobs in those sectors. It has also affected CALD groups in Auburn and Parramatta, where proportions of manufacturing workers are lower but where rapidly-growing opportunities in business and other information service jobs are often inaccessible because of spoken or written English requirements. In 2011 Fairfield recorded the highest levels of unemployment in Sydney for both women and men.
Auburn is more complex, with the highest levels of overseas-born in the labour force in GWS. The growth of jobs in wholesaling, transport and storage since 2001, both locally and in adjacent LGAs, has reduced Auburn’s unemployment rates especially for men. Yet unemployment
Recent job-loss in GWS from manufacturing, and from unskilled work generally, has levied disproportionate impacts on both women and men of migrant background.

64
rates in Auburn remain among the highest in Sydney despite the LGA experiencing one of the fastest rates of job-growth in GWS since 2001, second only to outer LGA Camden. Many women and men from CALD backgrounds are effectively excluded from the growing professional and business industries.
Differing combinations of factors revealed in Figure 5 also underpin the reversal noted earlier in unemployment rates for men and women across GWS with male unemployment falling during the decade since 2001 while rates for women rose. Labour market research in Australia and internationally over the past 30 years suggests women living in suburbs of large cities tend to work closer to home than men although this varies substantially with age, child-raising responsibilities and occupation. This means the geographical extent of labour markets is different for different groups of women (Hanson and Pratt, 1992:103-19). Women in higher-income managerial and professional occupations and, more generally, those employed in male-dominated service sectors, travel further to work while women with children and working in lower-income employment are less able to afford (or justify) long-distance commuting or the child-care services which would help facilitate it. For these reasons, women’s access to employment opportunities across GWS is often geographically-constrained, which reflects both household incomes and divisions of labour, especially around child-rearing and care for the elderly. Lack of affordable child-care, widespread in GWS, reduces substantially the job-opportunities of primary care-givers, still mostly women, despite major changes in household divisions of labour over the past 20 years – although, perhaps, these have been more common in higher-income households. In any event, child care constraints are greatest for single-parent families.
History here is important. From the early 1990s, continued suburbanisation of jobs in retailing, food preparation and accommodation, clerical work and a range of social services provided employment for relatively high proportions of women in GWS. Since 2001, however, a significant number of these female-dominated sectors have experienced down-sizing or retrenchment especially since the return of economic uncertainty after 2008. This has particularly affected retailing and private-sector clerical work, while lower-paid clerical positions have also been affected by cutbacks in regional public sector agencies over the past decade. Between 2006 and 2011, most outer LGAs experienced job-shedding in their retail sectors which affected the availability of local part-time work, a preference for many women managing domestic responsibilities especially child-raising. These sectoral changes are a large contributor to rises in unemployment levels for women, compared with those for men, in a majority of outer LGAs, including The Hills, where many women remain constrained to search for jobs locally because of their age, qualifications or household responsibilities.
Then, over the past five years, the widely-observed tendency to localism in women’s job-search and travel behaviours is contributing again to rates of unemployment for women exceeding those for men in GWS. This has involved both loss of part-time work in retailing and other services in both inner and outer GWS LGAs, and job-shedding from manufacturing in inner GWS LGAs, except Liverpool, where local sources of part-time or casual work for many women have probably dried up, particularly for older workers and those from CALD backgrounds. Falling levels of localisation and regionalisation in GWS since 2001 also show many workers have had to travel further afield to find work, a situation usually favouring men.
Lack of affordable child-care, widespread in GWS, reduces substantially the job-opportunities of primary care-givers, still mostly women, despite major changes in household divisions of labour over the past 20 years.

65
Finally, Figure 5 helps us understand why high unemployment in GWS has remained highly-localised since the early 1990s. Unfortunately processes more observable at finer scales are buried by analysis based on LGA data even though the LGA is the basic geographical unit for census community profiles and many ABS labour market descriptions. Examining census data at the more granulated ‘collector district’ (CD) level shows a clustering of high unemployment levels across GWS in particular suburbs and localities within those LGAs experiencing rates of unemployment above metropolitan averages (as identified in Figure 6). At the 1996 census, for example, clusters of localities in inner GWS LGAs like Auburn, Bankstown, Fairfield, Liverpool and Blacktown (especially its western SLA), plus Campbelltown South SLA, had unemployment rates exceeding 20%. At this time, however, Blacktown and Liverpool only recorded rates of 9.1% and 10.4% respectively at the LGA level. While the LGA rates were above the metropolitan level, the analysis shows that many CDs in Blacktown and Liverpool were experiencing unemployment rates at or below metropolitan average while others had rates that greatly exceeded the average.
The prevalence of high unemployment clusters in GWS has been substantially the same in all censuses since 1996. While detailed research is essential to fully understand this remarkable spatial stability over 15 years, Figure 6 suggests three things.
1. The presence or absence of employment opportunities, including nearby ‘job-surplus’ LGAs, does not explain either the location of the clusters or their persistence during periods of national economic
restructuring, downturn and prosperity. Regional growth of employment, while a crucial ingredient in overall levels of access to jobs in GWS, does not on its own address multi-causal problems of job access experienced by residents in particular social groups and localities.
2. Social, economic and cultural factors affecting access to employment, operating at specifically-local levels, are clearly combining to exclude many people in these clusters from access to employment, or trap them in precarious segments of the labour market when paid work is eventually secured.
3. Poor access to affordable transport interacts with gender, age, low-skill profiles and, in some LGAs with ethnicity, to constrain both job-search patterns and commuting.
Most probably, these three things acted to reproduce these long-standing clusters of high unemployment rates in 2011.
Finally, it needs noting that while there is a strong, well-known correlation between the clusters of high unemployment and large clusters of public or social housing, for example in Liverpool and Blacktown, Figure 6 is not a map of public or social housing in Western Sydney. Household characteristics also shape labour market outcomes with high rates of joblessness in single-parent families recorded in many of the clusters. In these localities, high levels of inter-generational unemployment have been of concern to local social workers since the early1990s given high-levels of unemployment for people under 24 but especially, since 2006, in the 15-19 years age-group.

66
Figure 6: Unemployment, GWS by collector districts 2001
67
The primary role of access to employment in reducing poverty and inequality across all societies is well established. Not surprisingly, therefore, the sectoral and occupational profiles of the resident labour forces in GWS and the segmentation revealed in the labour market underpin significant differences in the distribution of income and wealth both within GWS and between GWS and other parts of the metropolis. While this report’s main intention is the analysis of labour market trends and processes, rather than the nature and consequences of disadvantage and inequality, acknowledgement of observable relationships between jobs access and standards of living provides an important argument for more concerted attention to the provision of jobs in GWS.
Figure 7 shows Australian Taxation Office (ATO) data 2009-10. The data include taxable income from all sources: wages and salaries, interest payments, dividends, capital gains and taxable government payments. These are aggregated according to postcode and the resultant income divided among all people living in each postcode according to census data. Usually, maps of income inequality compare incomes for individuals or households, based on the often questionable entries people make on census forms about income. Instead Figure 7 uses ATO data, probably the most accurate income data available. Because total income received is divided by the actual number of people resident in a postcode, Figure 7 shows how much money is available on average for people to live on. The pattern shown in Figure 7 is stark.
The lowest income category (red) shows the poorest one-fifth of postcodes according to income received per resident, the limit for this quintile being $22,000 per annum. The geography is clear. The lowest income areas in Sydney occupy a corridor bounded roughly by the Great Western Highway and Canterbury Rd through Sydney’s outer west and southwest, following the Hume Highway to Campbelltown LGA. The ATO data show a clear inequality line in Greater Sydney, roughly along a fold in the map from the city’s northwest (The Hills LGA) to the southeast (Sutherland Shire). The inverse of the lower-income districts to the south and west of this fold are the deep green postcodes of Sydney’s north shore suburbs running from The Hills to Chatswood and Warringah, across Sydney harbour to its eastern suburbs. The high-income quintile commences at $45,000 per resident and extends to $120,000 per resident. Between highest and lowest quintiles are three intermediate categories between $22,000 and $45,000 which create an orderly social slope of income inequality across the city.
chapter sevenincome and wealth

68
Figure 7: Taxable income, Sydney by postcode 2009-10
Source: Urban Research Centre 2013
69
The patterns revealed by Figure 7 are underpinned by three important relationships between low incomes and the profiles of resident labour forces in GWS.
1. This report has revealed a rising deficiency of employment opportunities relative to the growth-rates of resident labour forces in inner LGAs of GWS such as Bankstown, Blacktown, Fairfield and Holroyd. While employment still grew faster than resident labour forces in most outer LGAs, GWS’s inner LGAs remain job-deficit areas, and these areas have generated high rates of out-commuting since 2001 as a consequence.
2. Participation rates in GWS remain well below those of eastern and northern Sydney for all the region’s inner LGAs especially for women and young adults. Incomes work much harder in households in these inner LGAs of GWS than in other areas of Sydney, as is shown in Figure 7.
3. This report shows GWS has higher concentrations of workers in sectors and occupations with lower wages. The region also has greater proportions of workers who are poorly qualified or lack relevant experience, have limited or diminished access to employment suitable to their qualifications, or are forced into precarious labour market segments.
The ATO data show a clear inequality line in Greater Sydney, roughly along a fold in the map from the city’s northwest to the southeast.

70
This report shows that labour market outcomes for GWS are disappointing. At the very least outcomes are falling well short of government planning aspirations for GWS which at the very least seek to maintain the region’s ratio of jobs per 100 workers at early 2000s levels (see NSW Department of Planning 2005). But our report reveals in its detail that access to employment – in all the ways we define access – is insufficient to satisfy the reasonable quality of life expectations of GWS households. Insufficient access has increased out-commuting rates and distances, raised unemployment levels, dissuaded significant group of workers to withdraw from the labour market, diminished opportunities for labour market adjustment as employment sectors undergo dynamic change, and continued to exacerbate labour market inequalities experienced by significant groups, notably women, but also of youth and those from CALD backgrounds.
This chapter engages with some important policy questions which we think require urgent attention. It then presents a limited discussion of policy possibilities. The purpose of this discussion is not to provide a blueprint for employment policy in GWS. Rather, the discussion sets up what we call a ‘policy pathways process’. This process has three components:
1. An opportunity to respond to the analysis contained in this report.
2. A call for ideas of how to address GWS’s poor employment access.
3. A process for assessing these ideas leading to the production of a set of labour market policy pathways, being actions that can and should be undertaken to advance the region’s labour market performance.
At the risk of by-passing important detail, we would like to highlight what we see as the major policy needs arising from our analysis in this report. They are these:
1. Because Western Sydney is a growing urban area of major significance, the region will continue to experience a net growth in jobs. This will come from the additional economic activity generated in the private sector by increased construction spending and by increases in household spending. Net jobs growth will also come from increased provision of government services especially in health, education and community services, where provision is directly linked to population growth. The problem, then, is not a problem of the absence of growth, but whether growth is sufficient to meet the region’s ongoing labour force growth.
Also important is the question of the composition of growth such that a range of desirable jobs are generated in sufficient numbers to ensure decent standards of living across all households groups. Importantly, the range of jobs generated should be broad enough to ensure that dynamic economic change can be catered to without large segments of the labour force becoming structurally unemployed, or assigned to marginal labour market positions.
chapter eightperspectives on employment policy
Introduction
Policy needs

71
2. Our analysis is based on evidence of the last 25 years—and especially between 2001 and the present. This evidence shows that jobs growth on its own makes insufficient inroads into the problems of labour market segmentation. In fact, the processes of jobs growth in GWS can actually cause disruptions for many groups of workers, including the generation of increased unemployment in specific localities and among certain groups of people. We have noted in particular the higher incidence of jobs dislocation in the inner GWS LGAs, among youth more generally, and in respect to men and women with particular social, cultural and education backgrounds, even in the presence of broader jobs growth trends. In turn, the opportunity provided by outward commuting as a way of adjusting to changing labour market opportunities is also influenced by these very specific geographic and socio-cultural characteristics.
3. On its own, an improving labour market cannot guarantee the desired levels of improvement in labour market participation across all GWS households, especially for those households and localities readily defined as having poor labour access. Our analysis shows that access to employment especially for vulnerable groups depends on adequate provision of social services and community support including child care, targeted education and training, and a range of transport and social infrastructure services.
4. The high social and personal costs of failing to meet reasonable employment demands in GWS seems to us to be self-evident. If policy and strategies fail to generate a fair distribution of available, appropriate jobs, then Greater Metropolitan Sydney will suffer the consequences, and bear the costs, of rising inequality and the inevitable social and cultural problems and resentments which are generated. Economically, the costs of ongoing inequality
fall heavily on stretched government balance sheets and inevitably act as a brake on the growth of a global city, as is increasingly evidenced internationally (for review see Jaumotte et al 2013). Notably, the OECD makes the same argument as we do in this report:
“Labour productivity remains the main driver of long-term growth. Priority should be given to reforms aimed at developing skills and knowledge-based capital. Raising the quality and inclusiveness of education systems will underpin this.”
Given the need in many countries to tackle rising inequalities and hardship, governments should give priority to pro-growth policy packages that help promote equity and inclusiveness. It is particularly important to lift the earnings potential of the low-skilled and make it easier for women to join the labour force.”
(OECD 2015, p.14)
5. A major implication of our analysis is that no single level of government is capable on its own of delivering the composite of policies and strategies needed to address the growth needs for the GWS labour market. National economic and fiscal policies establish the settings within which the demand for labour ensues. National immigration policies influence the demography of GWS in major ways. State government-led expenditure on infrastructure steers the urban structure of GWS and defines all sorts of land use and travel possibilities. Metropolitan planning strategies provide the important details that give the GWS economy its geography and enable it to run. State government policies determine the provision of education and health and other key services, and the employment that these services bring. Finally, local government is crucially important in the provision of community and local services, important

72
for both employers and households. And there are many other examples. The point is clear, though: it is the raft of government action acting together that ensures successful labour market outcomes.
What then of policy itself? The following section sets out the parameters of what good labour market policy for GWS might look like.
In this section we make some summary observations about the types of domains where policy development and implementation are needed in order to generate better labour market outcomes for the region. As noted above, we do this as a prompt for a next stage in the policy pathways process that we are undertaking.
At the outset, we note that a labour market can never be the smoothly functioning mechanism depicted in orthodox economic theory. Our analysis has shown how labour market outcomes are the result of complex social, cultural, economic, personal and household forces and events. Such complexity, however, is not an excuse for governments to withdraw from attempts to produce better labour market results. Despite multitudes of social experiments worldwide in recent decades, there is no proof that, when left to their own devices, labour markets generate more efficient and socially desirable outcomes. In fact, the evidence is overwhelmingly to the contrary.
One guide to labour market policy and intervention comes from Enrico Moretti (2012). Moretti’s work is highly useful here because we see it as the best, most recent guide to labour market policy. As such it provides an excellent lead-in to our policy pathways process.
Moretti’s insights capture two important ingredients for effective public policy development. One is a reliance on proven knowledge, a contrast to the evidence presented in a disappointing range of narrow labour market and urban economy manifestos that seem to have dominated the barrows at airport bookshops in recent times. The other is a determination to show common sense, and this includes a consciousness to communicate clearly. Moretti’s use of proven knowledge and common sense produces a valuable guide to labour market policy development for Western Sydney.
To this we bring our own practice in economic geography, an important field of academic endeavour that combines robust abstractions about how spatial economies evolve combined with detailed observations of actual urban and regional economies undergoing transition. From this background, then, we recognise four major themes in Moretti’s book which are worth recounting.
Policy directions

73
The spatial forces of agglomeration
First, economic activity is most successful when located within a cluster of complementary or similar producers, many of which are consumers of each other’s products. One term for this in economic geography is the Marshallian district, named for Professor Alfred Marshall and his work in the early twentieth century on the reasons why Sheffield emerged as a world leader in finely-crafted steel products, like surgery appliances and quality cutlery. A century on from Marshall we can find example after example of successful clusters: the Hollywood movie industry and the software industry in Silicon Valley in California, the motor vehicle racing industry in the Thames Valley in southern England UK, the furniture design industry in northern Italy, engineering in southern Germany, publishing in New York and so on. Of course, these are all stand-out globally-important clusters. But the same locational forces underpinning such agglomerations explain the success of suburban clusters of shops, factories, processors, distributors and services providers all round the world. Simply, when sufficient producers with like operations, however defined, locate in a common territory, then cost structures will be lowered, markets will grow and rates of innovation will accelerate in the presence of “knowledge spillovers” and other mutually beneficial processes. The lesson here for Western Sydney labour markets, as we explain in more detail below, is that concentrations of economic activity are not only good for business growth and competitiveness but increased concentrations of employment improve job access especially though easier transport planning.
In the context of discussion about the benefits of urban economic agglomeration we make brief comment here on
Sydney’s so called ‘global economic corridor’, sometimes called the ‘global arc’ (for detailed argument see O’Neill et al 2008). This area is identified in many government documents as extending from Macquarie Park in the inner north-west, through North Sydney and the Sydney CBD to Botany Bay with its port and international airport precincts. Along the corridor we find high concentrations of knowledge-intensive financial and business service jobs and clusters of regional headquarters for globally-linked firms surrounded by concentrations of high-status, high-income residential areas. Sub-regions along the corridor have recorded the strongest employment growth of all metropolitan sub-regions over the last two decades.
Our concern about the idea of the global economic corridor stems from two observations. One is that there is a paucity of research which accurately records and analyses what is actually taking place along the corridor. Typically those who use the idea of the corridor assume that there is an established causal relationship between employment and business growth along the corridor and the positive forces of globalisation. Certainly this strong growth can be observed. But there are many possibilities for the source of this growth beyond vague notions of agglomeration economies across firms involved predominantly in the global economy. These alternate explanations include property market effects, advantages from access to a stable highly skilled northern Sydney residential labour force, and sympathetic land use planning over many decades.
The second observation is that a focus on global Sydney and the corridor has generated a ‘natural’ language for talking about Sydney such there is a mindset which

74
overlooks the importance of GWS to the daily workings of the global city or, worse, fosters a belief that somehow outer suburban areas are marginal to or absent from it. Following Fagan et al (2004) we point to the urgency of developing new understandings about the geography of Sydney’s urban economy based on accurate research into the way it is composed; and which reposition and elevate Western Sydney in the mindsets of decision-makers and opinion leaders in both public and private sectors.
Human capital
The second theme in Moretti’s book comes from human capital theory. This theory says that investing directly in the skills and knowledge of workers is capable of increased productivity in the same way that investment in physical capital generates competiveness and wealth (see Keeley, 2007). For recent migrants in advanced nations there are important gains in both employability and regional economic success in undertaking concerted investments in human capital. For the US, the Brookings Institution observes that,
“Increasing workers’ human capital—education and skills training—is a critical pathway toward improving productivity and economic growth. It also advances innovation and the use of technology, which in turn increases the demand for more educated workers. Many experts agree that the long-run competitiveness of the American economy will hinge on the ability of its workforce to make continued gains in education and skills.” (Singer 2012 p.1)
Singer undertakes a major review of the ways investments in human capital directly benefit migrant communities. Again, this gives clear guidance to the types of interventions needed in the Western Sydney labour market, and accords
with the key issues we raise in this report. Singer concludes this way,
“Many of the programs that help workers build skills and that create career pathways are reaching both native and immigrant workers, expanding the supply of skilled labour. Organizations that are trying to unlock skills of professionally trained immigrants are working in fields with high demands, even shortages, of qualified workers. Regional economies matter, but state and local governments, educational institutions, non-profits, and civic and community leaders all play a role in how immigrants integrate into regional labor markets. Ultimately, human capital is the most important ingredient for long-run regional economic prosperity, and efforts to augment human capital must include immigrants and take account of their particular assets and challenges.” (Singer 2012 p.8)
It needs emphasising that investing in human capital has a long successful history in Australia, and this has produced important outcomes for the GWS regional economy and its households. We are concerned, however, at a shift in attitude to human capital spending since the major labour market invention programs of the 1990s. Those programs were largely federal driven with an emphasis on assistance to segments of the labour market most affected in a negative way by the national economic restructuring and competitiveness agenda. Since those times, human capital investment in growth sectors has become increasingly the responsibility of individuals and their families, based on the idea that individuals and households are best placed to decide when and how they participate in education and training. An increasingly deregulated fees-driven tertiary education sector underpins this individualisation of human capital spending. In parallel, we can also observe the
75
contraction of properly funded labour market assistance programs and their rising use in welfare-to-work strategies rather than in meeting broader economic development and change objectives.
This loss of direction in Australia’s approach to human capital investment needs resolution; because the condition of the nation’s largest labour market, that in GWS, depends on there being more thinking about the composition of labour market intervention and better structure and commitment to its delivery. An important first step here is an audit and evaluation of the range of things that take place within the portfolio of human capital spending, including everything from personal assistance measures through to the ongoing task of improving the educational outcomes of our youth.
The ways regions evolve
A third theme in our Moretti-inspired discussion comes from evolutionary economic theory. This branch of heterodox economy theory stresses the need for understanding the complex historical pathways through which a regional economy has arrived in the here and now (see Nelson and Winter 2009). This pathway includes the distinctive histories of a region’s demography, institutions, regulations, firms and economic cultures. These cannot be magically removed and a new economic order imposed on a region. Rather, successful economic change involves recognition of past legacies, good and bad, and thereafter an engagement across the range of social, cultural and economic processes in play in order to ensure a better economic outcome.
A consequence of an evolutionary economic theory approach is an understanding that there are unlikely to be single cause-and-effect relationships that can be acted on in labour market betterment strategies. Strategies need to be composed in ways that address the range of social, economic, demographic and, at times, very personal, circumstances in play. This means that labour market intervention strategies need to have multiple components, but that these need to be both deliberately targeted and complementary across a portfolio of actions. In short, improving access to a larger number of quality local jobs in GWS demands a multi-disciplinary approach to economic and social planning.
Urban hierarchies
Finally, we note the presence in Moretti’s work of an advanced appreciation that economic activity lives and breathes in and around the urban hierarchies that are its hosts. These hierarchies, it should be understood, are determined by the decisions of planners, and the installation and operation of urban infrastructure, and then they are propelled (or retarded) by the locational decisions of firms and households. It is widely agreed that economic efficiency in Western Sydney has suffered hugely by an inattention to the production of desirable urban hierarchies over the last three or four decades. The types of job dispersals and decay that we detail in this report are outcomes of a lack of attention to Western Sydney’s urban structure. So too the now complex journey-to-work patterns of Western Sydney workers are the consequence of the failure to generate employment concentrations that coincide with public transport provision and the location of concentrations of affordable housing.

76
Enrico Moretti’s book takes up the story of economic development in American urban regions at a time when manufacturing transformation is at its height. As in Western Sydney, older forms of manufacturing are disappearing in the face of cheap imports from East Asia. Newer forms require higher skills levels, but often they also involve recruitment of workers under more precarious, marginalised conditions. Nevertheless, the rise of new types of manufacturing is seen by Moretti to be insufficient (by a long way) to counter manufacturing job loss in total. Again, GWS parallels this story of net job loss in manufacturing.
Moretti draws attention to a paradox in the rise of cheap manufactured imports. He says (p.36) that while the working class has probably been the hardest hit by globalisation, they have also gained significantly by falling prices for household consumption goods. While this is probably too broad a generalisation to draw conclusions in a policy sense, it does draw attention to the position of many better-off households in Western Sydney, as being simultaneously attached to the prosperity flows that globalisation can bring, both in terms of access (albeit at a distance) to jobs in the global Sydney economy and access to a wide range of relatively cheap consumption goods in a very competitive retailing environment. But there is a flipside for other groups, those vulnerable to the downside forces of globalisation: loss of jobs in the tradeable goods sector, attacks on regulated working environments, and a diminished will by governments to involve themselves in economic intervention programs.
The core economic question for Moretti, then, is how to select a pathway for economic change that coincides with
the labour needs of high tech manufacturing; knowledge-based business services sectors; knowledge-based education, health and personal services occupations – all of which involve development and adoption of knowledge, ideas and innovation. Then, once these labour needs are satisfied, how to participate in an urban growth economy where there is also an ongoing need for labour to supply all sorts of local services that are not necessarily based on knowledge ideas such as in retailing, materials-handling, basic food processing, certain caring jobs, emergency services and so on. How to ensure this latter group is guaranteed sufficient income to participate genuinely in a global city like Sydney – where the high incomes of the knowledge based workers drive up housing and living costs – is a very difficult regulatory and intervention task requiring the attention of the administrators of a range of government portfolios, and the commitment of politicians to back their efforts with appropriate legislation and fiscal powers. Central to these efforts should be labour market programs and interventions that ensure access to secure, properly remunerated jobs at all levels of the labour market.
Moretti’s explanation of the “forces of attraction” building successful regional economies (see chapter 4) is particularly relevant to GWS. The first observation is that size matters. According to Moretti when there are thick labour markets, ones that have large numbers of workers and large numbers of jobs, the chances of each individual worker finding a matching job is enhanced, the chances of an employer filling a job appropriately is improved, and the dynamism of a region is heightened with the region able to shed jobs as economic change happens without generating long term employment for a sizeable group of the region’s workers. So Western Sydney is well positioned in this respect given the size of both its workforce and most

77
important employment groups.
The second observation concerning the forces of attraction is that size generates the presence of the services providers that are important to innovative firms including the advertisers, legal support, financial advisers, technical and management consultants, logistics firms, engineering support, IT capability and so on. In addition, and perhaps most importantly, size is an attraction to flows of venture capital, or the pool of start-up funds without which innovative ideas aren’t matched with development finance.
Moretti’s third observation about size concerns knowledge spillover, what he terms the “radical collaboration” (p.143) when groups of innovative professionals and technicians work in proximity to each other, either within a firm or in geographical proximity to related firms. These spillovers occur through personal contact, movement of labour between firms, from the activities of training and research facilities that locate nearby, the trade magazines, blogs and trade-shows that occur, the professional associations that operate and so on.
The lessons of size are important for Western Sydney. Certainly Western Sydney has size measured in terms of population and geographical footprint. But critical mass still hasn’t been established in terms of numbers of entrepreneurial and innovative firms. The strategies that can be developed to address this deficit are beyond the scope of this report; but will hopefully be the subject of discussion in our adjoining policy pathways process. What needs to
be noted for now, however, is that the presence of a thriving entrepreneurial, innovative business sector is crucial to the generation of the ingredients of economic success: the dynamism and resilience capable of generating through time the number and range of jobs needed for the growing Western Sydney workforce.
Moretti does have specific things to say about the activity that needs to be undertaken so that regional economic growth can occur in ways that benefit large labour forces in regional economies such as in Western Sydney. He highlights three of these.
1. The power of research and innovation
Not surprisingly for an academic, Moretti stresses the importance of research and development, and the need for well-funded and targeted R&D spending programs over long periods of time. Central to such R&D activity is the higher education sector and the universities. The university does two things simultaneously, it produces the culture of research and invention that drives regional economic success, and it produces the people capable of implementing and driving this success. This type of R&D activity thus generates knowledge and the platform for knowledge spillover.
But on their own, universities cannot succeed. Moretti tells us that,
“Universities are most effective at shaping a local economy when they are part of a larger ecosystem of innovative activity, one that includes a thick market for specialized

78
labor and specialized intermediate services.” (Moretti 2012 p.197)
So R&D, innovation, investment in higher education and the development of successful clusters of innovators are inseparable one from the other. Important is building a virtuous cycle: success, reward, change, feedback, change, further success, further reward. Our report has noted the presence of economic disadvantage in specific Western Sydney communities, a social outcome that is produced and re-produced through a lack of access to suitable employment. Establishing a virtuous cycle of success for all Western Sydney communities is the obvious counter to the poverty traps that currently exist. Yet, as Moretti notes,
“Only the government can initiate these big-push policies, because only the government has the ability to coordinate the individual actors – the workers and the employers – to get the agglomeration process going.” (Moretti 2012 p.199)
2. The human capital century
We have re-iterated Moretti’s arguments for the power of investment in human capital and the need for concerted education and research spending to establish new forms of competiveness in the 21st century. Addressing this need, says Moretti, requires, first, that public research and training expenditure be raised to the level needed. The role of government once again is crucial. As Moretti argues,
“The problem is that the market provides less investment in innovation than is socially desirable, because the return on such investments cannot be fully captured by those who
pay for it. The only way to correct for this market failure is for the government to step in and compensate those who invest in R&D for the external benefits they generate.” (Moretti 2012 p.219)
There are two elements to this. One is the need for elevated levels of direct R&D expenditure by governments. The other is the need to create affordable higher education places that make university education attractive for those who otherwise cannot afford it. Households in GWS without the wherewithal to spend on expensive university fees suffer disproportionately from economic adjustments and downturns. Our report shows the extent to which Australia’s Bradley targets are not being reached in many Western Sydney communities. Poor labour market outcomes are inevitable if Western Sydney’s higher education deficit is not addressed. Moretti’s is a common sense observation, one that should be heeded promptly.
Moreover, there are important social outcomes to be achieved by human capital investments. Again, Moretti states the case plainly for America, but our report demonstrates the relevance to a Western Sydney context,
“The most important aspect of inequality in America today is not what happens to a few thousand tycoons. The increase in their share of wealth is certainly a problem, but not as consequential as the rapidly growing divide between the 45 million workers with a college education and the 80 million workers without one…this is the difference that really matters for people’s lives – their standard of living, their family stability, their health, and even the health of their children.” (Moretti 2012 p.223)

79
3. The big plus of the ethnic economy
Like this report, Moretti’s work is set in a large immigrant nation. Moretti acknowledges that one of America’s major advantages has always been its ability to attract ingenious and ambitious foreigners to its shores. A feature insufficiently recognised, says Moretti, is the rising proportion of American migrants that hold university degrees, including postgraduate degrees. At the same time, though, there remains a large stream of migrant labour that is not sufficiently skilled and is vulnerable, as a result, to exploitation in poorly regulated segments of the labour market.
These are parallels to migrants and their labour market experiences in Australia. On the one hand, there is a growing need for a more genuine embrace of the knowledge and skills of Western Sydney’s immigrant population. This includes not only better articulation of immigrant qualifications with local standards, and the provision of supplementary training when needed, but also a better understanding of different entrepreneurial cultures and practices of immigrant business groups. Our study into ethnic businesses in Western Sydney (Wray et al 2011) makes important recommendations as to how ethnic business networks might be better supported and enhanced.
Finally, we acknowledge the many painstaking and successful labour market intervention programs and regional development activities more broadly that have operated in Western Sydney for decades, and continue in many forms to make a major impact especially at the level of the individual worker. We note the need for a major audit and evaluation of these programs especially in the context
of the multidisciplinary, multi-level labour market policies that we envisage for GWS.
In conclusion we draw attention to Moretti’s constant theme: that investment in education and training is key, and a skilled labour force is produced as a result, and this is probably the most vital ingredient for an innovative economy. But an urban economy needs concentrations of employers, and for this there needs to be long term commitment to business support policies, well-functioning cities with good infrastructure, such that economic clusters develop and thrive. And central to all these things is long term commitment by governments. Nothing else can substitute for this. Society has no other device other than government for the assembly of the resources and the commitment over decades to produce self-sufficient, innovative economies that generate worthwhile accessible jobs in sufficient numbers. A new level of commitment is required for Western Sydney in order for the region to overcome the labour market issues identified in this report.
Producing a successful, jobs-generating, competitive Western Sydney economy is crucial to Sydney’s continued evolution as a global city. As we have said elsewhere, Western Sydney is Australia’s Great Urban Experiment. Getting the experiment right is important for the millions that live in Western Sydney, and thereby for Australia as a whole. The nation’s pathway to a prosperous sustainable 21st century society needs an enduring solution in Greater Western Sydney.

80
Baird M., Charlesworth S., Cooper R. & Heron A., 2012, Women, Work and the Global Economic Downturn, Women’s Safety Series, Australian Government, Department of Social Services, Canberra
Burnley I., Murphy P. and Fagan R. (1997) Immigration and Australian Cities, Federation Press, Sydney.
Collins J. (2000) ‘The other Sydney: cultural and social diversity in Western Sydney’ pp. 34-60 in J. Collins and S.
Poynting (eds), The Other Sydney: Communities, Identities and Inequalities in Western Sydney, Common Ground Publishing, Melbourne.
Fagan, B. (1986) Industrial restructuring and the metropolitan fringe: growth and disadvantage in western Sydney. Australian Planner, 24, 11–17.
Fagan R., Dowling R. and Langdale J. (2004) Suburbs in the Global City: An Employment Profile of Greater Western Sydney, WSROC, Blacktown.
Gibson-Graham J-K, Cameron J. and Healy S. (2013) Take Back the Economy: An Ethical Guide for Transforming our Communities, University of Minnesota Press, Minneapolis.
Hage G. (1997) ‘At home in the entrails of the West: multiculturalism, ethnic food and migrant home-building’, pp. 99-153 in H. Grace, G. Hage, L. Johnson, J. Langsworth and M. Symonds (eds) Home/world: Space, Community and Marginality in Sydney’s West, Pluto, Annandale.
Hanson S. and Pratt G. (1992) ‘Dynamic dependencies: a geographic investigation of local labor markets’, Economic Geography, 68, pp. 373-405.
Hugo, G., (2014) Change and Continuity in Australian International Migration Policy, International Migration Review, 48, 868–890.
Jaumotte. F., Lall, S. & Chris Papageorgiou, (2013) Rising income inequality: technology, or trade and financial globalization? IMF Economic Review (2013) 61, 271–309.
Keeley, B. (2007), “Human Capital”, OECD insights, OECD, Paris.
Kelly J., Donegan F., Chisholm C. and Oberklaid M. (2014) Mapping Australia’s Economy: Cities as Engines of Prosperity, Grattan Institute, Melbourne.
Leigh, A., (2013) On Battlers and Billionaires: The Story of Inequality in Australia, Black, Inc. (an imprint of Schwartz Media Pty Ltd), Collingwood.
Milner A, Kavanagh A, Krnjacki L, et al. 2014, Area-level unemployment and perceived job insecurity: evidence from a longitudinal survey conducted in the Australian working-age population. Annals of Occupational Hygiene, 58, 171–81.
Mitchell B. [graph of manufacturing decline in Australia]. http://bilbo.economicoutlook.net/blog/?p=26092Montoya D. (2012) Western Sydney: An Economic Profile, Briefing Paper No. 6, NSW Parliamentary Research Service, Sydney.
Moretti, E., (2012) The New Geography of Jobs, Houghton Mifflin Harcourt, Boston
Nelson, R.R. & Winter, S.G. (2009) An Evolutionary Theory of Economic Change, Harvard University Press, MA.
references

81
Rosanna S., Wilkins, R. & Weiping, K., (2013) Intensity and persistence of individuals’ social exclusion in Australia, Australian Journal of Social Issues, 48, 83-110.
Saunders, P., 2002, The direct and indirect effects of unemployment on poverty and inequality, Australian Journal of Labour Economics, 5, 507-529
Singer, A., (2012) Investing in the Human Capital of Immigrants, Strengthening Regional Economies, Brookings Institution (Metropolitan Policy Program) Washington.
Stilwell, F. (1989) Structural change and spatial equity in Sydney. Urban Policy and Research 7, 3–14.
Urban Research Centre (2008) North West and West Central Sydney Employment Strategies, Urban Research Centre, University of Western Sydney.
Wray, F., Wu, T. & O’Neill, P.M., 2011, Building Arabic Businesses: Alternative Pathways to Employment Generation in Sydney’s Auburn-Bankstown Corridor, (for NSW Department of Industry and Investment) Urban Research Centre, University of Western Sydney, Parramatta.
NSW Department of Planning (2005), City of Cities: a plan for Sydney’s future, NSW Department of Planning, Sydney.
NSW Department of Premier and Cabinet (2012a) South Western Sydney: Regional Action Plan, Department of Premier and Cabinet, Sydney.
NSW Department of Premier and Cabinet (2012b) Western Sydney and Blue Mountains: Regional Action Plan, Department of Premier and Cabinet, Sydney.
O’Neill P. and McGuirk P. (2002) ‘Prosperity along Australia’s eastern seaboard: Sydney and the geopolitics of urban and economic change’, Australian Geographer, 33, pp. 241-61.
O’Neill, P.M. and others, (2008), North-West and West-Central Sydney Employment Strategies, (for NSW Department of Planning and WSROC) Urban Research Centre, University of Western Sydney, Parramatta
O.E.C.D. (2008) The price of prejudice: labour market discrimination on the grounds of gender and ethnicity, Chapter 3 in Employment Outlook 2008, OECD, Paris.
O.E.C.D. (2015) Economic Policy Reforms: Going for Growth, OECD, Paris.
Peck J. (1989) ‘Reconceptualising the local labour market: space, segmentation and the state’, Progress in Human Geography, 13, pp. 42-61.
Peck J. (1996) Work-Place: The Social Regulation of Labor Markets, Guildford Press, New York.
Rich, D.C. (1988) Australian manufacturing, 1968-1988: recession, reorganisation and renewal, GeoJournal 16, 399-418.
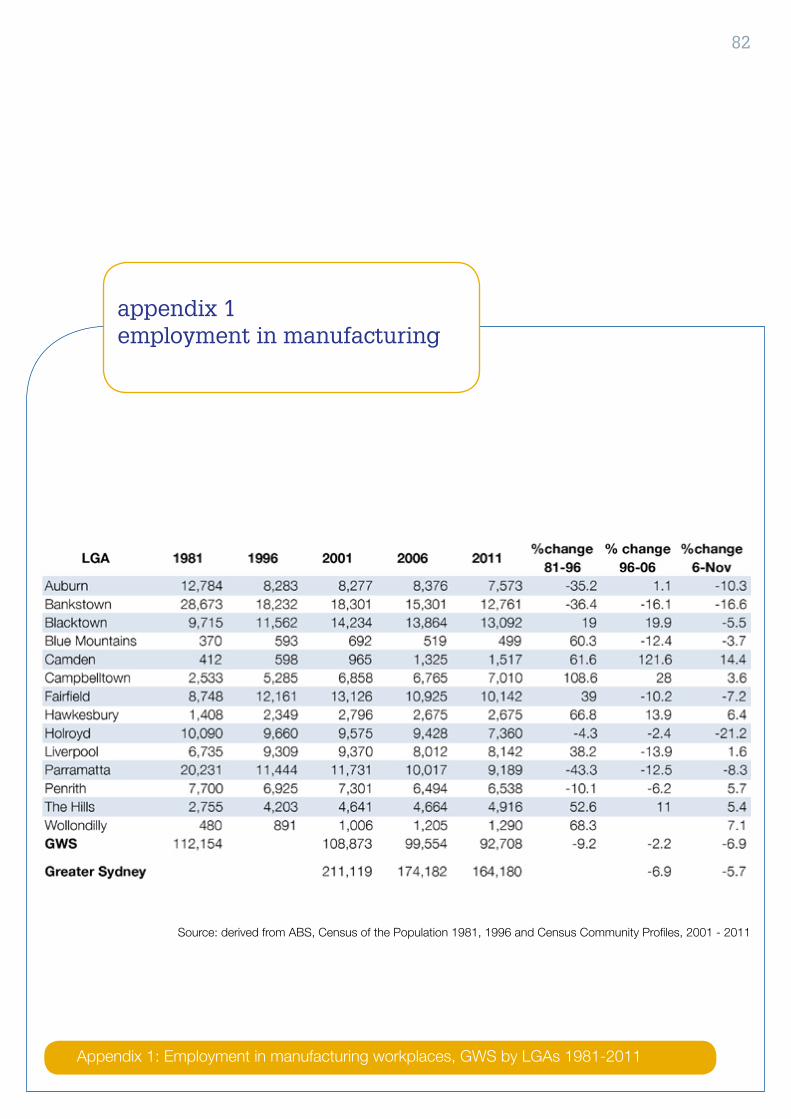
82
appendix 1employment in manufacturing
Appendix 1: Employment in manufacturing workplaces, GWS by LGAs 1981-2011
Source: derived from ABS, Census of the Population 1981, 1996 and Census Community Profiles, 2001 - 2011

83
appendix 2employment by occupation
Appendix 2: Employment by occupation in workplaces, GWS by LGAs 2011 (%)
Source: derived from ABS, Census Community Profiles, 2011

84
appendix 3resident labour force by industry
Appendix 3: Resident labour forces by industry group, GWS by LGAs 2011 (%)
Source: derived from ABS, Census Community Profiles, 2011
GMS: Greater Metropolitan Sydney
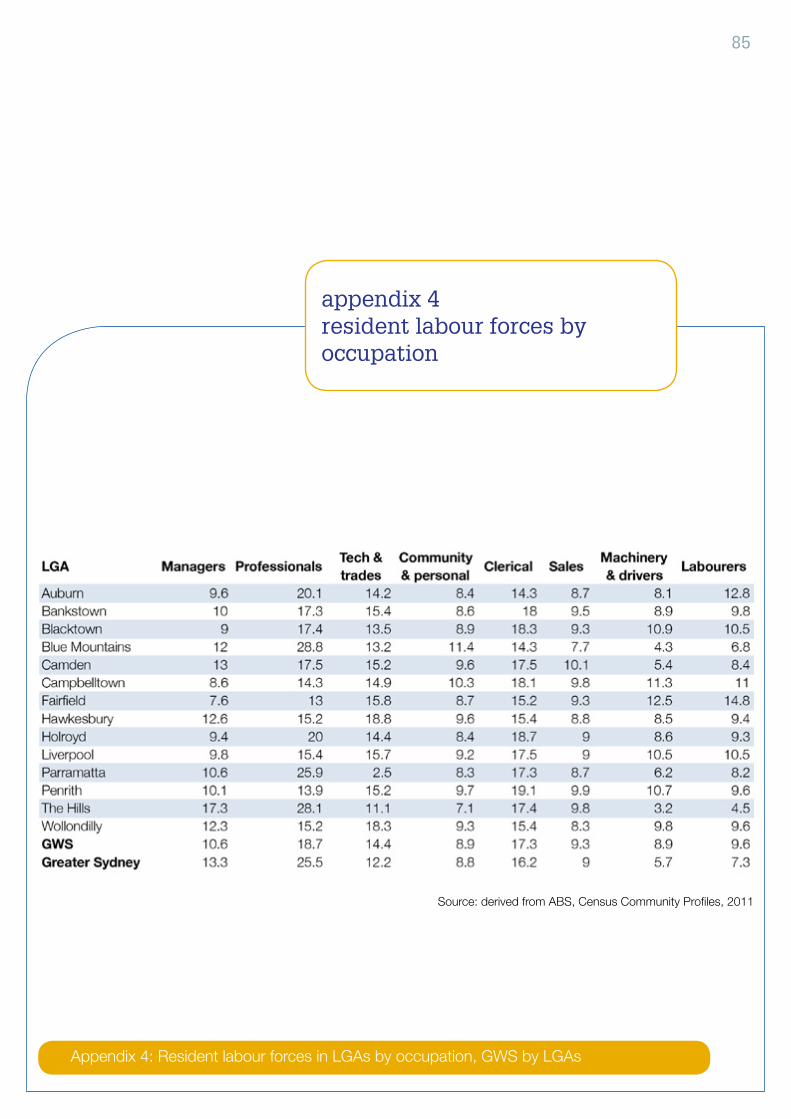
85
appendix 4resident labour forces by occupation
Appendix 4: Resident labour forces in LGAs by occupation, GWS by LGAs
Source: derived from ABS, Census Community Profiles, 2011

86
appendix 5a note on unemployment