work smart: what’s new in excel...
TRANSCRIPT
Work Smart by Microsoft ITSelf-Service BI in Excel 2013 Self-service business intelligence (BI) features in Microsoft Excel 2013 spreadsheet software make discovering and visualizing data easy. These tools, which include Power Query, Power Pivot, Power View, and Power Map, work seamlessly together to extend BI functionality and help you turn data into meaningful information. This document covers Excel BI capabilities (in Microsoft Office 365 ProPlus and Office 2013 Professional Plus) apart from Microsoft Power BI for Office 365. However, the two BI options complement each other: After creating compelling content and reports in Excel, you can use Power BI for Office 365 to amplify those efforts with interactive sharing, collaboration, and data management.
Topics in this guide include:
For more information
Sharing workbooks
Visualizing your data
Merging imported data
Importing data into Excel
2 | Self-service BI in Excel 2013
Putting Excel BI to workExcel 2013 BI capabilities will be useful for anyone who wants to:
Analyze data of wide-ranging size—from a few rows to more than 100 hundred million.*
Speed up analysis of, easily clean up, and shape data. Easily navigate multidimensional and tabular data models. Access, mash-up (combine), and analyze data from virtually any source. Provide compelling data visualization and presentation experiences.
Put Excel BI capabilities to work and discover, analyze, and visualize data to gain valuable business insights. The Power Query, Power View, Power Pivot, and Power Map tools are ideal for this purpose.
Importing data into ExcelPower Query is one of three ways to bring data into Excel from disparate large data sources. It complements the rich native import capabilities of Excel (features on the Excel Data ribbon, for example) and of Power Pivot. With its design for a consistent user experience, Power Query is a great way to get started with self-service discovery, transformation, filtering, shaping, and mashup of data.
Defining queries with Power QueryPower Query is not included in Microsoft Excel. It is available as a free add-in.
To install Power Query:
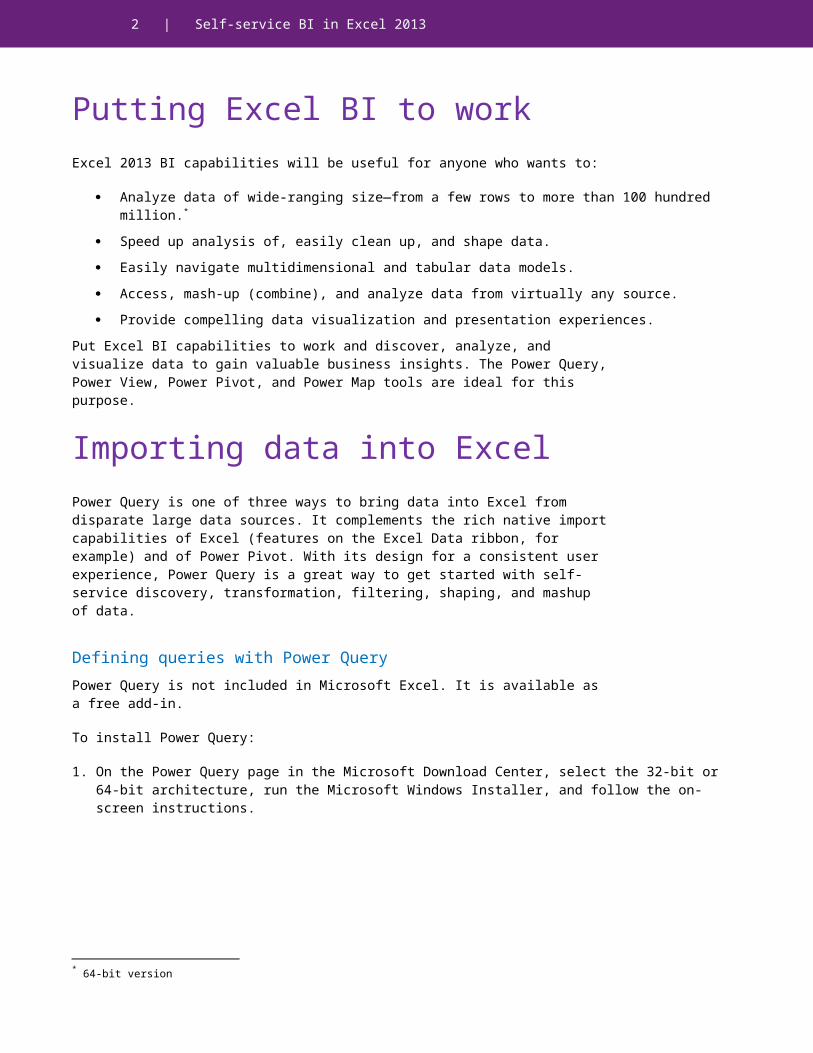
1. On the Power Query page in the Microsoft Download Center, select the 32-bit or 64-bit architecture, run the Microsoft Windows Installer, and follow the on-screen instructions.
2. Restart Excel.To create your query:
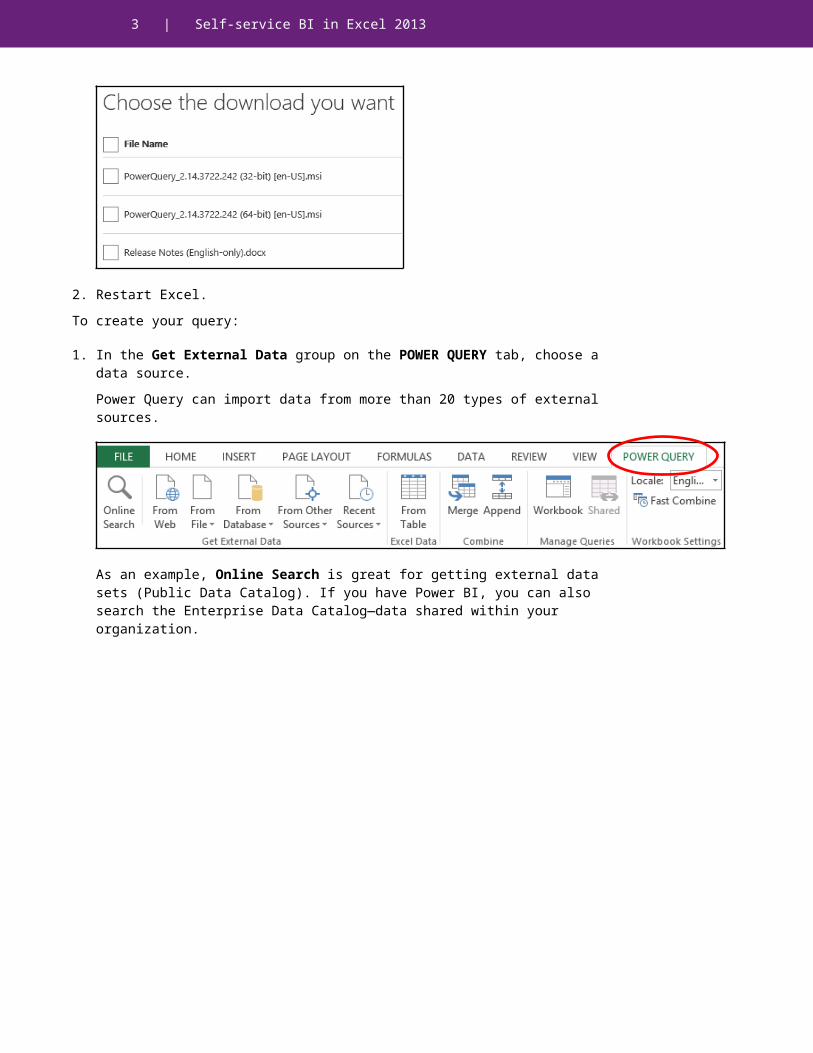
1. In the Get External Data group on the POWER QUERY tab, choose a data source.
* 64-bit version
3 | Self-service BI in Excel 2013
Power Query can import data from more than 20 types of external sources.
As an example, Online Search is great for getting external data sets (Public Data Catalog). If you have Power BI, you can also search the Enterprise Data Catalog—data shared within your organization.
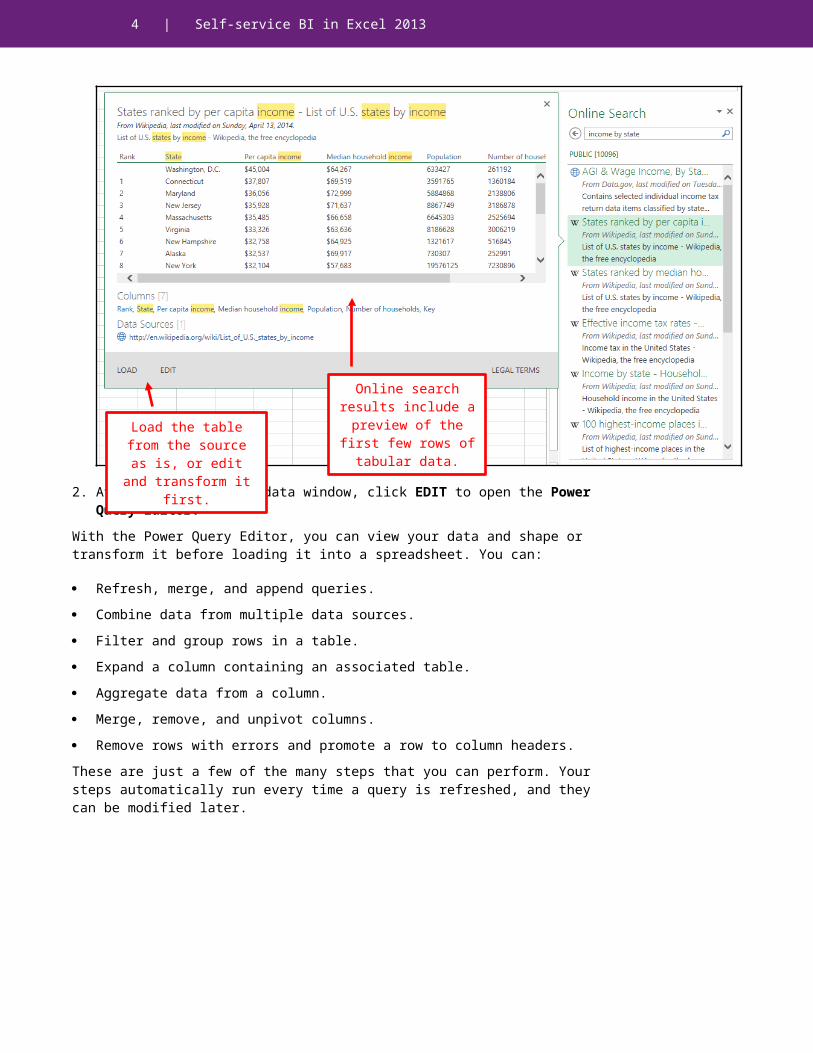
2. At the bottom of the data window, click EDIT to open the Power Query Editor.
With the Power Query Editor, you can view your data and shape or transform it before loading it into a spreadsheet. You can:
Refresh, merge, and append queries. Combine data from multiple data sources. Filter and group rows in a table. Expand a column containing an associated table. Aggregate data from a column. Merge, remove, and unpivot columns. Remove rows with errors and promote a row to column headers.These are just a few of the many steps that you can perform. Your steps automatically run every time a query is refreshed, and they can be modified
Online search results include a preview of the first few rows of
tabular data.Load the table from the source as is, or edit and transform it first.
4 | Self-service BI in Excel 2013
later.
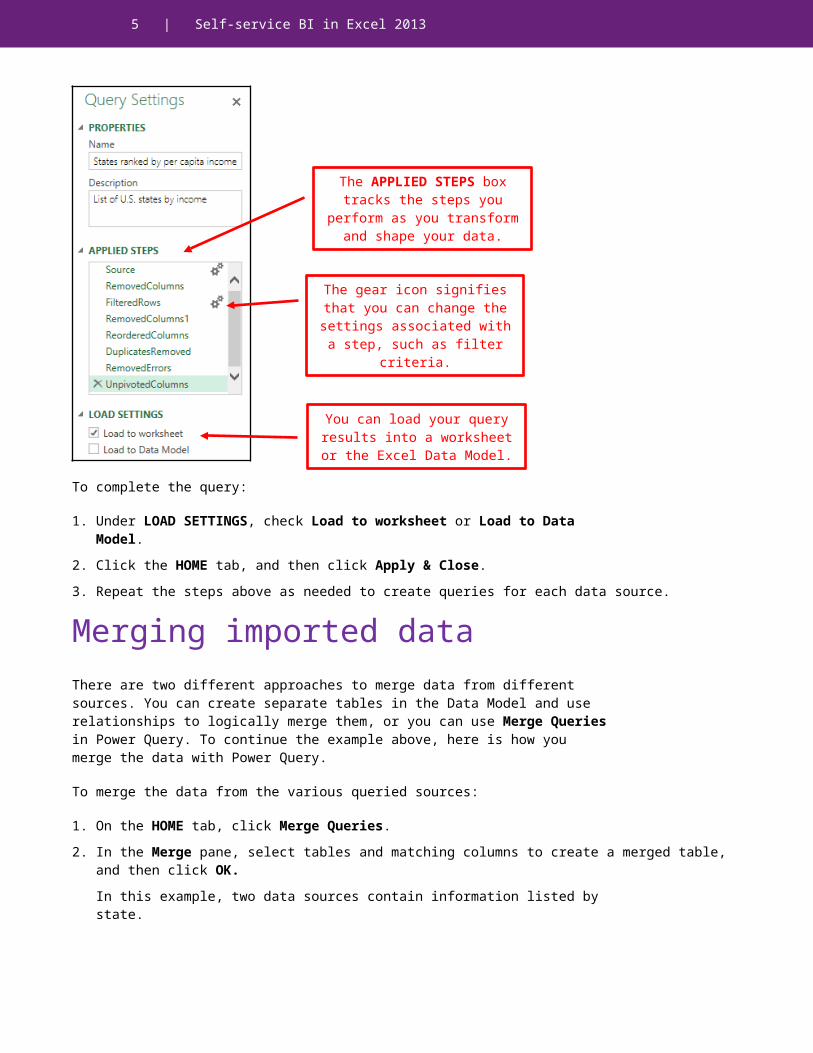
To complete the query:
1. Under LOAD SETTINGS, check Load to worksheet or Load to Data Model.
2. Click the HOME tab, and then click Apply & Close.3. Repeat the steps above as needed to create queries for each data source.
Merging imported dataThere are two different approaches to merge data from different sources. You can create separate tables in the Data Model and use relationships to logically merge them, or you can use Merge Queries in Power Query. To continue the example above, here is how you merge the data with Power Query.
To merge the data from the various queried sources:
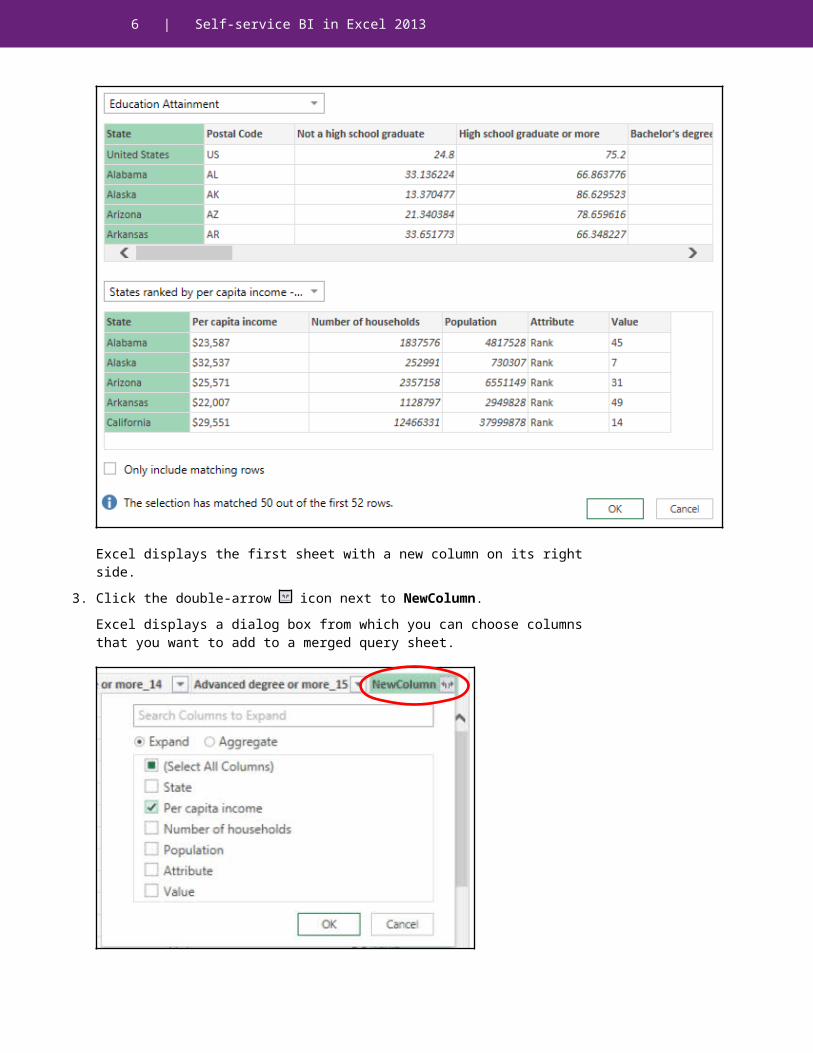
1. On the HOME tab, click Merge Queries.2. In the Merge pane, select tables and matching columns to create a merged table, and then
click OK.In this example, two data sources contain information listed by state.
The APPLIED STEPS box tracks the steps you perform as you
transform and shape your data.
The gear icon signifies that you can change the settings
associated with a step, such as filter criteria.
You can load your query results into a worksheet or the Excel
Data Model.
5 | Self-service BI in Excel 2013
Excel displays the first sheet with a new column on its right side.3. Click the double-arrow icon next to NewColumn.
Excel displays a dialog box from which you can choose columns that you want to add to a merged query sheet.
You can repeat these steps to merge as many queries as you need.
6 | Self-service BI in Excel 2013
The Power Pivot add-in Power Pivot plays an important role in merging and importing data. Power Query supports merging by more than one column, while Power Pivot supports only a single column. Power Query also allows duplicates in keys and can create duplicate rows, but doesn’t support importing from online analytical processing (OLAP) or tabular data; only Power Pivot supports that. Native Excel capabilities and Power Pivot are much faster at importing compared to Power Query. As you learn more about BI, you’ll want to explore Power Pivot.
In Excel 2010, you can install the Power Pivot add-in to import and relate large amounts of data from multiple sources. In Excel 2013, much of this functionality—including the infrastructure that supports it—is built directly into the Data Model. This means that even without the add-in, you can import millions of rows from multiple data sources and manage data connections.† You can also create relationships between tables in the Data Model.
The Power Pivot add-in for Excel provides more advanced modeling capabilities. For example, you can:
Rename tables and columns as you import data. Create relationships using the drag-and-drop feature in Diagram View. Apply formatting for Power View and PivotTable reports. Define hierarchies to use throughout a workbook, define key performance indicators (KPIs) to
use in PivotTables, and define perspectives. Use the Data Analysis Expressions (DAX) language to create calculated columns or explicit
calculated measures.Measures are perhaps the most popular feature that Power Pivot supports. For more information, see Measures in Power Pivot for Excel 2013 on microsoft.com.
Additionally, the entire Data Model in Power Pivot—including tables, columns, calculations, hierarchies, and customizations—is exposed as report-ready elements in Power View.
The Power Pivot add-in is built into Excel 2013 but is not enabled by default. To enable it:
1. On the FILE tab, click Options, and then click Add-Ins. 2. In the Manage box, click COM Add-Ins, and then click Go.3. Check the Microsoft Office Power Pivot in Microsoft Excel 2013 box, and then click OK.
† 64-bit version
7 | Self-service BI in Excel 2013
Visualizing your dataTwo key tools for visualizing BI data are Power View and Power Map.
Use the Power View button on the INSERT tab to compile data and charts in a single view to bring your data to life. Discover insights about your data by using highly interactive and powerful data exploration, visualization, and presentation features that are easy to apply.
Using Power ViewThe Power View add-in is included with Excel but not enabled by default. The first time you click the Power View button on the INSERT tab, Excel will remind you to enable it.
To create simple visualizations:
1. On the INSERT tab, click Power View.2. In the Power View Fields pane, click the fields that you want to include in your visualizations
or drag them to the report canvas.3. Select your visualization in the Switch Visualizations group on the DESIGN tab.Repeat these steps to add as many charts or other visualizations as you like.

8 | Self-service BI in Excel 2013
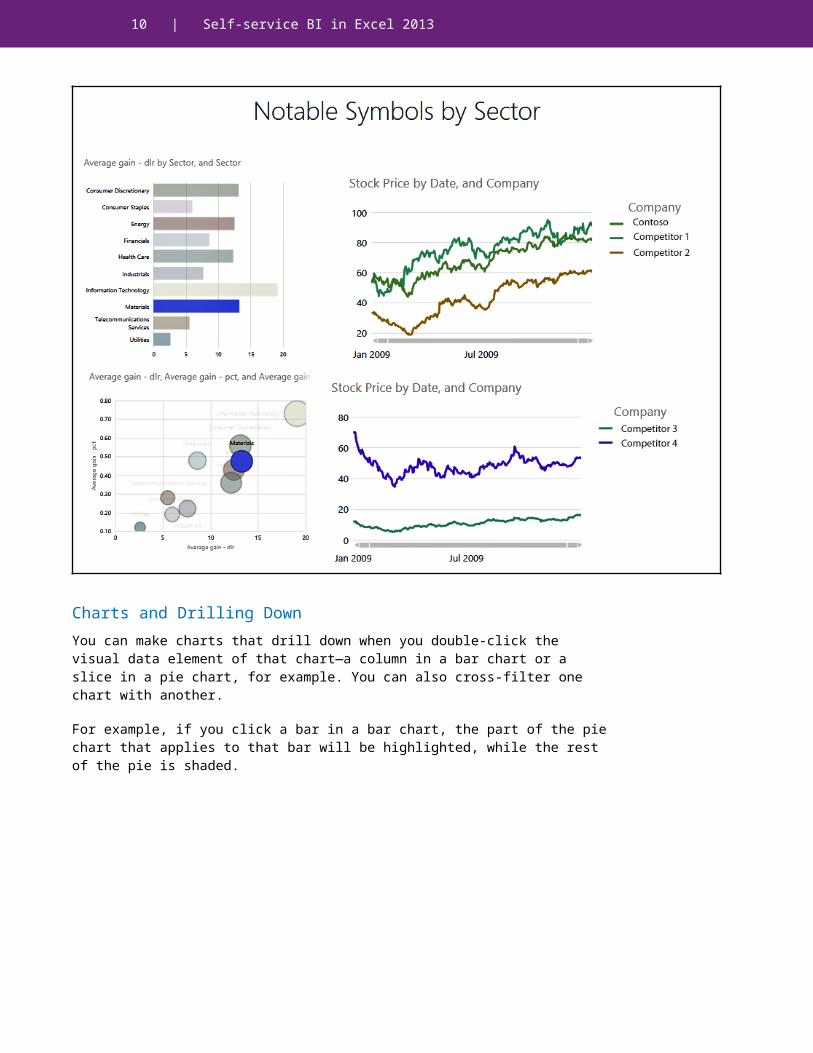
Charts and Drilling DownYou can make charts that drill down when you double-click the visual data element of that chart—a column in a bar chart or a slice in a pie chart, for example. You can also cross-filter one chart with another.
For example, if you click a bar in a bar chart, the part of the pie chart that applies to that bar will be highlighted, while the rest of the pie is shaded.
9 | Self-service BI in Excel 2013
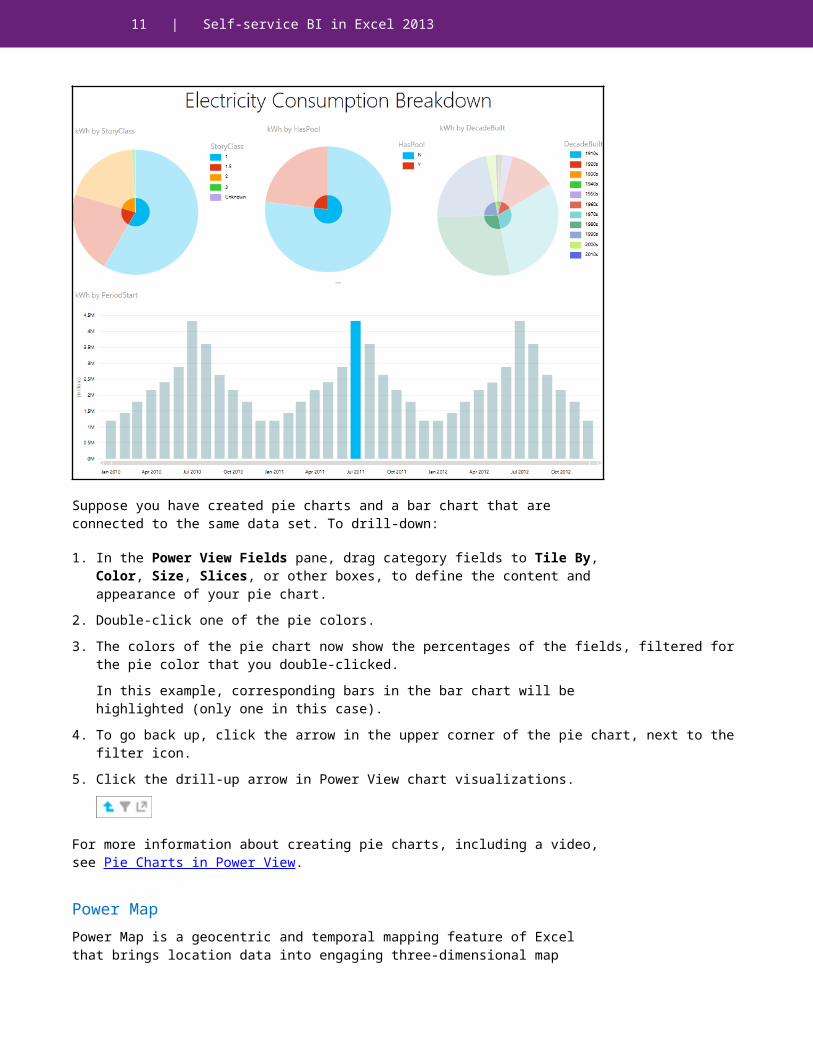
Suppose you have created pie charts and a bar chart that are connected to the same data set. To drill-down:
1. In the Power View Fields pane, drag category fields to Tile By, Color, Size, Slices, or other boxes, to define the content and appearance of your pie chart.
2. Double-click one of the pie colors. 3. The colors of the pie chart now show the percentages of the fields, filtered for the pie color that
you double-clicked.In this example, corresponding bars in the bar chart will be highlighted (only one in this case).
4. To go back up, click the arrow in the upper corner of the pie chart, next to the filter icon.5. Click the drill-up arrow in Power View chart visualizations.
For more information about creating pie charts, including a video, see Pie Charts in Power View.
Power MapPower Map is a geocentric and temporal mapping feature of Excel that brings location data into engaging three-dimensional map visualizations. With Power Map, you can create location-based reports, visualized over a time continuum, that visually tour and offer insight into data.
To install Power Map:
10 | Self-service BI in Excel 2013
1. On the Power Map page in the Microsoft Download Center, click Download to run the Windows Installer, and follow the on-screen instructions.
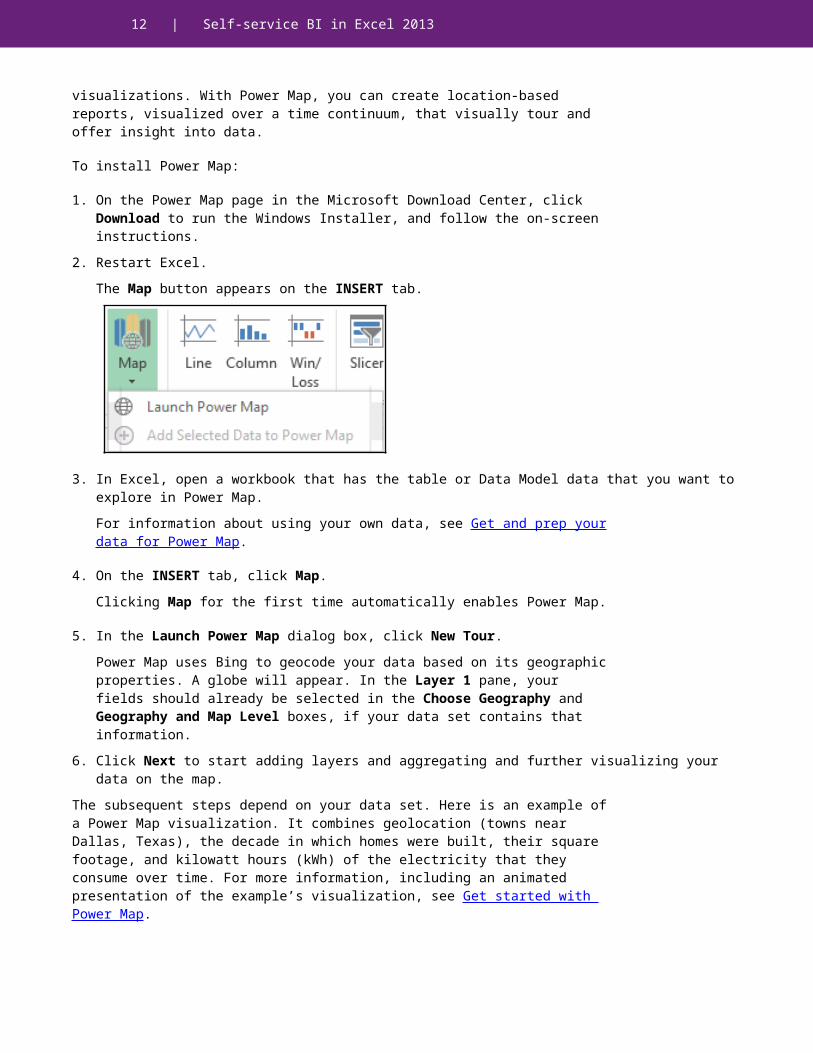
2. Restart Excel.The Map button appears on the INSERT tab.
3. In Excel, open a workbook that has the table or Data Model data that you want to explore in Power Map.For information about using your own data, see Get and prep your data for Power Map.
4. On the INSERT tab, click Map. Clicking Map for the first time automatically enables Power Map.
5. In the Launch Power Map dialog box, click New Tour.Power Map uses Bing to geocode your data based on its geographic properties. A globe will appear. In the Layer 1 pane, your fields should already be selected in the Choose Geography and Geography and Map Level boxes, if your data set contains that information.
6. Click Next to start adding layers and aggregating and further visualizing your data on the map.The subsequent steps depend on your data set. Here is an example of a Power Map visualization. It combines geolocation (towns near Dallas, Texas), the decade in which homes were built, their square footage, and kilowatt hours (kWh) of the electricity that they consume over time. For more information, including an animated presentation of the example’s visualization, see Get started with Power Map.
11 | Self-service BI in Excel 2013
Sharing workbooksMany of the BI capabilities that are available in Excel are supported in Excel Services in Microsoft SharePoint Server 2013 (on-premises). This means that you can view and interact with workbooks in a browser window much as you would by using the Excel client.
The best way to share workbooks and reports is to take advantage of Microsoft Power BI for Office 365, which provides an organization-wide self-service BI infrastructure, and brings Excel workbook sharing, online collaboration, and IT infrastructure together into a holistic offering.
Additionally, the Microsoft Power BI sites application transforms a Microsoft SharePoint Online site into a robust, dynamic location to share and find Excel workbooks and provides a visual, interactive view tailored to BI. It also gives you easy access to other BI features available in Power BI for Office 365, such as the Manage Data Portal, the Power BI for Office 365 Admin Center, and Power BI Q&A to use natural language to find, understand, and report on your data.
For more informationWhat's new in Excel 2013http://office.microsoft.com/en-us/excel-help/what-s-new-in-excel-
12 | Self-service BI in Excel 2013
2013-HA102809308.aspx?CTT=1
Excel 2013 Quick Start Guidehttp://office.microsoft.com/en-us/support/excel-2013-quick-start-guide-HA103673690.aspx?CTT=1
Version compatibility between Power Pivot Data Models in Excel 2010 and Excel 2013http://office.microsoft.com/en-us/excel-help/version-compatibility-between-powerpivot-data-models-in-excel-2010-and-excel-2013-HA103929426.aspx?CTT=1
Make the switch to Excel 2013http://office.microsoft.com/en-us/excel-help/make-the-switch-to-excel-2013-RZ102924304.aspx?CTT=1
What’s new in Power View in Excel 2013 and SharePoint Serverhttp://office.microsoft.com/en-us/excel-help/whats-new-in-power-view-in-excel-2013-and-in-sharepoint-server-HA102901475.aspx?CTT=1#_Toc358038107
Getting Started with Power BI for Office 365http://www.microsoft.com/en-us/powerBI/support/default.aspx?topic=getting-started
Power BI for Office 365 FAQhttp://office.microsoft.com/en-us/excel-help/power-bi-for-office-365-faq-HA104219793.aspx
Use a shared workbook to collaboratehttp://office.microsoft.com/en-us/excel-help/use-a-shared-workbook-to-collaborate-HA102748977.aspx
Work Smart by Microsoft IThttp://aka.ms/customerworksmart
Modern IT Experience featuring IT Showcasehttp://microsoft.com/microsoft-IT
This guide is for informational purposes only. MICROSOFT MAKES NO WARRANTIES, EXPRESS, IMPLIED, OR STATUTORY, AS TO THE INFORMATION IN THIS DOCUMENT. © 2014 Microsoft Corporation. All rights reserved.