workbook for the collection of cost information on hiv facilities
TRANSCRIPT
UNAIDS REPORT I 2011
Workbook for the collection of cost information on HIV facilities and services
UNAIDS
Programmatic Branch
UNAIDS
20 Avenue Appia
CH-1211 Geneva 27
Switzerland
This is a companion publication to the Manual for costing HIV facilities and services

Acknowledgement
We would like to thank the Centers for Disease Control for part-funding the production of this document. For feedback or queries on the document, please contact Eddy Beck ([email protected]) or Carlos Avila ([email protected]).
The Joint United Nations Programme on HIV/AIDS (UNAIDS) brings together ten UN agencies in a common effort to fight the epidemic: the Office of the United Nations High Commissioner for Refugees (UNHCR), the United Nations Children’s Fund (UNICEF), the World Food Programme (WFP), the United Nations Development Programme (UNDP), the United Nations Population Fund (UNFPA), the United Nations Office on Drugs and Crime (UNODC), the International Labour Organization (ILO), the United Nations Educational, Scientific and Cultural Organization (UNESCO), the World Health Organization (WHO), and the World Bank.
UNAIDS, the Joint United Nations Programme on HIV/AIDS, is an innovative United Nations partnership that leads and inspires the world in achieving universal access to HIV prevention, treatment, care and support.
Workbook for the collection of cost information on HIV facilities and services
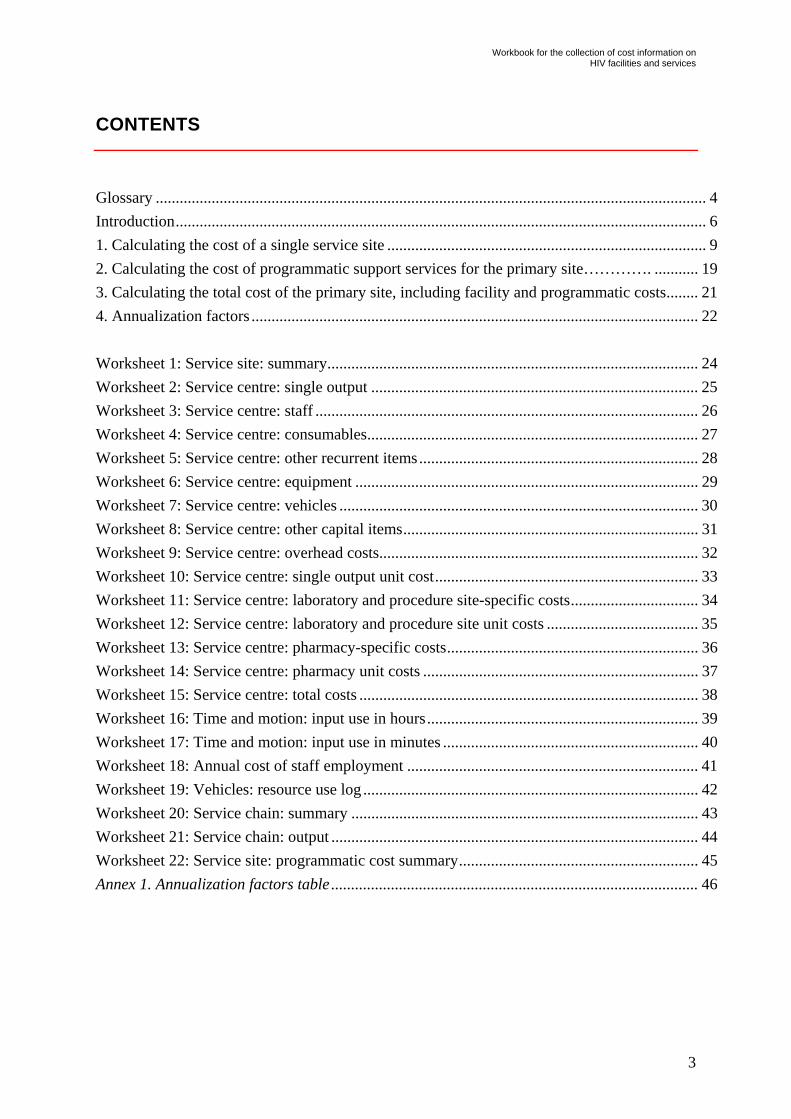
CONTENTS
Glossary .......................................................................................................................................... 4
Introduction..................................................................................................................................... 6
1. Calculating the cost of a single service site ................................................................................ 9
2. Calculating the cost of programmatic support services for the primary site…………. ........... 19
3. Calculating the total cost of the primary site, including facility and programmatic costs........ 21
4. Annualization factors ................................................................................................................ 22
Worksheet 1: Service site: summary............................................................................................. 24
Worksheet 2: Service centre: single output .................................................................................. 25
Worksheet 3: Service centre: staff ................................................................................................ 26
Worksheet 4: Service centre: consumables................................................................................... 27
Worksheet 5: Service centre: other recurrent items...................................................................... 28
Worksheet 6: Service centre: equipment ...................................................................................... 29
Worksheet 7: Service centre: vehicles .......................................................................................... 30
Worksheet 8: Service centre: other capital items.......................................................................... 31
Worksheet 9: Service centre: overhead costs................................................................................ 32
Worksheet 10: Service centre: single output unit cost.................................................................. 33
Worksheet 11: Service centre: laboratory and procedure site-specific costs................................ 34
Worksheet 12: Service centre: laboratory and procedure site unit costs ...................................... 35
Worksheet 13: Service centre: pharmacy-specific costs............................................................... 36
Worksheet 14: Service centre: pharmacy unit costs ..................................................................... 37
Worksheet 15: Service centre: total costs ..................................................................................... 38
Worksheet 16: Time and motion: input use in hours.................................................................... 39
Worksheet 17: Time and motion: input use in minutes ................................................................ 40
Worksheet 18: Annual cost of staff employment ......................................................................... 41
Worksheet 19: Vehicles: resource use log .................................................................................... 42
Worksheet 20: Service chain: summary ....................................................................................... 43
Worksheet 21: Service chain: output ............................................................................................ 44
Worksheet 22: Service site: programmatic cost summary............................................................ 45
Annex 1. Annualization factors table ............................................................................................ 46
3

UNAIDS
Glossary
Ancillary support service centre – provides support services to the care centres. This category includes catering, laundry, medical records, portering, storage and supplies and transport.
Annualization factor – provides an indication of the number of years of service of a certain piece of equipment and its value in successive years.
Buildings – include the actual buildings in which services are provided or that support the provision of services. Capital resources – resources that require an initial outlay when bought but can then be used over a number of years. Clinic – a facility in which ambulatory patients can obtain preventive or therapeutic counselling and undergo testing or procedures. A clinic may be part of a larger institution, such as a hospital or a stand-alone facility.
Consumables – items consumed within one year as well as longer-lived resources of low value. Day ward – a primary point of care in which patients are admitted to the facility for either diagnostic or therapeutic tests or procedures but are discharged on the same day of admission without spending the night at the facility. Direct care service centre – provides direct care services to patients. These centres provide the services directly to individuals in the facility and can include wards for inpatient or day ward care and outpatient clinics. Direct care service centres use services from all other service centres, including indirect care centres and support centres.
Equipment – items that have a useful life of more than one year. Indirect care service centre – assists in providing care by performing tests or procedures or providing drugs. These centres provide diagnostic or therapeutic services to patients but are not a primary point of care within a facility. They include laboratories, pharmacies and sites dedicated to performing diagnostic or curative procedures.
Inpatient ward – the place where patients are admitted for at least one overnight stay to have diagnostic procedures or therapeutic interventions performed.
Laboratory – an area within a service site in which laboratory-based diagnostic tests are carried out. National health care system – is likely to consist of numerous disease-specific programmes. These individual programmes are held together by a common core of support services that underpin the disease-specific work of the programmes.
Other financial benefits – any financial benefits paid directly to the individual, such as annual bonuses or payments for commuting costs, as well as indirect payroll costs such as pension contributions, private insurance contributions or social security payments to the central government.
Personal services – services provided directly to patients.
Procedure sites – specialized areas of the facility in which diagnostic or therapeutic procedures are often carried out. These range from operating theatres, X-ray or endoscopy rooms to simple procedures performed in a day ward or outpatient setting.
4
Workbook for the collection of cost information on HIV facilities and services
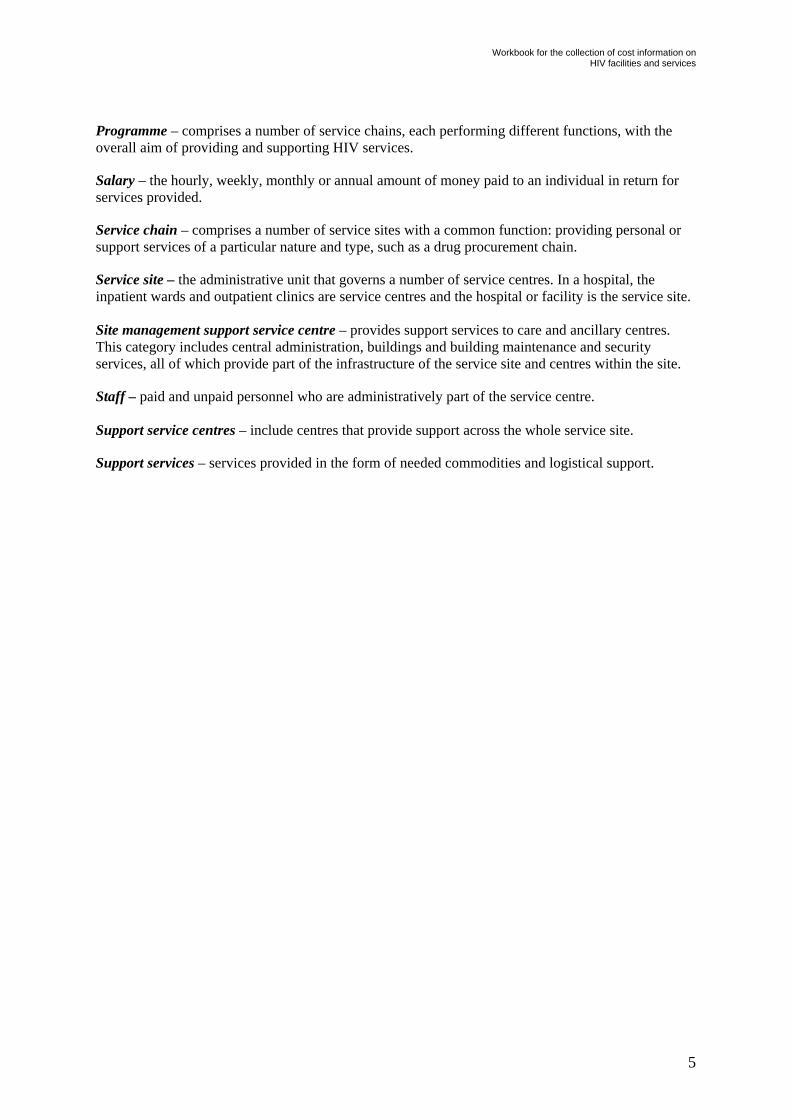
Programme – comprises a number of service chains, each performing different functions, with the overall aim of providing and supporting HIV services.
Salary – the hourly, weekly, monthly or annual amount of money paid to an individual in return for services provided.
Service chain – comprises a number of service sites with a common function: providing personal or support services of a particular nature and type, such as a drug procurement chain.
Service site – the administrative unit that governs a number of service centres. In a hospital, the inpatient wards and outpatient clinics are service centres and the hospital or facility is the service site. Site management support service centre – provides support services to care and ancillary centres. This category includes central administration, buildings and building maintenance and security services, all of which provide part of the infrastructure of the service site and centres within the site.
Staff – paid and unpaid personnel who are administratively part of the service centre. Support service centres – include centres that provide support across the whole service site.
Support services – services provided in the form of needed commodities and logistical support.
5
UN
6
AIDS
Introduction
This workbook is a companion publication to the Manual for costing HIV facilities and services,1 providing instructions that link the theoretical framework and definitions of the manual to the worksheets. Readers not already familiar with basic costing concepts are advised to review these concepts in the manual before proceeding to the work with the spreadsheets presented here.
This workbook provides 22 worksheets that will guide you through the data collection and analysis process for calculating the unit costs of providing services at the facility level and the programmatic costs associated with providing services at a single facility. Some of these worksheets are needed only once for each cost analysis, but multiple copies are required for others.
For simplicity, it is assumed that the time period of interest is one year. If this is not the case, each use of the word “annual” should be read as “the time period of interest” or “reference period”.
These guidelines are process oriented. Instead of providing a sequential description of the contents of worksheets, the guidelines guide the reader through the steps in allocating costs generated by the analysed facility and repeatedly refer to various worksheets in an ad hoc manner.
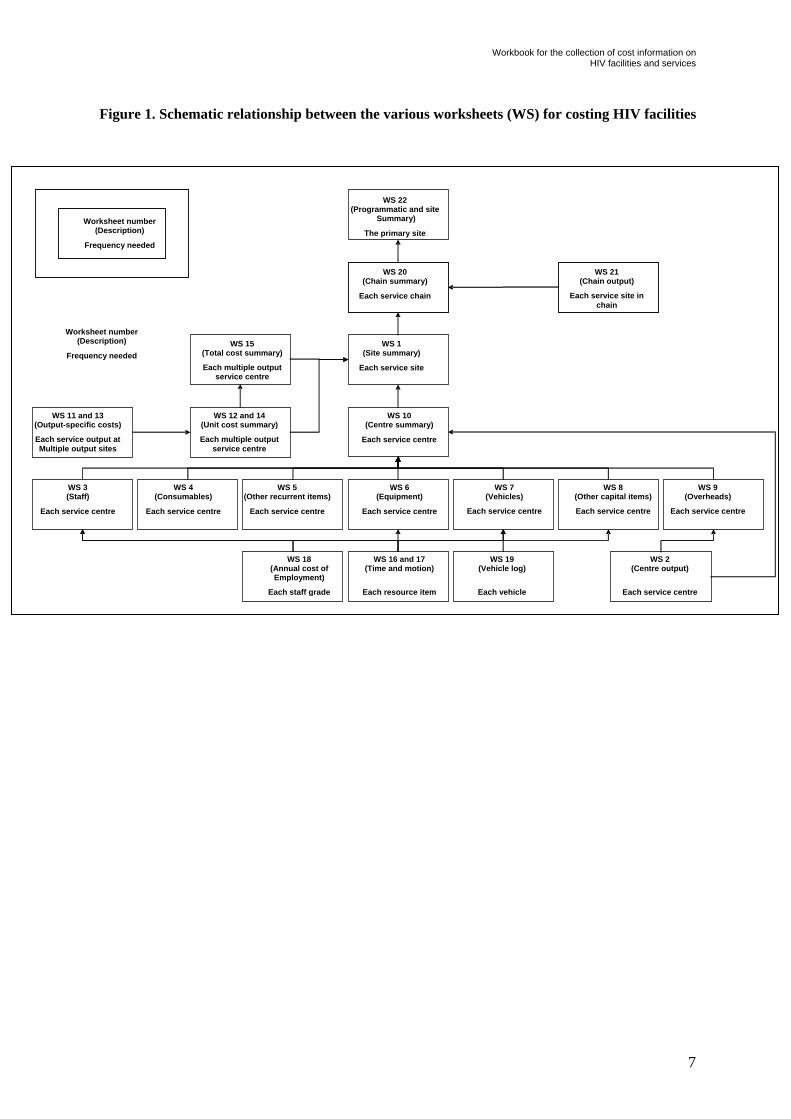
Fig. 1 outlines how the various worksheets fit together and how often they need to be completed. It is recommended to use Excel spreadsheets for data input, interlinking data that repeatedly appear on different sheets. It also illustrates the steps to take in data collection and cost allocation. Note that the flow chart tends “upward”. This means to start executing the tasks in the bottom cells heading up towards the top or upper cell.
Worksheet 1: Service site: summary, Worksheet 10: Service centre: single output unit cost and Worksheet 22: Service site: programmatic cost summary contain the main quantitative output of the costing exercise, which should serve as the main basis for describing your results.
Worksheets should be completed simultaneously, because many are mutually interlinked. In a first step, you will be collecting information on input (such as staff hours worked and vehicle-kilometres travelled, etc.) and output (such as number of patients attended and tests provided). Filling in these data should not be a problem. The programme manager or accountant should be able to do it, similar to the general and administration costs of the facility. The information contained in accounting records is very valuable and should be the starting-point for your costing study. The actual expenditure is of interest and not the planned expenditure. Nevertheless, allocating costs using different allocation keys becomes more complicated, and your costing expertise is needed. You might need to consult several data indicated in various worksheets and carry out mathematical operations to fill in such cells in a given sheet. You should not fully rely on the programme manager or accountant, but you should either do these calculations together with them or do them by yourself.
1 Beck EJ et al. Manual for costing HIV facilities and services. Geneva, UNAIDS, 2011 http://www.unaids.org/ (accessed 15 January 2011).
Workbook for the collection of cost information on HIV facilities and services
Figure 1. Schematic relationship between the various worksheets (WS) for costing HIV facilities
WS 22(Programmatic and site
Summary)
The primary site
Worksheet number
(Description)
Frequency needed
WS 11 and 13 (Output-specific costs)
Each service output at Multiple output sites
WS 10(Centre summary)
Each service centre
WS 1(Site summary)
Each service site
WS 20(Chain summary)
Each service chain
WS 21 (Chain output)
Each service site in chain
Worksheet number (Description)
Frequency needed WS 15
(Total cost summary)
Each multiple out ut pservice centre
WS 12 and 14 (Unit cost summary)
Each multiple output service centre
WS 3 (Staff)
Each service centre
WS 4 (Consumables)
Each service centre
WS 5 (Other recurrent items)
Each service centre
WS 6(Equipment)
Each service centre
WS 7(Vehicles)
Each service centre
WS 8 (Other capital items)
Each service centre
WS 9(Overheads)
Each service centre
WS 18 (Annual cost of Employment)
Each staff grade
WS 16 and 17(Time and motion)
Each resource item
WS 19(Vehicle log)
Each vehicle
WS 2(Centre output)
Each service centre
7

UNAIDS
Note that no single interviewee can necessarily provide all the information necessary to fill in a single worksheet. Consulting several sources of information within the same facility might be necessary to complete the worksheet. Further, it is recommended that you also consult other organizations to which the analysed facility reports, including such donors as the Global Fund for AIDS, Tuberculosis and Malaria.
In addition, there might be more than just one set of accounting records. This is probably the case if the programme has several funders. There may also be several programme administrators, such as at the local, district or central levels, and they might each keep distinct records.
Organizations frequently indicate that they cannot provide the requested data because they do not register it in their accounting records. In that case, ask for their best possible estimate: the figure they provide will be the closest one to reality. If two (or more) contradictory data are obtained for the same indicator from two sources, then the average will be used.
A costing analysis requires classifying items (input, output, resources and costs) into mutually excluding categories. It is recommended to make these categories as simple as possible, avoiding the creation of too many subcategories because the whole analysis becomes too complicated. Where similar resources produce similar output at similar costs, make an effort to group items together. In contrast, when discerning an item is of a strategic importance, keep it separate even if you would not otherwise do this.
It is assumed that you will take the following basic steps in the costing exercise (Fig. 1).
1. Calculate the cost of a single service site
1.1. Divide the service site into service centres
1.2. Define and measure output for each service centre
1.3. Define and measure input for each service centre
1.4. Calculate input costs
1.5. Calculate the total cost of each service centre
1.6. Calculate the unit cost of each service centre
1.7. Calculate the total cost of the service site
2. Calculate the cost of programmatic support services for the primary site
2.1. Identify service chains providing external support
2.2. Identify service sites within each service chain
2.3. Measure the programmatic output of each service site
2.4. Calculate the cost of each programmatic service site
2.5. Calculate the programmatic support costs for the primary service site of a service chain
3. Calculate the total cost of the primary site, including facility and programmatic costs The next sections explain each step in detail.
8
Workbook for the collection of cost information on HIV facilities and services
1. Calculating the cost of a single service site
1.1 Divide the service site into service centres
For each service site, a copy of Worksheet 1 can be used as a summary sheet. The first step in costing a service site is to create a list of all the service centres present at your facility in columns A and B. Since the service site may have multiple service centres of the same type, the name in column A should be sufficient to identify it uniquely. If needed please refer to Chapter 2 of the Manual.
Note that there are several types of service centres. They can be direct care centres (those that provide services directly to the clients, such as HIV testing or antiretroviral therapy), indirect care centres (those that provide care without direct contact with the client) and support service centres (general management, programme management, human resources management, programme monitoring, maintenance of buildings, cleaning, catering, information technology support, etc.). Worksheet 1: Service site: summary should include both direct, indirect and support service centres.
Regarding the output of support service centres, try to find the optimal pooling grade within various categories which are neither too broad nor too narrow. The condition for pooling is that output units be the same. For instance, cleaning and building maintenance can be usually pooled because both types of output can be expressed in square metres. If it is reasonable to express the general management output as a certain number of employees “managed” across different final service centres, then general management, human resources management and programme monitoring can go under one category. In contrast, if expressing the output of the general management in terms of “volume of business managed” in US dollars is more reasonable, then the pooling would be different. If all employees of a facility use a computer in their work, then information technology services can be pooled into the “per staff” allocation category, otherwise “information technology services” should be kept separately and allocated by the number of computers used in each service site.
Unfortunately, no general rule is applicable to all costing studies, not even in a narrow field such as HIV programmes, because the way service providers are organized and managed varies by country.
Please keep in mind that you have much more flexibility in defining the output units of support service centres than in defining the output units of care service centres. The reason is that support services are not used for benchmarking. The output of supporting centres mainly needs to be defined to correctly allocate shared costs to care service centres.
If several facilities are analysed simultaneously, it is crucial to ensure that the final output measures are understood in common and that these are the same for all participants in the study. This is the only way to ensure that the quantitative results of different analyses are mutually comparable.
If there is a conventional understanding on or an internationally used method for measuring a type of output, your analysis should apply this, even if it does not seem to be the most suitable for the facility analysed. An example is the number of individual sex workers reached as part of peer education programmes instead of the frequency of contacts between the service personnel and sex workers.
If several consultants were involved in data collection, possibly covering different geographical areas such as districts or countries, holding a meeting to clarify and determine the question of output units would be very beneficial before costing begins. It is also highly recommended to approach facilities with
9
UNAIDS
a predefined list of service centre output units. Thus, instead of filling in blank questionnaires, they choose from the predefined list.
Note that the institutions analysed often provide a much wider array of services than those included in the scope of interest. One of the most difficult steps of the costing exercise is often identifying the proportion of shared costs that correspond to the part of the services of interest. For instance, polyclinics may provide regular outpatient services and HIV therapy, counselling and testing. As a first step, the total costs of the facility that correspond only to the service centres of interest need to be isolated, in this case HIV services.
Ideally, the organization has a separate cost centre for the care centre(s) for your analysis. Should this be the case, you do not need to describe the output of the rest of the organization.
However, if the care centre of interest shares costs with other care centres, such as general administration, ancillary services or others, then you need to describe the output of all service centres. Nevertheless, you should strive to minimize project costs and seek to apply the minimal information necessary for correctly allocating shared costs to the care centres of interest. For instance, in case of polyclinics serving both people living with HIV and other people, one possibility is to consider the share of people living with HIV out of the total and to allocate the shared costs to final HIV service centres accordingly. After this step, you would collect detailed information only on the service centres of interest: service centres providing care to people living with HIV.
1.2. Define and measure output for each service centre
The relevant output measure for each service centre listed in Worksheet 1 should be listed in column C.
As already mentioned, service centres can be divided into direct care service centres, indirect care service centres and support service centres.
Direct care service centres
For each inpatient ward, day ward, outpatient ward, drop-in centre or any other form of HIV-related service delivery at the site, the relevant output measure should be recorded in column C and the annual number of output units should be measured. If annual data are available, the amount can be entered directly into column D. If data are being collected over a shorter time period, the number of output units observed during the period of observation should be multiplied by the number of observation periods in a year to obtain an annual number of output units. This can then be entered into column D.
Indirect care service centres
Indirect care services might require an alternative way of calculating unit costs than the rest of the programmatic components of the final service centre. For instance, in analysing the unit costs of a laboratory, there are two alternatives:
A. to divide total laboratory costs by the total number of tests (top-down cost allocation); or B. to assemble the unit costs per test type by aggregating the costs of its composing (ingredient)
elements – minutes of laboratory assistant, senior technician, materials used, etc. (bottom-up allocation).
10
Workbook for the collection of cost information on HIV facilities and services
Generally, laboratories provide a very heterogeneous array of tests, and placing all tests in the same basket and assuming that all generate the same costs (alternative A) would be incorrect. Hence, unless there is a clear homogeneity in the laboratory’s unit costs for each type of test, bottom-up allocation (alternative B) is much more accurate for laboratory services.
The costing analyst is responsible for deciding on the allocation method (A or B), and the choice should be properly noted in the report.
i. Indirect care service centres (using alternative A: top-down cost allocation)
For each laboratory, procedure site or pharmacy for which a cost per generic test, procedure or drug is being calculated, the relevant output measure should be recorded in column C of Worksheet 1 and the annual number of output units should be measured in the same manner as for direct care service centres. The annual number of output units should be entered into column D of Worksheet 1.
ii. Indirect care service centres: laboratories and procedure sites (using alternative B: bottom-up cost allocation)
For each laboratory or procedure site for which a cost per type of test or procedure is being calculated, columns C to E of Worksheet 1 should be left blank and a copy of Worksheet 12 made instead. All the types of test or procedure to be costed should be listed in column A and the number of each provided in a year recorded in column B of Worksheet 12.
iii. Indirect care service centres: pharmacies (using alternative B: bottom-up cost allocation)
For each pharmacy for which a cost per type of drug prescription is being calculated, columns C to E of Worksheet 1 should be left blank and a copy of Worksheet 14 made instead. All the types of drug prescription to be costed should be listed in column A and the number of each provided in a year recorded in column B.
Support service centres
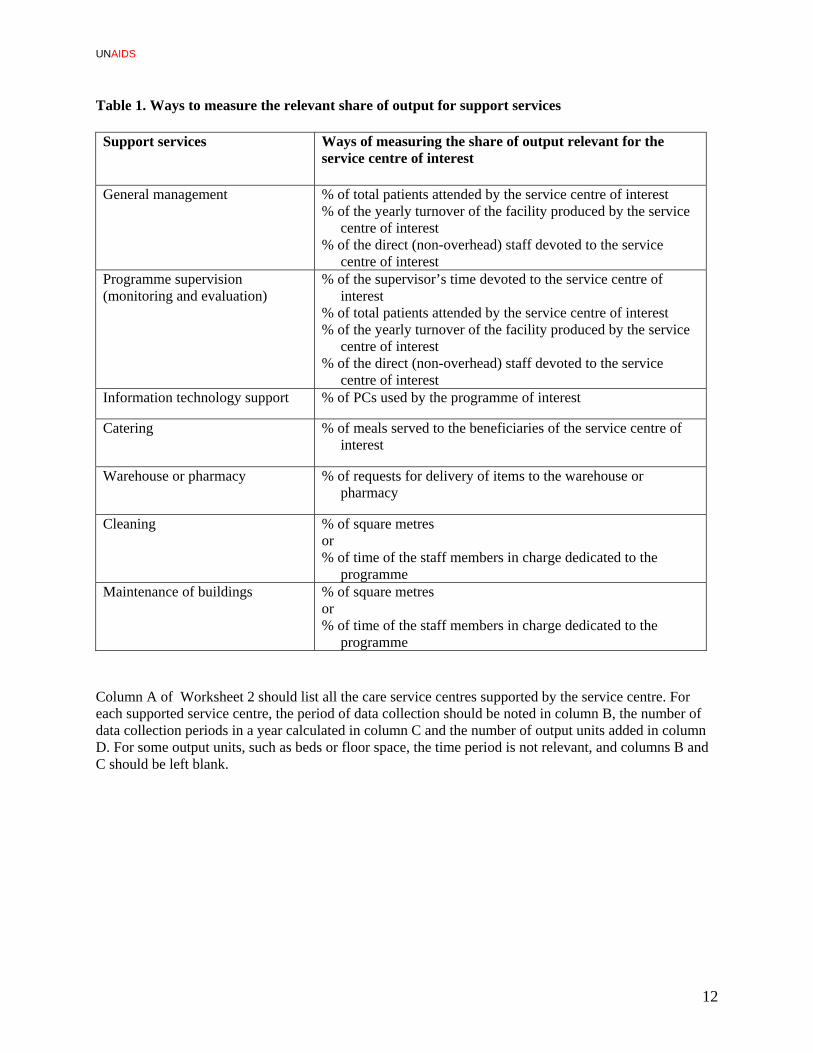
Support service centres - programme administration and ancillary services - often contribute significantly to the cost of a programme. It is therefore important to be as accurate as possible in assigning them to specific programmes. Although some support service costs may be able to be traced directly (for example, an individual or a unit of people dedicated solely to supervising or managing the programme of interest), this does not apply to most support service costs (Table 1).
Shared support service costs should be allocated using the most suitable allocation factor, ideally the output units themselves (patients attended) or their proxies (such as annual money turnover or direct staff members employed). Finding the most suitable allocation key is often not easy. Table 1 provides some illustrative examples.
For each support service centre, the relevant output measure should be recorded in column C of Worksheet 1, and a copy of Worksheet 2 should be made.
11
UNAIDS
Table 1. Ways to measure the relevant share of output for support services
Support services
Ways of measuring the share of output relevant for the service centre of interest
General management % of total patients attended by the service centre of interest % of the yearly turnover of the facility produced by the service
centre of interest % of the direct (non-overhead) staff devoted to the service
centre of interest Programme supervision (monitoring and evaluation)
% of the supervisor’s time devoted to the service centre of interest
% of total patients attended by the service centre of interest % of the yearly turnover of the facility produced by the service
centre of interest % of the direct (non-overhead) staff devoted to the service
centre of interest Information technology support % of PCs used by the programme of interest
Catering % of meals served to the beneficiaries of the service centre of interest
Warehouse or pharmacy % of requests for delivery of items to the warehouse or pharmacy
Cleaning % of square metres or % of time of the staff members in charge dedicated to the
programme Maintenance of buildings % of square metres
or % of time of the staff members in charge dedicated to the
programme
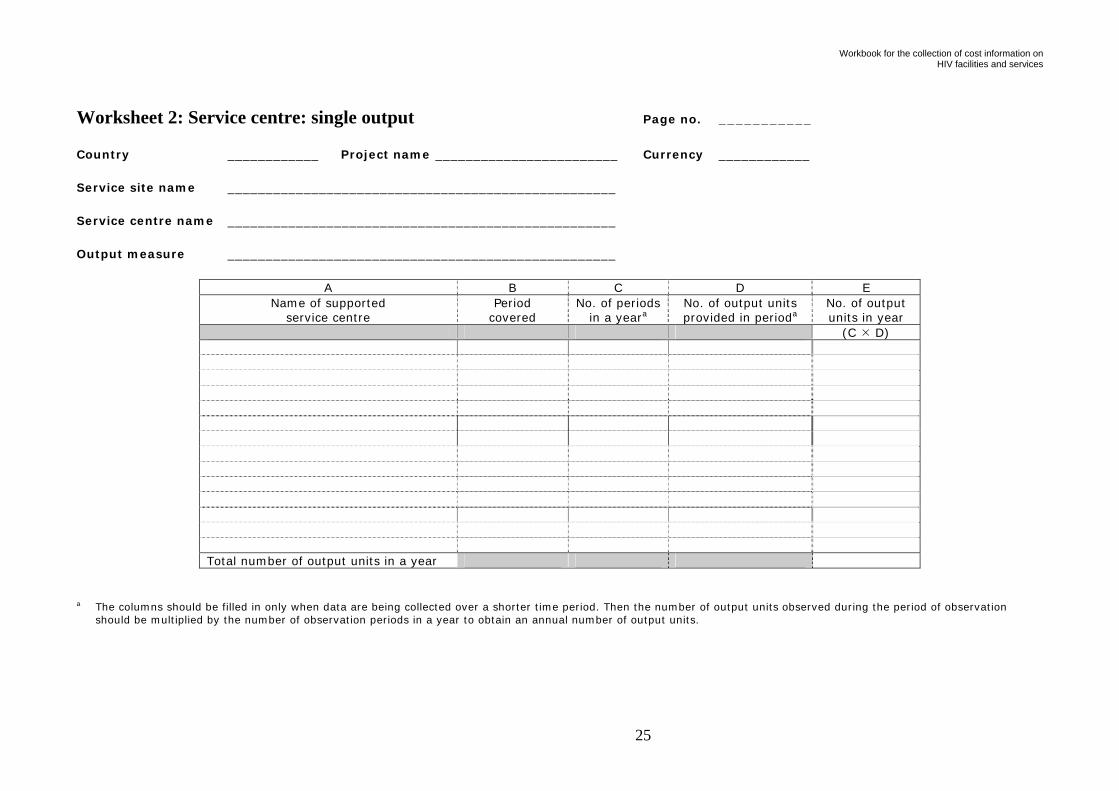
Column A of Worksheet 2 should list all the care service centres supported by the service centre. For each supported service centre, the period of data collection should be noted in column B, the number of data collection periods in a year calculated in column C and the number of output units added in column D. For some output units, such as beds or floor space, the time period is not relevant, and columns B and C should be left blank.
12

Workbook for the collection of cost information on HIV facilities and services
1.3. Define and measure input for each service centre
For each service centre listed in Worksheet 1, all inputs used at the service centre in a one-year period need to be listed. A set of Worksheets 3 to 8 should be printed for each service centre of interest. Guidance on completing each sheet is given below.
Worksheet 3: Staff
All people who are managed by the service centre of interest should be listed in column A, and the pay grade or equivalent pay grade of each person should be recorded in column B. The proportion of each person’s workweek spent working for the service centre of interest should be entered into column C. If an individual works at more than one service centre, Worksheet 16 provides a form for measuring the proportion spent at each centre.
Worksheet 4: Consumables
All the types of consumable used by the service centre of interest should be listed in columns A and B. If data are being collected for less than a one-year period, then the annual quantity can be calculated using columns C to F; if data for the whole year are available, the quantities can be entered directly into column F. Similarly, when non-recurrent, high-volume input such as linen or cutlery is included as consumables, the number of units purchased in a year should be entered directly into column F.
Worksheet 5: Other recurrent items
Other recurrent items should be listed in column A, giving a description in column B that is sufficiently detailed to allow a cost to be identified later. The number of items consumed in the past year should be recorded in column C.
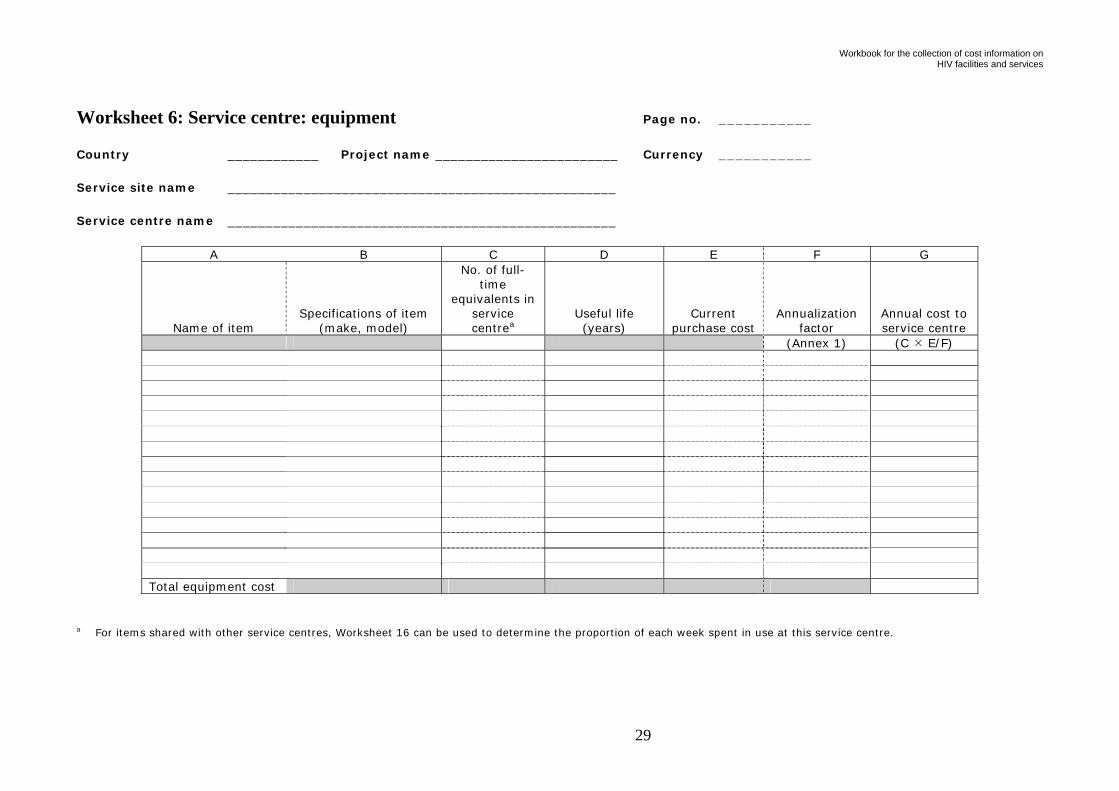
Worksheet 6: Equipment
The equipment whose cost needs to be annualized is that currently used by the service centre of interest. Thus, it includes not only the items purchased in the year of the study but also those purchased in previous years and currently in use.
All equipment used in the service centre of interest should be listed in column A, with a description in column B that is sufficient to clearly identify each item. The number of each item present at the service centre of interest should be recorded in column C. When an item is shared with other service centres at the facility, a copy of Worksheet 1616 can be used to measure the proportion of use in each.
A likely problem in data collection is that account records do not necessarily include all recurrent costs of the programme – donations, for example, could be excluded. Special attention should be devoted to donated equipment, such as personal computers. The economic value should be estimated and annualized too.
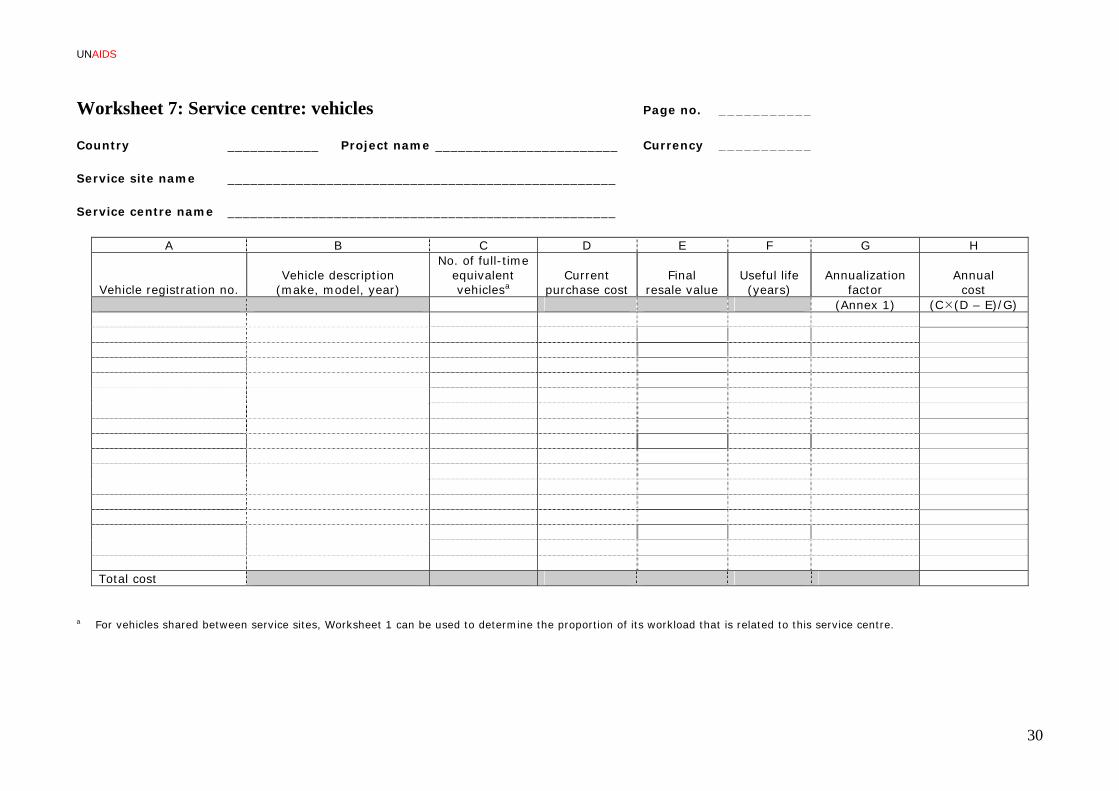
Worksheet 7: Vehicles
This worksheet is only needed for transport service centres. The registration number, manufacturer, model description and year of construction of each vehicle should be noted in columns A and B. The number of vehicles of each model managed by the service site should be entered in column C. If vehicles are rented
13

UNAIDS
part-time or shared with other service sites, only the proportion of the time spent in use by this service site should be included.
Worksheet 8: Other capital items
The name and a description of any other capital items (buildings in property, furniture, etc.) should be captured in columns A and B. The number of each item used by the service centre of interest should be entered in column C.
Worksheets 11 and 12: Indirect care service centres: laboratories and procedure sites
For each laboratory or procedure site for which a cost per type of test or procedure is being calculated, in addition to completing Worksheets 3 to 8, a copy of Worksheet 1111 should be made for each type of test or procedure being costed (see column A of Worksheet 1212). All input that is directly involved in completing each test or procedure should be listed in column A and the quantity of resources used recorded in column B. For staff and capital input, this should then be converted into the proportion of a day’s use in column C. Worksheet 1717 provides a form for measuring the proportions of a day for which an input unit is used on a particular test or procedure.
Example: for a full blood count:
The amount of staff time involved in preparing and performing the analysis might be 30 minutes for a laboratory assistant and 5 minutes for a senior technician.
The consumables used might include two test tubes, four slides and 10 ml of lytic agent.
The equipment time used might be 10 minutes on an automated cell counter.
The number of consumables would be entered into column B of Worksheet 1111 as whole numbers, but the staff and equipment time need to be entered as a percentage of their average daily use. For example, 30 minutes in an 8-hour day is 6.25% of a full-time equivalent laboratory assistant.
Worksheet 13: Indirect care service centres: pharmacies
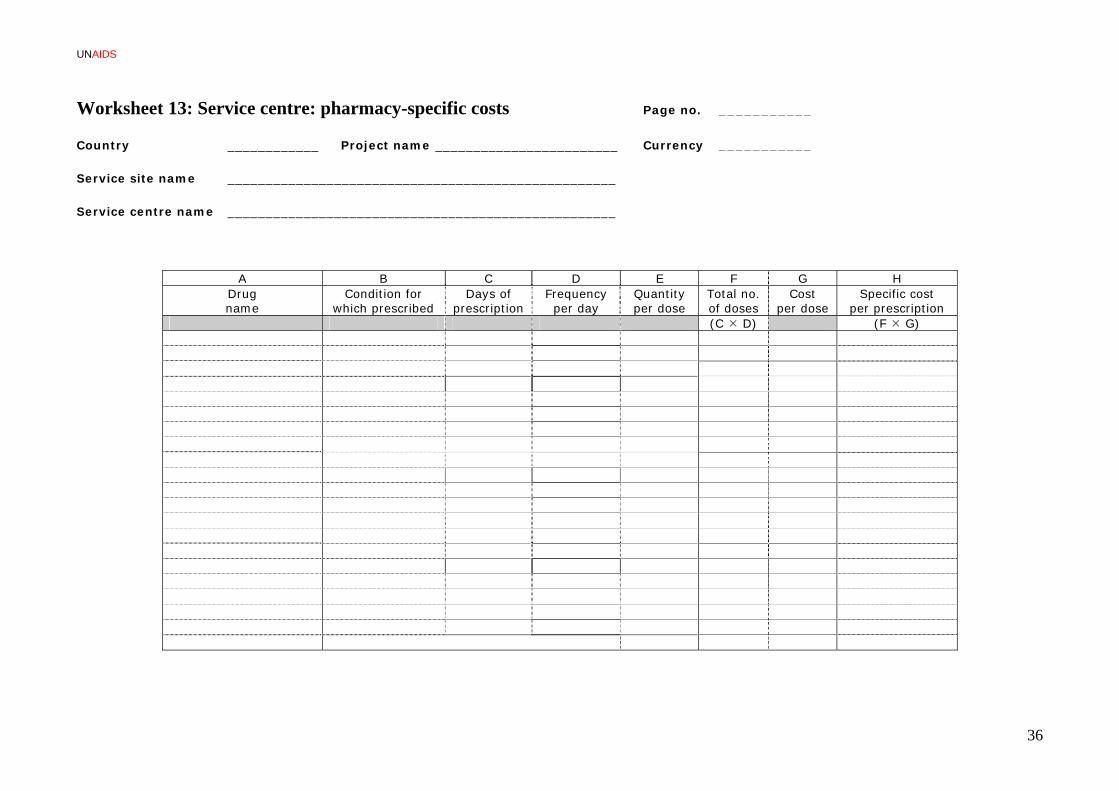
For each pharmacy for which a cost per type of drug is being calculated, Worksheets 3 to 8 should be completed as usual, but in Worksheet all drugs should be excluded from the list of input at the service centre of interest. Instead, a copy of Worksheet should also be made. All the drug prescriptions being costed should be listed in column A (see column A of Worksheet 13) and the condition for which they are being prescribed recorded in column B. This information should allow the length, frequency and quantity per dose of the prescription to be determined for an adult of average weight, which should then be entered into columns C to E. The number of doses required per prescription should be calculated and entered into column F
1.4. Calculate input costs
Worksheet 3+ 18: Staff A copy of Worksheet 18 should be completed for each grade of staff to be assigned either to the analysed service centres as direct staff or to the general administration and ancillary services providing support
14

Workbook for the collection of cost information on HIV facilities and services
services to the analysed service centres. If the analysed facility has multiple functions, such as a general hospital, and only a portion of the staff is directly or indirectly related to the HIV programme, obtaining information on all employees is not necessary.
Details on the items listed in column A are given on page 19 of the manual. Any staff-related costs not listed on the worksheet should be added at the bottom of the list in column A. The total of all the costs in column F is the annual cost of employment for staff of that grade.
The annual cost of employing each staff member should be taken from column F of the relevant copy of Worksheet 18 and entered into column D of Worksheet 3. These costs should be multiplied by the proportion of the staff member’s week spent in the service centre to arrive at an annual cost for each staff member in column E. The sum of all amounts in column E is the total annual cost for staff at the service centre.
Worksheet 4: Consumables
The price of a unit of each type of consumable should be found and entered into column G. The number of each type of consumable used annually within the service centre of interest should be multiplied by the unit price to obtain a total annual cost for consumables at the service centre in column H.
Worksheet 5: Other recurrent items
The price of each unit of other recurrent items should be found and entered into column D. The number of each type of other recurrent item used annually within the service centre of interest should be multiplied by the unit price to arrive at a total annual cost for consumables at the service centre in column E.
Worksheet 6: Equipment
The useful lifetime of each item of equipment at the service centre of interest should be determined and entered into column D. Next, the current replacement cost of the item should be identified and entered into column E. Based on the lifetime and discount rate (Annex 1), an annualization factor can then be calculated and entered into column F. For each item listed, the purchase price should then be divided by the annualization factor and multiplied by the number of that item present in the service centre to arrive at an annual cost in column G. The sum of these amounts is the total cost of equipment in the service centre of interest.
Worksheet 7: Vehicles
As with other equipment, the purchase price and useful lifetime of each vehicle should be determined and entered into columns C and E. If the vehicle is likely to be sold at the end of its use at the service site, the resale value should be entered in column D. An annualization factor should be determined (Annex 1) and entered into column G. The net cost (purchase price less resale value) should then be divided by the annualization factor and multiplied by the number of full-time equivalent vehicles present to calculate the annual value of each vehicle in column H. The sum of these values for all vehicles is the total annual cost of vehicles at the service site.
Worksheet 8: Other capital items
The price of each item listed in column A should be identified and entered into column D. The useful life of the item, which is the period over which it provides service to the service centre, should be determined
15
UNAIDS
and entered into column E. Based on the useful life and the discount rate, an annualization factor can be determined (Annex 1) and entered into column F. The cost per item should be divided by the annualization factor and multiplied by the number of items currently in use at the service centre to obtain an annual cost for each type of input in column G. The sum of all the costs in column G is the total cost of other capital items at the service centre of interest.
Worksheet 11: Indirect care service centres: laboratories and procedure sites
The cost of each test or procedure should be calculated for each laboratory or procedure site. This requires entering the price of each input listed in Worksheet 1111 in column D. For recurrent input, the prices should have already been collected for calculating the cost of the whole service centre. For capital items, the price calculated previously needs to be divided by the number of working days in a year. If local records of the number of working days in a year do not exist, the figure of 226 working days can be used as a generic estimate – this is based on a five-day working week with 10 public holidays, 20 days of paid vacation leave and 5 days of sick leave each year – and adapted to local conditions. The price and input quantities can then be multiplied to reach a total cost for each type of input and a total direct cost for each type of test or procedure calculated at the bottom of column E.
Worksheet 13: Indirect care service centres: pharmacies
For each pharmacy for which a cost per type of drug prescription is being calculated, the price of a single dose of the drug for each prescription should usually be recorded in column G of Worksheet and the total cost of the prescription calculated by multiplying this by the number of doses from column F and entered into column H. If, however, there is a specific packaging of the drug for the length, frequency and dosage of the prescription in question, then the cost of this should be entered directly into column H.
1.5. Calculate the total cost of each service centre
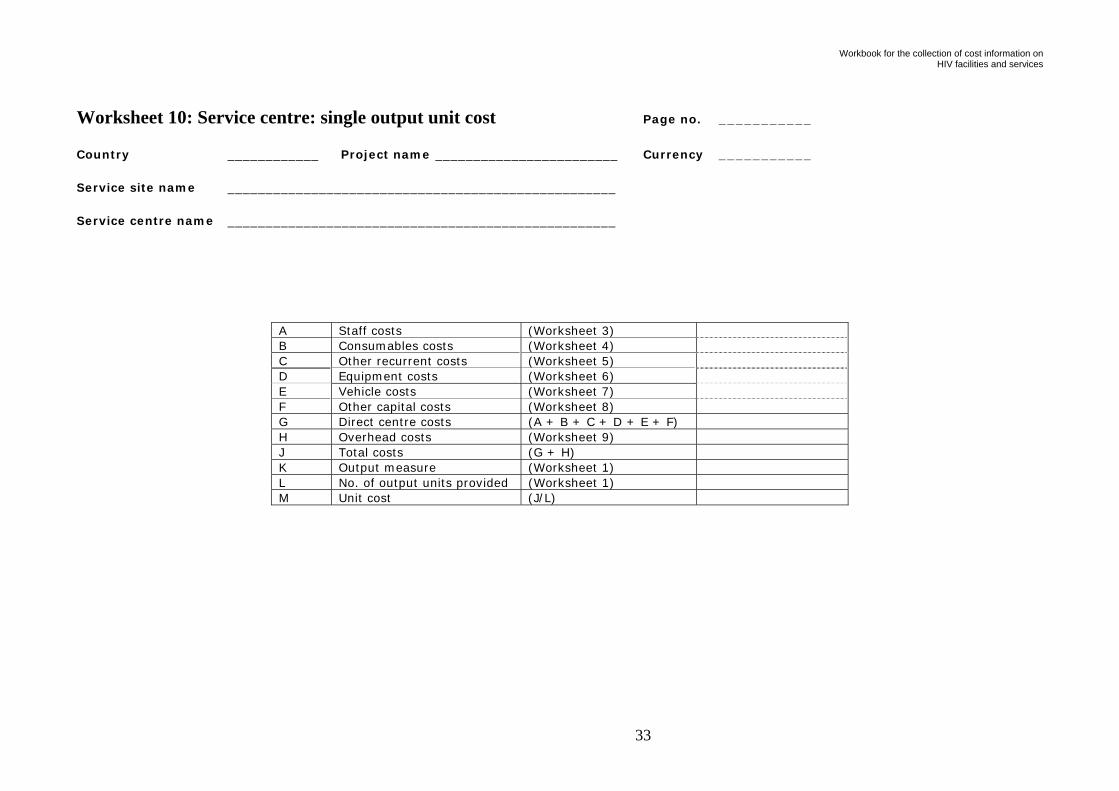
A copy of Worksheet 10 should be made for each service centre of interest at the site. For each service centre, the total costs from the right-hand columns of Worksheets 3 to 8 should be transferred into rows A to F of Worksheet 10: Service centre: single output unit cost. These figures can then be summed to arrive at a total direct cost for the service centre in row G of Worksheet 10.
1.6. Calculate the unit cost of each service centre
Support centres
For each support service centre at the service site, the unit cost can be calculated in Worksheet10. Since support service centres receive no support services, row H should be left blank, so row J is the same as row G. The output measure of the service centre should be entered into row K and the number of these units totalled in column D of Worksheet 2 entered into row L. The unit cost of the support service centre can then be calculated in row M by dividing the total cost in row J by the number of output units provided in row L. The total cost figure from row G and the unit cost figure from row M should then be transferred to columns F and E, respectively, of Worksheet 1.
Direct care centres
The process outlined above for calculating unit costs for support service centres using Worksheet 10 should be repeated for each inpatient ward, day ward and outpatient clinic but with the addition of overhead costs relating to support services received in row H.
16
Workbook for the collection of cost information on HIV facilities and services
To calculate the value of these overhead costs, a copy of Worksheet 9 should be made for each direct care service centre. All service centres that provide support services to the direct care service centre should be listed in column A and the measure of support received recorded in column B. The quantity of this support received should be entered into column C; this figure should already be recorded in the copy of Worksheet 2 relating to the support service centre in question. The unit cost of each unit of support received can be taken from column E of Worksheet 1 and entered into column D. The product of the amount of support received and the unit cost is the support cost of that support service centre and should be entered into column E. The sum of all the support costs at the direct care service centre should be returned to row H of Worksheet and the unit cost per inpatient day, day ward or outpatient visit calculated.
Indirect care centres: laboratories and procedure sites
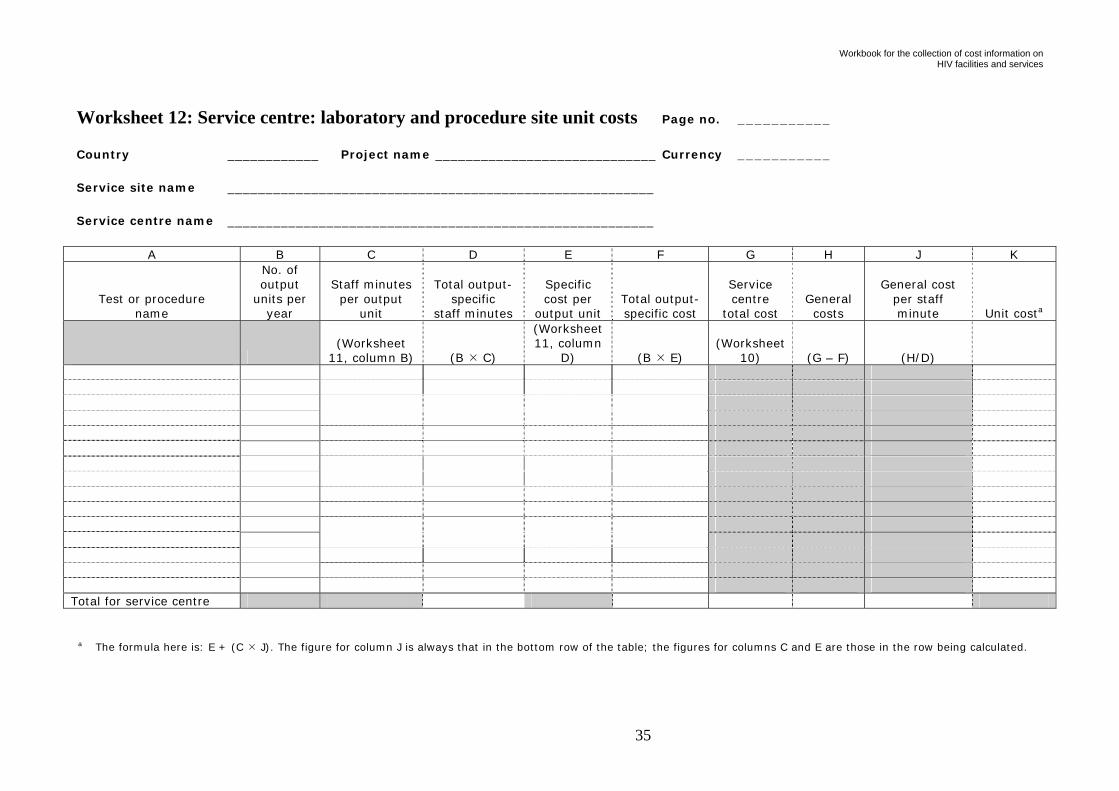
For each laboratory or procedure site for which a cost per generic test or procedure is being calculated, the process outlined for direct care service centres should be repeated. For each laboratory or procedure site for which a cost per type of test or procedure is being calculated, an additional process needs to be completed as follows.
First, the total level of overhead costs from support service centres should be calculated as for direct care service centres, so that row H of Worksheet can be completed. Next, these overhead costs need to be added to the total cost of the laboratory or pharmacy site in row J.
Next, the proportion of the costs in row J that is specific to individual tests or procedures and the amount that is general to all tests or procedures should be calculated. To begin this process, the amount of staff time spent performing each test or procedure should be calculated by adding together all the staff time amounts listed at the bottom of column B of the relevant copy of Worksheet 11. For each test or procedure, the total number of staff minutes from column B from each copy of Worksheet 11 should then be transferred to the relevant row of column C of Worksheet 12. This time can be multiplied by the number of each test or procedure performed from column B and the amounts entered into column D. The sum of all staff minutes spent specifically on performing tests or procedures should be entered in the bottom row of column D.
Next, the total cost for each test or procedure from column D of each copy of Worksheet 11 should be transferred to the relevant row of column E of Worksheet 12. These costs can be multiplied by the number of times each test or procedure was performed in column F to arrive at a total specific cost for performing each test. The sum of all these costs is the amount that is specific to individual tests or procedures, and this figure should be entered in the bottom row of column F.
At this point, the total costs of the service centre, including overhead support costs from row J of Worksheet 10, should be transferred to the bottom of column G of Worksheet 12, and the specific costs from column F should be subtracted from these total costs to obtain a total for the general costs of the service centre in column H. This total general cost should be divided by the total number of output-specific staff minutes from the bottom of column D to obtain a general cost per staff minute in column J. To combine the test-specific and general costs for each test or procedure, the relevant output-specific unit cost from column E should be added to the general cost per staff minute from the bottom of column J multiplied by the relevant output-specific number of staff minutes from column D. This figure should be entered into the relevant row of column K and is the unit cost for that test or procedure.
17
UN
18
AIDS
Indirect care centres: pharmacies
For each pharmacy for which a cost per generic drug is being calculated, the process outlined for direct care service centre should be repeated. For each pharmacy for which a cost per type of prescription is being calculated, Worksheet 10 should be completed down to row J, in the same manner as for laboratories and procedure sites, to arrive at a total general cost for the service centre, since drug-specific costs were excluded from Worksheet 3. This figure should be transferred into the bottom row of column C in Worksheet 14 and the total number of prescriptions made in the year summed in the bottom row of column B in the same sheet. The total general cost should be divided by the total number of prescriptions to obtain a general cost per prescription, which should be entered into column D.
The drug-specific unit cost of each prescription should be then transferred from column H of Worksheet 13 to the relevant row of column E in Worksheet 14. This drug-specific unit cost should be multiplied by the number of times the drug was prescribed and entered into column F. The drug-specific unit cost of each prescription should then be added to the general cost per prescription from column D to arrive at a unit cost for each type of drug prescription in column G.
1.7. Calculating the total cost of the service site
To calculate the total cost of the service site, the total cost, including allocated support costs, of each care service centre should be entered into column F of Worksheet 1. For inpatient wards, day wards and outpatient clinics, and for any laboratories, procedure sites or pharmacies for which a unit cost per generic test, procedure or prescription was calculated, this is the figure from row J of Worksheet 10.
For each laboratory or procedure site for which a cost per type of test or procedure is being calculated, a copy of Worksheet 15 should be made and the list of tests or procedures from column A of Worksheet 12 should be copied into column A of Worksheet 15. For each type of test or procedure, the number of times the output was performed should be transferred from column B of Worksheet 12 to column B of Worksheet 15, and the unit cost from column K of Worksheet 12 should be copied to column C of Worksheet 15. This allows a total cost for each type of test or procedure to be calculated in column D by multiplying the unit cost by the number of times it was performed. The total of these costs for all types of test or procedure at the service centre should be transferred to column E of Worksheet 1.
For each pharmacy for which a cost per type of prescription is being calculated, a copy of Worksheet 15 should be made and the list of tests or procedures from column A of Worksheet 14 should be copied into column A of Worksheet 15. For each type of prescription, the number of times the drug was prescribed should be transferred from column B of Worksheet 14 to column B of Worksheet 15, and the unit cost from column F of Worksheet 14 should be copied to column C of Worksheet 15. This allows a total cost for each type of prescription to be calculated in column D by multiplying the unit cost by the number of times it was fulfilled. The total of these costs for all types of prescriptions at the pharmacy should be transferred to column E of Worksheet 1.
Once the total costs of all the care service centres have been entered into column F of Worksheet 1, they can be summed to arrive at a total cost of providing personal services at the service site.
Workbook for the collection of cost information on HIV facilities and services
2. Calculating the cost of programmatic support services for the primary site
A service chain refers to a logical sequence of services to enable services to be delivered to a service site and individuals using services from that site. An example is a drug-procurement chain. If needed please refer to Chapter 3 of the Manual.
2.1. Identify service chains providing external support
All service chains providing support services to the primary service site should be listed in column A of Worksheet 22. The output measure for the service chain should be identified in column B.
2.2. Identify service sites within each service chain
A copy of Worksheet 20: Service chain: summary should be made for each service chain listed in Worksheet 22, and all service sites that provide external support services through that service chain should be listed in column A and briefly described in column B.
2.3. Measure the programmatic output of each service site
The output measures for service chains identified in column B of Worksheet 22 may either be:
the actual output of the service chain, such as the quantity of drugs that passes through each distribution centre in a drug procurement chain; or
a proxy for this output measured at service sites where personal services are provided, such as the budget of all pharmacies at each primary site in a drug procurement chain.
For the purposes of measuring programmatic output, this is important because, in the former case, the number of output units provided by each programmatic service site can be measured at the service site itself whereas, in the latter case, information has to be obtained from primary sites services by the programmatic site and the budgets from each of the primary sites are than added together.
Service chains, using actual output
For each programmatic service site listed in each copy of Worksheet 20: Service chain: summary, a copy of Worksheet 21 should be made. All service sites directly receiving support services from this programmatic service site should be listed in column A. The number of output units provided to each site annually should be counted and entered in column D, leaving columns B and C blank. This should be repeated for all service sites in the service chain.
Service chains, using proxy output
The most centralized service site in the chain (the one with the broadest provision of services) should be considered first. A copy of Worksheet 21 should be made and all service sites directly receiving support services from this central site listed in column A. The number of proxy output units present at the supported service sites should be measured and recorded in column B and the total number of output units at directly supported sites summed in the bottom of the column. This process should then be repeated for
19
UN
20
AIDS
each supported service site listed, measuring the output at each service site that they, in turn, support. This should be done even for service sites not directly involved in providing services to the primary service site and repeated until sites that do not support any other sites are reached.
Once the process has been completed for all service sites providing the service of the service chain, the total number of output units supported by each service site should be calculated. This can be done by adding together output units from directly supported and indirectly supported service sites from columns B and C of Worksheet 21 and entering the result in column D. The figures in the bottom row of column D are the total number of supported output units at that site.
The information on directly supported service site output has already been collected but that on indirectly supported site output must be calculated. This is done by taking the last level of programmatic sites, those that provide services directly to sites providing personal services, and completing column D of Worksheet 21 by transferring the numbers from column B directly across. The total number of output units in the bottom row of column D should then be transferred to the relevant row of column C in the copy of Worksheet 21 relating to the sites by which they are supported. This should be repeated for all other programmatic service sites that provide services directly to sites providing personal services.
2.4. Calculate the cost of each programmatic service site
For each service site in each service chain, a copy of Worksheet 1 should be created and a list of service centres relevant to providing support services in that chain made in columns A and B. For each relevant service centre, input and prices should be measured and a total cost for the service centre calculated. This can be done by using copies of Worksheets 3 to 9 to collect input data and rows A to G of Worksheet 10: Service centre: single output unit cost to total the costs at each service centre. The total cost for each service centre can then be transferred to column F of Worksheet 1 and these amounts summed to reach a total cost for the programmatic service site.
2.5. Calculate the programmatic support costs for the primary service site of a service chain
The total number of output units for all supported sites from the bottom of column D of each copy of Worksheet 21 should be entered into the row of column C of Worksheet 20: Service chain: summary that corresponds to the programmatic service site for which that copy of Worksheet 21 was created. The quantity of output units received by the primary site from the service chain should be measured and recorded in the bottom row of column D of Worksheet 20: Service chain: summary. The total cost figure from column F of the relevant copy of Worksheet 1 should be transferred to column E of Worksheet 20.
The cost that should be allocated from the programmatic site to the primary site can be calculated by first dividing the number of output units received at the primary site by the total number of output units provided by the programmatic site and then multiplying this proportion by the total cost of the site. This can be recorded in column F of Worksheet 20. The sum of all the costs in column F is the total cost of programmatic service provision at the primary site from the service chain of interest.

Workbook for the collection of cost information on HIV facilities and services
3. Calculating the total cost of the primary site, including facility and programmatic costs
For each service chain listed in Worksheet 22, the cost from the bottom row of column F of the relevant copy of Worksheet should be entered into column C of Worksheet 22. The values for all the service chains should be summed in the bottom row of the column. The total cost of service provision within the primary site should be transferred from column F of Worksheet 1 to column D of Worksheet 22 and added to the total programmatic cost from column C to obtain a total cost for both facility and programmatic services at the primary site in column E.
21
UNAIDS
4. Annualization factors
The annual value of capital is frequently calculated by dividing the cost of the capital item (its price) by the number of years during which it is functional. A computer that is worth US$ 1000 and is expected to be operational for five years has an annual cost of US$ 200. This procedure is termed straight-line depreciation.
Major investment, however, requires a more sophisticated approach considering both useful lifespan and the opportunity cost of the funds invested: benefits that could have been gained from an alternative investment. An example would be the sum of a risk-free interest rate (such as that of a high-quality government bond) plus a premium for the risk or liquidity.
The only data needed for calculating straight-line depreciation are the purchase price and the useful lifespan.
Finding the annualization factor relevant to a given piece of equipment requires determining the discount rate and useful lifespan of the item. These two pieces of information can be combined to obtain an annualization factor from Annex 1.
The discount rate
Capital goods provide a flow of benefits to the user over a number of years, whereas this guidance focuses primarily on the annual cost of services in a chosen year of analysis. As a result, the current purchase price of each item of equipment needs to be spread across its working life, taking into account the benefits that could have been gained from spending the money invested in the equipment elsewhere – its opportunity cost. This last factor, the opportunity cost, is reflected in the discount rate, which should be set once for the whole cost analysis.
In many countries, the national government can provide a national discount rate for public-sector projects. If this does not exist, the yield on government bonds can be used, preferably based on the longest-term bond that is regularly issued. In the absence of such information, the international standard rate of 3% can be used, although this may not be representative of local conditions.
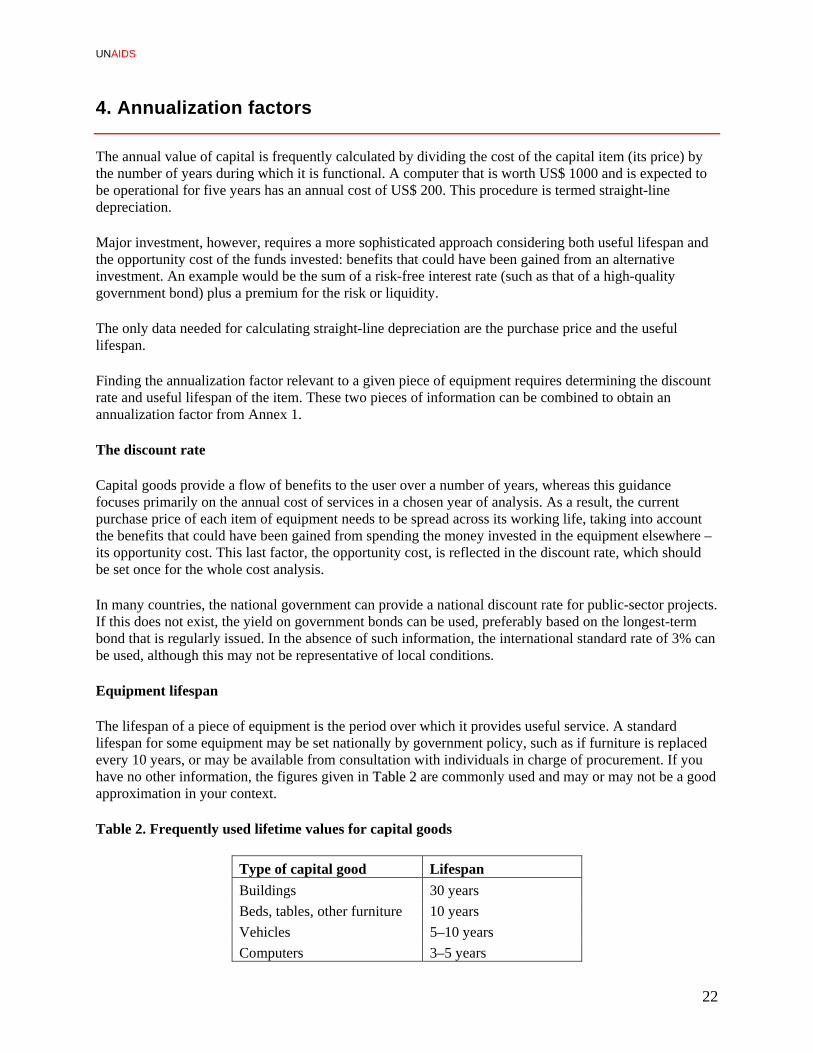
Equipment lifespan
The lifespan of a piece of equipment is the period over which it provides useful service. A standard lifespan for some equipment may be set nationally by government policy, such as if furniture is replaced every 10 years, or may be available from consultation with individuals in charge of procurement. If you have no other information, the figures given in TTaabbllee 22 are commonly used and may or may not be a good approximation in your context.
Table 2. Frequently used lifetime values for capital goods
Type of capital good Lifespan
Buildings 30 years
Beds, tables, other furniture 10 years
Vehicles 5–10 years
Computers 3–5 years
22
Workbook for the collection of cost information on HIV facilities and services
23
How to use the annualization factors table (Annex 1) Assume that a PC is worth US$ 1000 and is expected to be operational for five years. As explained above, there are two alternative approaches.
1. Straight-line depreciation approach:
Annual value of the PC: US$ 1000/5 = US$ 20 per year, the same for each of the five years of use.
2. Discount rate annualization approach: Consider the same example, using a 3% discount rate.
Annual value of the PC: US$ 1000/4.580 = US$ 218.34 per year. Note that instead of dividing the total cost of the PC by the real lifespan, we have divided it by a reduced lifespan that we obtained from the (5 years; 3%) coordinates of the table. This increased the annual costs.

UNAIDS
Worksheet 1: Service site: summary Page no. ___________
Country ____________ Project name ________________________ Currency ____________
Service site name ___________________________________________________
A B C D E F
Service centre name
Service centre type
Service centre output measurea
No. of output units
produced Service centre
unit cost Service centre
total costb
(Worksheet 10, row
M) Total cost of service site
a For service centres costing multiple output units, columns C to E should be left blank and a full list of output units should be made on Worksheet 12 or Worksheet 14: Service
centre: pharmacy unit costs. b For care service centres costing a single output, this figure is from row J of Worksheet . For service centres costing multiple output units, this figure is from the bottom row of
column D of Worksheet 15.
24
Workbook for the collection of cost information on HIV facilities and services
Worksheet 2: Service centre: single output Page no. ___________
Country ____________ Project name ________________________ Currency ____________
Service site name ___________________________________________________
Service centre name ___________________________________________________
Output measure ___________________________________________________
A B C D E Name of supported
service centre Period
covered No. of periods
in a yeara No. of output units provided in perioda
No. of output units in year
(C D) Total number of output units in a year
a The columns should be filled in only when data are being collected over a shorter time period. Then the number of output units observed during the period of observation should be multiplied by the number of observation periods in a year to obtain an annual number of output units.
25
UNAIDS
Worksheet 3: Service centre: staff Page no. ___________ Country ____________ Project name ________________________ Currency __________
Service site name ___________________________________________________
Service centre name ___________________________________________________
A B C D E Name or ID number
of staff membera Grade of
staff member Proportion of week at service centre
Annual cost of staff member
Annual cost of staff member to service centre
(Worksheet 18) (CD)
Total staff cost
a If the analysed organization provides a wider arrange of services than just the scope of the costing analysis, please fill in staff data only for the service centres of interest and the staff members providing support services.
26

Workbook for the collection of cost information on HIV facilities and services
Worksheet 4: Service centre: consumables Page no. __________
Country ____________ Project name ________________________ Currency __________
Service site name ___________________________________________________
Service centre name ___________________________________________________
A B C D E F G H
Item name Item specifications (make, quantity)
Period of record
No. of periods per year
No. consumed in period
No. consumed per year
Cost per item
Annual cost
(D E) (F G)
Total consumables cost
27

UNAIDS
Worksheet 5: Service centre: other recurrent items Page no. __________
Country ____________ Project name ________________________ Currency __________
Service site name ___________________________________________________
Service centre name ___________________________________________________
A B C D E
Item name Item description No. consumed
per year Cost per
item Annual
cost (C D)
Total cost
28
Workbook for the collection of cost information on HIV facilities and services
Worksheet 6: Service centre: equipment Page no. ___________
Country ____________ Project name ________________________ Currency ___________
Service site name ___________________________________________________
Service centre name ___________________________________________________
A B C D E F G
Name of item Specifications of item
(make, model)
No. of full-time
equivalents in service centrea
Useful life (years)
Current purchase cost
Annualization factor
Annual cost to service centre
(Annex 1) (C E/F)
Total equipment cost
a For items shared with other service centres, Worksheet 16 can be used to determine the proportion of each week spent in use at this service centre.
29
UNAIDS
Worksheet 7: Service centre: vehicles Page no. ___________
Country ____________ Project name ________________________ Currency ___________
Service site name ___________________________________________________
Service centre name ___________________________________________________
A B C D E F G H
Vehicle registration no. Vehicle description
(make, model, year)
No. of full-time equivalent vehiclesa
Current purchase cost
Final resale value
Useful life (years)
Annualization factor
Annual cost
(Annex 1) (C(D – E)/G)
Total cost
a For vehicles shared between service sites, Worksheet 1 can be used to determine the proportion of its workload that is related to this service centre.
30

Workbook for the collection of cost information on HIV facilities and services
Worksheet 8: Service centre: other capital items Page no. ___________
Country ____________ Project name ________________________ Currency ___________
Service site name ___________________________________________________
Service centre name ___________________________________________________
A B C D E F G
Item name Item description No. used by
service centrea Cost
per item Useful life (years)b
Annualization factor
Annual cost to service centre
(Annex 1) (C D/F)
Total cost
a The number of items used, rather than purchased, in a one-year equivalent period is needed. So, for example, training services bought three years ago but that have expected benefits covering a five-year period should be included in this table.
b The useful life of other capital items is the period over which they continue to provide benefits. So in the example from footnote a, the useful life would be five years.
31
UNAIDS
Worksheet 9: Service centre: overhead costs Page no. ____________
Country ____________ Project name ________________________ Currency ___________
Service site name ___________________________________________________
Service centre name ___________________________________________________
A B C D E
Supporting service centre name Output measure of
support centre Support output
received at this centre Unit cost of supporting
service centre Total cost of support
(Worksheet 1) (C D) Total overhead costs
32
Workbook for the collection of cost information on HIV facilities and services
Worksheet 10: Service centre: single output unit cost Page no. ___________
Country ____________ Project name ________________________ Currency ___________
Service site name ___________________________________________________
Service centre name ___________________________________________________
A Staff costs (Worksheet 3) B Consumables costs (Worksheet 4) C Other recurrent costs (Worksheet 5) D Equipment costs (Worksheet 6) E Vehicle costs (Worksheet 7) F Other capital costs (Worksheet 8) G Direct centre costs (A + B + C + D + E + F) H Overhead costs (Worksheet 9) J Total costs (G + H) K Output measure (Worksheet 1) L No. of output units provided (Worksheet 1) M Unit cost (J/L)
33

UNAIDS
Worksheet 11: Service centre: laboratory and procedure site-specific costs Page no. ___________
Country ____________ Project name _____________________________ Currency ___________
Service site name ________________________________________________________
Service centre name ________________________________________________________
Output measure ________________________________________________________
A B C D E
Input type: staff grade, equipment type, consumable name, etc.
Amount of input useda
No. of full-time
equivalent input units
usedb
Cost of one full-time equivalent
item Input
unit cost (C D)
Total staff time in minutes Output-specific cost
a This will be a time period for staff or equipment or a number of items for consumables or other items.
b A full-time equivalent input should be a single item for consumables but a day of work for staff, equipment and other items.
34
Workbook for the collection of cost information on HIV facilities and services
Worksheet 12: Service centre: laboratory and procedure site unit costs Page no. ___________
Country ____________ Project name _____________________________ Currency ___________
Service site name ________________________________________________________
Service centre name ________________________________________________________
A B C D E F G H J K
Test or procedure name
No. of output
units per year
Staff minutes per output
unit
Total output-specific
staff minutes
Specific cost per
output unit Total output-specific cost
Service centre
total cost General costs
General cost per staff minute Unit costa
(Worksheet
11, column B) (B C)
(Worksheet 11, column
D) (B E) (Worksheet
10) (G – F) (H/D) Total for service centre
a The formula here is: E + (C J). The figure for column J is always that in the bottom row of the table; the figures for columns C and E are those in the row being calculated.
35
UNAIDS
Worksheet 13: Service centre: pharmacy-specific costs Page no. ___________
Country ____________ Project name ________________________ Currency ___________
Service site name ___________________________________________________
Service centre name ___________________________________________________
A B C D E F G H Drug name
Condition for which prescribed
Days of prescription
Frequency per day
Quantity per dose
Total no. of doses
Cost per dose
Specific cost per prescription
(C D) (F G)
36

Workbook for the collection of cost information on HIV facilities and services
Worksheet 14: Service centre: pharmacy unit costs Page no. ___________
Country ____________ Project name ________________________ Currency ___________
Service site name ___________________________________________________
Service centre name ___________________________________________________
A B C D E F G
Drug name and prescription
No. of prescriptions made per year
General costs
General cost per prescription
Specific cost per prescription
Drug-specific total cost Unit costa
(Worksheet 10,
row J) (C/B) (Worksheet 13,
column H) (B E) Total for service centre
a The formula here is: (D + E). The figure for column D is always that in the bottom row of the table; the figure for column E is the one in the row being calculated.
37
UNAIDS
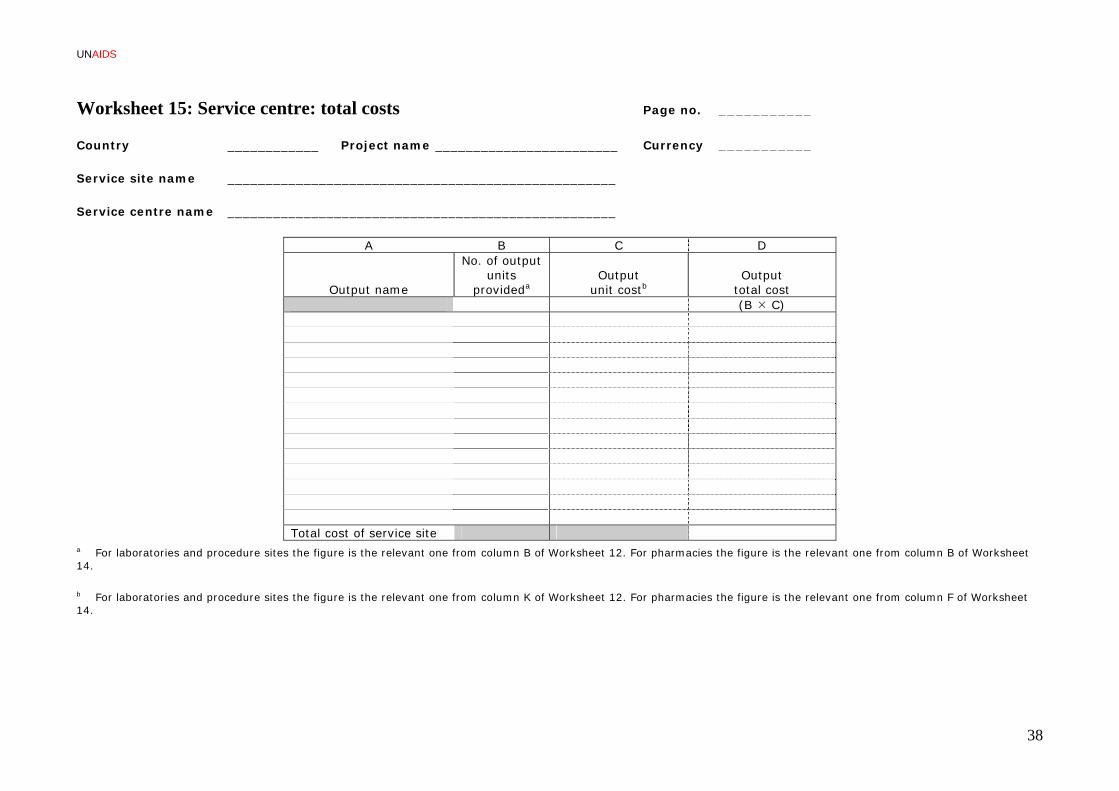
Worksheet 15: Service centre: total costs Page no. ___________
Country ____________ Project name ________________________ Currency ___________
Service site name ___________________________________________________
Service centre name ___________________________________________________
A B C D
Output name
No. of output units
provideda Output
unit costb Output
total cost (B C)
Total cost of service site
a For laboratories and procedure sites the figure is the relevant one from column B of Worksheet 12. For pharmacies the figure is the relevant one from column B of Worksheet 14.
b For laboratories and procedure sites the figure is the relevant one from column K of Worksheet 12. For pharmacies the figure is the relevant one from column F of Worksheet 14.
38

Workbook for the collection of cost information on HIV facilities and services
Worksheet 16: Time and motion: input use in hours Page no. ___________
Country ____________ Project name ___________________ Currency ___________
Service centre name _______________________________________________ Start date ___________
Staff member or item name _______________________________________________ End date ___________
0 1 2 3 4 5 6 7 8 9 10 11 12 13 14 15 16 17 18 19 20 21 22 23 Hours
worked Monda y Tuesda y Wednesda y Thursda y Frida y Saturda y Sunda y Total hours
Service centre name _________________ Total hours at service centre _____ % of total time _____
Service centre name _________________ Total hours at service centre _____ % of total time _____
Service centre name _________________ Total hours at service centre _____ % of total time _____
Service centre name _________________ Total hours at service centre _____ % of total time _____
Service centre name _________________ Total hours at service centre _____ % of total time _____
Note: This level of detail is likely to be insufficient for allocating input units between service output units. If it is insufficient, then the name of a service output unit should be entered instead of a service centre in the left-hand column above.
39
UNAIDS
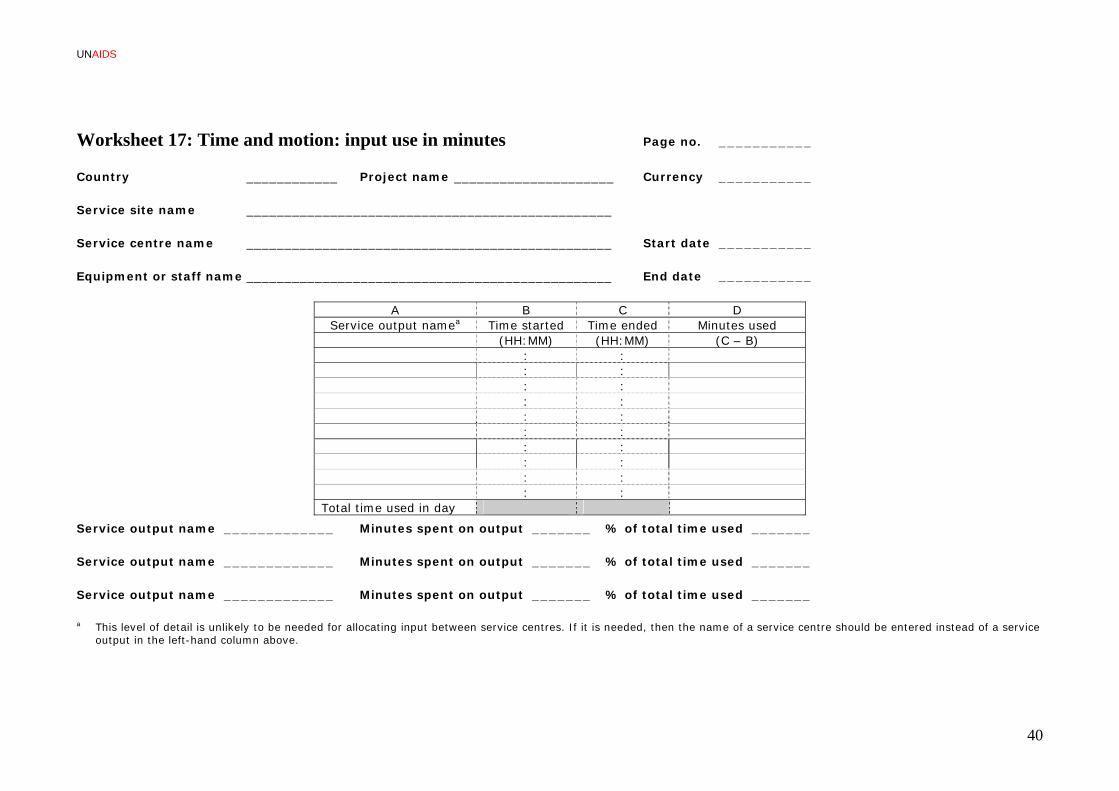
Worksheet 17: Time and motion: input use in minutes Page no. ___________
Country ____________ Project name _____________________ Currency ___________
Service site name ________________________________________________
Service centre name ________________________________________________ Start date ___________
Equipment or staff name ________________________________________________ End date ___________
A B C D Service output namea Time started Time ended Minutes used
(HH:MM) (HH:MM) (C – B) : : : : : : : : : : : : : : : : : : : : Total time used in day
Service output name _____________ Minutes spent on output _______ % of total time used _______
Service output name _____________ Minutes spent on output _______ % of total time used _______
Service output name _____________ Minutes spent on output _______ % of total time used _______
a This level of detail is unlikely to be needed for allocating input between service centres. If it is needed, then the name of a service centre should be entered instead of a service output in the left-hand column above.
40
Workbook for the collection of cost information on HIV facilities and services
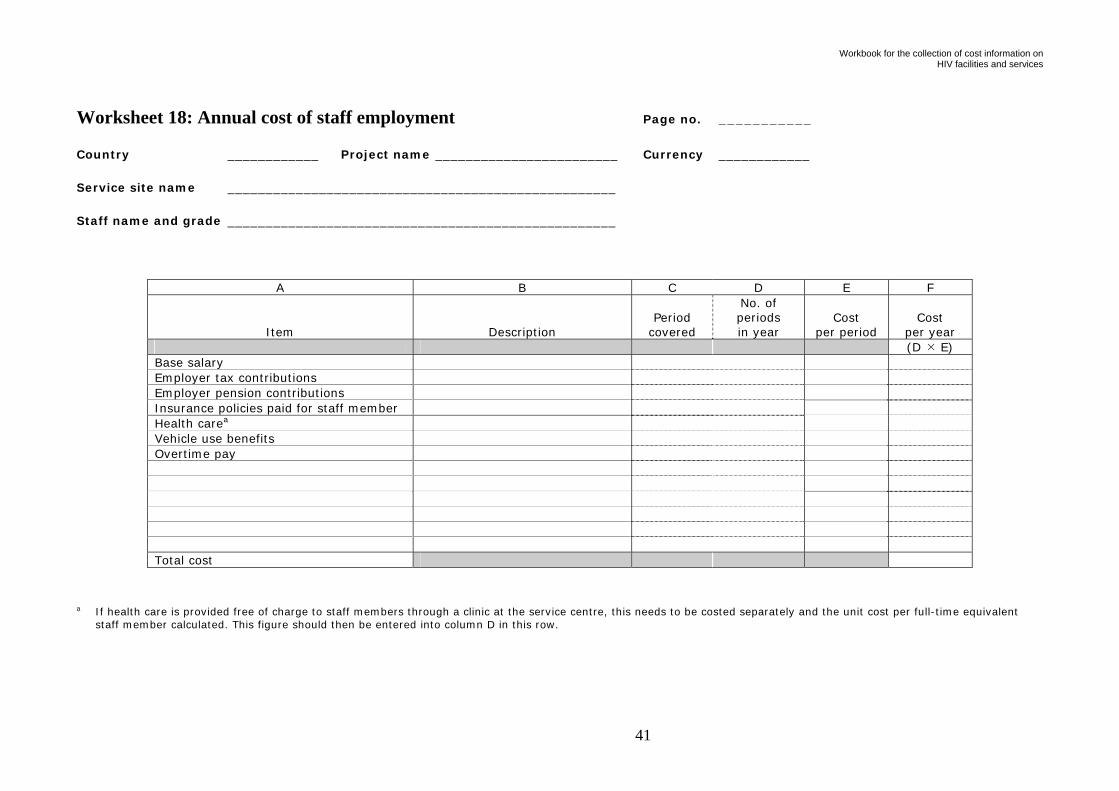
Worksheet 18: Annual cost of staff employment Page no. ___________
Country ____________ Project name ________________________ Currency ____________
Service site name ___________________________________________________
Staff name and grade ___________________________________________________
A B C D E F
Item Description Period
covered
No. of periods in year
Cost per period
Cost per year
(D E) Base salary Employer tax contributions Employer pension contributions Insurance policies paid for staff member Health carea Vehicle use benefits Overtime pay Total cost
a If health care is provided free of charge to staff members through a clinic at the service centre, this needs to be costed separately and the unit cost per full-time equivalent staff member calculated. This figure should then be entered into column D in this row.
41

UNAIDS
Worksheet 19: Vehicles: resource use log Page no. ___________
Country ____________ Project name ______________________ Currency ___________
Service site name _________________________________________________ Start date ___________
Vehicle registration no. _________________________________________________ End date ___________
A B C D E Reason for journey Service centre namea Odometer start Odometer end Kilometres driven
(km) (km) (D – C) Total distance travelled
Service centre name ____________ Kilometres travelled for centre _______ % of total use _______
Service centre name ____________ Kilometres travelled for centre _______ % of total use _______
Service centre name ____________ Kilometres travelled for centre _______ % of total use _______
a Vehicles are likely to be shared between service centres rather than sites or output units. If sites or output units do share vehicles, then the names of sites or output units should be entered instead of centres.
42
Workbook for the collection of cost information on HIV facilities and services
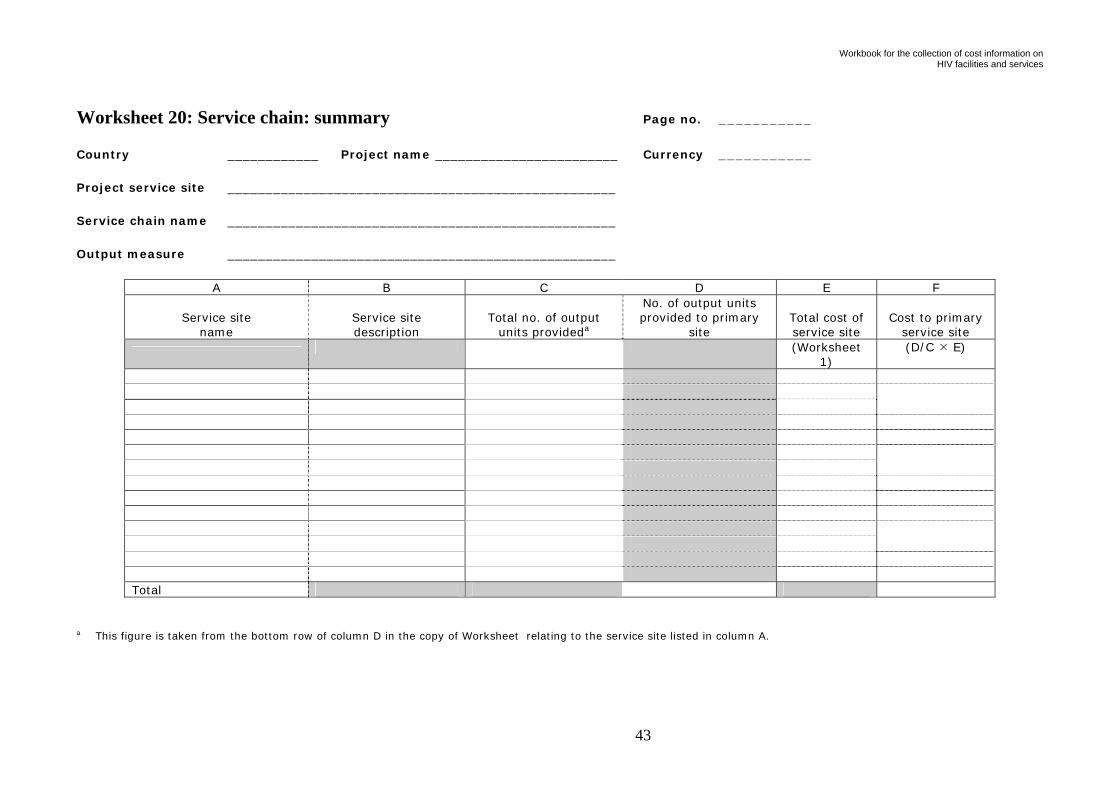
Worksheet 20: Service chain: summary Page no. ___________
Country ____________ Project name ________________________ Currency ___________
Project service site ___________________________________________________
Service chain name ___________________________________________________
Output measure ___________________________________________________
A B C D E F
Service site name
Service site description
Total no. of output units provideda
No. of output units provided to primary
site Total cost of service site
Cost to primary service site
(Worksheet
1) (D/C E)
Total
a This figure is taken from the bottom row of column D in the copy of Worksheet relating to the service site listed in column A.
43
UNAIDS
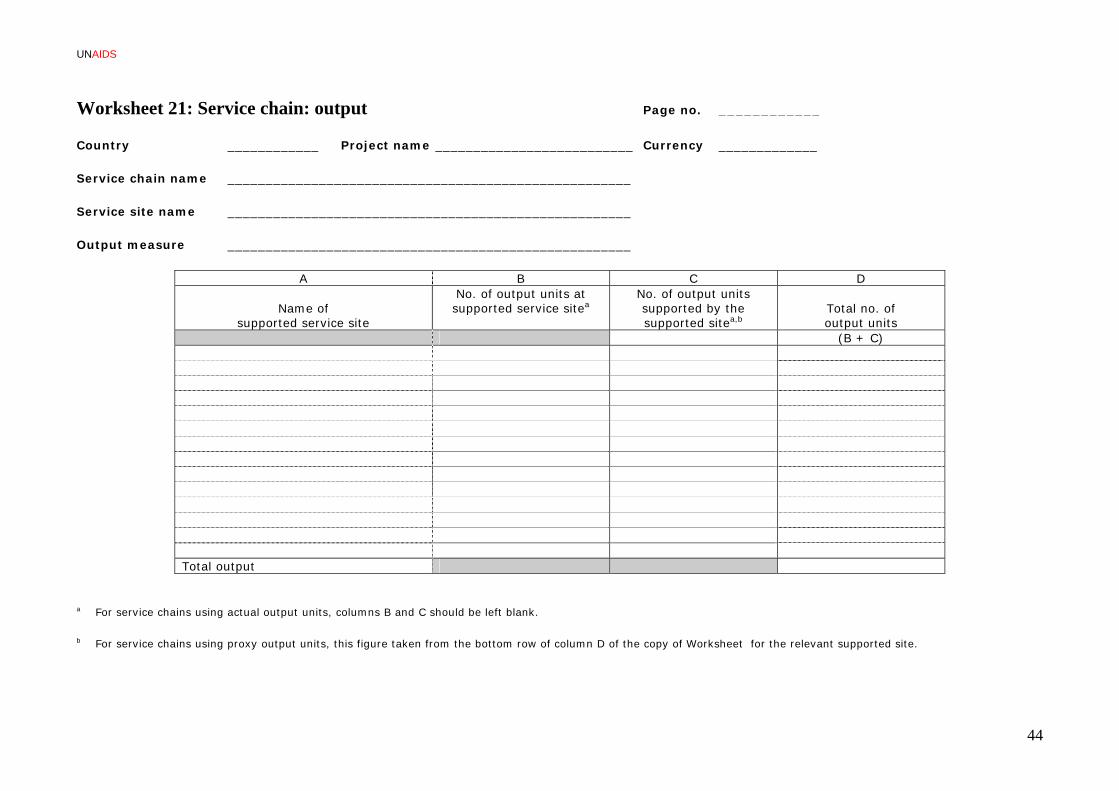
Worksheet 21: Service chain: output Page no. ____________
Country ____________ Project name __________________________ Currency _____________
Service chain name _____________________________________________________
Service site name _____________________________________________________
Output measure _____________________________________________________
A B C D
Name of supported service site
No. of output units at supported service sitea
No. of output units supported by the supported sitea,b
Total no. of output units
(B + C) Total output
a For service chains using actual output units, columns B and C should be left blank.
b For service chains using proxy output units, this figure taken from the bottom row of column D of the copy of Worksheet for the relevant supported site.
44
Workbook for the collection of cost information on HIV facilities and services
45
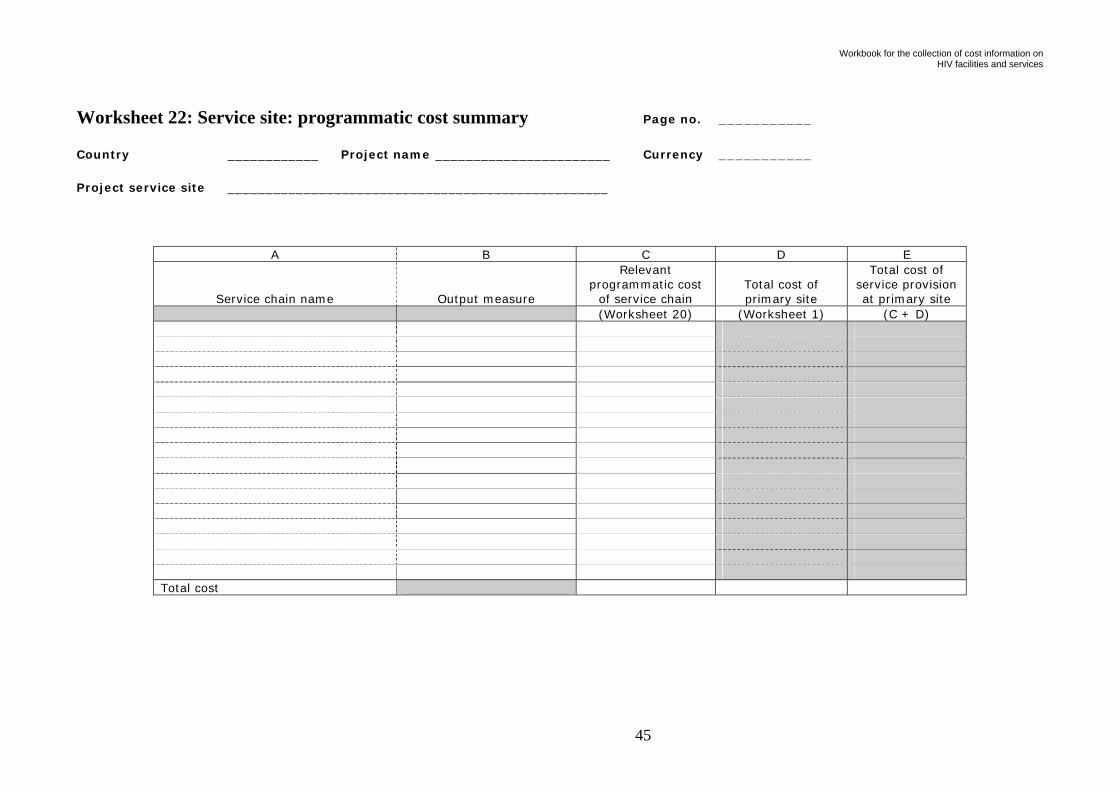
Worksheet 22: Service site: programmatic cost summary Page no. ___________
Country ____________ Project name _______________________ Currency ___________
Project service site __________________________________________________
A B C D E
Service chain name Output measure
Relevant programmatic cost
of service chain Total cost of primary site
Total cost of service provision at primary site
(Worksheet 20) (Worksheet 1) (C + D) Total cost
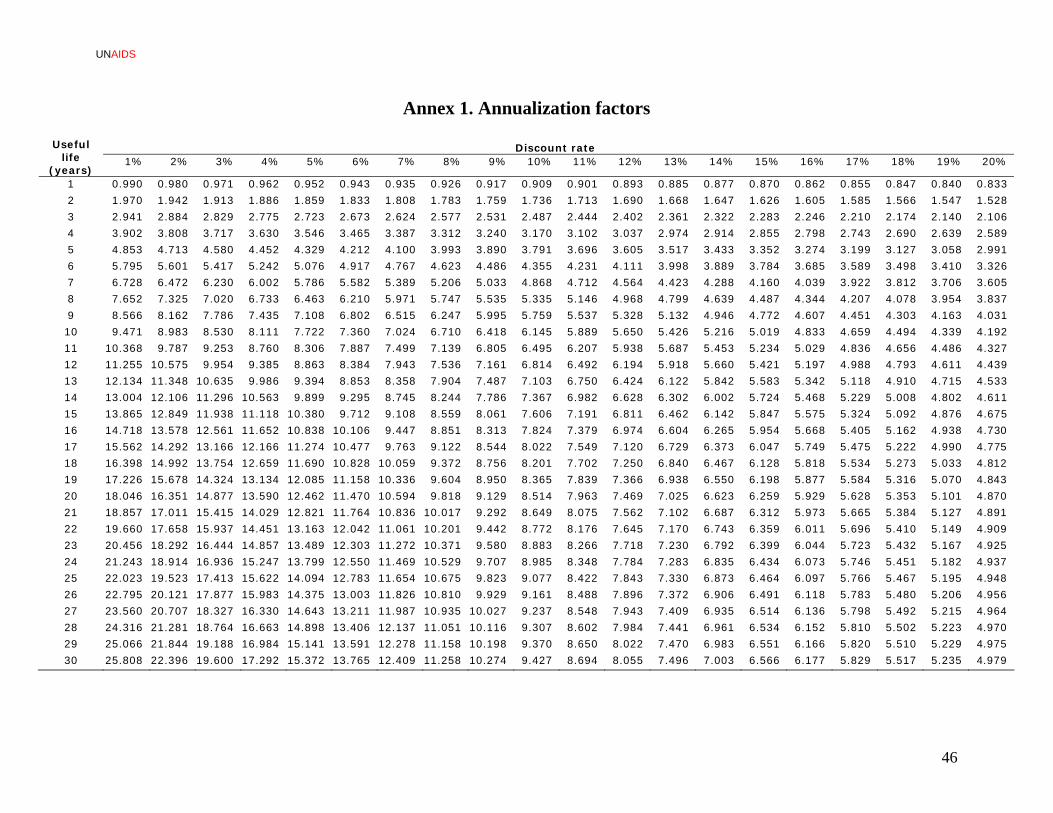
UNAIDS
Annex 1. Annualization factors
Discount rate Useful life
(years) 1% 2% 3% 4% 5% 6% 7% 8% 9% 10% 11% 12% 13% 14% 15% 16% 17% 18% 19% 20%
1 0.990 0.980 0.971 0.962 0.952 0.943 0.935 0.926 0.917 0.909 0.901 0.893 0.885 0.877 0.870 0.862 0.855 0.847 0.840 0.833
2 1.970 1.942 1.913 1.886 1.859 1.833 1.808 1.783 1.759 1.736 1.713 1.690 1.668 1.647 1.626 1.605 1.585 1.566 1.547 1.528
3 2.941 2.884 2.829 2.775 2.723 2.673 2.624 2.577 2.531 2.487 2.444 2.402 2.361 2.322 2.283 2.246 2.210 2.174 2.140 2.106
4 3.902 3.808 3.717 3.630 3.546 3.465 3.387 3.312 3.240 3.170 3.102 3.037 2.974 2.914 2.855 2.798 2.743 2.690 2.639 2.589
5 4.853 4.713 4.580 4.452 4.329 4.212 4.100 3.993 3.890 3.791 3.696 3.605 3.517 3.433 3.352 3.274 3.199 3.127 3.058 2.991
6 5.795 5.601 5.417 5.242 5.076 4.917 4.767 4.623 4.486 4.355 4.231 4.111 3.998 3.889 3.784 3.685 3.589 3.498 3.410 3.326
7 6.728 6.472 6.230 6.002 5.786 5.582 5.389 5.206 5.033 4.868 4.712 4.564 4.423 4.288 4.160 4.039 3.922 3.812 3.706 3.605
8 7.652 7.325 7.020 6.733 6.463 6.210 5.971 5.747 5.535 5.335 5.146 4.968 4.799 4.639 4.487 4.344 4.207 4.078 3.954 3.837
9 8.566 8.162 7.786 7.435 7.108 6.802 6.515 6.247 5.995 5.759 5.537 5.328 5.132 4.946 4.772 4.607 4.451 4.303 4.163 4.031
10 9.471 8.983 8.530 8.111 7.722 7.360 7.024 6.710 6.418 6.145 5.889 5.650 5.426 5.216 5.019 4.833 4.659 4.494 4.339 4.192
11 10.368 9.787 9.253 8.760 8.306 7.887 7.499 7.139 6.805 6.495 6.207 5.938 5.687 5.453 5.234 5.029 4.836 4.656 4.486 4.327
12 11.255 10.575 9.954 9.385 8.863 8.384 7.943 7.536 7.161 6.814 6.492 6.194 5.918 5.660 5.421 5.197 4.988 4.793 4.611 4.439
13 12.134 11.348 10.635 9.986 9.394 8.853 8.358 7.904 7.487 7.103 6.750 6.424 6.122 5.842 5.583 5.342 5.118 4.910 4.715 4.533
14 13.004 12.106 11.296 10.563 9.899 9.295 8.745 8.244 7.786 7.367 6.982 6.628 6.302 6.002 5.724 5.468 5.229 5.008 4.802 4.611
15 13.865 12.849 11.938 11.118 10.380 9.712 9.108 8.559 8.061 7.606 7.191 6.811 6.462 6.142 5.847 5.575 5.324 5.092 4.876 4.675
16 14.718 13.578 12.561 11.652 10.838 10.106 9.447 8.851 8.313 7.824 7.379 6.974 6.604 6.265 5.954 5.668 5.405 5.162 4.938 4.730
17 15.562 14.292 13.166 12.166 11.274 10.477 9.763 9.122 8.544 8.022 7.549 7.120 6.729 6.373 6.047 5.749 5.475 5.222 4.990 4.775
18 16.398 14.992 13.754 12.659 11.690 10.828 10.059 9.372 8.756 8.201 7.702 7.250 6.840 6.467 6.128 5.818 5.534 5.273 5.033 4.812
19 17.226 15.678 14.324 13.134 12.085 11.158 10.336 9.604 8.950 8.365 7.839 7.366 6.938 6.550 6.198 5.877 5.584 5.316 5.070 4.843
20 18.046 16.351 14.877 13.590 12.462 11.470 10.594 9.818 9.129 8.514 7.963 7.469 7.025 6.623 6.259 5.929 5.628 5.353 5.101 4.870
21 18.857 17.011 15.415 14.029 12.821 11.764 10.836 10.017 9.292 8.649 8.075 7.562 7.102 6.687 6.312 5.973 5.665 5.384 5.127 4.891
22 19.660 17.658 15.937 14.451 13.163 12.042 11.061 10.201 9.442 8.772 8.176 7.645 7.170 6.743 6.359 6.011 5.696 5.410 5.149 4.909
23 20.456 18.292 16.444 14.857 13.489 12.303 11.272 10.371 9.580 8.883 8.266 7.718 7.230 6.792 6.399 6.044 5.723 5.432 5.167 4.925
24 21.243 18.914 16.936 15.247 13.799 12.550 11.469 10.529 9.707 8.985 8.348 7.784 7.283 6.835 6.434 6.073 5.746 5.451 5.182 4.937
25 22.023 19.523 17.413 15.622 14.094 12.783 11.654 10.675 9.823 9.077 8.422 7.843 7.330 6.873 6.464 6.097 5.766 5.467 5.195 4.948
26 22.795 20.121 17.877 15.983 14.375 13.003 11.826 10.810 9.929 9.161 8.488 7.896 7.372 6.906 6.491 6.118 5.783 5.480 5.206 4.956
27 23.560 20.707 18.327 16.330 14.643 13.211 11.987 10.935 10.027 9.237 8.548 7.943 7.409 6.935 6.514 6.136 5.798 5.492 5.215 4.964
28 24.316 21.281 18.764 16.663 14.898 13.406 12.137 11.051 10.116 9.307 8.602 7.984 7.441 6.961 6.534 6.152 5.810 5.502 5.223 4.970
29 25.066 21.844 19.188 16.984 15.141 13.591 12.278 11.158 10.198 9.370 8.650 8.022 7.470 6.983 6.551 6.166 5.820 5.510 5.229 4.975
30 25.808 22.396 19.600 17.292 15.372 13.765 12.409 11.258 10.274 9.427 8.694 8.055 7.496 7.003 6.566 6.177 5.829 5.517 5.235 4.979
46