workers’ compensation data book 2014 - labor.hawaii.gov
TRANSCRIPT

STATE OF HAWAI‘I
DEPARTMENT OF LABOR AND INDUSTRIAL RELATIONS
RESEARCH AND STATISTICS OFFICE
WORKERS’
COMPENSATION
DATA BOOK
2014

State of Hawai‘i
David Y. Ige, Governor
Department of Labor and Industrial Relations
Linda Chu Takayama, Director
Leonard Hoshijo, Deputy Director
Research and Statistics Office
Phyllis Dayao, Chief
Operations Management Information
Janet Kaya, Supervisor
Prepared by:
Siriporn Rolseth
Elienne Yoshida
Disability Compensation Division
JoAnn Vidinhar, Administrator

WORKERS' COMPENSATION
DATA BOOK
2014
INTRODUCTION
The WORKERS’ COMPENSATION DATA BOOK presents a summary of information on
injuries and illnesses reported to the Disability Compensation Division of the State of Hawai‘i
Department of Labor and Industrial Relations.
This publication includes work injury and illness case, cost and days lost information by island,
industry, occupation, sex, part of body, average weekly wage, source of injury or illness, marital
status, event or exposure, nature of injury or illness and age.
Publications from 2000 are available on the Internet at http://labor.hawaii.gov/rs/.
Please direct inquiries or comments to:
State of Hawai‘i
Department of Labor & Industrial Relations
Research and Statistics Office
Operations Management Information Staff
830 Punchbowl St., Room 304
Honolulu, HI 96813
Data contained in this report – 586-9014
Copies of this report – 586-8999
E-mail: [email protected]

TABLE OF CONTENTS
Highlights 2014 ........................................................................................................3
2014 Hawai‘i Reported Injuries and Illnesses .........................................................4
Hawai‘i Reported Injuries and Illnesses: Reported Cases as a Percentage of
Employment by Industry 2013 vs 2014 ................................................................5
2014 Hawai‘i Processed Cases and Cost .................................................................6
2014 Average Cost by Part of Body ........................................................................6
2014 Hawai‘i Type of Payments by Industry ..........................................................6
Back Cases: Cost and Days Lost by Nature of Injury and Illness ...........................7
2014 Hawai‘i Workers’ Compensation Statistics
Reported Cases:
Part of Body Affected by Nature of Injury or Illness ...........................................8
Event or Exposure by Source of Injury or Illness .................................................8
Reported & Processed Cases, Cost, Days Lost:
State.......................................................................................................................9
O‘ahu...................................................................................................................12
Maui County .......................................................................................................14
Hawai‘i County ...................................................................................................16
Kaua‘i County .....................................................................................................18
2014 Hawai‘i Reported Fatalities ..........................................................................20
2014 Hearings and Decisions Issued .....................................................................21
Maximum Weekly Wage Base and
Maximum Weekly Benefit Amount History ..........................................................21
2014 Digest of the Workers' Compensation Law ..................................................22
Definitions .............................................................................................................23
Technical Notes .....................................................................................................24

3
HIGHLIGHTS 2014
STATE OF HAWAI‘I
REPORTED CASES: 20,693
PROCESSED CASES: 39,948
PROCESSED CASES WITH COST: 28,086
TOTAL COST: $270,719,658
COST PER CASE: $9,639
MEDICAL COST: $113,973,485
DAYS LOST: 1,026,696
REPORTED FATALITIES: 29
Hawai‘i County
Reported Cases: 2,418
Processed Cases: 5,330
Processed Cases with Cost: 3,882
Total Cost: $37,697,700
Cost Per Case: $9,711
Medical Cost: $15,393,726
Days Lost: 175,622
Reported Fatality: 5
Kaua‘i County
Reported Cases: 1,209
Processed Cases: 2,304
Processed Cases with Cost: 1,542
Total Cost: $11,732,316
Cost Per Case: $7,609
Medical Cost: $4,823,141
Days Lost: 45,457
Reported Fatality: 2
O‘ahu
Reported Cases: 14,057
Processed Cases: 26,731
Processed Cases with Cost: 18,719
Total Cost: $186,500,835
Cost Per Case: $9,963
Medical Cost: $77,527,434
Days Lost: 683,853
Reported Fatality: 18
Maui County
Reported Cases: 3,009
Processed Cases: 5,583
Processed Cases with Cost: 3,943
Total Cost: $34,788,807
Cost Per Case: $8,823
Medical Cost: $16,229,183
Days Lost: 121,764
Reported Fatality: 4
Note: Cost may not add due to rounding.

4
2014 HAWAI‘I REPORTED INJURIES AND ILLNESSES
Employment and Reported Cases by Industry for Hawai‘i
INDUSTRY
2013 2014
Employment Reported
Cases
Injury Case per
Number of
Employees
Employment Reported
Cases
Injury Case per
Number of
Employees
Total 584,551 20,721 1 in 28 593,246 20,693 1 in 29
Natural Resources & Mining 6,385 233 1 in 27 6,562 255 1 in 26
Construction 30,738 1,384 1 in 22 31,789 1,511 1 in 21
Manufacturing 13,573 576 1 in 24 13,914 529 1 in 26
Wholesale Trade 17,742 700 1 in 25 17,710 714 1 in 25
Retail Trade 69,642 2,673 1 in 26 69,826 2,573 1 in 27
Transportation & Warehousing 25,749 1,267 1 in 20 26,331 1,392 1 in 19
Utilities 3,767 96 1 in 39 3,807 94 1 in 41
Information 8,771 265 1 in 33 8,450 251 1 in 34
Financial Activities * 26,939 641 1 in 42 27,050 596 1 in 45
Professional, Scientific & Technical Services 24,420 315 1 in 78 24,376 298 1 in 82
Management of Companies & Enterprises 8,236 181 1 in 46 8,360 154 1 in 54
Administrative, Support & Waste Management 47,312 1,634 1 in 29 49,494 1,732 1 in 29
Educational Services 13,989 347 1 in 40 13,346 282 1 in 47
Health Care & Social Assistance 63,921 1,942 1 in 33 64,781 1,894 1 in 34
Arts, Entertainment & Recreation 11,973 355 1 in 34 12,020 363 1 in 33
Accommodations & Food Services 99,290 3,663 1 in 27 101,326 3,658 1 in 28
Other Services, except Public Administration 24,748 660 1 in 38 25,149 624 1 in 40
Public Administration 87,167 3,767 1 in 23 88,673 3,751 1 in 24
Information Not Available/Unclassified 189 22 1 in 9 282 22 1 in 13
* Financial Activities formerly Finance, Insurance, Real Estate, Rent & Leasing.
In 2014, while employment for the state of Hawai‘i increased by 8,695 or 1.5 percent, the number of reported
injury cases recorded a marginal decrease of 28 or 0.1 percent.
Employment levels grew for the fourth consecutive year from 2010. All industries reported gains with the
exception of Wholesale Trade, Information, Professional, Scientific & Technical Services, and Educational
Services in 2014 over the year.
Of the eighteen industries, one third (6) of the industries experienced increases in reported cases between
2013 and 2014, The industries which comprised the largest percentage gain were: Transportation &
Warehousing (+9.9%), Natural Resources and Mining (+9.4 %) and Construction (+9.2%).
Two out of every three of the industries registered declines in reported cases, of which Educational Services
(-18.7%) and Management of Companies and Enterprises (-14.9%) composed the greatest percentage drop.
Transportation & Warehousing recorded the highest number of reported injuries per employment for six
consecutive years. This industry posted one injury for every nineteen workers in 2014 compared to one
injury for every twenty workers the previous year.
Professional, Scientific & Technical Services recorded the lowest percent of reported injuries per
employment for the past ten years. The industry reported one injury for every eighty-two workers in
comparison to one injury for every seventy-eight in 2013.

5
* Financial Activities formerly Finance, Insurance, Real Estate, Rent & Leasing.
0.0% 1.0% 2.0% 3.0% 4.0% 5.0% 6.0%
Natural Resources & Mining
Construction
Manufacturing
Wholesale Trade
Retail trade
Transportation &
Warehousing
Utilities
Information
Financial Activities *
Professional, Scientific &
Technical Services
Management of Companies &
Enterprises
Administrative, Support &
Waste Management
Educational Services
Health Care & Social
Assistance
Arts, Entertainment &
Recreation
Accommodation &
Food Services
Other Services, except
Public Administration
Public Administration
Hawai‘i Reported Injuries and Illnesses:
Reported Cases as a Percentage of Employment by Industry
2013 vs 2014
2013
2014

6
2014 HAWAI‘I PROCESSED CASES AND COST
2004004
2014 HAWAI‘I TYPE OF
TOTAL
WORKERS’
COMPENSATION
COST
TEMPORARY TOTAL
DISABILITY
TEMPORARY PARTIAL
DISABILITY
PERMANENT TOTAL
DISABILITY
Cases Cost Cases Cost Cases Cost
INDUSTRY $270,719,658 10,404 $71,822,291 1,182 $3,119,007 537 $17,070,693 2,748 $55,722,334 99 $1,714,614 1,737 $881,647 1,005 $5,045,828 6 $103,423 26,823 $102,743,381
Natural Resources & Mining $2,976,032 95 $578,876 8 $14,119 18 $337,399 49 $1,023,389 4 $35,450 38 $16,593 19 $69,044 0 $0 377 $1,787,132
Construction $30,284,741 758 $8,383,658 62 $217,947 50 $1,817,923 340 $8,033,604 20 $466,394 246 $150,882 184 $1,067,980 2 $50,882 2,255 $11,352,656
Manufacturing $9,261,344 291 $2,351,725 28 $54,658 44 $1,009,935 97 $2,116,842 2 $8,948 64 $44,336 52 $212,284 0 $0 908 $3,735,871
Wholesale Trade $8,730,931 356 $2,141,747 34 $73,805 5 $135,594 104 $2,175,595 4 $72,022 56 $56,016 51 $305,031 0 $0 941 $4,371,773
Retail Trade $25,309,854 1,125 $5,629,055 167 $420,933 32 $797,926 284 $5,578,062 2 $17,487 195 $61,004 101 $533,898 0 $0 2,954 $10,497,943
Transportation & Warehousing $23,009,065 1,007 $7,564,487 150 $404,218 24 $682,671 231 $4,910,974 11 $181,250 120 $64,672 97 $481,123 0 $0 1,924 $8,514,537
Utilities $1,749,387 51 $362,159 3 $29,080 5 $118,720 20 $305,420 0 $0 21 $9,068 5 $30,657 1 $15,973 185 $1,546,952
Information $3,364,807 104 $887,298 5 $21,556 13 $310,975 43 $1,762,771 1 $33,972 28 $10,550 17 $54,044 0 $0 391 $2,942,680
Financial Activities * $7,488,250 266 $1,733,465 30 $77,004 11 $333,740 69 $1,401,875 4 $128,530 39 $11,879 17 $80,931 0 $0 718 $2,675,614
Professional, Scientific, & Technical Svcs. $3,886,554 105 $894,481 12 $22,444 5 $127,725 33 $707,673 1 $76,473 28 $14,661 15 $115,900 0 $0 386 $1,374,577
Management of Companies & Enterprises $2,521,045 78 $593,964 8 $9,376 13 $428,187 36 $698,672 1 $36,505 14 $5,944 13 $47,325 0 $0 248 $1,070,947
Administrative, Support, & Waste Mgmt. $23,911,560 951 $5,986,529 83 $285,184 6 $160,775 263 $5,868,980 12 $177,601 143 $74,515 100 $495,619 0 $0 1,939 $8,625,905
Educational Services $3,463,605 116 $740,438 12 $33,923 6 $138,441 36 $621,702 1 $35,114 24 $7,750 8 $40,931 0 $0 430 $1,335,897
Health Care & Social Assistance $20,440,360 896 $5,486,935 146 $354,721 20 $443,784 176 $3,245,958 4 $62,514 71 $46,035 90 $411,197 0 $0 2,435 $8,339,052
Arts, Entertainment, & Recreation $2,940,238 151 $473,040 12 $25,353 5 $111,504 29 $398,089 2 $41,011 20 $9,975 6 $33,144 0 $0 501 $1,387,243
Accommodation and Food Services $28,864,720 1,681 $7,189,007 193 $425,434 29 $734,455 333 $5,669,595 4 $75,040 216 $109,991 100 $466,287 1 $28,608 3,518 $10,703,252
Other Services, except Public Admin. $8,781,415 315 $1,824,613 27 $56,765 10 $339,047 95 $1,672,952 2 $1,241 55 $21,802 35 $175,838 0 $0 922 $3,360,364
Public Administration $57,989,682 2,039 $18,769,567 201 $588,357 124 $5,659,100 496 $9,261,621 18 $241,185 353 $148,574 89 $388,426 2 $7,960 5,558 $17,849,397
Other $5,746,068 19 $231,246 1 $4,131 117 $3,382,790 14 $268,560 6 $23,877 6 $17,400 6 $36,169 0 $0 233 $1,271,589
Notes: Cost is rounded to the nearest whole dollar and may not add to total.
* Financial Activities formerly Finance, Ins, Real Estate, Rent, & Leasing.
2014 Average Cost by Part of Body
Head
$8,872 Eyes
$1,894 Ears
$3,851
Face
$4,570
Back
$12,774
Neck
$12,038 Shoulder
$13,835
Wrists
$8,546
Fingers
$2,654
Arms
$7,927
Hands
$3,937
Legs
$10,743
Toes
$3,516
Ankles
$7,224
Feet
$6,545
Chest
$8,250
Pelvic
$11,942
Abdomen
$6,611
In 2014, both Processed Cases and Processed Cases with Cost
decreased by 331 or 0.8 percent to 39,948 and by 1,316 or 4.5
percent to 28,086 respectively. Meanwhile, increases were noted
in Total Cost, rising to $270,719,658 or 4.0 percent, while Days
Lost trending up to 1,026,696 or 2.7 percent. The total Workers’
Compensation Cost per Case grew from $8,855 to $9,639 or by
8.9 percent.
Shoulder recorded the highest Average Cost by Part of Body,
reporting an average cost of $13,835 or 11.7 percent growth from
2013. Back registered the second highest Average Cost by Part of
Body at $12,774. Eyes registered the lowest Average Cost by Part
of Body but exhibited the largest over the year increase to $1,894
or 35.5 percent. Head accounted for the largest decrease in
Average Cost by Part of Body, contracting by 21.0 percent to
$8,872.
Medical comprised of $113,973,485 or 42.1 percent of the total
Workers’ Compensation Costs. Medical Cost steadily increased
from 2009 by $15.3 million. Medical Cost per Case grew by $319
or by 7.8 percent from 2013. For three consecutive years,
Permanent Total Disability posted the highest average cost.
Disfigurement had the lowest average cost.

7
`
PAYMENTS BY INDUSTRY
PERMANENT PARTIAL
DISABILITY DEATH DISFIGUREMENT
VOCATIONAL
REHABILITATION
ATTENDANT
SERVICES MEDICAL
Cases Cost Cases Cost Cases Cost Cases Cost Cases Cost Cases Cost Cost per Case
2,642 $56,814,916 93 $2,337,907 1,692 $753,605 1,026 $4,738,979 8 $88,775 25,942 $113,973,485 $4,393.40
27 $551,939 4 $43,657 23 $10,870 8 $31,202 0 $0 312 $1,407,972 $4,512.73
261 $7,019,056 16 $729,289 200 $96,141 139 $792,304 2 $53,166 2,075 $11,175,258 $5,385.67
93 $1,860,383 1 $4,219 62 $40,180 41 $170,275 0 $0 751 $3,769,968 $5,019.93
101 $2,243,678 5 $163,883 63 $25,256 45 $250,949 0 $0 863 $3,696,017 $4,282.75
290 $6,142,669 2 $6,648 162 $71,038 135 $566,405 1 $21,821 2,675 $11,653,358 $4,356.40
211 $4,018,227 7 $128,423 131 $45,625 104 $484,937 0 $0 1,902 $9,680,479 $5,089.63
18 $464,079 0 $0 20 $18,550 4 $32,189 0 $0 173 $724,609 $4,188.49
37 $900,188 0 $0 31 $12,956 11 $81,784 0 $0 291 $1,150,050 $3,952.06
76 $1,606,138 3 $56,347 46 $16,110 32 $158,409 0 $0 737 $3,507,037 $4,758.53
36 $906,419 1 $27,143 28 $10,900 16 $79,535 1 $1,274 368 $1,816,631 $4,936.50
15 $594,105 2 $73,519 11 $4,875 10 $34,167 0 $0 190 $782,852 $4,120.27
234 $5,750,761 15 $285,552 116 $65,478 121 $515,802 1 $2,826 2,042 $10,858,653 $5,317.66
43 $838,348 3 $112,872 25 $14,230 8 $50,639 1 $652 388 $1,534,062 $3,953.77
232 $4,699,037 2 $20,273 99 $41,671 93 $473,627 0 $0 2,293 $8,920,312 $3,890.24
43 $861,314 1 $14,726 39 $20,001 14 $56,437 0 $0 388 $1,377,862 $3,551.19
315 $5,993,806 2 $105,303 224 $98,482 116 $488,049 0 $0 3,862 $13,830,184 $3,581.09
104 $2,379,684 1 $14,628 72 $37,495 34 $44,402 1 $6,880 857 $4,077,903 $4,758.35
494 $9,396,147 25 $536,197 335 $116,623 93 $405,244 1 $2,156 5,608 $22,516,293 $4,015.03
12 $588,938 3 $15,228 5 $7,125 2 $22,623 0 $0 167 $1,493,988 $8,946.03
Back Cases:
Cost and Days Lost by
Nature of Injury and Illness
2013
2014
Cases
With
Cost
Total
Cost
Medical
Cost
Days
Lost
Cases
With
Cost
Total
Cost
Medical
Cost
Days
Lost
Nature of Injury and Illness Total
5,084
$59,466,914
$26,058,747
227,659
4,781
$61,074,810
$25,050,699
231,905
Sprain, Strain
2886
222
$31,924,526
$13,305,512
127,547
2,642
222
$33,429,924
$13,422,191
126,358
Back Pain
1,527
$16,603,492
$7,987,108
70,441
1,486
$17,280,947
$7,444,297
72,588
Traumatic Injury
376
$5,288,581
$2,558,831
18,592
358
$5,682,734
$2,721,443
21,830
Dislocation
42
$488,261
$239,291
2,177
40
$729,730
$280,377
2,560
Bruises, Contusions
82
$957,903
$438,422
2,122
84
$763,020
$289,602
3,125
Fracture
42
$1,167,392
$482,519
2,472
41
$1,064,598
$435,042
2,849
Multiple Traumatic Injuries/Disorders
14
$193,256
$29,562
1,033
11
$84,002
$18,452
9
Musculoskeletal System & Connective Tissue
24
$224,899
$113,464
1,165
32
$275,414
$110,974
573
Other Injuries and Illnesses
17
$674,780
$590,384
827
21
$271,712
$147,045
1,196
Non-classifiable
74
$1,943,824
$313,653
1,283
66
$1,492,728
$181,276
817
Cost is rounded to the nearest whole dollar and may not add to total.
Over the year, the total number of Back Cases with Costs decreased from 5,084 cases to 4,781 cases in 2014 or by 6.0
percent.
The total cost of Back Cases increased from $59,466,914 in 2013 to $61,074,810 in 2014 or by 2.7 percent.
The total average cost of all Back Injuries recorded a 9.2 percent increase rising from $11,697 to $12,774 in 2014.
Sprain and Strain, comprising more than fifty percent of Back Cases registered the highest number of Cases with Cost,
Total Cost, Medical Cost and Days Lost.

Reported CasesPart of
Body Eyes
Head,
Neck,
Excl. Eyes
Trunk,
Excl.
Back Back Fingers
Upper
Extremity,
Excl. Fingers
Lower
Extremity
Body
System
Multiple
Body Parts
Non-
classi-
fiable
Nature of Injury or Illness 20,693 668 1,723 2,143 2,901 2,834 3,175 4,097 890 2,184 78
Traumatic Injuries 2,287 184 286 228 217 142 265 547 0 395 23
Fracture 646 0 59 88 13 134 124 213 0 13 2
Sprains, Strains 5,179 2 148 782 1,646 153 613 1,417 0 415 3
Cut, Laceration 2,734 29 425 4 3 1,426 563 255 0 27 2
Puncture, Excluding Bites 548 1 15 5 0 312 113 101 0 1 0
Abrasions, Scratches 336 45 41 6 6 22 82 80 0 53 1
Bruises, Contusions 1,720 19 287 195 69 184 251 547 0 167 1
Foreign Bodies 233 221 1 0 0 7 4 0 0 0 0
Heat Burns 453 17 32 13 1 22 261 57 0 50 0
Multiple Injuries/Disorders 624 6 48 21 6 35 78 103 0 326 1
Back Pain 901 0 0 0 901 0 0 0 0 0 0
Pain, Excluding Back 2,072 23 100 452 0 163 459 562 0 312 1
Carpal Tunnel 60 0 0 0 0 0 60 0 0 0 0
Musculoskeletal 115 0 0 14 18 22 45 7 0 9 0
Skin Disorders 100 0 11 6 1 2 38 5 0 34 3
Symptoms 291 5 25 27 0 1 1 0 221 11 0
Mental Disorders 314 0 0 0 0 0 0 0 314 0 0
Exposure 314 25 34 20 0 3 13 1 208 10 0
Other Injuries/Illnesses 1,725 91 211 281 20 206 203 202 147 361 3
Nonclassifiable 41 0 0 1 0 0 2 0 0 0 38
Reported CasesEvent or
Exposure
Struck By
or Struck
Against
Caught In,
Under, or
Between
Rubbed
or
Abraded Fall
Bodily
Reaction Overexertion
Contact
With Temp.
Extremes
Exposure
(Harmful
Substance)
Highway
Motor
Vehicle
Accidents Other
Source of Injury or Illness 20,693 4,677 720 263 3,426 1,731 4,718 472 1,462 457 2,767
Chemical, Chemical Product 436 6 0 0 0 0 0 9 416 0 5
Containers 2,768 587 86 1 76 0 1,850 36 0 0 132
Furniture, Fixtures 1,162 490 65 2 151 0 407 7 2 0 38
Machinery 1,184 448 131 2 52 0 369 74 12 0 96
Building Materials 520 251 36 4 20 0 176 0 0 0 33
Vehicle, Mobile Eqmt Parts 151 61 11 0 3 0 67 0 1 0 8
Other Parts and Materials 611 349 28 5 13 0 155 13 0 0 48
Plants, Animals, Minerals 1,125 176 7 6 23 0 80 175 383 0 275
Person, Injured Worker 2,423 6 0 0 1 1,731 13 0 241 0 431
Person, Other 1,388 82 8 0 2 0 420 0 61 0 815
Floors, Walkways, Ground 2,890 40 8 9 2,825 0 6 0 0 0 2
Structures, Other Surfaces 717 340 134 3 127 0 81 2 0 0 30
Handtools (Nonpowered) 1,138 885 31 2 3 0 175 1 0 0 41
Handtools (Powered) 307 147 14 0 4 0 111 6 6 0 19
Other Tools, Instruments,
Equipment 930 253 35 0 32 0 327 4 245 0 34
Highway Vehicle, Motorized 928 122 65 1 40 0 91 3 0 450 156
Nonpowered Plant, Vehicles 399 153 33 0 25 0 178 0 0 0 10
Other Vehicles 323 69 21 1 15 0 44 2 0 7 164
Scrap, Waste, Debris 437 147 1 219 3 0 19 0 31 0 17
Other Sources 856 65 6 8 11 0 149 140 64 0 413
EVENT OR EXPOSURE BY SOURCE OF INJURY OR ILLNESS
PART OF BODY AFFECTED BY NATURE OF INJURY OR ILLNESS
2014 HAWAI‘I WORKERS' COMPENSATION STATISTICS
8

STATE
ISLAND 20,693 100.0% 39,948 100.0% 28,086 100.0% 270,719,658 100.0% 1,026,696 100.0%
O‘ahu 14,057 67.9 26,731 66.9 18,719 66.7 186,500,835 68.9 683,853 66.6
East Hawai‘i 1,074 5.2 2,658 6.7 1,915 6.8 19,043,658 7.0 93,032 9.1
West Hawai‘i 1,344 6.5 2,672 6.7 1,967 7.0 18,654,042 6.9 82,590 8.0
Maui 2,817 13.6 5,239 13.1 3,705 13.2 30,983,819 11.4 112,440 11.0
Moloka‘i 62 0.3 137 0.3 85 0.3 1,049,555 0.4 4,416 0.4
Lana‘i 130 0.6 207 0.5 153 0.5 2,755,433 1.0 4,908 0.5
Kaua‘i 1,209 5.8 2,304 5.8 1,542 5.5 11,732,316 4.3 45,457 4.4
INDUSTRY 20,693 100.0% 39,948 100.0% 28,086 100.0% $270,719,658 100.0% 1,026,696 100.0%
Natural Resources & Mining 255 1.2 490 1.2 352 1.3 2,976,032 1.1 9,589 0.9
Construction 1,511 7.3 2,774 6.9 2,232 8.0 30,284,741 11.2 93,921 9.2
Manufacturing 529 2.6 1,001 2.5 817 2.9 9,261,344 3.4 30,705 3.0
Wholesale Trade 714 3.5 1,225 3.1 929 3.3 8,730,931 3.2 33,369 3.3
Retail Trade 2,573 12.4 4,360 10.9 2,847 10.1 25,309,854 9.4 103,140 10.1
Transportation & Warehousing 1,392 6.7 2,691 6.7 2,069 7.4 23,009,065 8.5 96,331 9.4
Utilities 94 0.5 305 0.8 189 0.7 1,749,387 0.7 4,084 0.4
Information 251 1.2 478 1.2 315 1.1 3,364,807 1.2 9,663 0.9
Financial Activities * 596 2.9 1,097 2.8 782 2.8 7,488,250 2.8 28,427 2.8
Professional, Scientific, & Tech. 298 1.4 528 1.3 396 1.4 3,886,554 1.4 12,612 1.2
Management of Companies & Entrpr. 154 0.7 284 0.7 206 0.7 2,521,045 0.9 8,130 0.8
Administrative, Support, & Waste 1,732 8.4 2,970 7.4 2,223 7.9 23,911,560 8.8 104,892 10.2
Educational Services 282 1.4 553 1.4 415 1.5 3,463,605 1.3 9,096 0.9
Health Care & Social Assistance 1,894 9.2 3,421 8.6 2,447 8.7 20,440,360 7.6 83,259 8.1
Arts, Entertainment, & Recreation 363 1.8 596 1.5 424 1.5 2,940,238 1.1 10,117 1.0
Accommodation and Food Services 3,658 17.7 5,748 14.4 4,140 14.7 28,864,720 10.7 116,590 11.4
Other Services, except Public Admin. 624 3.0 1,189 3.0 907 3.2 8,781,415 3.2 32,458 3.2
Public Administration 3,751 18.1 9,951 24.9 6,140 21.9 57,989,682 21.4 236,356 23.0
Other 22 0.1 287 0.7 256 0.9 5,746,068 2.1 3,957 0.4
TYPE OF INSURANCE 20,693 100.0% 39,948 100.0% 28,086 100.0% $270,719,658 100.0% 1,026,696 100.0%
Carrier 14,082 68.1 24,570 61.5 18,062 64.3 163,856,698 60.5 639,413 62.3
Self-Insured: Private & Captive 2,952 14.3 5,583 14.0 4,042 14.4 38,091,106 14.1 153,475 15.0
Self-Insured: Government 3,659 17.7 9,795 24.5 5,982 21.3 52,327,803 19.3 233,808 22.8
State of Hawai‘i 1,787 8.6 5,522 13.8 3,297 11.7 26,594,255 9.8 145,724 14.2
City & County of Honolulu 1,427 6.9 3,066 7.7 1,933 6.9 18,249,771 6.7 61,730 6.0
Hawai‘i County 127 0.6 476 1.2 275 1.0 1,986,708 0.7 8,632 0.8
Maui County 213 1.0 500 1.3 320 1.1 4,034,854 1.5 10,411 1.0
Kaua‘i County 105 0.5 231 0.6 157 0.6 1,462,215 0.5 7,311 0.7
Special Compensation Fund INA -- INA -- INA -- 16,444,051 6.1 INA --
OCCUPATION 20,693 100.0% 39,948 100.0% 28,086 100.0% $270,719,658 100.0% 1,026,696 100.0%
Executive, Admin. & Managerial 722 3.5 1,475 3.7 1,029 3.7 10,335,392 3.8 23,698 2.3
Professional Specialty 1,592 7.7 3,454 8.7 2,202 7.8 19,573,793 7.2 60,026 5.9
Technical Support 469 2.3 899 2.3 597 2.1 5,459,950 2.0 19,849 1.9
Sales 1,421 6.9 2,500 6.3 1,607 5.7 14,733,239 5.4 60,132 5.9
Administrative Support 1,145 5.5 2,648 6.6 1,670 6.0 13,455,530 5.0 58,497 5.7
Services 7,013 33.9 12,944 32.4 8,931 31.8 74,195,687 27.4 317,640 30.9
Agricultural, Forestry & Fishing 1,034 5.0 1,994 5.0 1,453 5.2 12,994,396 4.8 53,037 5.2
Mechanic, Repairer 1,443 7.0 2,648 6.6 1,982 7.1 19,093,728 7.1 68,070 6.6
Construction Trades 1,104 5.3 2,322 5.8 1,826 6.5 25,326,200 9.4 75,720 7.4
Precision Production 314 1.5 631 1.6 477 1.7 4,204,550 1.6 19,021 1.9
Operator, Fabricator, Inspector 277 1.3 484 1.2 386 1.4 3,266,346 1.2 9,551 0.9
Transportation, Material Moving 1,394 6.7 2,931 7.3 2,297 8.2 28,625,958 10.6 114,324 11.1
Handler, Helper, Laborer 2,542 12.3 4,495 11.3 3,273 11.7 33,917,253 12.5 141,324 13.8
Nonclassifiable 223 1.1 523 1.3 356 1.3 5,537,636 2.1 5,807 0.6
SEX 20,693 100.0% 39,948 100.0% 28,086 100.0% $270,719,658 100.0% 1,026,696 100.0%
Male 12,319 59.5 23,554 59.0 16,931 60.3 173,578,180 64.1 612,814 59.7
Female 8,374 40.5 16,394 41.0 11,155 39.7 97,141,478 35.9 413,882 40.3
Notes: Cost and percent totals may not add due to rounding.
* Financial Activities formerly Fin, Ins, Real Est, Rent, & Leasing.
2014 HAWAI‘I WORKERS' COMPENSATION STATISTICS
PROCESSED WITH COST COST DAYS LOSTREPORTED
9

STATE
PART OF BODY 20,693 100.0% 39,948 100.0% 28,086 100.0% $270,719,658 100.0% 1,026,696 100.0%
Ears 58 0.3 145 0.4 90 0.3 346,625 0.1 756 0.1
Face, Excluding Eyes, Ears 680 3.3 1,062 2.7 674 2.4 3,080,371 1.1 10,349 1.0
Eyes 668 3.2 942 2.4 610 2.2 1,155,367 0.4 3,704 0.4
Head, Excluding Ears, Face, Eyes 732 3.5 1,222 3.1 815 2.9 7,230,742 2.7 24,164 2.4
Neck 253 1.2 540 1.4 394 1.4 4,743,063 1.8 16,864 1.6
Trunk, Excluding Back 2,143 10.4 4,609 11.5 3,308 11.8 40,437,839 14.9 155,430 15.1
Shoulder 1,032 5.0 2,399 6.0 1,817 6.5 25,137,582 9.3 102,062 9.9
Chest 418 2.0 734 1.8 463 1.7 3,819,652 1.4 10,318 1.0
Abdomen 124 0.6 236 0.6 125 0.5 826,380 0.3 3,111 0.3
Pelvic Region 262 1.3 528 1.3 370 1.3 4,418,558 1.6 14,787 1.4
Trunk, Multiple/Unspecified 307 1.5 712 1.8 533 1.9 6,235,667 2.3 25,152 2.5
Back (Spine/Spinal Cord) 2,901 14.0 6,352 15.9 4,781 17.0 61,074,810 22.6 231,905 22.6
Arms 1,113 5.4 2,008 5.0 1,391 5.0 11,026,368 4.1 45,114 4.4
Wrists 723 3.5 1,364 3.4 955 3.4 8,161,451 3.0 37,111 3.6
Hands, Excluding Fingers 978 4.7 1,512 3.8 1,061 3.8 4,177,158 1.5 16,585 1.6
Fingers 2,834 13.7 4,197 10.5 2,966 10.6 7,872,658 2.9 22,642 2.2
Upper Extremities, Multiple 361 1.7 697 1.7 456 1.6 2,958,884 1.1 16,880 1.6
Legs 2,177 10.5 4,574 11.5 3,323 11.8 35,699,111 13.2 140,276 13.7
Ankles 819 4.0 1,475 3.7 1,079 3.8 7,794,653 2.9 32,778 3.2
Feet, Excl. Toes 579 2.8 1,013 2.5 733 2.6 4,797,494 1.8 19,011 1.9
Toes 283 1.4 434 1.1 291 1.0 1,023,243 0.4 3,658 0.4
Lower Extremities, Multiple 239 1.2 428 1.1 310 1.1 2,050,595 0.8 9,578 0.9
Body Systems 890 4.3 1,703 4.3 624 2.2 6,229,842 2.3 28,790 2.8
Multiple Body Parts 2,184 10.6 5,434 13.6 4,059 14.5 55,553,229 20.5 204,746 19.9
Nonclassifiable 78 0.4 237 0.6 166 0.6 5,306,155 2.0 6,355 0.6
AVERAGE WEEKLY WAGE 20,693 100.0% 39,948 100.0% 28,086 100.0% $270,719,658 100.0% 1,026,696 100.0%
$.01-$200 854 4.1 1,564 3.9 1,068 3.8 9,204,967 3.4 32,141 3.1
$200.01-$400 2,111 10.2 4,104 10.3 3,076 11.0 26,317,142 9.7 110,448 10.8
$400.01-$600 2,710 13.1 5,412 13.6 3,959 14.1 36,391,061 13.4 152,702 14.9
$600.01-$800 3,156 15.3 6,540 16.4 4,680 16.7 48,693,876 18.0 210,217 20.5
$800.01-$1000 1,901 9.2 4,009 10.0 2,794 10.0 32,624,690 12.1 123,232 12.0
Over $1000 3,532 17.1 7,022 17.6 4,851 17.3 52,519,260 19.4 154,045 15.0
Information Not Available 6,429 31.1 11,297 28.3 7,658 27.3 64,968,662 24.0 243,911 23.8
SOURCE OF INJURY OR ILLNESS 20,693 100.0% 39,948 100.0% 28,086 100.0% $270,719,658 100.0% 1,026,696 100.0%
Chemical, Chemical Product 436 2.1 672 1.7 378 1.3 1,381,973 0.5 5,344 0.5
Containers 2,768 13.4 5,297 13.3 3,852 13.7 37,998,131 14.0 162,789 15.9
Furniture, Fixtures 1,162 5.6 2,077 5.2 1,428 5.1 11,166,324 4.1 48,628 4.7
Machinery 1,184 5.7 2,140 5.4 1,593 5.7 14,036,724 5.2 56,863 5.5
Building Materials 520 2.5 952 2.4 712 2.5 7,429,580 2.7 29,902 2.9
Vehicle, Mobile Equipment Parts 151 0.7 322 0.8 254 0.9 2,899,840 1.1 10,896 1.1
Other Parts and Materials 611 3.0 988 2.5 733 2.6 5,399,206 2.0 16,578 1.6
Plants, Animals, Minerals 1,125 5.4 1,719 4.3 1,105 3.9 5,102,531 1.9 15,017 1.5
Person, Injured Worker 2,423 11.7 5,452 13.7 3,486 12.4 38,908,922 14.4 152,114 14.8
Person, Other than Injured Worker 1,388 6.7 2,749 6.9 1,832 6.5 16,486,965 6.1 76,924 7.5
Floors, Walkways, Ground 2,890 14.0 6,307 15.8 4,705 16.8 57,157,384 21.1 205,005 20.0
Structures, Other Surfaces 717 3.5 1,274 3.2 925 3.3 8,492,691 3.1 32,140 3.1
Handtools (Nonpowered) 1,138 5.5 1,791 4.5 1,288 4.6 4,969,325 1.8 17,431 1.7
Handtools (Powered) 307 1.5 565 1.4 410 1.5 2,812,356 1.0 12,953 1.3
Other Tools, Instruments, Equipment 930 4.5 1,686 4.2 1,176 4.2 8,860,242 3.3 37,415 3.6
Highway Vehicle, Motorized 928 4.5 2,147 5.4 1,656 5.9 21,065,341 7.8 71,444 7.0
Nonpowered Plant Vehicles 399 1.9 733 1.8 555 2.0 4,801,912 1.8 21,770 2.1
Other Vehicles 323 1.6 629 1.6 480 1.7 7,333,233 2.7 21,326 2.1
Scrap, Waste, Debris 437 2.1 654 1.6 436 1.6 1,145,559 0.4 4,574 0.5
Other Sources 856 4.1 1,794 4.5 1,082 3.9 13,271,419 4.9 27,583 2.7
MARITAL STATUS 20,693 100.0% 39,948 100.0% 28,086 100.0% $270,719,658 100.0% 1,026,696 100.0%
Married 9,335 45.1 19,492 48.8 13,871 49.4 143,298,383 52.9 522,168 50.9
Single 10,654 51.5 19,252 48.2 13,421 47.8 120,305,809 44.4 484,810 47.2
Information Not Available 704 3.4 1,204 3.0 794 2.8 7,115,466 2.6 19,718 1.9 Notes: Cost and percent totals may not add due to rounding.
2014 HAWAI‘I WORKERS' COMPENSATION STATISTICS
PROCESSED WITH COST COST DAYS LOSTREPORTED
10

STATE
EVENT OR EXPOSURE 20,693 100.0% 39,948 100.0% 28,086 100.0% $270,719,658 100.0% 1,026,696 100.0%
Struck Against 1,643 7.9 2,540 6.4 1,765 6.3 7,440,926 2.8 29,148 2.8
Struck By 3,034 14.7 4,937 12.4 3,543 12.6 18,829,882 7.0 69,741 6.8
Caught In, Under, or Between 720 3.5 1,139 2.9 800 2.9 4,473,366 1.7 14,595 1.4
Rubbed or Abraded 263 1.3 377 0.9 252 0.9 806,628 0.3 464 0.1
Other Contact with Object, Equipment 454 2.2 649 1.6 442 1.6 1,484,183 0.6 5,830 0.6
Falls (From Elevation) 948 4.6 2,164 5.4 1,714 6.1 25,286,344 9.3 76,780 7.5
Falls (To Same Level) 2,349 11.4 4,924 12.3 3,591 12.8 38,267,247 14.1 145,934 14.2
Falls (Other) 129 0.6 266 0.7 194 0.7 2,025,292 0.8 8,373 0.8
Bodily Reaction 1,731 8.4 3,651 9.1 2,632 9.4 28,120,055 10.4 108,358 10.6
Overexertion 4,718 22.8 10,011 25.1 7,475 26.6 86,586,990 32.0 377,816 36.8
Repetitive Motion 331 1.6 882 2.2 521 1.9 6,090,618 2.3 25,476 2.5
Heart Attacks and Strokes 33 0.2 74 0.2 22 0.1 442,179 0.2 531 0.1
Contact (Electrical) 49 0.2 87 0.2 57 0.2 1,062,738 0.4 3,387 0.3
Contact (Temperature Extremes) 472 2.3 670 1.7 463 1.7 1,517,770 0.6 3,691 0.4
Exposure (Noise) 15 0.1 62 0.2 30 0.1 266,151 0.1 440 0.0
Exposure (Harmful Substance) 1,462 7.1 2,412 6.0 1,106 3.9 4,506,504 1.7 24,230 2.4
Accidents (Highway Vehicle) 457 2.2 1,147 2.9 896 3.2 12,269,838 4.5 39,979 3.9
Accidents (Non-Highway Vehicle) 139 0.7 307 0.8 241 0.9 3,206,845 1.2 12,220 1.2
Accidents (Other Transportation) 198 1.0 440 1.1 343 1.2 7,418,797 2.7 18,412 1.8
Explosions 26 0.1 55 0.1 46 0.2 654,920 0.2 1,258 0.1
Assaults, Violent Acts 1,044 5.1 2,011 5.0 1,315 4.7 9,868,873 3.7 43,526 4.2
Other Events/Exposures 85 0.4 228 0.6 126 0.5 2,029,455 0.8 1,592 0.2
Nonclassifiable 393 1.9 915 2.3 512 1.8 8,064,057 3.0 14,915 1.5
NATURE OF INJURY OR ILLNESS 20,693 100.0% 39,948 100.0% 28,086 100.0% $270,719,658 100.0% 1,026,696 100.0%
Traumatic Injuries 2,287 11.1 4,461 11.2 3,169 11.3 36,347,230 13.4 138,498 13.5
Fracture 646 3.1 1,574 3.9 1,255 4.5 18,611,304 6.9 58,312 5.7
Sprains, Strains 5,179 25.0 10,842 27.1 8,082 28.8 91,724,695 33.9 376,445 36.7
Cut, Laceration 2,734 13.2 3,964 9.9 2,844 10.1 8,128,680 3.0 25,020 2.4
Puncture, Excluding Bites 548 2.7 813 2.0 547 2.0 1,212,782 0.5 2,796 0.3
Abrasions, Scratches 336 1.6 528 1.3 331 1.2 1,744,974 0.6 7,814 0.8
Bruises, Contusions 1,720 8.3 2,887 7.2 1,992 7.1 13,572,004 5.0 51,283 5.0
Foreign Bodies 233 1.1 316 0.8 212 0.8 146,905 0.1 155 0.0
Heat Burns 453 2.2 650 1.6 465 1.7 1,961,634 0.7 4,637 0.5
Multiple Injuries/Disorders 624 3.0 1,330 3.3 1,011 3.6 10,793,244 4.0 33,087 3.2
Back Pain 901 4.4 1,996 5.0 1,486 5.3 17,280,947 6.4 72,588 7.1
Pain, Excluding Back 2,072 10.0 4,429 11.1 3,144 11.2 30,319,812 11.2 127,911 12.5
Carpal Tunnel 60 0.3 169 0.4 82 0.3 967,841 0.4 4,031 0.4
Musculoskeletal 115 0.6 292 0.7 193 0.7 1,735,379 0.6 8,963 0.9
Skin Disorders 100 0.5 170 0.4 90 0.3 220,135 0.1 1,026 0.1
Symptoms 291 1.4 476 1.2 170 0.6 1,006,227 0.4 3,556 0.4
Mental Disorders 314 1.5 825 2.1 290 1.0 3,835,147 1.4 21,191 2.1
Exposure 314 1.5 375 0.9 98 0.4 106,606 0.0 457 0.0
Other Injuries/Illnesses 1,725 8.3 3,521 8.8 2,354 8.4 25,196,980 9.3 85,291 8.3
Nonclassifiable 41 0.2 330 0.8 271 1.0 5,807,132 2.2 3,635 0.4
AGE 20,693 100.0% 39,948 100.0% 28,086 100.0% $270,719,658 100.0% 1,026,696 100.0%
Under 18 56 0.3 77 0.2 55 0.2 303,674 0.1 856 0.1
18-24 2,233 10.8 3,265 8.2 2,205 7.9 8,492,294 3.1 37,239 3.6
25-34 4,544 22.0 7,608 19.0 5,258 18.7 38,806,776 14.3 155,591 15.2
35-44 4,386 21.2 8,804 22.0 6,330 22.5 70,813,904 26.2 243,133 23.7
45-54 4,844 23.4 10,780 27.0 7,570 27.0 82,721,126 30.6 326,049 31.8
55-64 3,689 17.8 7,644 19.1 5,426 19.3 57,000,338 21.1 213,136 20.8
Over 64 903 4.4 1,658 4.2 1,165 4.2 10,838,916 4.0 47,397 4.6
Information Not Available 38 0.2 112 0.3 77 0.3 1,742,630 0.6 3,295 0.3
Notes: Cost and percent totals may not add due to rounding.
2014 HAWAI‘I WORKERS' COMPENSATION STATISTICS
REPORTED PROCESSED WITH COST COST DAYS LOST
11
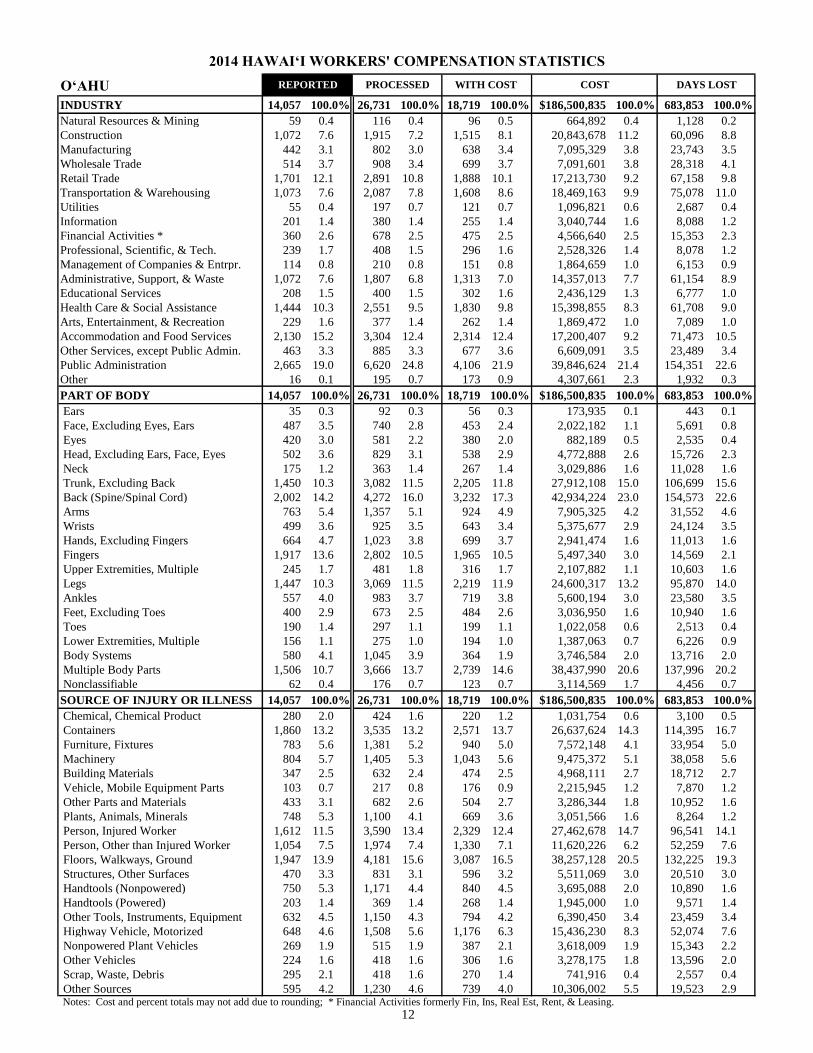
O‘AHU
INDUSTRY 14,057 100.0% 26,731 100.0% 18,719 100.0% $186,500,835 100.0% 683,853 100.0%
Natural Resources & Mining 59 0.4 116 0.4 96 0.5 664,892 0.4 1,128 0.2
Construction 1,072 7.6 1,915 7.2 1,515 8.1 20,843,678 11.2 60,096 8.8
Manufacturing 442 3.1 802 3.0 638 3.4 7,095,329 3.8 23,743 3.5
Wholesale Trade 514 3.7 908 3.4 699 3.7 7,091,601 3.8 28,318 4.1
Retail Trade 1,701 12.1 2,891 10.8 1,888 10.1 17,213,730 9.2 67,158 9.8
Transportation & Warehousing 1,073 7.6 2,087 7.8 1,608 8.6 18,469,163 9.9 75,078 11.0
Utilities 55 0.4 197 0.7 121 0.7 1,096,821 0.6 2,687 0.4
Information 201 1.4 380 1.4 255 1.4 3,040,744 1.6 8,088 1.2
Financial Activities * 360 2.6 678 2.5 475 2.5 4,566,640 2.5 15,353 2.3
Professional, Scientific, & Tech. 239 1.7 408 1.5 296 1.6 2,528,326 1.4 8,078 1.2
Management of Companies & Entrpr. 114 0.8 210 0.8 151 0.8 1,864,659 1.0 6,153 0.9
Administrative, Support, & Waste 1,072 7.6 1,807 6.8 1,313 7.0 14,357,013 7.7 61,154 8.9
Educational Services 208 1.5 400 1.5 302 1.6 2,436,129 1.3 6,777 1.0
Health Care & Social Assistance 1,444 10.3 2,551 9.5 1,830 9.8 15,398,855 8.3 61,708 9.0
Arts, Entertainment, & Recreation 229 1.6 377 1.4 262 1.4 1,869,472 1.0 7,089 1.0
Accommodation and Food Services 2,130 15.2 3,304 12.4 2,314 12.4 17,200,407 9.2 71,473 10.5
Other Services, except Public Admin. 463 3.3 885 3.3 677 3.6 6,609,091 3.5 23,489 3.4
Public Administration 2,665 19.0 6,620 24.8 4,106 21.9 39,846,624 21.4 154,351 22.6
Other 16 0.1 195 0.7 173 0.9 4,307,661 2.3 1,932 0.3
PART OF BODY 14,057 100.0% 26,731 100.0% 18,719 100.0% $186,500,835 100.0% 683,853 100.0%
Ears 35 0.3 92 0.3 56 0.3 173,935 0.1 443 0.1
Face, Excluding Eyes, Ears 487 3.5 740 2.8 453 2.4 2,022,182 1.1 5,691 0.8
Eyes 420 3.0 581 2.2 380 2.0 882,189 0.5 2,535 0.4
Head, Excluding Ears, Face, Eyes 502 3.6 829 3.1 538 2.9 4,772,888 2.6 15,726 2.3
Neck 175 1.2 363 1.4 267 1.4 3,029,886 1.6 11,028 1.6
Trunk, Excluding Back 1,450 10.3 3,082 11.5 2,205 11.8 27,912,108 15.0 106,699 15.6
Back (Spine/Spinal Cord) 2,002 14.2 4,272 16.0 3,232 17.3 42,934,224 23.0 154,573 22.6
Arms 763 5.4 1,357 5.1 924 4.9 7,905,325 4.2 31,552 4.6
Wrists 499 3.6 925 3.5 643 3.4 5,375,677 2.9 24,124 3.5
Hands, Excluding Fingers 664 4.7 1,023 3.8 699 3.7 2,941,474 1.6 11,013 1.6
Fingers 1,917 13.6 2,802 10.5 1,965 10.5 5,497,340 3.0 14,569 2.1
Upper Extremities, Multiple 245 1.7 481 1.8 316 1.7 2,107,882 1.1 10,603 1.6
Legs 1,447 10.3 3,069 11.5 2,219 11.9 24,600,317 13.2 95,870 14.0
Ankles 557 4.0 983 3.7 719 3.8 5,600,194 3.0 23,580 3.5
Feet, Excluding Toes 400 2.9 673 2.5 484 2.6 3,036,950 1.6 10,940 1.6
Toes 190 1.4 297 1.1 199 1.1 1,022,058 0.6 2,513 0.4
Lower Extremities, Multiple 156 1.1 275 1.0 194 1.0 1,387,063 0.7 6,226 0.9
Body Systems 580 4.1 1,045 3.9 364 1.9 3,746,584 2.0 13,716 2.0
Multiple Body Parts 1,506 10.7 3,666 13.7 2,739 14.6 38,437,990 20.6 137,996 20.2
Nonclassifiable 62 0.4 176 0.7 123 0.7 3,114,569 1.7 4,456 0.7
SOURCE OF INJURY OR ILLNESS 14,057 100.0% 26,731 100.0% 18,719 100.0% $186,500,835 100.0% 683,853 100.0%
Chemical, Chemical Product 280 2.0 424 1.6 220 1.2 1,031,754 0.6 3,100 0.5
Containers 1,860 13.2 3,535 13.2 2,571 13.7 26,637,624 14.3 114,395 16.7
Furniture, Fixtures 783 5.6 1,381 5.2 940 5.0 7,572,148 4.1 33,954 5.0
Machinery 804 5.7 1,405 5.3 1,043 5.6 9,475,372 5.1 38,058 5.6
Building Materials 347 2.5 632 2.4 474 2.5 4,968,111 2.7 18,712 2.7
Vehicle, Mobile Equipment Parts 103 0.7 217 0.8 176 0.9 2,215,945 1.2 7,870 1.2
Other Parts and Materials 433 3.1 682 2.6 504 2.7 3,286,344 1.8 10,952 1.6
Plants, Animals, Minerals 748 5.3 1,100 4.1 669 3.6 3,051,566 1.6 8,264 1.2
Person, Injured Worker 1,612 11.5 3,590 13.4 2,329 12.4 27,462,678 14.7 96,541 14.1
Person, Other than Injured Worker 1,054 7.5 1,974 7.4 1,330 7.1 11,620,226 6.2 52,259 7.6
Floors, Walkways, Ground 1,947 13.9 4,181 15.6 3,087 16.5 38,257,128 20.5 132,225 19.3
Structures, Other Surfaces 470 3.3 831 3.1 596 3.2 5,511,069 3.0 20,510 3.0
Handtools (Nonpowered) 750 5.3 1,171 4.4 840 4.5 3,695,088 2.0 10,890 1.6
Handtools (Powered) 203 1.4 369 1.4 268 1.4 1,945,000 1.0 9,571 1.4
Other Tools, Instruments, Equipment 632 4.5 1,150 4.3 794 4.2 6,390,450 3.4 23,459 3.4
Highway Vehicle, Motorized 648 4.6 1,508 5.6 1,176 6.3 15,436,230 8.3 52,074 7.6
Nonpowered Plant Vehicles 269 1.9 515 1.9 387 2.1 3,618,009 1.9 15,343 2.2
Other Vehicles 224 1.6 418 1.6 306 1.6 3,278,175 1.8 13,596 2.0
Scrap, Waste, Debris 295 2.1 418 1.6 270 1.4 741,916 0.4 2,557 0.4
Other Sources 595 4.2 1,230 4.6 739 4.0 10,306,002 5.5 19,523 2.9 Notes: Cost and percent totals may not add due to rounding; * Financial Activities formerly Fin, Ins, Real Est, Rent, & Leasing.
2014 HAWAI‘I WORKERS' COMPENSATION STATISTICS
REPORTED PROCESSED WITH COST COST DAYS LOST
12

O‘AHU
OCCUPATION 14,057 100.0% 26,731 100.0% 18,719 100.0% $186,500,835 100.0% 683,853 100.0%
Executive, Admin. & Managerial 504 3.6 981 3.7 687 3.7 6,744,875 3.6 14,571 2.1
Professional Specialty 1,212 8.6 2,452 9.2 1,565 8.4 12,389,194 6.6 38,857 5.7
Technical Support 328 2.3 630 2.4 421 2.3 4,139,741 2.2 15,354 2.3
Sales 920 6.5 1,643 6.2 1,048 5.6 9,573,984 5.1 35,356 5.2
Administrative Support 779 5.5 1,776 6.6 1,125 6.0 9,363,508 5.0 38,390 5.6
Services 4,657 33.1 8,510 31.8 5,761 30.8 51,195,347 27.5 213,367 31.2
Agricultural, Forestry & Fishing 539 3.8 1,000 3.7 757 4.0 6,894,547 3.7 29,006 4.2
Mechanic, Repairer 952 6.8 1,753 6.6 1,322 7.1 13,557,098 7.3 42,951 6.3
Construction Trades 776 5.5 1,593 6.0 1,234 6.6 16,842,568 9.0 46,625 6.8
Precision Production 226 1.6 432 1.6 326 1.7 3,060,570 1.6 13,288 1.9
Operator, Fabricator, Inspector 202 1.4 347 1.3 278 1.5 2,206,394 1.2 6,569 1.0
Transportation, Material Moving 1,022 7.3 2,138 8.0 1,684 9.0 21,660,533 11.6 86,421 12.6
Handler, Helper, Laborer 1,776 12.6 3,109 11.6 2,259 12.1 24,475,813 13.1 98,386 14.4
Nonclassifiable 164 1.2 367 1.4 252 1.4 4,396,663 2.4 4,712 0.7
NATURE OF INJURY OR ILLNESS 14,057 100.0% 26,731 100.0% 18,719 100.0% $186,500,835 100.0% 683,853 100.0%
Traumatic Injuries 1,602 11.4 3,084 11.5 2,164 11.6 23,827,984 12.8 91,517 13.4
Fracture 427 3.0 1,001 3.7 794 4.2 11,852,067 6.4 36,151 5.3
Sprains, Strains 3,511 25.0 7,250 27.1 5,433 29.0 64,917,910 34.8 254,749 37.3
Cut, Laceration 1,833 13.0 2,633 9.9 1,865 10.0 5,417,067 2.9 15,909 2.3
Puncture, Excluding Bites 377 2.7 537 2.0 344 1.8 824,039 0.4 1,544 0.2
Abrasions, Scratches 238 1.7 358 1.3 218 1.2 1,035,786 0.6 3,735 0.6
Bruises, Contusions 1,137 8.1 1,890 7.1 1,309 7.0 9,483,809 5.1 35,495 5.2
Foreign Bodies 139 1.0 178 0.7 119 0.6 88,537 0.1 93 0.0
Heat Burns 299 2.1 426 1.6 303 1.6 1,334,424 0.7 3,076 0.5
Multiple Injuries/Disorders 420 3.0 853 3.2 645 3.5 7,328,349 3.9 21,536 3.2
Back Pain 631 4.5 1,354 5.1 1,015 5.4 11,953,509 6.4 50,609 7.4
Pain, Excluding Back 1,443 10.3 3,124 11.7 2,221 11.9 22,268,819 11.9 90,354 13.2
Carpal Tunnel 49 0.4 124 0.5 61 0.3 754,069 0.4 3,281 0.5
Musculoskeletal 81 0.6 201 0.8 129 0.7 1,025,510 0.6 5,447 0.8
Skin Disorders 80 0.6 124 0.5 66 0.4 186,347 0.1 1,008 0.2
Symptoms 180 1.3 294 1.1 87 0.5 635,456 0.3 1,193 0.2
Mental Disorders 166 1.2 443 1.7 168 0.9 2,147,179 1.2 9,075 1.3
Exposure 258 1.8 299 1.1 44 0.2 43,723 0.0 202 0.0
Other Injuries/Illnesses 1,155 8.2 2,316 8.7 1,529 8.2 16,499,465 8.9 55,794 8.2
Nonclassifiable 31 0.2 242 0.9 205 1.1 4,876,786 2.6 3,085 0.5
EVENT OR EXPOSURE 14,057 100.0% 26,731 100.0% 18,719 100.0% $186,500,835 100.0% 683,853 100.0%
Struck Against 1,118 8.0 1,714 6.4 1,164 6.2 5,406,030 2.9 18,836 2.8
Struck By 2,043 14.5 3,261 12.2 2,316 12.4 12,177,180 6.5 43,938 6.4
Caught In, Under, or Between 487 3.5 739 2.8 519 2.8 2,975,904 1.6 9,627 1.4
Rubbed or Abraded 159 1.1 216 0.8 145 0.8 718,669 0.4 257 0.0
Other Contact with Object, Equip. 308 2.2 425 1.6 280 1.5 1,013,976 0.5 4,163 0.6
Falls (From Elevation) 641 4.6 1,433 5.4 1,132 6.1 16,562,167 8.9 47,614 7.0
Falls (To Same Level) 1,580 11.2 3,273 12.2 2,370 12.7 26,233,043 14.1 96,436 14.1
Falls (Other) 84 0.6 179 0.7 124 0.7 1,029,109 0.6 4,628 0.7
Bodily Reaction 1,170 8.3 2,453 9.2 1,774 9.5 20,402,449 10.9 71,297 10.4
Overexertion 3,223 22.9 6,795 25.4 5,106 27.3 61,542,061 33.0 260,889 38.2
Repetitive Motion 232 1.7 614 2.3 358 1.9 4,223,195 2.3 17,198 2.5
Heart Attacks and Strokes 25 0.2 55 0.2 15 0.1 311,692 0.2 531 0.1
Contact (Electrical) 31 0.2 55 0.2 37 0.2 449,679 0.2 2,525 0.4
Contact (Temperature Extremes) 318 2.3 448 1.7 307 1.6 1,214,992 0.7 2,626 0.4
Exposure (Noise) 8 0.1 41 0.2 20 0.1 135,973 0.1 365 0.1
Exposure (Harmful Substance) 949 6.8 1,503 5.6 650 3.5 2,529,325 1.4 10,162 1.5
Accidents (Highway Vehicle) 329 2.3 833 3.1 653 3.5 9,282,540 5.0 30,050 4.4
Accidents (Non-Highway Vehicle) 81 0.6 160 0.6 127 0.7 1,449,808 0.8 7,033 1.0
Accidents (Other Transportation) 138 1.0 306 1.1 237 1.3 4,058,837 2.2 13,569 2.0
Explosions 12 0.1 29 0.1 24 0.1 390,685 0.2 656 0.1
Assaults, Violent Acts 783 5.6 1,429 5.4 942 5.0 7,016,494 3.8 30,596 4.5
Other Events/Exposures 55 0.4 150 0.6 80 0.4 1,382,742 0.7 989 0.1
Nonclassifiable 283 2.0 620 2.3 339 1.8 5,994,285 3.2 9,868 1.4 Note: Cost and percent totals may not add due to rounding.
2014 HAWAI‘I WORKERS' COMPENSATION STATISTICS
REPORTED PROCESSED WITH COST COST DAYS LOST
13

MAUI
INDUSTRY 3,009 100.0% 5,583 100.0% 3,943 100.0% $34,788,807 100.0% 121,764 100.0%
Natural Resources & Mining 93 3.1 178 3.2 113 2.9 859,971 2.5 1,765 1.5
Construction 190 6.3 353 6.3 295 7.5 4,250,784 12.2 13,837 11.4
Manufacturing 23 0.8 57 1.0 52 1.3 719,397 2.1 1,992 1.6
Wholesale Trade 86 2.9 130 2.3 92 2.3 593,535 1.7 1,354 1.1
Retail Trade 328 10.9 573 10.3 365 9.3 2,951,869 8.5 10,191 8.4
Transportation & Warehousing 165 5.5 278 5.0 207 5.3 1,910,841 5.5 9,362 7.7
Utilities 12 0.4 41 0.7 24 0.6 353,882 1.0 404 0.3
Information 19 0.6 36 0.6 22 0.6 141,938 0.4 54 0.0
Financial Activities * 110 3.7 204 3.7 143 3.6 1,369,162 3.9 7,342 6.0
Professional, Scientific, & Tech. 24 0.8 46 0.8 42 1.1 748,724 2.2 831 0.7
Management of Companies & Entrpr. 12 0.4 21 0.4 15 0.4 274,636 0.8 469 0.4
Administrative, Support, & Waste 327 10.9 533 9.6 402 10.2 4,150,855 11.9 17,624 14.5
Educational Services 26 0.9 59 1.1 46 1.2 577,152 1.7 1,026 0.8
Health Care & Social Assistance 172 5.7 310 5.6 221 5.6 1,532,828 4.4 6,746 5.5
Arts, Entertainment, & Recreation 36 1.2 68 1.2 53 1.3 403,532 1.2 679 0.6
Accommodation and Food Services 833 27.7 1,284 23.0 963 24.4 5,337,129 15.3 17,988 14.8
Other Services, except Public Admin. 78 2.6 149 2.7 110 2.8 816,406 2.4 3,529 2.9
Public Administration 472 15.7 1,224 21.9 745 18.9 7,078,784 20.4 26,323 21.6
Other 3 0.1 39 0.7 33 0.8 717,382 2.1 248 0.2
PART OF BODY 3,009 100.0% 5,583 100.0% 3,943 100.0% $34,788,807 100.0% 121,764 100.0%
Ears 8 0.3 17 0.3 11 0.3 31,454 0.1 288 0.2
Face, Excluding Eyes, Ears 80 2.7 131 2.4 91 2.3 403,764 1.2 2,287 1.9
Eyes 112 3.7 154 2.8 104 2.6 119,892 0.3 758 0.6
Head, Excluding Ears, Face, Eyes 110 3.7 173 3.1 127 3.2 1,097,953 3.2 3,390 2.8
Neck 41 1.4 83 1.5 56 1.4 597,458 1.7 2,213 1.8
Trunk, Excluding Back 328 10.9 656 11.8 473 12.0 5,623,300 16.2 19,709 16.2
Back (Spine/Spinal Cord) 419 13.9 893 16.0 662 16.8 7,380,170 21.2 28,173 23.1
Arms 157 5.2 282 5.1 199 5.0 1,412,362 4.1 4,394 3.6
Wrists 106 3.5 193 3.5 131 3.3 1,002,030 2.9 4,633 3.8
Hands, Excluding Fingers 118 3.9 194 3.5 138 3.5 395,293 1.1 1,595 1.3
Fingers 433 14.4 632 11.3 448 11.4 847,764 2.4 3,276 2.7
Upper Extremities, Multiple 50 1.7 94 1.7 56 1.4 418,212 1.2 2,829 2.3
Legs 311 10.3 627 11.2 453 11.5 4,354,644 12.5 14,483 11.9
Ankles 119 4.0 215 3.9 159 4.0 827,086 2.4 3,928 3.2
Feet, Excluding Toes 86 2.9 155 2.8 120 3.0 683,303 2.0 2,574 2.1
Toes 38 1.3 54 1.0 39 1.0 80,204 0.2 601 0.5
Lower Extremities, Multiple 45 1.5 69 1.2 54 1.4 293,737 0.8 1,635 1.3
Body Systems 139 4.6 237 4.3 95 2.4 549,139 1.6 2,398 2.0
Multiple Body Parts 305 10.1 709 12.7 517 13.1 6,921,532 19.9 22,023 18.1
Nonclassifiable 4 0.1 15 0.3 10 0.3 1,749,510 5.0 577 0.5
SOURCE OF INJURY OR ILLNESS 3,009 100.0% 5,583 100.0% 3,943 100.0% $34,788,807 100.0% 121,764 100.0%
Chemical, Chemical Product 65 2.2 94 1.7 60 1.5 76,000 0.2 846 0.7
Containers 446 14.8 814 14.6 594 15.1 4,629,639 13.3 17,336 14.2
Furniture, Fixtures 177 5.9 302 5.4 221 5.6 1,638,279 4.7 5,347 4.4
Machinery 196 6.5 336 6.0 243 6.2 1,808,640 5.2 4,757 3.9
Building Materials 68 2.3 125 2.2 103 2.6 1,163,798 3.4 2,997 2.5
Vehicle, Mobile Equipment Parts 21 0.7 43 0.8 33 0.8 275,418 0.8 490 0.4
Other Parts and Materials 60 2.0 112 2.0 87 2.2 1,009,469 2.9 2,286 1.9
Plants, Animals, Minerals 176 5.9 262 4.7 184 4.7 528,852 1.5 2,036 1.7
Person, Injured Worker 383 12.7 774 13.9 479 12.2 4,193,099 12.1 18,359 15.1
Person, Other than Injured Worker 126 4.2 283 5.1 189 4.8 2,050,745 5.9 10,261 8.4
Floors, Walkways, Ground 413 13.7 875 15.7 654 16.6 7,507,091 21.6 24,430 20.1
Structures, Other Surfaces 116 3.9 187 3.4 142 3.6 1,215,523 3.5 4,536 3.7
Handtools (Nonpowered) 171 5.7 269 4.8 182 4.6 521,145 1.5 2,815 2.3
Handtools (Powered) 42 1.4 78 1.4 58 1.5 361,291 1.0 997 0.8
Other Tools, Instruments, Equipment 151 5.0 270 4.8 185 4.7 1,214,474 3.5 7,320 6.0
Highway Vehicle, Motorized 119 4.0 237 4.3 172 4.4 2,221,905 6.4 8,258 6.8
Nonpowered Plant Vehicles 53 1.8 93 1.7 71 1.8 349,734 1.0 1,528 1.3
Other Vehicles 54 1.8 100 1.8 82 2.1 2,757,282 7.9 3,795 3.1
Scrap, Waste, Debris 58 1.9 89 1.6 65 1.7 87,443 0.3 495 0.4
Other Sources 114 3.8 240 4.3 139 3.5 1,178,980 3.4 2,875 2.4 Notes: Cost and percent totals may not add due to rounding. * Financial Activities formerly Fin, Ins, Real Est, Rent, & Leasing.
2014 HAWAI‘I WORKERS' COMPENSATION STATISTICS
REPORTED PROCESSED WITH COST COST DAYS LOST
14

MAUI
OCCUPATION 3,009 100.0% 5,583 100.0% 3,943 100.0% $34,788,807 100.0% 121,764 100.0%
Executive, Admin. & Managerial 94 3.1 214 3.8 147 3.7 1,457,400 4.2 3,450 2.8
Professional Specialty 172 5.7 412 7.4 258 6.5 3,825,742 11.0 6,638 5.5
Technical Support 59 2.0 112 2.0 75 1.9 684,044 2.0 2,398 2.0
Sales 208 6.9 366 6.6 244 6.2 2,355,232 6.8 10,106 8.3
Administrative Support 171 5.7 357 6.4 219 5.6 1,666,972 4.8 6,695 5.5
Services 1,178 39.2 2,025 36.3 1,467 37.2 9,623,159 27.7 39,419 32.4
Agricultural, Forestry & Fishing 162 5.4 336 6.0 224 5.7 1,692,020 4.9 6,403 5.3
Mechanic, Repairer 219 7.3 374 6.7 270 6.8 1,961,979 5.6 6,781 5.6
Construction Trades 154 5.1 321 5.8 263 6.7 3,866,996 11.1 10,935 9.0
Precision Production 30 1.0 70 1.3 47 1.2 230,794 0.7 1,543 1.3
Operator, Fabricator, Inspector 28 0.9 52 0.9 38 1.0 687,793 2.0 1,269 1.0
Transportation, Material Moving 179 6.0 343 6.1 264 6.7 2,681,597 7.7 12,241 10.1
Handler, Helper, Laborer 328 10.9 540 9.7 383 9.7 3,600,449 10.4 13,391 11.0
Nonclassifiable 27 0.9 61 1.1 44 1.1 454,630 1.3 495 0.4
NATURE OF INJURY OR ILLNESS 3,009 100.0% 5,583 100.0% 3,943 100.0% $34,788,807 100.0% 121,764 100.0%
Traumatic Injuries 337 11.2 605 10.8 432 11.0 5,801,964 16.7 16,456 13.5
Fracture 88 2.9 219 3.9 171 4.3 2,956,249 8.5 8,235 6.8
Sprains, Strains 770 25.6 1,562 28.0 1,134 28.8 10,802,387 31.1 45,238 37.2
Cut, Laceration 396 13.2 572 10.3 415 10.5 961,379 2.8 2,889 2.4
Puncture, Excluding Bites 75 2.5 123 2.2 88 2.2 178,811 0.5 370 0.3
Abrasions, Scratches 50 1.7 77 1.4 52 1.3 215,237 0.6 1,073 0.9
Bruises, Contusions 266 8.8 439 7.9 321 8.1 1,740,930 5.0 5,279 4.3
Foreign Bodies 35 1.2 53 1.0 40 1.0 26,321 0.1 50 0.0
Heat Burns 74 2.5 105 1.9 75 1.9 420,319 1.2 745 0.6
Multiple Injuries/Disorders 83 2.8 176 3.2 137 3.5 1,009,110 2.9 2,104 1.7
Back Pain 125 4.2 266 4.8 196 5.0 2,127,833 6.1 8,679 7.1
Pain, Excluding Back 300 10.0 564 10.1 392 9.9 3,722,007 10.7 16,205 13.3
Carpal Tunnel 6 0.2 18 0.3 10 0.3 92,092 0.3 502 0.4
Musculoskeletal 12 0.4 37 0.7 27 0.7 195,174 0.6 839 0.7
Skin Disorders 8 0.3 17 0.3 6 0.2 8,073 0.0 0 0.0
Symptoms 55 1.8 84 1.5 38 1.0 170,151 0.5 771 0.6
Mental Disorders 54 1.8 112 2.0 26 0.7 262,170 0.8 1,401 1.2
Exposure 37 1.2 46 0.8 36 0.9 50,925 0.2 255 0.2
Other Injuries/Illnesses 236 7.8 478 8.6 327 8.3 3,753,577 10.8 10,673 8.8
Nonclassifiable 2 0.1 30 0.5 20 0.5 294,098 0.9 0 0.0
EVENT OR EXPOSURE 3,009 100.0% 5,583 100.0% 3,943 100.0% $34,788,807 100.0% 121,764 100.0%
Struck Against 250 8.3 383 6.9 269 6.8 787,961 2.3 3,904 3.2
Struck By 436 14.5 721 12.9 532 13.5 2,886,977 8.3 9,352 7.7
Caught In, Under, or Between 115 3.8 182 3.3 129 3.3 711,162 2.0 2,149 1.8
Rubbed or Abraded 40 1.3 60 1.1 46 1.2 36,250 0.1 107 0.1
Other Contact with Object, Equip. 65 2.2 85 1.5 63 1.6 98,029 0.3 716 0.6
Falls (From Elevation) 125 4.2 274 4.9 205 5.2 3,062,283 8.8 7,504 6.2
Falls (To Same Level) 357 11.9 710 12.7 533 13.5 4,856,287 14.0 17,943 14.7
Falls (Other) 14 0.5 34 0.6 24 0.6 569,539 1.6 1,610 1.3
Bodily Reaction 273 9.1 531 9.5 379 9.6 3,225,076 9.3 13,716 11.3
Overexertion 697 23.2 1,407 25.2 1,040 26.4 11,024,094 31.7 45,162 37.1
Repetitive Motion 52 1.7 121 2.2 67 1.7 652,744 1.9 3,746 3.1
Heart Attacks and Strokes 4 0.1 10 0.2 5 0.1 106,606 0.3 0 0.0
Contact (Electrical) 6 0.2 13 0.2 10 0.3 379,555 1.1 231 0.2
Contact (Temperature Extremes) 72 2.4 100 1.8 68 1.7 112,623 0.3 373 0.3
Exposure (Noise) 5 0.2 9 0.2 4 0.1 3,893 0.0 0 0.0
Exposure (Harmful Substance) 229 7.6 359 6.4 181 4.6 370,445 1.1 2,871 2.4
Accidents (Highway Vehicle) 48 1.6 104 1.9 80 2.0 831,904 2.4 3,090 2.5
Accidents (Non-Highway Vehicle) 26 0.9 61 1.1 48 1.2 724,153 2.1 1,844 1.5
Accidents (Other Transportation) 29 1.0 59 1.1 43 1.1 2,440,059 7.0 2,357 1.9
Explosions 5 0.2 12 0.2 9 0.2 75,020 0.2 363 0.3
Assaults, Violent Acts 100 3.3 201 3.6 127 3.2 802,585 2.3 3,106 2.6
Other Events/Exposures 12 0.4 26 0.5 16 0.4 343,387 1.0 183 0.2
Nonclassifiable 49 1.6 121 2.2 65 1.6 688,175 2.0 1,437 1.2 Notes: Cost and percent totals may not add due to rounding.
2014 HAWAI‘I WORKERS' COMPENSATION STATISTICS
REPORTED PROCESSED WITH COST COST DAYS LOST
15

HAWAI‘I
INDUSTRY 2,418 100.0% 5,330 100.0% 3,882 100.0% $37,697,700 100.0% 175,622 100.0%
Natural Resources & Mining 70 2.9 135 2.5 99 2.6 1,030,224 2.7 4,998 2.9
Construction 188 7.8 378 7.1 321 8.3 4,430,383 11.8 17,440 9.9
Manufacturing 53 2.2 120 2.3 108 2.8 1,101,312 2.9 4,256 2.4
Wholesale Trade 89 3.7 155 2.9 117 3.0 897,857 2.4 2,777 1.6
Retail Trade 382 15.8 657 12.3 452 11.6 4,223,524 11.2 21,901 12.5
Transportation & Warehousing 108 4.5 243 4.6 192 5.0 2,238,429 5.9 10,348 5.9
Utilities 16 0.7 52 1.0 33 0.9 214,115 0.6 523 0.3
Information 20 0.8 46 0.9 27 0.7 138,855 0.4 1,429 0.8
Financial Activities * 75 3.1 126 2.4 101 2.6 685,494 1.8 3,865 2.2
Professional, Scientific, & Tech. 28 1.2 56 1.1 43 1.1 419,070 1.1 2,875 1.6
Management of Companies & Entrpr. 22 0.9 42 0.8 31 0.8 248,740 0.7 887 0.5
Administrative, Support, & Waste 209 8.6 442 8.3 361 9.3 4,306,012 11.4 21,108 12.0
Educational Services 41 1.7 80 1.5 58 1.5 402,528 1.1 1,363 0.8
Health Care & Social Assistance 203 8.4 411 7.7 291 7.5 2,819,777 7.5 13,279 7.6
Arts, Entertainment, & Recreation 49 2.0 77 1.4 53 1.4 270,470 0.7 1,375 0.8
Accommodation and Food Services 405 16.8 696 13.1 514 13.2 4,066,509 10.8 18,491 10.5
Other Services, except Public Admin. 44 1.8 97 1.8 76 2.0 1,098,819 2.9 4,818 2.7
Public Administration 414 17.1 1,475 27.7 965 24.9 8,537,737 22.7 42,661 24.3
Other 2 0.1 42 0.8 40 1.0 567,845 1.5 1,228 0.7
PART OF BODY 2,418 100.0% 5,330 100.0% 3,882 100.0% $37,697,700 100.0% 175,622 100.0%
Ears 10 0.4 24 0.5 16 0.4 125,401 0.3 25 0.0
Face, Excluding Eyes, Ears 79 3.3 135 2.5 93 2.4 552,884 1.5 2,185 1.2
Eyes 86 3.6 127 2.4 76 2.0 112,823 0.3 187 0.1
Head, Excluding Ears, Face, Eyes 77 3.2 156 2.9 114 2.9 1,224,935 3.3 4,764 2.7
Neck 27 1.1 72 1.4 55 1.4 929,789 2.5 3,147 1.8
Trunk, Excluding Back 247 10.2 596 11.2 448 11.5 5,002,360 13.3 22,516 12.8
Back (Spine/Spinal Cord) 324 13.4 861 16.2 656 16.9 8,334,725 22.1 39,578 22.5
Arms 119 4.9 243 4.6 177 4.6 1,225,050 3.3 6,391 3.6
Wrists 78 3.2 168 3.2 127 3.3 1,357,309 3.6 5,843 3.3
Hands, Excluding Fingers 130 5.4 203 3.8 152 3.9 638,936 1.7 3,334 1.9
Fingers 311 12.9 502 9.4 362 9.3 1,065,439 2.8 3,760 2.1
Upper Extremities, Multiple 50 2.1 93 1.7 64 1.7 329,574 0.9 2,719 1.6
Legs 276 11.4 615 11.5 461 11.9 5,194,062 13.8 22,556 12.8
Ankles 110 4.6 202 3.8 156 4.0 1,164,998 3.1 5,080 2.9
Feet, Excluding Toes 64 2.7 129 2.4 95 2.5 930,018 2.5 4,302 2.5
Toes 36 1.5 58 1.1 39 1.0 (108,721) -0.3 371 0.2
Lower Extremities, Multiple 25 1.0 59 1.1 46 1.2 351,455 0.9 1,697 1.0
Body Systems 91 3.8 257 4.8 107 2.8 1,145,171 3.0 8,572 4.9
Multiple Body Parts 267 11.0 788 14.8 608 15.7 7,710,681 20.5 37,319 21.3
Nonclassifiable 11 0.5 42 0.8 30 0.8 410,811 1.1 1,276 0.7
SOURCE OF INJURY OR ILLNESS 2,418 100.0% 5,330 100.0% 3,882 100.0% $37,697,700 100.0% 175,622 100.0%
Chemical, Chemical Product 60 2.5 107 2.0 66 1.7 228,319 0.6 1,365 0.8
Containers 316 13.1 671 12.6 491 12.7 4,814,837 12.8 25,336 14.4
Furniture, Fixtures 128 5.3 258 4.8 186 4.8 1,457,486 3.9 6,741 3.8
Machinery 121 5.0 275 5.2 217 5.6 2,115,622 5.6 11,151 6.4
Building Materials 75 3.1 146 2.7 107 2.8 929,710 2.5 5,465 3.1
Vehicle, Mobile Equipment Parts 22 0.9 49 0.9 35 0.9 360,539 1.0 2,317 1.3
Other Parts and Materials 84 3.5 146 2.7 111 2.9 925,604 2.5 2,934 1.7
Plants, Animals, Minerals 120 5.0 216 4.1 153 3.9 873,301 2.3 3,306 1.9
Person, Injured Worker 278 11.5 762 14.3 497 12.8 5,568,985 14.8 28,540 16.3
Person, Other than Injured Worker 152 6.3 371 7.0 250 6.4 2,449,366 6.5 12,502 7.1
Floors, Walkways, Ground 356 14.7 874 16.4 692 17.8 8,718,368 23.1 40,316 23.0
Structures, Other Surfaces 86 3.6 186 3.5 135 3.5 1,543,972 4.1 6,715 3.8
Handtools (Nonpowered) 145 6.0 243 4.6 183 4.7 582,164 1.5 2,833 1.6
Handtools (Powered) 39 1.6 75 1.4 53 1.4 298,608 0.8 1,324 0.8
Other Tools, Instruments, Equipment 100 4.1 176 3.3 127 3.3 898,574 2.4 4,822 2.8
Highway Vehicle, Motorized 122 5.1 309 5.8 243 6.3 2,761,473 7.3 9,079 5.2
Nonpowered Plant Vehicles 46 1.9 77 1.4 62 1.6 569,869 1.5 3,375 1.9
Other Vehicles 27 1.1 71 1.3 60 1.6 1,032,260 2.7 2,887 1.6
Scrap, Waste, Debris 53 2.2 96 1.8 69 1.8 186,393 0.5 456 0.3
Other Sources 88 3.6 222 4.2 145 3.7 1,382,250 3.7 4,158 2.4 Notes: Cost and percent totals may not add due to rounding; * Financial Activities formerly Fin, Ins, Real Est, Rent, & Leasing.
2014 HAWAI‘I WORKERS' COMPENSATION STATISTICS
REPORTED PROCESSED WITH COST COST DAYS LOST
16

HAWAI‘I
OCCUPATION 2,418 100.0% 5,330 100.0% 3,882 100.0% $37,697,700 100.0% 175,622 100.0%
Executive, Admin. & Managerial 86 3.6 202 3.8 145 3.7 1,722,266 4.6 4,642 2.6
Professional Specialty 156 6.5 416 7.8 301 7.8 2,813,101 7.5 13,406 7.6
Technical Support 57 2.4 112 2.1 69 1.8 465,098 1.2 1,743 1.0
Sales 199 8.2 360 6.8 241 6.2 2,238,023 5.9 11,954 6.8
Administrative Support 131 5.4 355 6.7 238 6.1 1,882,300 5.0 10,832 6.2
Services 759 31.4 1,611 30.2 1,147 29.6 9,675,179 25.7 49,366 28.1
Agricultural, Forestry & Fishing 207 8.6 447 8.4 316 8.1 3,033,818 8.1 14,017 8.0
Mechanic, Repairer 159 6.6 334 6.3 254 6.5 2,318,195 6.2 12,040 6.9
Construction Trades 123 5.1 307 5.8 251 6.5 3,756,942 10.0 15,486 8.8
Precision Production 39 1.6 96 1.8 77 2.0 637,367 1.7 3,215 1.8
Operator, Fabricator, Inspector 36 1.5 67 1.3 56 1.4 338,279 0.9 1,692 1.0
Transportation, Material Moving 140 5.8 338 6.3 270 7.0 3,543,082 9.4 12,528 7.1
Handler, Helper, Laborer 303 12.5 608 11.4 465 12.0 4,659,761 12.4 24,459 13.9
Nonclassifiable 23 1.0 77 1.4 52 1.3 614,289 1.6 242 0.1
NATURE OF INJURY OR ILLNESS 2,418 100.0% 5,330 100.0% 3,882 100.0% $37,697,700 100.0% 175,622 100.0%
Traumatic Injuries 243 10.1 543 10.2 411 10.6 5,139,521 13.6 23,554 13.4
Fracture 97 4.0 261 4.9 216 5.6 2,996,315 8.0 10,113 5.8
Sprains, Strains 619 25.6 1,454 27.3 1,103 28.4 12,296,977 32.6 62,411 35.5
Cut, Laceration 323 13.4 506 9.5 381 9.8 1,280,299 3.4 4,631 2.6
Puncture, Excluding Bites 69 2.9 110 2.1 79 2.0 185,522 0.5 878 0.5
Abrasions, Scratches 30 1.2 61 1.1 41 1.1 461,769 1.2 2,906 1.7
Bruises, Contusions 193 8.0 351 6.6 240 6.2 1,615,055 4.3 7,853 4.5
Foreign Bodies 39 1.6 54 1.0 38 1.0 24,314 0.1 10 0.0
Heat Burns 55 2.3 77 1.4 56 1.4 139,823 0.4 709 0.4
Multiple Injuries/Disorders 88 3.6 231 4.3 181 4.7 1,883,362 5.0 8,794 5.0
Back Pain 99 4.1 284 5.3 211 5.4 2,269,784 6.0 10,071 5.7
Pain, Excluding Back 226 9.4 528 9.9 386 9.9 3,205,284 8.5 16,298 9.3
Carpal Tunnel 2 0.1 20 0.4 10 0.3 120,110 0.3 248 0.1
Musculoskeletal 8 0.3 28 0.5 22 0.6 429,493 1.1 2,013 1.2
Skin Disorders 7 0.3 16 0.3 10 0.3 16,440 0.0 2 0.0
Symptoms 27 1.1 56 1.1 28 0.7 126,573 0.3 1,161 0.7
Mental Disorders 46 1.9 162 3.0 61 1.6 910,137 2.4 7,204 4.1
Exposure 14 0.6 21 0.4 12 0.3 9,738 0.0 0 0.0
Other Injuries/Illnesses 225 9.3 515 9.7 354 9.1 4,029,653 10.7 16,216 9.2
Nonclassifiable 8 0.3 52 1.0 42 1.1 557,531 1.5 550 0.3
EVENT OR EXPOSURE 2,418 100.0% 5,330 100.0% 3,882 100.0% $37,697,700 100.0% 175,622 100.0%
Struck Against 172 7.1 296 5.6 218 5.6 759,701 2.0 4,840 2.8
Struck By 367 15.2 653 12.3 483 12.4 2,919,833 7.8 13,645 7.8
Caught In, Under, or Between 80 3.3 150 2.8 112 2.9 631,618 1.7 2,035 1.2
Rubbed or Abraded 42 1.7 64 1.2 44 1.1 43,034 0.1 98 0.1
Other Contact with Object, Equip. 46 1.9 87 1.6 65 1.7 340,744 0.9 771 0.4
Falls (From Elevation) 126 5.2 333 6.3 285 7.3 4,511,702 12.0 18,023 10.3
Falls (To Same Level) 275 11.4 644 12.1 483 12.4 5,160,924 13.7 25,340 14.4
Falls (Other) 20 0.8 38 0.7 32 0.8 356,735 1.0 1,936 1.1
Bodily Reaction 195 8.1 488 9.2 356 9.2 3,675,665 9.8 18,351 10.5
Overexertion 553 22.9 1,300 24.4 975 25.1 10,498,133 27.9 56,408 32.1
Repetitive Motion 34 1.4 106 2.0 73 1.9 862,405 2.3 3,634 2.1
Heart Attacks and Strokes 2 0.1 6 0.1 2 0.1 23,881 0.1 0 0.0
Contact (Electrical) 8 0.3 13 0.2 8 0.2 64,377 0.2 463 0.3
Contact (Temperature Extremes) 56 2.3 80 1.5 57 1.5 148,375 0.4 578 0.3
Exposure (Noise) 2 0.1 10 0.2 5 0.1 113,285 0.3 75 0.0
Exposure (Harmful Substance) 165 6.8 338 6.3 166 4.3 1,109,252 2.9 7,962 4.5
Accidents (Highway Vehicle) 66 2.7 176 3.3 137 3.5 1,762,576 4.7 5,653 3.2
Accidents (Non-Highway Vehicle) 21 0.9 58 1.1 45 1.2 874,716 2.3 2,721 1.6
Accidents (Other Transportation) 23 1.0 48 0.9 40 1.0 680,067 1.8 1,546 0.9
Explosions 7 0.3 10 0.2 10 0.3 181,253 0.5 239 0.1
Assaults, Violent Acts 113 4.7 276 5.2 184 4.7 1,689,619 4.5 8,204 4.7
Other Events/Exposures 12 0.5 35 0.7 20 0.5 212,749 0.6 399 0.2
Nonclassifiable 33 1.4 121 2.3 82 2.1 1,077,056 2.9 2,701 1.5 Notes: Cost and percent totals may not add due to rounding.
2014 HAWAI‘I WORKERS' COMPENSATION STATISTICS
REPORTED PROCESSED WITH COST COST DAYS LOST
17

KAUA‘I
INDUSTRY 1,209 100.0% 2,304 100.0% 1,542 100.0% $11,732,316 100.0% 45,457 100.0%
Natural Resources & Mining 33 2.7 61 2.7 44 2.9 420,945 3.6 1,698 3.7
Construction 61 5.1 128 5.6 101 6.6 759,895 6.5 2,548 5.6
Manufacturing 11 0.9 22 1.0 19 1.2 345,306 2.9 714 1.6
Wholesale Trade 25 2.1 32 1.4 21 1.4 147,938 1.3 920 2.0
Retail Trade 162 13.4 239 10.4 142 9.2 920,731 7.9 3,890 8.6
Transportation & Warehousing 46 3.8 83 3.6 62 4.0 390,633 3.3 1,543 3.4
Utilities 11 0.9 15 0.7 11 0.7 84,568 0.7 470 1.0
Information 11 0.9 16 0.7 11 0.7 43,269 0.4 92 0.2
Financial Activities * 51 4.2 89 3.9 63 4.1 866,954 7.4 1,867 4.1
Professional, Scientific, & Tech. 7 0.6 18 0.8 15 1.0 190,434 1.6 828 1.8
Management of Companies & Entrpr. 6 0.5 11 0.5 9 0.6 133,010 1.1 621 1.4
Administrative, Support, & Waste 124 10.3 188 8.2 147 9.5 1,097,681 9.4 5,006 11.0
Educational Services 7 0.6 14 0.6 9 0.6 47,796 0.4 (70) -0.2
Health Care & Social Assistance 75 6.2 149 6.5 105 6.8 688,900 5.9 1,526 3.4
Arts, Entertainment, & Recreation 49 4.1 74 3.2 56 3.6 396,764 3.4 974 2.1
Accommodation and Food Services 290 24.0 464 20.1 349 22.6 2,260,675 19.3 8,638 19.0
Other Services, except Public Admin. 39 3.2 58 2.5 44 2.9 257,100 2.2 622 1.4
Public Administration 200 16.5 632 27.4 324 21.0 2,526,537 21.5 13,021 28.6
Other 1 0.1 11 0.5 10 0.7 153,180 1.3 549 1.2
PART OF BODY 1,209 100.0% 2,304 100.0% 1,542 100.0% $11,732,316 100.0% 45,457 100.0%
Ears 5 0.4 12 0.5 7 0.5 15,836 0.1 0 0.0
Face, Excluding Eyes, Ears 34 2.8 56 2.4 37 2.4 101,540 0.9 186 0.4
Eyes 50 4.1 80 3.5 50 3.2 40,464 0.3 224 0.5
Head, Excluding Ears, Face, Eyes 43 3.6 64 2.8 36 2.3 134,966 1.2 284 0.6
Neck 10 0.8 22 1.0 16 1.0 185,929 1.6 476 1.1
Trunk, Excluding Back 118 9.8 275 11.9 182 11.8 1,900,071 16.2 6,506 14.3
Back (Spine/Spinal Cord) 156 12.9 326 14.2 231 15.0 2,425,691 20.7 9,581 21.1
Arms 74 6.1 126 5.5 91 5.9 483,631 4.1 2,777 6.1
Wrists 40 3.3 78 3.4 54 3.5 426,435 3.6 2,511 5.5
Hands, Excluding Fingers 66 5.5 92 4.0 72 4.7 201,455 1.7 643 1.4
Fingers 173 14.3 261 11.3 191 12.4 462,116 3.9 1,037 2.3
Upper Extremities, Multiple 16 1.3 29 1.3 20 1.3 103,215 0.9 729 1.6
Legs 143 11.8 263 11.4 190 12.3 1,550,089 13.2 7,367 16.2
Ankles 33 2.7 75 3.3 45 2.9 202,374 1.7 190 0.4
Feet, Excluding Toes 29 2.4 56 2.4 34 2.2 147,222 1.3 1,195 2.6
Toes 19 1.6 25 1.1 14 0.9 29,703 0.3 173 0.4
Lower Extremities, Multiple 13 1.1 25 1.1 16 1.0 18,339 0.2 20 0.0
Body Systems 80 6.6 164 7.1 58 3.8 788,948 6.7 4,104 9.0
Multiple Body Parts 106 8.8 271 11.8 195 12.7 2,483,026 21.2 7,408 16.3
Nonclassifiable 1 0.1 4 0.2 3 0.2 31,266 0.3 46 0.1
SOURCE OF INJURY OR ILLNESS 1,209 100.0% 2,304 100.0% 1,542 100.0% $11,732,316 100.0% 45,457 100.0%
Chemical, Chemical Product 31 2.6 47 2.0 32 2.1 45,900 0.4 33 0.1
Containers 146 12.1 277 12.0 196 12.7 1,916,031 16.3 5,722 12.6
Furniture, Fixtures 74 6.1 136 5.9 81 5.3 498,410 4.3 2,586 5.7
Machinery 63 5.2 124 5.4 90 5.8 637,090 5.4 2,897 6.4
Building Materials 30 2.5 49 2.1 28 1.8 367,962 3.1 2,728 6.0
Vehicle, Mobile Equipment Parts 5 0.4 13 0.6 10 0.7 47,937 0.4 219 0.5
Other Parts and Materials 34 2.8 48 2.1 31 2.0 177,788 1.5 406 0.9
Plants, Animals, Minerals 81 6.7 141 6.1 99 6.4 648,814 5.5 1,411 3.1
Person, Injured Worker 150 12.4 326 14.2 181 11.7 1,684,160 14.4 8,674 19.1
Person, Other than Injured Worker 56 4.6 121 5.3 63 4.1 366,628 3.1 1,902 4.2
Floors, Walkways, Ground 174 14.4 377 16.4 272 17.6 2,674,797 22.8 8,034 17.7
Structures, Other Surfaces 45 3.7 70 3.0 52 3.4 222,127 1.9 379 0.8
Handtools (Nonpowered) 72 6.0 108 4.7 83 5.4 170,929 1.5 893 2.0
Handtools (Powered) 23 1.9 43 1.9 31 2.0 207,457 1.8 1,061 2.3
Other Tools, Instruments, Equipment 47 3.9 90 3.9 70 4.5 356,744 3.0 1,814 4.0
Highway Vehicle, Motorized 39 3.2 93 4.0 65 4.2 645,733 5.5 2,033 4.5
Nonpowered Plant Vehicles 31 2.6 48 2.1 35 2.3 264,300 2.3 1,524 3.4
Other Vehicles 18 1.5 40 1.7 32 2.1 265,516 2.3 1,048 2.3
Scrap, Waste, Debris 31 2.6 51 2.2 32 2.1 129,807 1.1 1,066 2.4
Other Sources 59 4.9 102 4.4 59 3.8 404,186 3.5 1,027 2.3 Notes: Cost and percent totals may not add due to rounding. * Financial Activities formerly Fin, Ins, Real Est, Rent, & Leasing.
2014 HAWAI‘I WORKERS' COMPENSATION STATISTICS
REPORTED PROCESSED WITH COST COST DAYS LOST
18

KAUA‘I
OCCUPATION 1,209 100.0% 2,304 100.0% 1,542 100.0% $11,732,316 100.0% 45,457 100.0%
Executive, Admin. & Managerial 38 3.1 78 3.4 50 3.2 410,850 3.5 1,035 2.3
Professional Specialty 52 4.3 174 7.6 78 5.1 545,756 4.7 1,125 2.5
Technical Support 25 2.1 45 2.0 32 2.1 171,067 1.5 354 0.8
Sales 94 7.8 131 5.7 74 4.8 566,000 4.8 2,716 6.0
Administrative Support 64 5.3 160 6.9 88 5.7 542,749 4.6 2,580 5.7
Services 419 34.7 798 34.6 556 36.1 3,702,001 31.6 15,488 34.1
Agricultural, Forestry & Fishing 126 10.4 211 9.2 156 10.1 1,374,011 11.7 3,611 7.9
Mechanic, Repairer 113 9.4 187 8.1 136 8.8 1,256,457 10.7 6,298 13.9
Construction Trades 51 4.2 101 4.4 78 5.1 859,694 7.3 2,674 5.9
Precision Production 19 1.6 33 1.4 27 1.8 275,820 2.4 975 2.1
Operator, Fabricator, Inspector 11 0.9 18 0.8 14 0.9 33,881 0.3 21 0.1
Transportation, Material Moving 53 4.4 112 4.9 79 5.1 740,746 6.3 3,134 6.9
Handler, Helper, Laborer 135 11.2 238 10.3 166 10.8 1,181,229 10.1 5,088 11.2
Nonclassifiable 9 0.7 18 0.8 8 0.5 72,055 0.6 358 0.8
NATURE OF INJURY OR ILLNESS 1,209 100.0% 2,304 100.0% 1,542 100.0% $11,732,316 100.0% 45,457 100.0%
Traumatic Injuries 105 8.7 229 9.9 162 10.5 1,577,761 13.5 6,971 15.3
Fracture 34 2.8 93 4.0 74 4.8 806,674 6.9 3,813 8.4
Sprains, Strains 279 23.1 576 25.0 412 26.7 3,707,421 31.6 14,047 30.9
Cut, Laceration 182 15.1 253 11.0 183 11.9 469,936 4.0 1,591 3.5
Puncture, Excluding Bites 27 2.2 43 1.9 36 2.3 24,410 0.2 4 0.0
Abrasions, Scratches 18 1.5 32 1.4 20 1.3 32,182 0.3 100 0.2
Bruises, Contusions 124 10.3 207 9.0 122 7.9 732,209 6.2 2,656 5.8
Foreign Bodies 20 1.7 31 1.4 15 1.0 7,734 0.1 2 0.0
Heat Burns 25 2.1 42 1.8 31 2.0 67,068 0.6 107 0.2
Multiple Injuries/Disorders 33 2.7 70 3.0 48 3.1 572,423 4.9 653 1.4
Back Pain 46 3.8 92 4.0 64 4.2 929,821 7.9 3,229 7.1
Pain, Excluding Back 103 8.5 213 9.2 145 9.4 1,123,701 9.6 5,054 11.1
Carpal Tunnel 3 0.3 7 0.3 1 0.1 1,569 0.0 0 0.0
Musculoskeletal 14 1.2 26 1.1 15 1.0 85,201 0.7 664 1.5
Skin Disorders 5 0.4 13 0.6 8 0.5 9,274 0.1 16 0.0
Symptoms 29 2.4 42 1.8 17 1.1 74,047 0.6 431 1.0
Mental Disorders 48 4.0 108 4.7 35 2.3 515,662 4.4 3,511 7.7
Exposure 5 0.4 9 0.4 6 0.4 2,220 0.0 0 0.0
Other Injuries/Illnesses 109 9.0 212 9.2 144 9.3 914,286 7.8 2,608 5.7
Nonclassifiable 0 0.0 6 0.3 4 0.3 78,717 0.7 0 0.0
EVENT OR EXPOSURE 1,209 100.0% 2,304 100.0% 1,542 100.0% $11,732,316 100.0% 45,457 100.0%
Struck Against 103 8.5 147 6.4 114 7.4 487,233 4.2 1,568 3.5
Struck By 188 15.6 302 13.1 212 13.8 845,892 7.2 2,806 6.2
Caught In, Under, or Between 38 3.1 68 3.0 40 2.6 154,683 1.3 784 1.7
Rubbed or Abraded 22 1.8 37 1.6 17 1.1 8,674 0.1 2 0.0
Other Contact with Object, Equip. 35 2.9 52 2.3 34 2.2 31,434 0.3 180 0.4
Falls (From Elevation) 56 4.6 124 5.4 92 6.0 1,150,192 9.8 3,639 8.0
Falls (To Same Level) 137 11.3 297 12.9 205 13.3 2,016,992 17.2 6,215 13.7
Falls (Other) 11 0.9 15 0.7 14 0.9 69,908 0.6 199 0.4
Bodily Reaction 93 7.7 179 7.8 123 8.0 816,865 7.0 4,994 11.0
Overexertion 245 20.3 509 22.1 354 23.0 3,522,703 30.0 15,357 33.8
Repetitive Motion 13 1.1 41 1.8 23 1.5 352,275 3.0 898 2.0
Heart Attacks and Strokes 2 0.2 3 0.1 0 0.0 0 0.0 0 0.0
Contact (Electrical) 4 0.3 6 0.3 2 0.1 169,126 1.4 168 0.4
Contact (Temperature Extremes) 26 2.2 42 1.8 31 2.0 41,780 0.4 114 0.3
Exposure (Noise) 0 0.0 2 0.1 1 0.1 13,000 0.1 0 0.0
Exposure (Harmful Substance) 119 9.8 212 9.2 109 7.1 497,482 4.2 3,235 7.1
Accidents (Highway Vehicle) 14 1.2 34 1.5 26 1.7 392,818 3.4 1,186 2.6
Accidents (Non-Highway Vehicle) 11 0.9 28 1.2 21 1.4 158,169 1.4 622 1.4
Accidents (Other Transportation) 8 0.7 27 1.2 23 1.5 239,834 2.0 940 2.1
Explosions 2 0.2 4 0.2 3 0.2 7,962 0.1 0 0.0
Assaults, Violent Acts 48 4.0 105 4.6 62 4.0 360,175 3.1 1,620 3.6
Other Events/Exposures 6 0.5 17 0.7 10 0.7 90,577 0.8 21 0.1
Nonclassifiable 28 2.3 53 2.3 26 1.7 304,542 2.6 909 2.0 Notes: Cost and percent totals may not add due to rounding.
2014 HAWAI‘I WORKERS' COMPENSATION STATISTICS
REPORTED PROCESSED WITH COST COST DAYS LOST
19
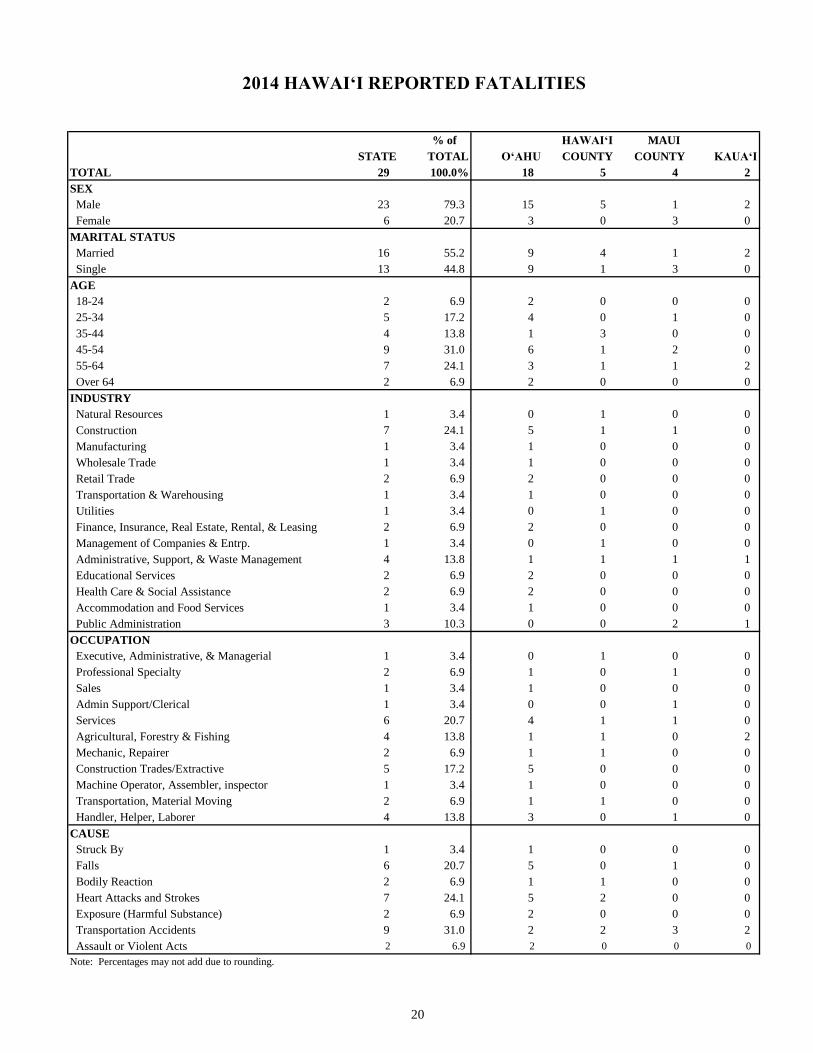
2014 HAWAI‘I REPORTED FATALITIES
% of HAWAI‘I MAUI
STATE TOTAL O‘AHU COUNTY COUNTY KAUA‘I
TOTAL 29 100.0% 18 5 4 2
SEX
Male 23 79.3 15 5 1 2
Female 6 20.7 3 0 3 0
MARITAL STATUS
Married 16 55.2 9 4 1 2
Single 13 44.8 9 1 3 0
AGE
18-24 2 6.9 2 0 0 0
25-34 5 17.2 4 0 1 0
35-44 4 13.8 1 3 0 0
45-54 9 31.0 6 1 2 0
55-64 7 24.1 3 1 1 2
Over 64 2 6.9 2 0 0 0
INDUSTRY
Natural Resources 1 3.4 0 1 0 0
Construction 7 24.1 5 1 1 0
Manufacturing 1 3.4 1 0 0 0
Wholesale Trade 1 3.4 1 0 0 0
Retail Trade 2 6.9 2 0 0 0
Transportation & Warehousing 1 3.4 1 0 0 0
Utilities 1 3.4 0 1 0 0
Finance, Insurance, Real Estate, Rental, & Leasing 2 6.9 2 0 0 0
Management of Companies & Entrp. 1 3.4 0 1 0 0
Administrative, Support, & Waste Management 4 13.8 1 1 1 1
Educational Services 2 6.9 2 0 0 0
Health Care & Social Assistance 2 6.9 2 0 0 0
Accommodation and Food Services 1 3.4 1 0 0 0
Public Administration 3 10.3 0 0 2 1
OCCUPATION
Executive, Administrative, & Managerial 1 3.4 0 1 0 0
Professional Specialty 2 6.9 1 0 1 0
Sales 1 3.4 1 0 0 0
Admin Support/Clerical 1 3.4 0 0 1 0
Services 6 20.7 4 1 1 0
Agricultural, Forestry & Fishing 4 13.8 1 1 0 2
Mechanic, Repairer 2 6.9 1 1 0 0
Construction Trades/Extractive 5 17.2 5 0 0 0
Machine Operator, Assembler, inspector 1 3.4 1 0 0 0
Transportation, Material Moving 2 6.9 1 1 0 0
Handler, Helper, Laborer 4 13.8 3 0 1 0
CAUSE
Struck By 1 3.4 1 0 0 0
Falls 6 20.7 5 0 1 0
Bodily Reaction 2 6.9 1 1 0 0
Heart Attacks and Strokes 7 24.1 5 2 0 0
Exposure (Harmful Substance) 2 6.9 2 0 0 0
Transportation Accidents 9 31.0 2 2 3 2
Assault or Violent Acts 2 6.9 2 0 0 0
Note: Percentages may not add due to rounding.
20

21
2014 HEARINGS AND DECISIONS ISSUED
EAST WEST
STATE O‘AHU HAWAI‘I HAWAI‘I MAUI KAUA‘I
HEARINGS 1,999 1,113 262 118 209 297*
DECISIONS ISSUED 7,455 5,121 745 364 794 431*
Act 59 Settlement 506 317 41 28 92 28
Attorney Fees 1,456 1,039 156 53 163 45
Denial 186 129 19 5 15 18
Disfigurement 746 497 70 59 49 71
Fatality 22 18 0 1 2 1
Medical 688 378 104 33 108 65
Permanent Partial 1,925 1,414 112 109 202 88
Permanent Total 15 13 2 0 0 0
Temporary Partial 8 6 1 0 1 0
Temporary Total 311 203 37 8 27 36
Benefit Adjustments 2 2 0 0 0 0
Other 1,590 1,105 203 68 135 79
* Includes O‘ahu cases conducted by the Kaua‘i hearings officer remotely via the webcam.
WORKERS’ COMPENSATION MAXIMUM WEEKLY WAGE BASE AND
MAXIMUM WEEKLY BENEFIT AMOUNT HISTORY
Year
Maximum
Weekly Wage
Base
Maximum
Weekly Benefit
Amount
Year
Maximum
Weekly Wage
Base
Maximum
Weekly Benefit
Amount
1979 $300.00 $200.00 1997 $751.46 $501.00
1980 $322.50 $215.00 1998 $761.96 $508.00
1981 $352.50 $235.00 1999 $778.46 $519.00
1982 $378.00 $252.00 2000 $793.46 $529.00
1983 $399.00 $266.00 2001 $820.46 $547.00
1984 $421.50 $281.00 2002 $845.96 $564.00
1985 $436.50 $291.00 2003 $869.96 $580.00
1986 $448.50 $299.00 2004 $893.96 $596.00
1987 $477.00 $318.00 2005 $932.95 $622.00
1988 $501.00 $334.00 2006 $980.95 $654.00
1989 $537.00 $358.00 2007 $1,016.95 $678.00
1990 $574.47 $383.00 2008 $1,043.95 $696.00
1991 $617.97 $412.00 2009 $1,087.45 $725.00
1992 $655.47 $437.00 2010 $1,117.44 $745.00
1993 $689.97 $460.00 2011 $1,096.45 $731.00
1994 $721.46 $481.00 2012 $1,120.44 $747.00
1995 $736.46 $491.00 2013 $1,142.94 $762.00
1996 $743.96 $496.00 2014 $1,165.44 $777.00

22
2014 DIGEST OF THE WORKERS' COMPENSATION LAW
Purpose To provide medical, rehabilitation, income, and indemnity benefits to workers suffering work-connected
injuries, or in the event of death, income and indemnity benefits to their dependents.
Coverage All workers except:
Federal government workers. Workers for nonprofit organizations if in voluntary or unpaid capacity.
Students working for a school, college, or university in return for board, lodging, or tuition.
Ordained members of the church. Certain domestic workers.
Certain 25% stockholders of a corporation. Owners with 50% or more of a corporation.
Real estate salespersons or brokers paid solely by commission.
Certain 50% distributional interest members of a limited liability company. Certain 50% partners of a limited liability partnership.
Partners of a partnership.
Sole Proprietors.
Eligibility Requirements for Benefits Employee suffering personal injury by accident arising out of and in the course of employment, or by disease
proximately caused by or resulting from the nature of the employment.
Disqualification from Benefits Injury incurred by willful self-infliction or to another by actively engaging in any unprovoked non-work
related physical altercation other than in self-defense or by intoxication.
Mental stress claims resulting solely from disciplinary action taken in good faith by employer.
Waiting Period Three days.
Weekly Benefits 66-2/3% of the worker's average weekly wages for permanent total, partial, and temporary total disabilities.
66-2/3% of difference of wages before and after injury for temporary partial disability.
Benefit Provisions - 2014 Minimum weekly benefits - $194.00
Maximum weekly benefits - $777.00
Maximum weekly amount used to compute weekly benefits for surviving spouse - $1,165.44 Funeral expenses - $7,770.00
Burial expenses - $3,885.00
Duration Medical - as reasonably needed or as the nature or injury requires. Death - various duration for beneficiaries.
Temporary total disability - duration of the disability. Permanent total disability - for life.
Appeal Provisions Within 20 days after a decision has been sent to parties concerned.
Statute of Limitation for Filing a Claim Within two years after date of injury in which the effects have manifest and within five years after date of
accident or occurrence of injury.
Employer's Penalties and Fines $250 or $10 for each employee each day for failure to give security for compensation.
Up to $5,000 for refusing or neglecting to give required notice or to make required reports.
20% of unpaid compensation for default in payment.
Method of Insuring Through insurance carriers or approved employer self-financing.
Financing Cost of insurance paid by employer.
Funds Special Compensation Fund
Income: Fines and penalties.
Death benefits where there are no dependents.
Special assessments.
Outgo: To pay benefits to injured employee whose injury occurred prior to 1973 and where the
employer or carrier has paid the maximum aggregate, for concurrent employment benefits
and for preexisting condition benefits. To reimburse employees/employers effective January 1, 1992 and January 1 of every tenth
year thereafter, for the cost of supplemental allowance for permanent total disability
payments to employees injured before January 1, 1992 and January 1 of every tenth year thereafter.
To injured employee or dependents where employer is in default in payment of
compensation. For litigation expense incurred by or on behalf of the Special Compensation Fund.
Solvency: When cash balance falls below an amount determined by the Director to be insufficient to
meet the fund's current and projected obligation, a levy based on a percentage of gross premiums and a special charge against self-insured until cash balance equals or exceeds an
amount determined by the director to be sufficient to meet the fund's current and projected
obligations.

23
DEFINITIONS
Attendant Services Cost of services of an attendant for a totally disabled employee.
Average Cost Per Case Total compensation costs divided by the number of processed cases with cost.
Compensation Orders Decisions made on controverted cases, on awarding of permanent partial disability and disfigurement,
and on reopening cases.
Costs All payments accorded to a claimant to include disability, death, disfigurement, vocational
rehabilitation, attendant services, and medical payments.
Days Lost Number of compensated (calendar) days in which injured workers were not able to work because of
temporary total disability. This excludes the three-day waiting period.
Disfigurement Scar, deformity, discoloration, or other disfiguring consequences resulting from the injury or caused
by medical, surgical, and hospital treatment of the employee. This is separate from permanent partial
disability.
Employment That portion of the work force covered by Workers' Compensation law. Annual average taken from
the "Employment and Payrolls in Hawai‘i" report excluding federal government employees.
Event or Exposure Identifies the circumstance, which directly resulted in the injury or illness.
Industry Identifies employers by the major type of activity in which they are engaged.
Medical Physicians and hospital costs and costs for services and supplies.
Nature of Injury or Illness Identifies the injury or illness in terms of its principal physical characteristic.
Occupation Identifies the nature of work of the employee.
Part of Body Identifies the part of the worker's body directly affected by the injury or illness.
Permanent Partial Disability Injury or illness which results in the complete loss or loss of any member or part of the body or any
permanent impairment of functions of the body or part thereof, regardless of any pre-existing
disability.
Permanent Total Disability Any injury or illness other than death, which permanently and totally incapacitates an employee from
following any gainful occupation.
Processed Cases Cases, which have been subject to screening procedures, the injury or illness medically evaluated, and
all medical costs and workers’ compensation payments totaled. Includes injuries and illnesses, which
occurred in the report year or prior years.
Reported Injuries and Illnesses
(Reported Cases)
All injuries and illnesses reported to the Disability Compensation Division. These reported injuries or
illnesses may not have occurred during the report year.
Reported Fatalities Any death resulting from an on-the-job injury or illness reported to the Disability Compensation
Division.
Source of Injury or Illness Identifies the object, substance, exposure, or bodily motion, which directly produced or inflicted the
injury or illness.
Temporary Partial Disability A work injury or illness which causes partial rather than total disability for temporary periods. The
injured worker is paid a weekly benefit amount of 66-2/3 percent of the difference between his
average weekly wages before the injury and his weekly earnings thereafter for the duration of the
disability.
Temporary Total Disability A common type of disability where the work injury or illness causes total disability for temporary
periods. The employer or insurance carrier, for the duration of the disability, but not including the first
three days, pays the injured worker a weekly benefit amount of 66-2/3 percent of his average weekly
wages, but not more than the maximum weekly benefit amount nor less than the minimum weekly
benefit amount, or if his average weekly wages are less than the minimum weekly benefit amount, at a
rate of 100 percent of his average weekly wages.
Vocational Rehabilitation Cost of vocational rehabilitation services.

24
TECHNICAL NOTES
The Workers’ Compensation Data Book is based on the annual accumulation of data in the State of Hawai‘i, Disability
Compensation database.
1. The following coding systems and locally revised versions were used to categorize data:
a) Industrial attachment is determined by the principal activity of the employer as defined in the North
American Industry Classification System 2002 (NAICS). The new NAICS industry groupings better
reflect the workings of the U.S. economy, particularly in the services sector. NAICS, developed using a
production oriented conceptual framework, groups establishments into industries based on the activity in
which they are primarily engaged. It is not an update of the Standard Industrial Classification (SIC) system.
NAICS focuses on how products and services are created. More information on NAICS is available at the
U.S. Census Bureau website at http://www.census.gov/epcd/www/naics.html.
b) Codes and definitions used to categorize Nature of Injury or Illness, Part of Body Affected, Source of Injury
or Illness, and Event or Exposure were modeled after the 1992 Bureau of Labor Statistics (BLS)
Occupational Injury and Illness Classification Structures (OIICS). Starting with 1996 data, BLS OIICS
data codes were locally modified to 2 digits instead of 4 digits, making the data less detailed.
c) Occupational groups are based on the 1990 Alphabetical Index of Industries and Occupations,
developed and published by the Bureau of the Census, Washington, D.C., U.S. Government Printing Office.
Starting with 1996 data, the occupation classifications were locally modified, making the data less detailed.
2. From 1999, the employment data source used in the Worker’s Compensation Data Book has been changed.
Instead of the Labor Force Data Book employment we are using the Employment and Payrolls in Hawai‘i
statistics. Employment data from the later publication may be more in line with workers covered under the
Workers’ Compensation program. Caution should be taken when reviewing the employment and frequency data
for trend analysis prior to 1999.
3. From 2000, the table Hearings and Decisions Issued (previously called Compensation Orders Issued and Number
of Hearings) has changed to include Act 59 settlements and attorney fees. The combined category Permanent
Partial & Disfigurement no longer exists. Figures are reported under the category with the highest severity. For
example: a case with disability payments and disfigurement award would be counted in the disability category
and not in disfigurement.
4. Beginning with the 2002 Workers’ Compensation Data Book, there is a new format for the Industry category.
The North American Industry Classification System (NAICS) is being used to designate the different industries
instead of the Standard Industrial Classification (SIC) system. For trend analysis purposes, the data may not be
comparable.
5. Effective with the 2004 Workers’ Compensation Data Book, the close date to process a “reported case” for the
preceding calendar year was changed from January 31 to December 31 to accommodate the filing of electronic
“WC-1 Employers Report of Industrial Injury”. For trend analysis purposes, the data for 2004 may not be
comparable.
6. From 2014, Financial Activities in the Industry group replaced Finance, Insurance, Real Estate, Rent & Leasing;
Finance, Ins, Real Estate, Rent, & Leasing; and Fin, Ins, Real Est, Rent, & Leasing.

STATE OF HAWAII DEPARTMENT OF LABOR AND INDUSTRIAL RELATIONS RESEARCH AND STATISTICS OFFICE 830 PUNCHBOWL STREET, ROOM 304 HONOLULU, HAWAII 96813