workers’ compensation medical bill review—the …...workers’ compensation medical bill...
TRANSCRIPT
Workers’ Compensation Medical Bill Review—The Untold StoryThe Risk Manager’s Guide to Selecting a Medical Bill Review Vendor
November 2014 • Lockton® Companies
L O C K T O N C O M P A N I E S
KEITH ROSENBLUM MPH, CPCU, ARM, CSP
Senior StrategistWorkers’ Compensation Risk Control
Medical expenses, now averaging well over 60 percent
of average claims’ costs, clearly represent the greatest
impact on an employer’s workers’ compensation total cost
of risk. This average is expected to climb higher as the
decade progresses. Maximizing provider savings through
the medical bill review (MBR) process is seen as a critical
component to any comprehensive claims management
program. (Medical provider discounts versus medical
management outcomes are not addressed in this paper).
Employers, whether engaging in a full Third-Party Administrator (TPA) RFP or expressly in the market for managed care services, will always seek MBR service providers having the largest medical provider savings opportunities for the lowest bill review fees.
If your selection process is comprised of comparing one MBR vendor’s book of business results with another, your results will be deeply flawed. There is an untold story, one you will never hear, about the very complicated process of selecting an MBR provider that every risk manager should become aware.
In workers’ compensation, this may be
one of the best examples of “employers
not knowing what they don’t know” that
may be materially affecting their total
cost of risk.
2
The typical RFP process focuses on a quantitative comparison of vendors’ average MBR savings by state combined with an analysis of a sample set of medical bills. From Lockton’s experience, when it comes to medical bill review, a qualitative versus quantitative comparison is required.
Here’s Why the Current MBR Vendor Selection Process is Flawed
For the very first time, we have proof that when one attempts to compare quantifiable metrics across multiple bill review vendor platforms (software programs) the results will lead to false conclusions.
In 2014, Xerox Corporation, which owns the CompIQ bill review platform, purchased ISG (StrataCare) making Xerox the largest bill review vendor in the marketplace processing well over 20 million bills annually. You can derive a great deal of statistical data from that large of a database. And they have.
One of their first IT projects this year was to compare their two platforms to identify how each respectively identifies savings. What has been known for some time among bill review vendors is that comparing data from platforms is inefficient and largely inaccurate, permitting some vendors to put a spin on their results. But it has never been objectively confirmed. These same vendors have been unable to create an open standard for an effective comparison leaving risk managers with a void in making selection decisions.
What can be defined as savings is far more complicated than it would appear on the surface making vendor comparisons practically impossible from metrics alone without an open standard. While there is no right or wrong definitions of savings, there are significant differences in processes and definitions among the top six bill review vendors.
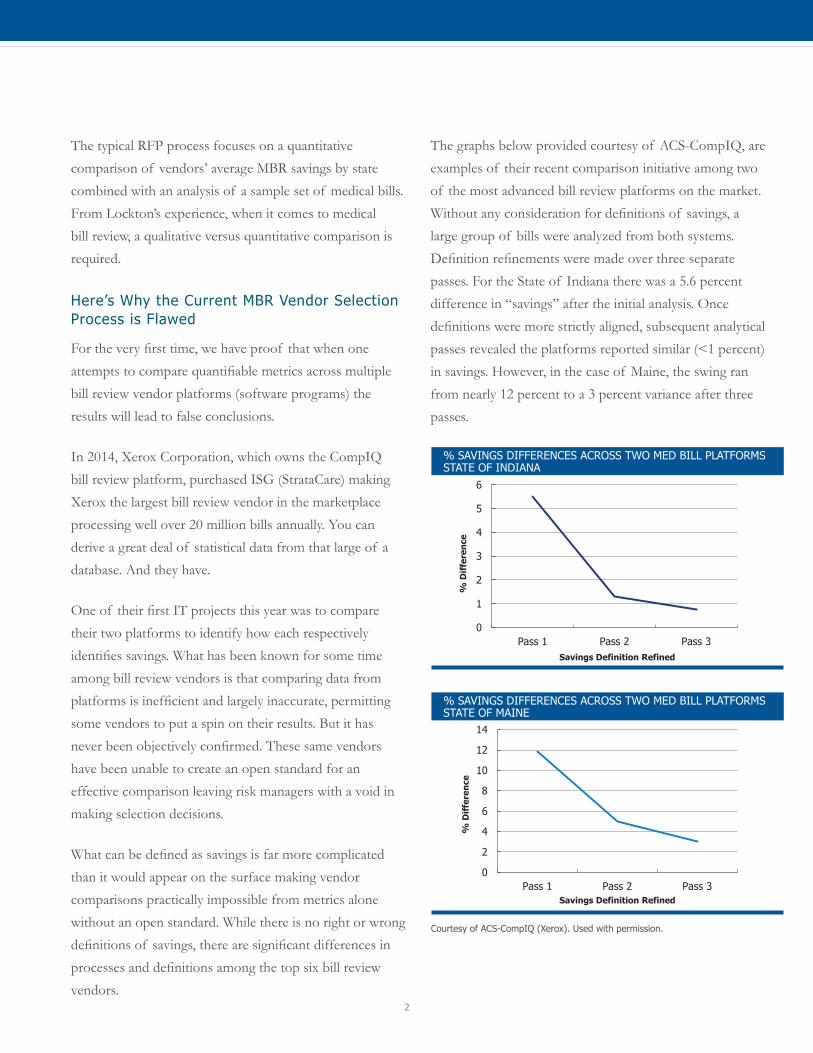
The graphs below provided courtesy of ACS-CompIQ, are examples of their recent comparison initiative among two of the most advanced bill review platforms on the market. Without any consideration for definitions of savings, a large group of bills were analyzed from both systems. Definition refinements were made over three separate passes. For the State of Indiana there was a 5.6 percent difference in “savings” after the initial analysis. Once definitions were more strictly aligned, subsequent analytical passes revealed the platforms reported similar (<1 percent) in savings. However, in the case of Maine, the swing ran from nearly 12 percent to a 3 percent variance after three passes.
% SAVINGS DIFFERENCES ACROSS TWO MED BILL PLATFORMS STATE OF INDIANA
0
1
2
3
4
5
6
Pass 1 Pass 2 Pass 3
% D
iffe
renc
e
Savings Definition Refined
% SAVINGS DIFFERENCES ACROSS TWO MED BILL PLATFORMSSTATE OF MAINE
0
2
4
6
8
10
12
14
Pass 1 Pass 2 Pass 3
% D
iffe
ren
ce
Savings Definition Refined
Courtesy of ACS-CompIQ (Xerox). Used with permission.
November 2014 • Lockton Companies
3
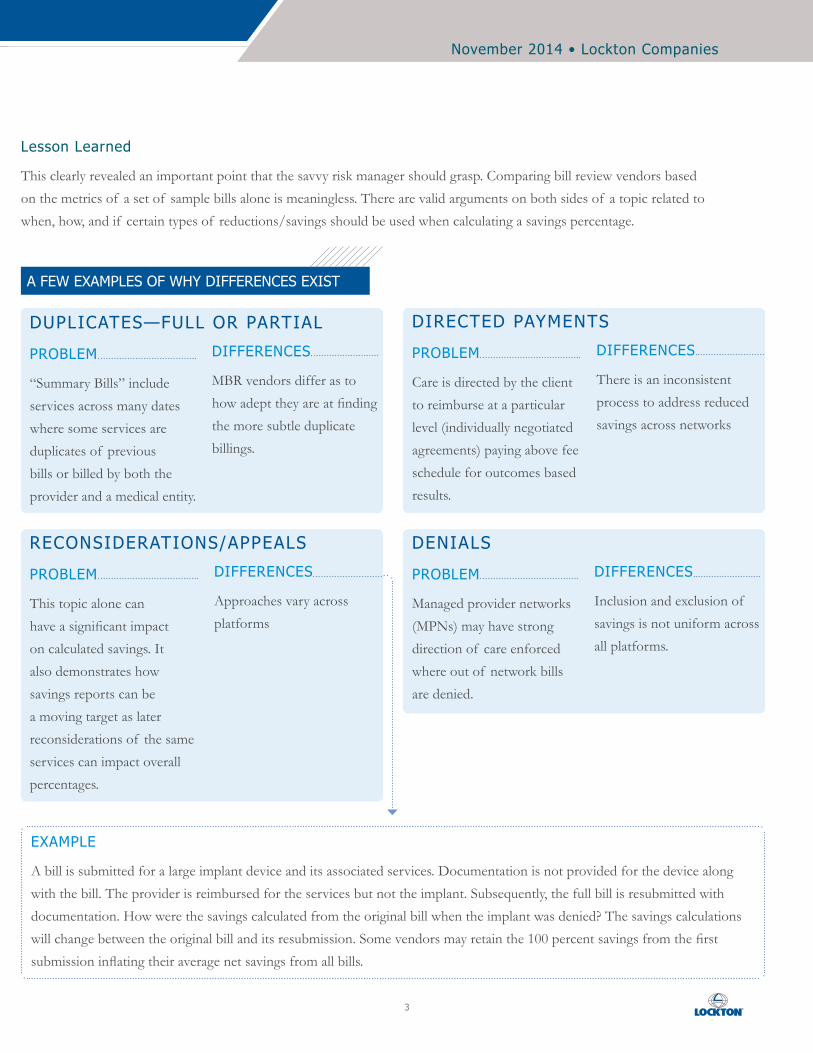
Lesson Learned
This clearly revealed an important point that the savvy risk manager should grasp. Comparing bill review vendors based on the metrics of a set of sample bills alone is meaningless. There are valid arguments on both sides of a topic related to when, how, and if certain types of reductions/savings should be used when calculating a savings percentage.
DUPLICATES—FULL OR PARTIAL
PROBLEM
“Summary Bills” include services across many dates where some services are duplicates of previous bills or billed by both the provider and a medical entity.
DIFFERENCES
MBR vendors differ as to how adept they are at finding the more subtle duplicate billings.
DENIALS
PROBLEM
Managed provider networks (MPNs) may have strong direction of care enforced where out of network bills are denied.
DIFFERENCES
Inclusion and exclusion of savings is not uniform across all platforms.
DIRECTED PAYMENTS
PROBLEM
Care is directed by the client to reimburse at a particular level (individually negotiated agreements) paying above fee schedule for outcomes based results.
DIFFERENCES
There is an inconsistent process to address reduced savings across networks
RECONSIDERATIONS/APPEALS
PROBLEM
This topic alone can have a significant impact on calculated savings. It also demonstrates how savings reports can be a moving target as later reconsiderations of the same services can impact overall percentages.
DIFFERENCES
Approaches vary across platforms
A FEW EXAMPLES OF WHY DIFFERENCES EXIST
EXAMPLE
A bill is submitted for a large implant device and its associated services. Documentation is not provided for the device along with the bill. The provider is reimbursed for the services but not the implant. Subsequently, the full bill is resubmitted with documentation. How were the savings calculated from the original bill when the implant was denied? The savings calculations will change between the original bill and its resubmission. Some vendors may retain the 100 percent savings from the first submission inflating their average net savings from all bills.
4
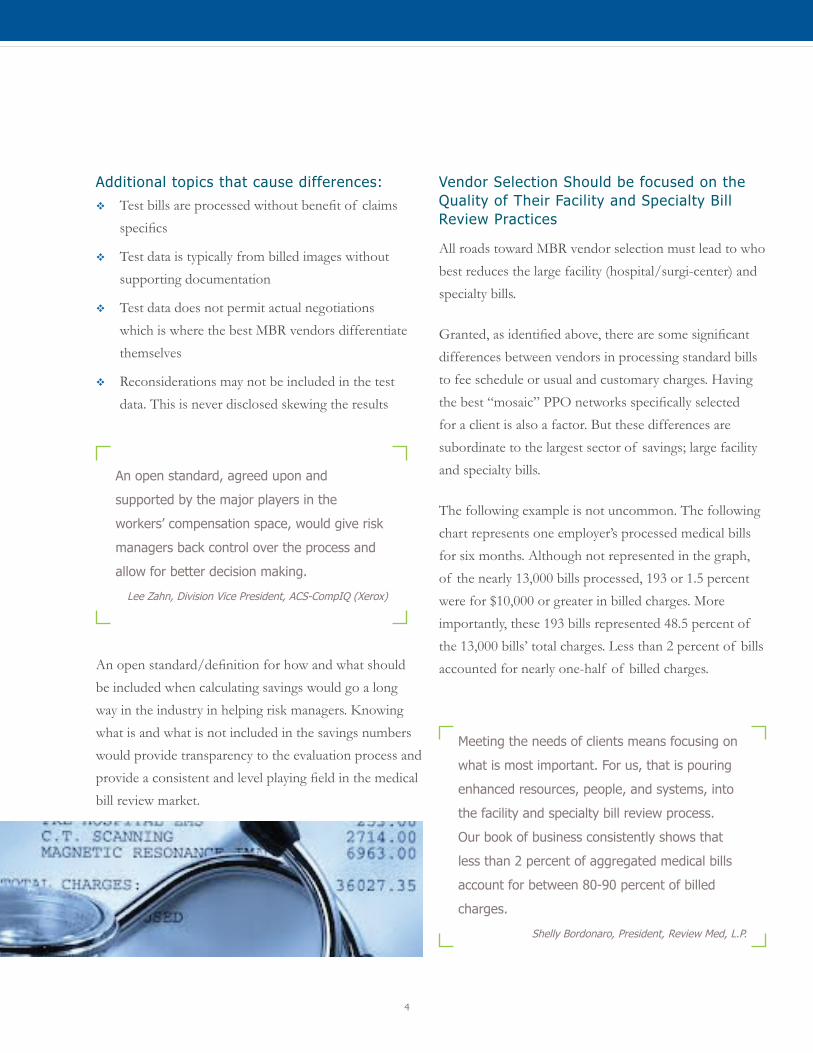
Additional topics that cause differences: � Test bills are processed without benefit of claims
specifics
� Test data is typically from billed images without supporting documentation
� Test data does not permit actual negotiations which is where the best MBR vendors differentiate themselves
� Reconsiderations may not be included in the test data. This is never disclosed skewing the results
An open standard/definition for how and what should be included when calculating savings would go a long way in the industry in helping risk managers. Knowing what is and what is not included in the savings numbers would provide transparency to the evaluation process and provide a consistent and level playing field in the medical bill review market.
Vendor Selection Should be focused on the Quality of Their Facility and Specialty Bill Review Practices
All roads toward MBR vendor selection must lead to who best reduces the large facility (hospital/surgi-center) and specialty bills.
Granted, as identified above, there are some significant differences between vendors in processing standard bills to fee schedule or usual and customary charges. Having the best “mosaic” PPO networks specifically selected for a client is also a factor. But these differences are subordinate to the largest sector of savings; large facility and specialty bills.
The following example is not uncommon. The following chart represents one employer’s processed medical bills for six months. Although not represented in the graph, of the nearly 13,000 bills processed, 193 or 1.5 percent were for $10,000 or greater in billed charges. More importantly, these 193 bills represented 48.5 percent of the 13,000 bills’ total charges. Less than 2 percent of bills accounted for nearly one-half of billed charges.
An open standard, agreed upon and
supported by the major players in the
workers’ compensation space, would give risk
managers back control over the process and
allow for better decision making.
Lee Zahn, Division Vice President, ACS-CompIQ (Xerox)
Meeting the needs of clients means focusing on
what is most important. For us, that is pouring
enhanced resources, people, and systems, into
the facility and specialty bill review process.
Our book of business consistently shows that
less than 2 percent of aggregated medical bills
account for between 80-90 percent of billed
charges.
Shelly Bordonaro, President, Review Med, L.P.
November 2014 • Lockton Companies
5
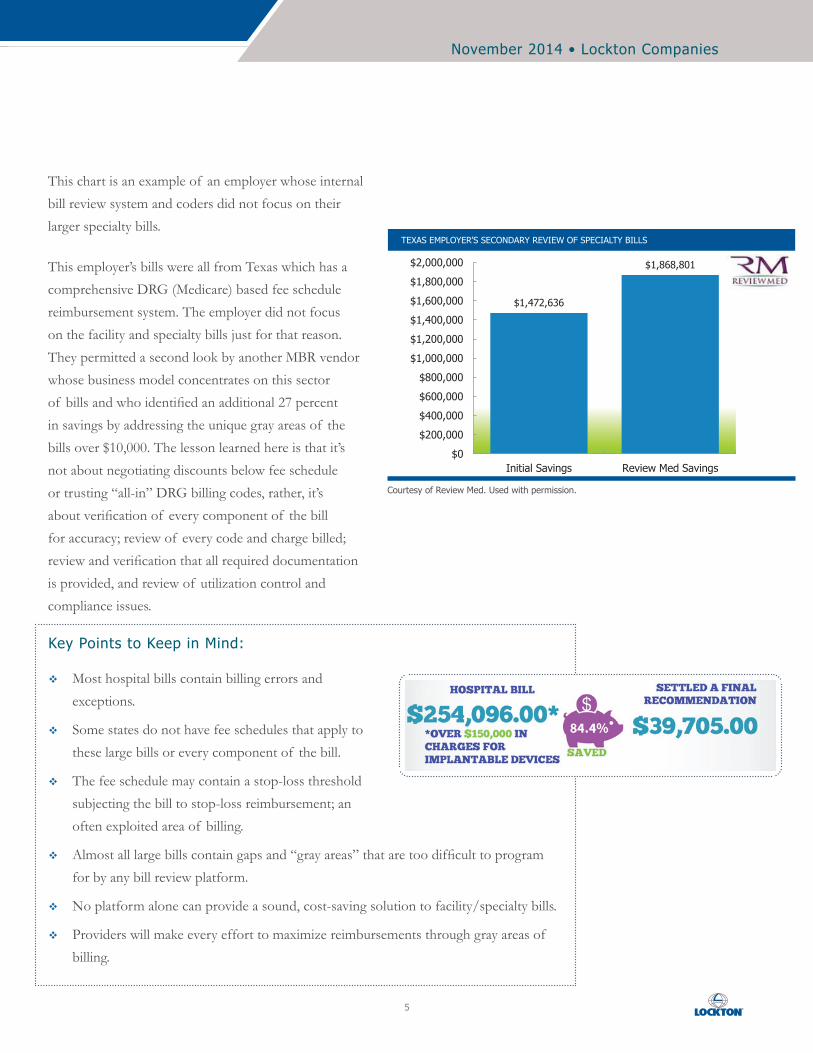
This chart is an example of an employer whose internal bill review system and coders did not focus on their larger specialty bills.
This employer’s bills were all from Texas which has a comprehensive DRG (Medicare) based fee schedule reimbursement system. The employer did not focus on the facility and specialty bills just for that reason. They permitted a second look by another MBR vendor whose business model concentrates on this sector of bills and who identified an additional 27 percent in savings by addressing the unique gray areas of the bills over $10,000. The lesson learned here is that it’s not about negotiating discounts below fee schedule or trusting “all-in” DRG billing codes, rather, it’s about verification of every component of the bill for accuracy; review of every code and charge billed; review and verification that all required documentation is provided, and review of utilization control and compliance issues.
TEXAS EMPLOYER’S SECONDARY REVIEW OF SPECIALTY BILLS
$1,472,636
$1,868,801
$0
$200,000
$400,000
$600,000
$800,000
$1,000,000
$1,200,000
$1,400,000
$1,600,000
$1,800,000
$2,000,000
Initial Savings Review Med Savings
Courtesy of Review Med. Used with permission.
Key Points to Keep in Mind:
� Most hospital bills contain billing errors and exceptions.
� Some states do not have fee schedules that apply to these large bills or every component of the bill.
� The fee schedule may contain a stop-loss threshold subjecting the bill to stop-loss reimbursement; an often exploited area of billing.
� Almost all large bills contain gaps and “gray areas” that are too difficult to program for by any bill review platform.
� No platform alone can provide a sound, cost-saving solution to facility/specialty bills.
� Providers will make every effort to maximize reimbursements through gray areas of billing.
6
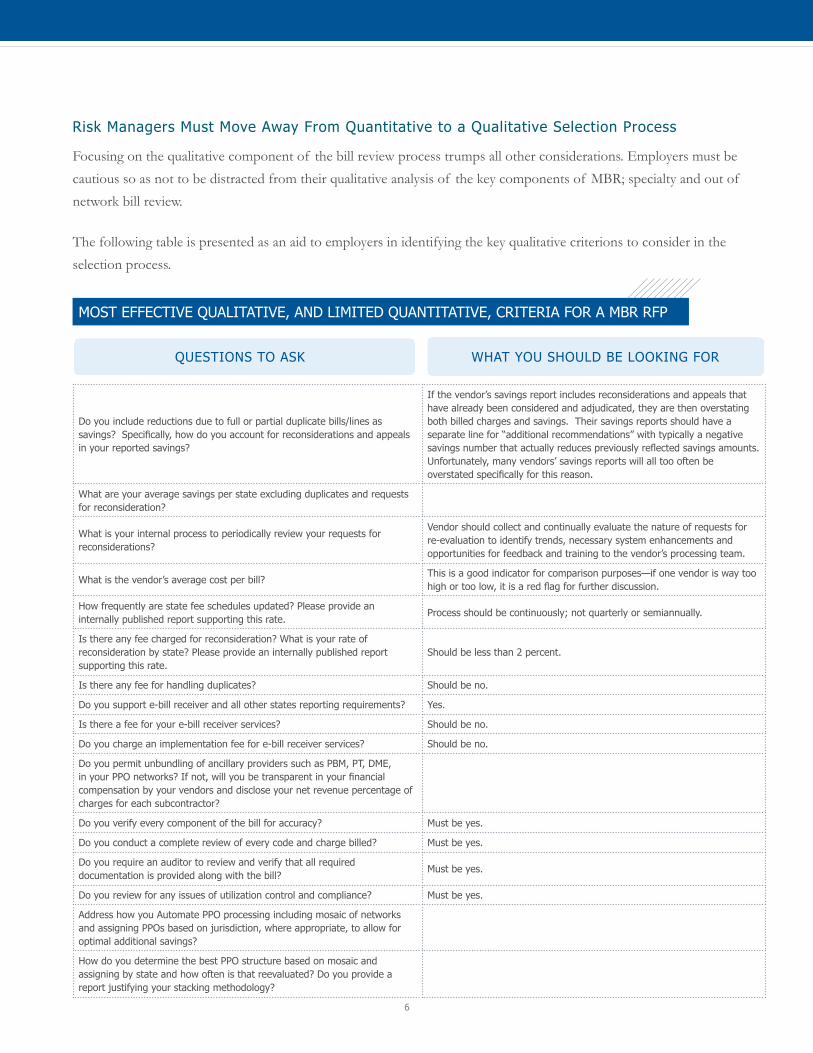
Risk Managers Must Move Away From Quantitative to a Qualitative Selection Process
Focusing on the qualitative component of the bill review process trumps all other considerations. Employers must be cautious so as not to be distracted from their qualitative analysis of the key components of MBR; specialty and out of network bill review.
The following table is presented as an aid to employers in identifying the key qualitative criterions to consider in the selection process.
Do you include reductions due to full or partial duplicate bills/lines as savings? Specifically, how do you account for reconsiderations and appeals in your reported savings?
If the vendor’s savings report includes reconsiderations and appeals that have already been considered and adjudicated, they are then overstating both billed charges and savings. Their savings reports should have a separate line for “additional recommendations” with typically a negative savings number that actually reduces previously reflected savings amounts. Unfortunately, many vendors’ savings reports will all too often be overstated specifically for this reason.
What are your average savings per state excluding duplicates and requests for reconsideration?
What is your internal process to periodically review your requests for reconsiderations?
Vendor should collect and continually evaluate the nature of requests for re-evaluation to identify trends, necessary system enhancements and opportunities for feedback and training to the vendor’s processing team.
What is the vendor’s average cost per bill?This is a good indicator for comparison purposes—if one vendor is way too high or too low, it is a red flag for further discussion.
How frequently are state fee schedules updated? Please provide an internally published report supporting this rate.
Process should be continuously; not quarterly or semiannually.
Is there any fee charged for reconsideration? What is your rate of reconsideration by state? Please provide an internally published report supporting this rate.
Should be less than 2 percent.
Is there any fee for handling duplicates? Should be no.
Do you support e-bill receiver and all other states reporting requirements? Yes.
Is there a fee for your e-bill receiver services? Should be no.
Do you charge an implementation fee for e-bill receiver services? Should be no.
Do you permit unbundling of ancillary providers such as PBM, PT, DME, in your PPO networks? If not, will you be transparent in your financial compensation by your vendors and disclose your net revenue percentage of charges for each subcontractor?
Do you verify every component of the bill for accuracy? Must be yes.
Do you conduct a complete review of every code and charge billed? Must be yes.
Do you require an auditor to review and verify that all required documentation is provided along with the bill?
Must be yes.
Do you review for any issues of utilization control and compliance? Must be yes.
Address how you Automate PPO processing including mosaic of networks and assigning PPOs based on jurisdiction, where appropriate, to allow for optimal additional savings?
How do you determine the best PPO structure based on mosaic and assigning by state and how often is that reevaluated? Do you provide a report justifying your stacking methodology?
QUESTIONS TO ASK WHAT YOU SHOULD BE LOOKING FOR
MOST EFFECTIVE QUALITATIVE, AND LIMITED QUANTITATIVE, CRITERIA FOR A MBR RFP
November 2014 • Lockton Companies
7
Electronic Data Interface (EDI), and MBR Data Reporting,
Having an EDI between the MBR vendor and the TPA is of course critical, but does not deserve the weighting factor in the decision-making process that it now enjoys. An effective and no-cost EDI can be accomplished by almost any of the major bill review vendors should an employer find their services superior to the TPA’s bundled offering. Negotiating with the TPA to unbundle their MBR is a whole other story.
Stewardship Reporting
Stewardship reporting of savings and fees, while varying among vendors, some with more bells and whistles than others, is pretty much on a level playing field for the critical information that employers need.
Why It’s Important to Link MBR With Utilization Review (UR)
The utilization review process is the sentinel that screens for clinical appropriateness, medical necessity, and treatment guideline compliance. Integrating the information with the bill review system and UR system ensures appropriate decisions in both departments. At a
minimum, ensure there is an electronic interface with the UR vendor if not included in the MBR vendor’s program. Results from UR are applied to bill processing and the only way to accomplish this is with shared data through integration. As telling as what services are requested through the UR process and either approved or denied are those never requested that fall outside treatment compliance. This information is critical in the bill review process to ensure that unnecessary (not medically necessary) care is not accepted and reimbursed.
Summary
The takeaway from this white paper is that MBR vendor selection must be based on qualitative versus quantitative criterion. Focus must be on the vendors’ keen abilities to facilitate the largest savings possible from facility and specialty bills. While it makes it far more difficult with the selection process, it is critical to ensure you are experiencing the maximum in medical bill savings.
The human component of medical bill review is the
ultimate driver of increased medical cost savings.
Assessing MBR vendors requires a deep qualitative look at
the credentialing of their professional coders, nurses and
physicians, their coding practices to include high touch-
points with every bill, and an expert negotiations team.
Kevin Lanphier, Equian (formerly Health Systems International).
Our Mission
To be the worldwide value and service leader in insurance brokerage, employee benefits, and risk management
Our Goal
To be the best place to do business and to work
www.lockton.com
© 2014 Lockton, Inc. All rights reserved. Images © 2014 Thinkstock. All rights reserved.
g\white paper\rosenblum\rosenblum_medical bill review_nov14.indd: 1371