workforce investment act - employment and training ... the workforce investment act of 1998...
TRANSCRIPT

Program Year 2010
(JulY 2010–June 2011)
State of Hawaii
Workforce Development Council830 Punchbowl Street, Room 417Honolulu, Hawaii 96813Telephone: (808) 586-8671Fax: (808) 586-8674
WORKFORCEDEVELOPMENTCOUNCIL
WorkforceInveStmentAct TiTle 1-B annual Performance rePorT

October 3, 2011
The Honorable Jane OatesAssistant Secretary, Employment and Training AdministrationUnited States Department of LaborWashington D.C. 20210
Dear Assistant Secretary Oates:
I am pleased to present to you the Year Eleven Workforce Investment Act Title I-B Annual Performance Report, Program Year July 2010 to June 2011. This report is a product of a number of different agencies within the State of Hawaii’s Department of Labor and Industrial Relations (“DLIR”). They include: The Workforce Development Council (“WDC”); the Workforce Development Division (“WDD”); the DLIR’s Research and Statistics Office (“R&S”); as well as the efforts of each of the Local Areas, through their Local Workforce Investment Boards.
Despite the fact that the State continues to face challenges in these hard economic times, the benefits of the Workforce Investment Act (“WIA”) in retraining our Adult and Dislocated Workers into higher-paying, more stable work continues to expand. With the promise of an economic turnaround in 2011, WIA programs and services have met the challenge of not only working to fill positions open today, but to project and work toward filling the positions of tomorrow with a highly educated workforce. The WDC, through its Skill Panel forums, have already started addressing the needs in the healthcare and computer software workforce by bringing together all industry stakeholders to address what the workforce needs are now and into the future.
In the area of developing a green workforce, a collaborative effort between the WDC through its State Energy Sector Partnership and the R&S efforts with the Green Labor Market Information Grant have both begun to address what is a green industry and the skills needed while also putting necessary resources to work in training people today for the green jobs of tomorrow.
Our efforts, though, must move through these economic challenges. This challenge will be met by expanding on the Skill Panel forums and aggressively seeking out new funding streams as they become available to address the work force needs of specific industries. For Hawaii, this is a way forward to developing our 21st Century Workforce.
Sincerely:
MARIAn E. TSUJI Chairperson
Neil Abercrombie mAriAN e. Tsuji Governor Chairperson
jAmes P. HArdwAy exeCutive DireCtor
sTATe of HAwAiiworkforce develoPmeNT couNcil
830 punchbowl street, suite 417, honolulu, hawaii 98613www.hawaii.gov/labor/wdc
phone: (808) 586-8672 / Fax: (808) 586-8674email: [email protected]

Background �
The Workforce Investment Act of 1998 (“WIA”) led to
the creation of Hawaii’s four local area one-stop delivery
systems—Oahu WorkLinks, Kauai *WorkWise, Work-
Source Maui and Big Island Workplace Connection. As
part of Hawaii’s workforce development system, these
entities are designed to:
Offer comprehensive employment, labor market and •
career information;
Help individuals gain employability skills through •
targeted education and training;
Help jobseekers and employers connect;•
Provide specialized assistance to individuals with •
barriers to employment;
Assist businesses address workforce issues; and, overall;•
Offer services and information in an integrated and •
customer-driven atmosphere.
The networks of the four one-stop delivery systems extend
beyond 14 physical locations through outreach staff for
special populations and businesses. The four one-stop
delivery systems are also supported by Hirenet Hawaii,
a virtual resource offering a wide variety of core employ-
ment services from any location with internet access. They
are operated by four local workforce investment boards
(“LWIBs”) and work with networks of partners including
the state-level Workforce Development Council (“WDC”)
and the State Department of Labor and Industrial
Relations (“DLIR”).
Funding from the federal WIA Title I-B program supports
statewide and local area activities that improve the
workforce system and deliver services to adults, dislocated
workers, and eligible youth.
Section one
The Workforce Investment Act in Hawaii
WORKFORCEDEVELOPMENTCOUNCIL
WorkWise Kaua‘iYour One-Stop Job Center
BIG
ISLAN
D WORKPLACE CONNECTION
WORKFORCE INVESTMENT BOA
RD
iO‘ahu
WorkL nksConnections for the working world
worksourcemauiPutting people & opportunities together
MAUI | MOLOKAI | LANAI
3

4 w i a t i t l e 1 - b a n n u a l p e r f o r m a n c e r e p o r t
2%
3%
4%
5%
6%
7%
8%
Aug
-201
1pJu
ly-2
011
June
-201
1M
ay-2
011
Ap
r-20
11M
ar-2
011
Feb
-201
1Ja
n-20
11D
ec-2
010(
b)
No
v-20
10(b
)O
ct-2
010(
b)
Sep
-201
0(b
)A
ug-2
010(
b)
July
-201
0(b
)Ju
ne-2
010(
b)
May
-201
0(b
)A
pr-
2010
(b)
Mar
-201
0(b
)Fe
b-2
010(
b)
Jan-
2010
(b)
Dec
-200
9(b
)N
ov-
2009
(b)
Oct
-200
9(b
)Se
p-2
009(
b)
Aug
-200
9(b
)Ju
ly-2
009(
b)
June
-200
9(b
)M
ay-2
009(
b)
Ap
r-20
09(b
)M
ar-2
009(
b)
Feb
-200
9(b
)Ja
n-20
09(b
)D
ec-2
008(
b)
No
v-20
08(b
)O
ct-2
008(
b)
Sep
-200
8(b
)A
ug-2
008(
b)
July
-200
8(b
)Ju
ne-2
008(
b)
May
-200
8(b
)A
pr-
2008
(b)
Mar
-200
8(b
)Fe
b-2
008(
b)
Jan-
2008
(b)
Chart 1: Unemployment Rates in Hawaii, January 2008–August 2011
The state’s overall unemployment situation continued
to be in the 6% range, with Hawaii continuing to have
a lower unemployment rate than the national average.
Chart 1 (below) shows Hawaii’s overall unemployment
rate increase from January 2008 to August 2011.
Program year 2010 saw a marked increase in the
number of people employed, and a decrease in those
unemployed. According to the State Department of
Labor, employment increased by 10,050 from October
2010 to August 2011, and those unemployed decreased
by 2,450. Although economic conditions are still chal-
lenging, these figures do mark a reversal and recovery
of the civilian labor force in the state of Hawaii.
Performance Environment �
The Hawaii workforce continued to be challenged by
the effects of the recession that started in late 2008.
During the last program year, state economists initially
predicted a rebound in overall economic output for
the state, in line with projections from most developed
countries that economic recovery had started.
However, due to natural disasters in Japan (A March
2011 earthquake/tsunami in the north) along with a
spike in fuel prices (retail fuel prices hovering around
$4 a gallon for most of 2011), local economists reduced
their projections, thus putting to question the overall
economic recovery in the state. With the sudden
downturn in Japanese tourism to the state, and the
overall increase in costs, partially due to an increase
in jet fuel prices, economic improvement in the state
continued to be slow, sluggish and unpredictable.
Source: Research & Statistics Office, State of Hawaii

The WIA-driven workforce development infrastructure
includes the Workforce Development Council (“WDC”),
the Workforce Development Division (“WDD”), and the
Research and Statistics Office (“R&S”), all housed in the
Department of Labor and Industrial Relations (“DLIR”);
14 One-Stop Centers in six major Hawaii islands and the
virtual Hirenet Hawaii; and four Local Workforce Invest-
ment Boards (“LWIBs”). The system continued to engage
stakeholders in economic development, education, and
workforce development activities that advance Governor
neil Abercrombie’s “new Day” agenda, which focuses on
renewable energy and film media.
In Program Year (PY) 2010, Hawaii received a total of
$8,745,031 for the Adult, Dislocated Worker, and Youth
Programs. Later, with the addition of $739 in reallotted
Dislocated Worker funds and the rescission of $4,606
and $4,748 respectively from the Adult and Dislocated
Worker programs, the PY 10 allotment was reduced to
$8,736,416. Despite the decrease, this was a net increase
of $2,250,727 over the PY 2009 allocation of $6,485,689.
With these funds, a total of 1,841 participants received
in-depth assessment, case management, support services
and training.
Workforce Development Council �
BoARd ACTIvITIes
During the program year, a number of new members
were appointed to the Council while others who were
term- limited departed the Council after years of dedicated
service. The new Chair, Ms. Marian Tsuji, was appointed
by the newly-elected Governor and took her seat as
the new Chair in July, 2011. Upon entering service, Ms.
Tsuji, along with the Executive Director, went to work
on scoping out and focusing on the WDC’s next 5-year
strategic plan that would start in 2014.
The WDC sought to address continuing issues related
to achieving Older Youth performance measures. The
Council initiated enhanced monitoring of statewide youth
programs. Monitoring included on-site observations of
both program administration activities and activities at
the contractor level. This monitoring is documented in a
report that identified specific issues in each local area,
with recommendations.
The WDC quarterly meetings focused on strategic
planning and alignment of the state’s workforce infra-
structure with economic development. This included
briefings on the following topics of strategic significance:
Economic Conditions in Hawaii• by Paul Brewbaker,
Chair of the State Council on Revenues
National Association of Workforce Boards Winter •
Meeting Review by Signe Godfrey and Steven Lee
Agricultural Workforce Review• by Sylvia Yuen, Dean
of the College of Tropical Agriculture and Human
Resources, University of Hawaii
Workforce Investment Act Budget• by James Hardway,
Executive Director, Workforce Development Council
Additionally, the WDC transitioned to a sector strategy for
planning purposes and implemented Industry Skill Panels.
IndUsTRy skIll PAnels
The WDC has worked over the past several years toward
transitioning to a sector-based approach to strategic
planning. The Industry Skill Panel approach adopted
by WDC during this past program year has allowed the
Council to develop a robust program based on national
best practice models.
Industry Skill Panels are private/public partnerships
working to ensure that employees in key industries have
the skills needed to meet the changing needs of business
quickly and competently. Skill Panel leaders build
consensus, prioritize their local and regional industry
workforce needs and are better able to mobilize partners
and leverage resources to make the greatest impact.
Designed not to be short-term in nature, the Panels
continue to meet and address issues to meet labor needs
far after the initial and follow-up forums are held.
For the initial use of the Skill Panel model in Hawaii, the
WDC focused on the healthcare workforce in the state.
Section t Wo
state and local Area Highlights
5

6 w i a t i t l e 1 - b a n n u a l p e r f o r m a n c e r e p o r t
Soon after, other industries approached the WDC for
assistance in forming their own Industry Skill Panels—
these included leaders in computer software development,
movie production, and agricultural development.
ComPeTITIve GRAnTs
The WDC has been successful in obtaining additional
federal funds to augment WIA formula funds.
First awarded in late January 2010, the State Energy
Sector Partnership (“SESP”) Grant entered into year two
operations by completing the first-level tasks of drafting
and getting signed contracts with sub-recipients identified
in the grant as training partners. Partners including the
Local Workforce Investment Boards, non-profits, labor
training organizations and electrical companies all started
in earnest their training programs with the awarding of
the monies. During the program year, SESP staff attended
trainings on grant management and performed trainings
Healthcare Workforce skill Panel
In 2010, the healthcare workforce in Hawaii reached
a “critical condition.” The state has major industry
barriers, including a lack of local training available
for specialized occupations, a lack of specific labor
market information, a high cost of both living and
transportation that inhibits training (especially on
neighbor islands), limited access to healthcare in rural
and isolated areas, and high health disparities among
certain populations. When compared to average U.S.
healthcare utilization rates, these and other barriers
have led to an estimated 20% lack of primary care
providers in the state, as well as shortages in many
other healthcare occupations.
In an effort to address this gap in healthcare services
and healthcare workforce opportunities for Hawaii
residents, a partnership was formed between the
Workforce Development Council, the Department
of Labor and Industrial Relations, the University of
Hawaii’s Career and Technical Education Center, the
Chamber of Commerce of Hawaii, and the University
of Hawaii Community Colleges. These organizations
worked with industry professionals to create Skill
Panels focused on nursing, Long-Term Care, Primary
Care, and Technical Disciplines. Initial Skill Panel
meetings were held on October 5 and november 9, 2010;
over 150 attendees contributed their time and expertise.
As a direct result of these Skill Panels, a number of
developments have occurred:
The development of an innovative Registered nurse •
(“Rn”) program for final-year nursing students
aimed at reducing the bottleneck by allowing more
new Rns to enter high-needs fields
The deployment of a comprehensive survey to •
hospitals that will identify advanced practice Rn
needs based on specialty vacancies and anticipated
retirement rates for the coming years
The formation of a new panel to address specific •
“workforce readiness” solutions for healthcare
employers (created after the topic emerged as a
major issue in the October Skill Panel)
The development of a local training program by an •
employer-educator team for a high-needs specialty
currently unavailable in the state
An initial report on the developments of the Skill Panel
was produced in February 2011. A follow-up report will
be produced by the end of 2011 as part of the Healthcare
Planning Grant report.
S t a t e o f H a w a i i , p y 2 0 1 0 ( J u l y 2 0 1 0 – J u n e 2 0 1 1 ) 7
Human Services, continued to produce results throughout
the program year. Tying into the Healthcare Workforce
Skill Panel, issues surrounding the needs of Hawaii in
light of the Affordable Care Act implementation gave
depth to specific primary care needs that will need to be
addressed as the Act is implemented in 2014. A final report
on the specific needs is due by the end of 2011.
The WDC also implemented a $655,000 College Access
Challenge Grant from the U.S. Department of Education.
Under the grant, the WDC established a student and
adult learner web portal called Myfuturehawaii.org. The
portal is designed to assist minority and disadvantaged
students and adult learners in applying for post-secondary
educational institutions. The portal provides the following
four basic applications: (1) Degree audit; (2) College and
Career Planning; (3) Electronic College Application and
Transcript Submittal; and (4) Tools to find and apply for
financial resources.
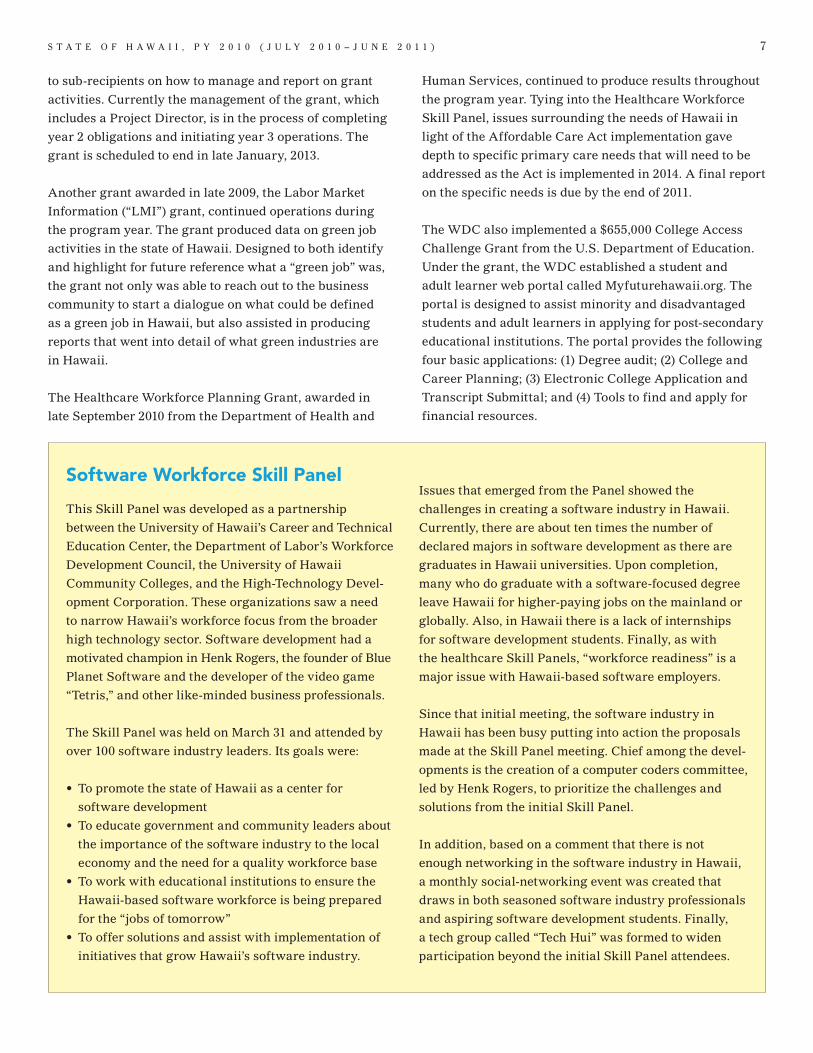
software Workforce skill Panel
This Skill Panel was developed as a partnership
between the University of Hawaii’s Career and Technical
Education Center, the Department of Labor’s Workforce
Development Council, the University of Hawaii
Community Colleges, and the High-Technology Devel-
opment Corporation. These organizations saw a need
to narrow Hawaii’s workforce focus from the broader
high technology sector. Software development had a
motivated champion in Henk Rogers, the founder of Blue
Planet Software and the developer of the video game
“Tetris,” and other like-minded business professionals.
The Skill Panel was held on March 31 and attended by
over 100 software industry leaders. Its goals were:
To promote the state of Hawaii as a center for •
software development
To educate government and community leaders about •
the importance of the software industry to the local
economy and the need for a quality workforce base
To work with educational institutions to ensure the •
Hawaii-based software workforce is being prepared
for the “jobs of tomorrow”
To offer solutions and assist with implementation of •
initiatives that grow Hawaii’s software industry.
Issues that emerged from the Panel showed the
challenges in creating a software industry in Hawaii.
Currently, there are about ten times the number of
declared majors in software development as there are
graduates in Hawaii universities. Upon completion,
many who do graduate with a software-focused degree
leave Hawaii for higher-paying jobs on the mainland or
globally. Also, in Hawaii there is a lack of internships
for software development students. Finally, as with
the healthcare Skill Panels, “workforce readiness” is a
major issue with Hawaii-based software employers.
Since that initial meeting, the software industry in
Hawaii has been busy putting into action the proposals
made at the Skill Panel meeting. Chief among the devel-
opments is the creation of a computer coders committee,
led by Henk Rogers, to prioritize the challenges and
solutions from the initial Skill Panel.
In addition, based on a comment that there is not
enough networking in the software industry in Hawaii,
a monthly social-networking event was created that
draws in both seasoned software industry professionals
and aspiring software development students. Finally,
a tech group called “Tech Hui” was formed to widen
participation beyond the initial Skill Panel attendees.
to sub-recipients on how to manage and report on grant
activities. Currently the management of the grant, which
includes a Project Director, is in the process of completing
year 2 obligations and initiating year 3 operations. The
grant is scheduled to end in late January, 2013.
Another grant awarded in late 2009, the Labor Market
Information (“LMI”) grant, continued operations during
the program year. The grant produced data on green job
activities in the state of Hawaii. Designed to both identify
and highlight for future reference what a “green job” was,
the grant not only was able to reach out to the business
community to start a dialogue on what could be defined
as a green job in Hawaii, but also assisted in producing
reports that went into detail of what green industries are
in Hawaii.
The Healthcare Workforce Planning Grant, awarded in
late September 2010 from the Department of Health and

8 w i a t i t l e 1 - b a n n u a l p e r f o r m a n c e r e p o r t
980 (0.4%)
940 (0.8%)
730 (0.4%)
410 (1.1%)
340 (5.4%)
340 (1.0%)
330 (1.9%)
330 (1.2%)
320 (1.4%)
310 (0.1%)
1,260 (2.0%)
1,230 (2.1%)
1,060 (1.4%)
550 (2.8%)
250 (3.7%)
480 (2.6%)
330 (2.1%)
390 (2.6%)
360 (2.4%)
480 (1.6%)
Research and Statistics Office �
The Research and Statistics Office (“R&S”) is the State
Labor Market Information entity that conducts major
research activities for Hawaii and publishes research
results for different target audiences. To support
workforce development solutions in Hawaii, R&S
requested and received a PY 2010 grant of $324,368 for
Workforce Information core Products and Services. The
grant required that specific labor market information be
delivered. Information was delivered primarily through
the website, www.hiwi.org.
In PY 2010, various workforce stakeholders had an increased
interest in unemployment conditions, employment projec-
tions, and green jobs; therefore, with other offices, R&S
customized information products and services to support
those interests by creating the following:
Short-term industry and occupational employment •
projections for 2010–2012
Long-term industry and occupational employment •
projections for 2008–2018 for the state (revised) and four
counties
Annual Labor Market Dynamics report presenting 2010 •
job trends for the state and counties
Green jobs projection comparisons from an initial •
survey in 2010 between both short- and long-term
projections described above
Initial healthcare industry labor shortages and projec-•
tions for a health grant proposal
The $1.2 million Labor Market Improvement (LMI) project
was designed to increase the effectiveness of the DLIR
as a Hawaii Clean Energy Initiative partner. Promising
practices from the LMI Improvement (aka Green LMI)
project included R&S’s adoption of the Hawaii Green Jobs
Initiative (HGJI) as an outreach brand. This initiative
has proven effective in promoting green labor market
information and workforce development in the minds of
clean energy stakeholders across Hawaii. Since April
2011, the DLIR has leapt forward in visibility, as all green
LMI grant materials became unified and presented with a
branded logo and website, www.greenjobshawaii.org.
Today, the Green Jobs Initiative has come full circle and
has been adopted as an overarching DLIR strategy for
green workforce development, involving the collaborative
leadership of the Workforce Development Council (WDC),
Workforce Development Division (WDD), Director’s Office
(DO), and the Research and Statistics Office (R&S).
1,4001,2001,0008006004002000
Chart 2: Ten occupations Projected to Have the most Annual Job openings in Hawaii
Waiters and Waitresses
Retail Salespersons
Cashiers
Combined Food Prep & Serving Workers, incl. Fast Food
Personal and Home Care Aides
Security Guards
Registered Nurses
Elementary School Teachers, excl. Special Education
Customer Service Representatives
Food Preparation Workers
Long Term: 2008–2018
Short Term: 2010–2012
Source: Research & Statistics Office, State of Hawaii
S t a t e o f H a w a i i , p y 2 0 1 0 ( J u l y 2 0 1 0 – J u n e 2 0 1 1 ) 9
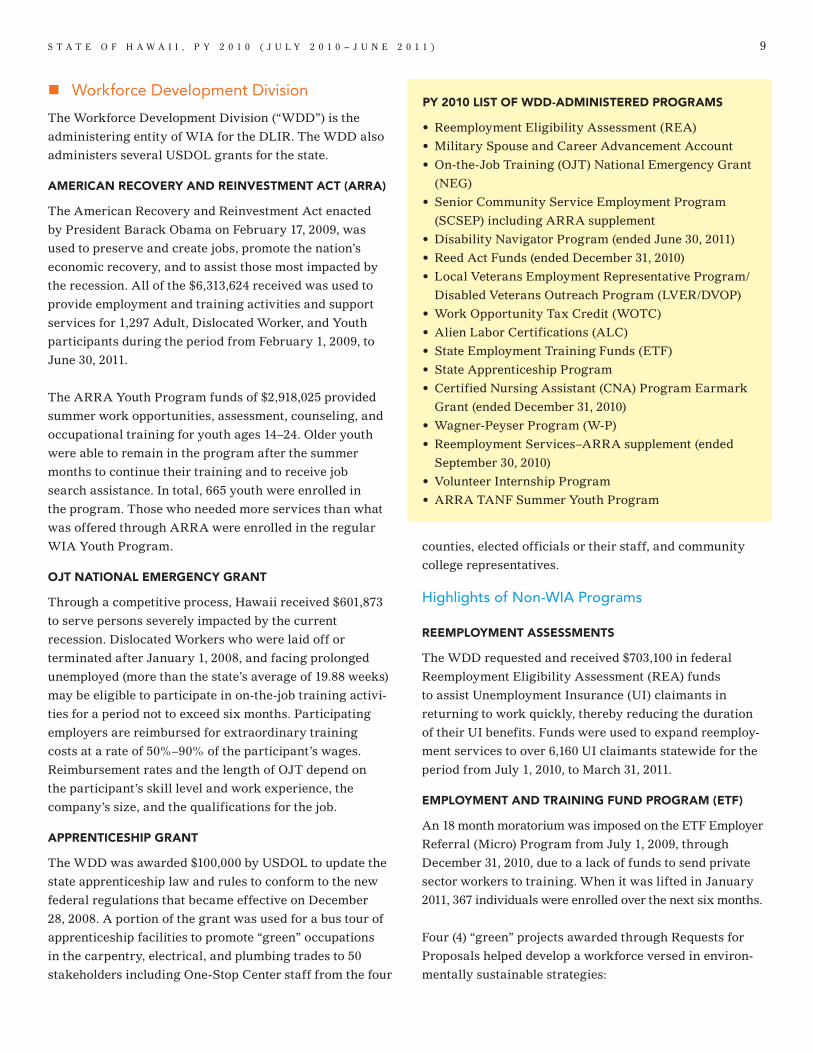
Workforce Development Division �
The Workforce Development Division (“WDD”) is the
administering entity of WIA for the DLIR. The WDD also
administers several USDOL grants for the state.
AmeRICAn ReCoveRy And ReInvesTmenT ACT (ARRA)
The American Recovery and Reinvestment Act enacted
by President Barack Obama on February 17, 2009, was
used to preserve and create jobs, promote the nation’s
economic recovery, and to assist those most impacted by
the recession. All of the $6,313,624 received was used to
provide employment and training activities and support
services for 1,297 Adult, Dislocated Worker, and Youth
participants during the period from February 1, 2009, to
June 30, 2011.
The ARRA Youth Program funds of $2,918,025 provided
summer work opportunities, assessment, counseling, and
occupational training for youth ages 14–24. Older youth
were able to remain in the program after the summer
months to continue their training and to receive job
search assistance. In total, 665 youth were enrolled in
the program. Those who needed more services than what
was offered through ARRA were enrolled in the regular
WIA Youth Program.
oJT nATIonAl emeRGenCy GRAnT
Through a competitive process, Hawaii received $601,873
to serve persons severely impacted by the current
recession. Dislocated Workers who were laid off or
terminated after January 1, 2008, and facing prolonged
unemployed (more than the state’s average of 19.88 weeks)
may be eligible to participate in on-the-job training activi-
ties for a period not to exceed six months. Participating
employers are reimbursed for extraordinary training
costs at a rate of 50%–90% of the participant’s wages.
Reimbursement rates and the length of OJT depend on
the participant’s skill level and work experience, the
company’s size, and the qualifications for the job.
APPRenTICesHIP GRAnT
The WDD was awarded $100,000 by USDOL to update the
state apprenticeship law and rules to conform to the new
federal regulations that became effective on December
28, 2008. A portion of the grant was used for a bus tour of
apprenticeship facilities to promote “green” occupations
in the carpentry, electrical, and plumbing trades to 50
stakeholders including One-Stop Center staff from the four
counties, elected officials or their staff, and community
college representatives.
Highlights of Non-WIA Programs
ReemPloymenT AssessmenTs
The WDD requested and received $703,100 in federal
Reemployment Eligibility Assessment (REA) funds
to assist Unemployment Insurance (UI) claimants in
returning to work quickly, thereby reducing the duration
of their UI benefits. Funds were used to expand reemploy-
ment services to over 6,160 UI claimants statewide for the
period from July 1, 2010, to March 31, 2011.
emPloymenT And TRAInInG FUnd PRoGRAm (eTF)
An 18 month moratorium was imposed on the ETF Employer
Referral (Micro) Program from July 1, 2009, through
December 31, 2010, due to a lack of funds to send private
sector workers to training. When it was lifted in January
2011, 367 individuals were enrolled over the next six months.
Four (4) “green” projects awarded through Requests for
Proposals helped develop a workforce versed in environ-
mentally sustainable strategies:
Py 2010 lIsT oF Wdd-AdmInIsTeRed PRoGRAms
Reemployment Eligibility Assessment (REA)•
Military Spouse and Career Advancement Account•
On-the-Job Training (OJT) national Emergency Grant •
(nEG)
Senior Community Service Employment Program •
(SCSEP) including ARRA supplement
Disability navigator Program (ended June 30, 2011)•
Reed Act Funds (ended December 31, 2010)•
Local Veterans Employment Representative Program/•
Disabled Veterans Outreach Program (LVER/DVOP)
Work Opportunity Tax Credit (WOTC)•
Alien Labor Certifications (ALC)•
State Employment Training Funds (ETF)•
State Apprenticeship Program•
Certified nursing Assistant (CnA) Program Earmark •
Grant (ended December 31, 2010)
Wagner-Peyser Program (W-P)•
Reemployment Services–ARRA supplement (ended •
September 30, 2010)
Volunteer Internship Program•
ARRA TAnF Summer Youth Program•

10 w i a t i t l e 1 - b a n n u a l p e r f o r m a n c e r e p o r t
1. Maui Economic Opportunity, Inc., together with
University of Hawaii Maui College (UHMC), received
$85,627 to establish two training programs—the
Small Business and Residential Energy Management
Program and the Commercial Building Energy Man-
agement Program—to certify employees in energy
management, including energy auditing and weath-
erization inspection. Fifty-one (51) individuals were
trained, ten (10) of whom acquired Residential Energy
Services network certification. nine (9) individuals
obtained a Building Operator Certification Level 1
credential.
2. $100,000 was given to the Building Industry Associa-
tion of Hawaii Construction Training Center of the
Pacific and the Sustainable Development Training
Institute to develop a green building skills training
program. ninety-seven (97) individuals were trained,
and with the curriculum developed through this grant,
the BIA expects to train approximately 425 pre-
apprentices and 150 journey workers in Green Building
Fundamentals each year.
3. The University of Hawaii at Manoa, Outreach College,
Building Owner and Managers Association of Hawaii,
and Hawaii Building Engineers Association used
$44,616 to establish a green training and certification
program for building owners, property managers
and building operators. Of sixty-two (62) individuals
trained in green building practices, 13 completed their
Building Operator Level 1 certification, and the cur-
riculum developed continues to be used on Oahu with
plans for expansion to Kauai by 2012.
4. The Hawaii Farm Bureau Federation and University
of Hawaii College of Tropical Agriculture and Human
Resources was awarded $100,000 to establish an
On-Farm Food Safety Certification Training Program
to train fifty (50) farm operators/employers statewide
to pass food safety audits and help producers meet
demand for produce from certified farms. The program
is scheduled to end in PY 2011.
volUnTeeR InTeRnsHIP PRoGRAm (vIP)
The VIP is a DLIR initiative that allows job seekers,
especially those receiving unemployment insurance (UI)
benefits, to volunteer at businesses to gain workforce
training. Upon successful completion of training, interns
receive certification of the job skills acquired and consid-
eration for employment. The opportunity to train through
VIP is limited to 16–32 hours per week for 4–8 weeks.
Since the program’s inception in February 2010, 489
individuals received skills assessment services. Of those,
310 were placed at businesses as VIP trainees, 37 were
hired by their business sponsor, and 70 were reported as
hired elsewhere.
ARRA TAnF sUmmeR yoUTH emPloymenT PRoGRAm
The State Department of Human Services contracted
the City and County of Honolulu and DLIR to implement
an ARRA TAnF-funded Summer Youth Employment
Program in 2010. The DLIR program was initially limited
to the neighbor island counties but was later expanded
to include Oahu youth, for a total budget of $3.5 million.
Despite extreme time constraints, DLIR placed over
1,500 youth in the program at various government and
private non-profit sites statewide. Feedback from youth
and worksite supervisors was overwhelmingly positive
because the youth were able to earn wages at their jobs
while learning job readiness skills. The program ended on
September 30, 2010.

S t a t e o f H a w a i i , p y 2 0 1 0 ( J u l y 2 0 1 0 – J u n e 2 0 1 1 ) 11
oahu WoRkFoRCe InvesTmenT BoARd HIGHlIGHTs
Adult and Dislocated Workers �
As of August 2011, the Oahu Workforce Investment Board
(“OWIB”) is currently either meeting or exceeding all WIA
performance measures. During the program year, the
Oahu Workforce Investment Board (“OWIB”) remained
active, working with both new and more traditional
employers to provide work opportunities for adult and
dislocated workers. In January and May of 2011, job fairs
were held. new companies to the state such as Disney,
whose Aulani resort is now open, participated in both
job fairs. A number of other construction companies and
trade associations also participated, giving individuals
looking for work an opportunity to inquire and apply. For
the May 2011 job fair, jobs that are considered part of the
“green industry” were given a separate section of the fair.
This “Green Zone” featured green businesses that were
actively recruiting for green jobs. The Zone also featured
workforce agencies promoting various training opportuni-
ties in green industries.
Youth Programs �
During the program year, OWIB experienced a reorgani-
zation of youth programs. The youth programs that relate
to WIA were moved from the Office of Special Projects
to the WorkHawaii Division. Meanwhile, OWIB’s youth
programs have been recognized by a number of national
organizations and governmental entities for excellence in
service and best practices awards. Currently, older youth
WIA programs are exceeding in 3 out of 4 categories, and
younger youth programs are exceeding goals in 2 out of 3
measurements.
national Awards and Recognition for the City & County of Honolulu’s youth Programs
From Award or Recognition
U.S. Department of Labor (USDOL) Young Parents Demonstration Project (1st in the nation)
America’s Promise Alliance 100 Best Communities for Young People Awards
U.S. Conference of Mayors Best Practices on At-Risk Youth and High School Dropout Prevention Awards
YouthBuild USA Excellent Attendance, Program Completion, and Diploma Attainment Awards
National Association of Counties Excellence in Service award
U.S. Department of Labor Training Featured Speaker: “How to maximize use of resources to generate excellent results”
Harvard University Bright Ideas Award

12 w i a t i t l e 1 - b a n n u a l p e r f o r m a n c e r e p o r t
SucceSS StorieS : oahu
WoRkFoRCe CHAllenGe: Natalie was a recent high school graduate, economically disadvantaged and unemployed, looking for a more stable and higher-paying job than the one she previously had at a drugstore.
WoRkFoRCe solUTIon: Natalie and her Employment Counselor at Oahu WorkLinks developed a career plan, identifying a high-growth, high-demand occupation in healthcare that she was interested in pursuing: Medical Assisting. Using ARRA training funds, Natalie enrolled in Leeward Community College’s Medical Assistant program, where she excelled.
oUTComes & BeneFITs: After completing coursework and an externship, Natalie received her Certificate of Professional Development for Medical Assistant. The following month Natalie was employed by Hawaii Pacific Health (HPH) as a Medical Assistant, working at the Pediatric Outpatient office at Kapiolani Women and Children’s Hospital. There she earns $16.65 an hour, more than double her previous pay at the drug store. She is looking forward to a rewarding career.
WoRkFoRCe CHAllenGe: Michael had worked in the security industry as an Armored Service Technician, but experienced a layoff after five years. As a dislocated worker, Michael was collecting unemployment benefits when he received word that his wife was pregnant with their first child. He knew that he had to get a job and provide for his growing family.
WoRkFoRCe solUTIon: Michael and his Oahu WorkLinks Employment Counselor developed a career plan based on his goal of getting a stable job without the stress of having to carry a firearm. Using WIA funding, he enrolled at Professional Driving Academy to obtain his Commercial Driver License. Several months later, he passed the training with flying colors and got his CDL Type A License.
oUTComes & BeneFITs:
Michael was hired by Honolulu Disposal as a Truck Driver, earning $16 an hour. He is now able to work in a waste management job that helps the environment. What’s more, the stable income helped him purchase a house, just in time to become a father.
Natalie’s, Michael’s, and Marvin’s stories were originally posted on www.workforceinvestmentworks.com from the National Association of Workforce Boards.
natalie’s new Career
michael moves Up

S t a t e o f H a w a i i , p y 2 0 1 0 ( J u l y 2 0 1 0 – J u n e 2 0 1 1 ) 13
SucceSS StorieS : oahu
WoRkFoRCe CHAllenGe: Prior to enrolling at the City and County of Honolulu’s Youth Services Center, Marvin was a troubled youth who committed several infractions that brought him within the jurisdic-tion of the state of Hawaii’s Family Court system. In February 2009, Marvin dropped out of school at 15 years old.
WoRkFoRCe solUTIon: As an at-risk youth and youth offender, Marvin came to the juvenile diversion program at the Youth Services Center hoping to obtain his high school diploma. Marvin enrolled in the Competency-Based Diploma (CBASE) classes but was unable to complete his 5th and final unit when the diversion program came to a close as the funding ran out. Fortunately Marvin was accepted into the Workforce Investment Act Youth Program to complete his CBASE instruction.
oUTComes & BeneFITs: Marvin progressed exception-ally fast through the CBASE program. At 16 years old, Marvin obtained his high school diploma. After completing his academic instruction, Marvin was able to secure a paid internship through WIA at a local auto body and stereo company. With a change in attitude, and willpower and determination, he successfully achieved his goals.
marvin’s sweet 16
iO‘ahu
WorkL nksConnections for the working world
Nailiulaikalani is a 21-year-old, part-Hawaiian female and single parent living in Hau‘ula with her daughter. She graduated from Kahuku High & Intermediate School.
On March 13, 2009, Naili came into our office at Hau‘ula for a scheduled assessment appointment. She was interested in Medical Assistant Training and had a scholarship award from Hana Lima, but needed more financial assistance in order to enroll in classes at Hawaii Medical Institute of Hawaii that began in April. She appeared well-dressed, friendly, ambitious, and hard-working, and her past experience as a general office
clerk, teller, volunteer, and cashier had allowed her to acquire skills in customer service, computer and office equipment, and cash handling. She had also attended training and received certificates in Prenatal & Infant development.
Naili began her training in April 2009 as a Medical Assistant at Hawaii Medical Institute, and through hard work and ambition she received her Clinical Medical Assistant Diploma on June 13, 2010. While attending training she continued volunteering, caring for her daughter, and seeking part-time employment.
Naili is currently employed at Ko‘olauloa Health and Community Wellness Center in Hau‘ula as a Medical Assistant, where she provides medical and clerical assistance. She enjoys her job and helping patients in her community. In the years to come she will seek a bachelor’s degree in Nursing and pursue her career in the medical field—and will continue to volunteer in her community.
naili’s Big Plans

14 w i a t i t l e 1 - b a n n u a l p e r f o r m a n c e r e p o r t
Adult Program Highlights �
The unemployment rate for Hawaii County was 10.6% in
June 2011. Unfortunately, this has brought Hawaii County
back to the levels of a year ago (2010). Typically, our Adult
Program participants are adversely affected by the influx
of qualified, skilled workers flooding the labor market and
a lack of new job openings during this sluggish economy.
Hawaii Branch, with its local offices in Hilo and Kona, has
stepped up its job preparation activities for our partici-
pants to increase their competitiveness.
Despite employment opportunities remaining scarce, the
State Workforce Development Division staff continues
to provide an array of job readiness workshops with
heavier emphasis on career navigation and counseling.
Continuous engagement is a common theme for all levels
of unemployed individuals. Participants have opportuni-
ties to seek local college financial aid assistance through
orientation and application workshops at the One-Stop.
WIA counselors continue to take part in an accelerated
employer relations campaign (at the state and local
levels) in order to generate and reestablish relationships
with local employers. The promoting of use of services,
facilities, Employer Resource Center, Tax Credits and
On-the-Job Training opportunities will assist in future
placements and retention of trainees.
Due to Hawaii County’s high per-capita poverty rates and
a double-digit unemployment rate, Hawaii WIB continues
to dual-enroll participants with one-stop partners like
Alu Like, the Division of Vocational Rehabilitation, the
Senior Employment & Training Program, and other non-
mandated one-stop partners in order to optimize funding
resources due to the poor economy.
Dislocated Worker Highlights �
The dislocated worker population has also been adversely
affected by the stubborn economic slowdown. Fortunately,
many dislocated worker participants have greater skill
sets and sounder work and maturity skills. However, for
many participants, new occupational skills and skill sets
need to be learned, and readjustment services in this very
tight economy become paramount to their re-employment.
This population, however, remains more selective on
long-term training opportunities offered by our program.
With these challenges, Hawaii WIB, as of the end of
June 30, 2011, has exceeded its goals for the year by
1%. Planned enrollment was 216 and actual was 220.
Computer training, Certified nurse Assistant and Com-
mercial Driver Education are the predominant training
of choice. The Hawaii WIB has noted a trend that during
the last year, many of the dislocated workers are now
accepting employment opportunities that are well below
their original expected pay range and some are opting to
return to school and/or receive more training during this
economic downturn.
Youth Highlights—Older Youth �
The Ola I Ka Hana Program run by contractor Goodwill
served 94 older and younger youth in the program year.
Of these, 81 were aged 14–18 and 13 were aged 19–21. The
increase in enrollment is attributed to the effort of the
staff to promote the Ola programs and conduct outreach
services in Kona, Honoka‘a and other rural areas. A total
of 25 youth have attained their high school diplomas or
certificates of completion in the program year.
There were 19 youth who received their Competency-
Based High School Diploma in June 2011: 16 youth in Hilo
and three youth in Kona. Two graduates have applied to
UH-HCC and are awaiting their results for admission in
the fall. The other graduates have obtained employment
or are working with their youth specialists to secure a job
placement.
Youth Highlights—Younger Youth �
Through our contractor, Paxen, Hawaii WIB is currently
servicing an enrolled total of 67 participants. The contrac-
tor had a total of 40 “current enrollment participants” and
27 participants who have been exited during PY 2010–2011
and are now in “follow up services.” The contractors
continue to provide follow up to participants who have
been exited during PY 2009–2010. Work continues with
the local community colleges and university to establish
a rapport between them and the participants who are of
eligible age. In addition, participants have been assisted in
applying for and sustaining higher education and financial
aid tuition assistance, résumé building, financial literacy,
employment seeking and referrals to outside agencies.
Hawaii County WoRkFoRCe InvesTmenT BoARd HIGHlIGHTs

S t a t e o f H a w a i i , p y 2 0 1 0 ( J u l y 2 0 1 0 – J u n e 2 0 1 1 ) 15
SucceSS StorieS : haWaii count y
Chantel Finds a WayWoRkFoRCe CHAllenGe: Chantel, age 21, was a high school dropout and a single mom of a two-year-old son when she learned about the Ola I Ka Hana Older Youth Program through a friend. Being on welfare, she was informed that one of the requirements to receive benefits was that she had to find employment and work a minimum of 30 hours per week. Chantel knew that without a high school diploma she was not going to be able to find a job, since most of the jobs required a high school diploma or GED.
WoRkFoRCe solUTIon: Chantel applied with Ola in 2009. There were a few barriers for Chantel to overcome, as she had no driver’s license, no transportation and no childcare before she started the early morning classes for her program. With the help of family and friends she began the program. The coursework proved difficult at first for her since she had not been in school for a while. But Chantel remembers thinking about her son and wanting to make him proud of her. She also remembers how her youth specialist, Kealoha Daubert, made learning interesting and fun. She got up early and attended class with a good attitude.
oUTComes & BeneFITs:
Chantel was a model student, and it paid off. She was hired by Laniakea Express as a full-time cashier. She received a pay increase after only a month of being employed and is still employed there. She received her Competency Based High School diploma in 2010 and continues to meet with her youth specialist, Kealoha, quarterly. She says to others, “Stay in school, but if for any reason you can’t, the Ola program and teachers can help you. They helped me, and I’m thankful.”
stacey’s TurnaroundWoRkFoRCe CHAllenGe: Stacey grew up in a housing project on Oahu. The problems started in the summer before her fresh-man year, when alcohol abuse led to problems in her parents’ marriage. During that difficult time she and her brother both joined gangs. Her mother recognized that things were heading downhill, divorced her father and moved them to the Big Island. Although Stacey was taking care of her younger siblings, she also started drinking and using marijuana. Cutting class left her 10 credits behind her classmates.
WoRkFoRCe solUTIon: Stacey got involved with the Ola Program because her hanai sister had participated in the past. This program targets at-risk high school seniors and prepares them to complete high school requirements and enter the workforce. At first, Stacey did not think that she could “take the program seriously,” but she was wrong. “I fell in love with how the teachers teach and the school environment. I started to take the program seriously,” said Stacey. “I paid a lot of attention to what our teachers were teaching us and I got myself into the Competency Based High School Diploma (CBHSD) class by passing [a standardized assessment test].” Stacey is now in the CBHSD class and is working toward her high school diploma. Stacey says, “The Ola Program has helped me believe and have faith in myself that I can and will accomplish my dreams and goals.”
oUTComes & BeneFITs:
Recently, Stacey shared, “This program has helped me realize that there’s a lot to life, and [that] sitting at home watching TV isn’t life. I did turn my life around for the better. It was time for me to wake up and smell the coffee because life was just passing me by. I was a nobody, but now I can call myself a somebody because I’m living my life to the fullest, taking one step at a time. Thank you for giving me the opportunity to share my life and how I’ve become a better person.”
These stories were originally posted on www.workforceinvestmentworks.com from the National Association of Workforce Boards.

16 w i a t i t l e 1 - b a n n u a l p e r f o r m a n c e r e p o r t
kauai County WoRkFoRCe InvesTmenT BoARd HIGHlIGHTs
Adult and Dislocated Worker Programs �
Job Seeker documented walk-in visits, on average, are on the
rise. This is probably more reflective of staff having adjusted
to the reduced staffing available to cover the resource room,
and of staff being better able to ensure that most walk-ins
actually register before receiving services.
Credential attainment continues to be a challenge, particu-
larly for the Adult and Dislocated Worker WIA programs.
This may be attributable to limited Kauai Community
College credential options due to class cancellation when
enrollment is low, or to classes not being scheduled until a
sufficient number of interested students are wait-listed.
To address this, the Kauai Workforce Investment Board
approved fourteen 24-week on-line training courses being
offered through KCC by ED2GO. Of these, 11 courses
have a related certification exam. While costly, these new
courses offer a viable option since they will run regardless
of local enrollment count and participants can work on their
program 24/7—meaning work schedules are not a limiting
factor to participation. KWIB hopes these new offerings will
help in addressing the diverse needs of participants and will
improve their credential measures over time.
Younger and Older Youth Programs �
The County of Kauai recently awarded its Youth Program
service provider contract to Paxen Huli Ke Alo LLC. The
organization just concluded a very successful STEM
summer program that served 30 younger youth through a
state grant. They are now gearing up for the new school
year, and some of their STEM participants are excited
about enrolling in the WIA program.
In recent years, older youth were being placed in the
subcontractor’s alternate adult work readiness program,
“Forward March.” This was done to address the youth’s
most immediate need for employment and because of
limited WIA program funding. Frequently as a result, there
were no OY exiters; measures were shown as 0% when
actually it should have been “not Applicable” since, math-
ematically, denominators cannot be 0. The Youth Program
contract recently issued to Paxen Huli Ke Alo requires
that at least 15% of the served population be older youth.
It is hoped that this new contract will improve WIA older
youth performance measures in future program years.
SucceSS StorieS : K auai
Finally on the Right PathA 17-year-old boy came to Kauai’s youth program in the fall of 2009, having been referred by his sister, who was a graduate of the adult program. The boy had been a runaway, had dropped out of school, and was on probation. Yet he responded to the program, whizzed through classes, got his GED in December of 2009, and found himself a job in a restaurant. Things were still not easy for him, though, and he struggled to figure out what he wanted to do. His mother told us his home life was chaotic, with a drug-addicted, sometimes violent sibling in the house. She feared for him. In October of 2010 he decided to join the Hawaii National Guard and success-fully completed basic training in Fort Benning, Georgia. Upon his return to Hawaii, he decided to attend community college on Oahu, where today he continues his duties with both school and the National Guard.
Turning a new leafFor 37 years a woman worked for a long-established Kama‘aina company on Kauai, but when her company closed during the economic downturn, her 37-year career went with it. To get herself back into the workforce, she enrolled in WIA DW-Formula and was sent to Kauai Community College for a short-term computer course. After registering for the VIP Program, she was able to secure an 8-week internship with a notable community-based non-profit organization, where she subsequently secured a full-time position. Today, she is very glad to be working again!

S t a t e o f H a w a i i , p y 2 0 1 0 ( J u l y 2 0 1 0 – J u n e 2 0 1 1 ) 17
Adult and Dislocated Program Highlights �
Maui WIA staff continues its efforts in the recruitment
and enrollment of eligible adult and dislocated worker
customers to provide core, intensive and training infor-
mation and services. Management continues to work on
strategies to improve recruitment, enrollment, perfor-
mance outcomes and overall services provided in the
WIA programs.
Staff are utilizing the materials and information provided
to them, with a focus on the career assessment tools.
Counselors are encouraging participants to explore Career
Kokua, HnH, My Future/My Skills, TORQ, Onet, and
other career assessment websites and tools, and to utilize
their results to better assess their employment goals.
Participants have found that their results from the various
career assessment tools have uncovered hidden abilities,
skills and knowledge they never knew existed, and that
they felt confident in setting achievable employment goals
with little to no training. With technology, on-line assess-
ments can now be administered and completed within a
few hours, including receiving results. Case management,
however, remains a huge part in participant success in
achieving employment goals and securing employment.
Youth Program Highlights—Ku‘ina Program �
PosT-seCondARy edUCATIonAl oPPoRTUnITIes
The Ku‘ina program is working toward recruiting more
students from the county’s outlying areas of Lanai,
Molokai and Hana. Although the numbers from a recent
two-month outreach campaign in these areas were small,
the Ku‘ina program hopes to enroll more students from
these areas as a result of the outreach efforts.
Some of the outcomes resulting from the high school
outreach efforts include the development of the Mauli
Loa Program and the implementation and execution of a
transition plan for at-risk students, targeting seniors in the
areas of teen pregnancy, ESL, 504, and disability.
mauli loa (“Breath of life”) Program: To address the
drop-out issue at Lahainaluna High School, Ku‘ina
staff presented this tutoring and mentoring program to
the school’s counselors to focus on at-risk seniors. The
four components of the program are: (1) Tutoring in the
subjects of English and math; (2) Mentoring 4–6 hours
per month; (3) Service learning with an organization
(i.e. Habitat for Humanity); and (4) Life and career skills
through an online training program.
In recent achievements, Ku‘ina was able to assist and
graduate 13 students, and all 13 students attained a cre-
dential. Three students graduated with Rn degrees, one
of whom now works for Maui Memorial Medical Center as
a registered nurse. The other two are still deciding if they
want to enter the workforce or continue their education
toward a bachelor’s degree. Four other students graduated
with Liberal Arts degrees: two of them are entering the
Bachelor’s of Education program, another is transferring
to Georgia for her Bachelor’s in Environmental Science,
and the other has found work at UH Maui College as a
Dental Assistant Teacher’s Aid.
As for students achieving long-term educational goals,
three students who attained GEDs a few years ago are still
enrolled at University of Hawaii Maui College. They are
making progress toward their educational goals, and in
a few semesters they too will be earning post-secondary
credentials. Two other students attained certificates in
Sustainable Construction, and both of them are currently
looking for work.
Finally, one of Ku‘ina’s Dental Assisting graduates was hired
as a dental assistant in a private practice. The Ku‘ina staff is
very proud of this student’s efforts and accomplishments.
maui County WoRkFoRCe InvesTmenT BoARd HIGHlIGHTs

18 w i a t i t l e 1 - b a n n u a l p e r f o r m a n c e r e p o r t
SucceSS StorieS : Maui
A student With driveThe highlight of Ku‘ina’s summer program came from a non-traditional automotive student. Initially, the employer had reservations about the student because she was female. After the six-week program, however, the employer was very pleased with the student’s effort and job performance. As a result, the employer hired the student and gave her a dollar-per-hour raise. This is a perfect example of how a program can train a youth and develop an internship site that transi-tions into paid employment.
PRe-voCATIonAl TRAInInG/sUmmeR WoRk exPeRIenCe
Ten students completed a 16-hour pre-vocational training
in the summer of 2011. The Ku‘ina staff used the “A-Game”
curriculum that is widely used in other WIA programs
across the nation. The “A-Game” focuses on seven work-
place values that give the student the knowledge to excel
on the job. All ten students completed the course and the
mastery exam. They attained a certificate of completion
and now have their names in a national database used by
employers to verify the students’ completion of the “A-Game.”
Of the ten “A-Game” participants, four were placed in a
six-week summer work experience program. One student
attained a job on her own.

Throughout the last programming year, the state of
Hawaii has both evaluated current waivers and moved
forward with utilizing new waivers to improve the
workforce development capacity in the state. Although
there is limited funding to implement the waivers, the
local areas and the state Workforce Development system
continue to rely on WIA waivers to provide maximum
flexibility for adult workers, dislocated workers,
incumbent workers, and youth to utilize WIA programs
and services.
After consultation with the local areas, a request was
submitted to extend the duration of these waivers for
another program year:
Waiver of WIA to exempt a state from the requirement •
to provide local area incentive grants;
Waiver of the provision that prescribes a time limit on •
the period of initial eligibility for training providers;
Waiver of WIA requiring that providers of Youth •
program elements be selected on a competitive basis;
Waiver of the required 50 percent employer contribution •
for customized training required in the WIA statute;
Waiver of the 20 percent limit on transferring WIA •
funds between the Adult and Dislocated Worker
Program;
Waiver of the prohibition on the use of Individual •
Training Accounts for older and out-of-school youth;
Waiver of WIA to increase the employer reimbursement •
for on-the-job training.
Furthermore, the WDC also requested a new waiver be
implemented for the state of Hawaii during the program
year:
Waiver to exempt the state from including credential •
attainment outcomes for those who are enrolled in on-
the-job training in the credential performance measure
calculations.
A goal of implementing this new waiver is that smaller
companies are given access to financial resources to
implement on-the-job (“OJT”) programs for new and
existing employees. As with most companies in Hawaii,
employees are trained on company-specific equipment and
for procedures that don’t necessary end with a nationally-
recognized certification of skills learned. This waiver
will allow the One-Stop Centers to offer and promote OJT
without having to be worried about individuals attaining
nationally-recognized certifications.
evAlUATIon oF CURRenT WAIveRs
During the program year, the WDC will periodically
request information on the implementation of waivers at
the local areas. In general, waivers are being executed in
the local areas with a view that they are available tools to
assist companies looking to increase training opportuni-
ties. Waivers focused on youth allow the local areas to
provide the maximum amount of flexibility to the Older
Youth population to have access to WIA programs. A goal
of this flexibility is to increase overall state Older Youth
performance measures with a goal of achieving all Older
Youth goals.
Section three
Waivers and Their Impact on Performance measures
reported expenditurereported Number of Participants Served
Average Annual cost Per Participant
Adult Services $2,000,821 621* $3,221.93
Dislocated Workers $2,432,663 811 $2,999.58
Youth (14–21) $1,841,717 430 $4,283.06
Total $6,275,201 1,862 $3,370.14
Chart 3: Cost per Participant for Three WIA Title 1-B Programs, Py 2010
19
* Total does not include self-service participants

20 w i a t i t l e 1 - b a n n u a l p e r f o r m a n c e r e p o r t
Adults
Performance measure snPl* Hawaii
Results Rating
Entered Employment Rate
50% 67.4% exceeded
Employment Retention Rate
82.1% 88.3% exceeded
Average Earnings
$10,800 $11,550.00 exceeded
Credential/Diploma Rate
55% 60.3% exceeded
Dislocated Workers
Performance measure snPl* Hawaii
Results Rating
Entered Employment Rate
65% 72.9% exceeded
Employment Retention Rate
86% 90.6% exceeded
Average Earnings
$14,750 $15,853.60 exceeded
Credential/Diploma Rate
60% 66.8% exceeded
Older Youth
Performance measure snPl* Hawaii
Results Rating
Entered Employment Rate
40% 50.0% exceeded
Employment Retention Rate
60% 66.7% exceeded
Six Month Earning Increase
$1,750 $3,221.80 exceeded
Credential/Diploma Rate
38% 25.0%Did not
meet 80% of target
Younger Youth
Performance measure snPl* Hawaii
Results Rating
Education Retention Rate
44% 46.2% exceeded
Credential/Diploma Rate
46% 65.7% exceeded
Skill Attainment Rate
71% 87.5% exceeded
Customer Satisfaction
Performance measure snPl* Hawaii
Results Rating
Employers 82% 97.68% exceeded
Participants 72% 86.44% exceeded* State Negotiated Performance Levels
Py 2010 statewide Performance summary

a ppen d i x :
WIA Performance Tables
Authorized official certifying accuracy and completeness of data:
Elaine Young, Administrator
Workforce Development Division
Hawaii Department of Labor and Industrial Relations

22 w i a t i t l e 1 - b a n n u a l p e r f o r m a n c e r e p o r t
Table A: Workforce Investment Act Customer satisfaction Results (only Half-year Results)
Negotiated Performance Level (AcSI)
Actual Performance Level (AcSI)
Number of Surveys
completed
Number of customers eligible
for the Survey*
No. of customers Included in the Sample
response rate
Participants 72% 86.44% 55 775 82 67.1%
employers 82% 97.68% 29 1,221 45 64.4%
Table B: Adult Program Results
Negotiated Performance Level Actual Performance Level
entered employment rate 50% 67.4%155
230
employment retention rate 82.1% 88.3%106
120
Average earnings $10,800.00 $11,550.00$1,166,555
101
employment and credential rate 55% 60.3%85
141
Table C: outcomes for Adult special Populations
Public Assistance recipients receiving
Intensive or Training Services Veterans
Individuals with Disabilities older Individuals
entered employment
rate50.5%
5150%
350%
258.8%
10
101 6 4 17
employment retention rate 84.1%
37100%
40%
070%
7
44 4 2 10
Average earnings $9,699.90
$358,897$11,585.00
$34,755–
0$3,462.20
$20,773
37 3 0 6
employment and credential rate 63.8%
4433.3%
1100%
175%
3
69 3 1 4
* Whole-year numbers

S t a t e o f H a w a i i , p y 2 0 1 0 ( J u l y 2 0 1 0 – J u n e 2 0 1 1 ) 23
Table d: other outcome Information for the Adult Program
Individuals Who received Training Services
Individuals Who only received core and Intensive Services
entered employment rate 61.1%55
71.4%100
90 140
employment retention rate 88.7%63
87.8%43
71 49
Average earnings $12,629.00$757,739
$9,971.10$408,816
60 41
Table e: dislocated Worker Program Results
Negotiated Performance Level Actual Performance Level
entered employment rate 65% 72.9%285
391
employment retention rate 86% 90.6%232
256
Average earnings $14,750.00 $15,853.60$3,471,941
219
employment and credential rate 60% 66.8%151
226
Table F: outcomes for dislocated Worker special Populations
VeteransIndividuals with
Disabilities older IndividualsDisplaced
Homemakers
entered employment
rate67.9%
1950%
157.7%
45100%
1
28 2 78 1
employment retention rate 88.9%
16100%
188.1%
370%
0
18 1 42 1
Average earnings $20,055.40
$280,776$34,385
$34,385$12,689.80
$469,521–
0
14 1 37 0
employment and credential rate 60%
6–
041.5%
17100%
1
10 0 41 1

24 w i a t i t l e 1 - b a n n u a l p e r f o r m a n c e r e p o r t
Table G: other outcome Information for the dislocated Worker Program
Individuals Who received Training Services
Individuals Who only received core and Intensive Services
entered employment rate 74.7%168
70.5%117
225 166
employment retention rate 88.6%124
93.1%108
140 116
Average earnings $15,347.30$1,780,287
$16,423.80$1,691,654
116 103
Table H.1: youth (14–21) Program Results
Negotiated Performance Level Actual Performance Level
Placement in employment or education – 45.9%
78
170
Attainment of Degree or certificate – 63.0%
102
162
Literacy and Numeracy Gains – 27.4%46
168
Table H.2: older youth (19–21) Program Results
Negotiated Performance Level Actual Performance Level
entered employment rate 40% 57.1%4
7
employment retention rate 60% 66.7%4
6
earnings change $1,750.00 $3,221.80$16,109
5
credential rate 38% 33.3%3
9

S t a t e o f H a w a i i , p y 2 0 1 0 ( J u l y 2 0 1 0 – J u n e 2 0 1 1 ) 25
Table I: outcomes for older youth special Populations
Public Assistance recipients Veterans
Individuals with Disabilities
out-of-School Youth
entered employment
rate75%
3–
0–
060%
3
4 0 0 5
employment retention rate 0%
0–
0100%
175%
3
1 0 1 4
earnings change –
0–
0$182.00
$182$3,981.50
$15,926
0 0 1 4
credential rate 50%
2–
0–
028.6%
2
4 0 0 7
Table J: younger youth (14–18) Program Results
Negotiated Performance Level Actual Performance Level
Skill Attainment rate 71% 87.5%244
279
Youth Diploma or equivalent rate 46% 65.7%65
99
retention rate 44% 46.2%104
225
Table k: outcomes for younger youth special Populations
Public Assistance recipients
Individuals with Disabilities
out-of-School Youth
Skill Attainment rate 89.4%93
64.5%20
88.1%171
104 31 194
Youth Diploma or equivalent Attainment rate 54.3%
1977.8%
1470.0%
42
35 18 60
retention rate 35.5%27
42.2%19
42.5%68
76 45 160
26 w i a t i t l e 1 - b a n n u a l p e r f o r m a n c e r e p o r t
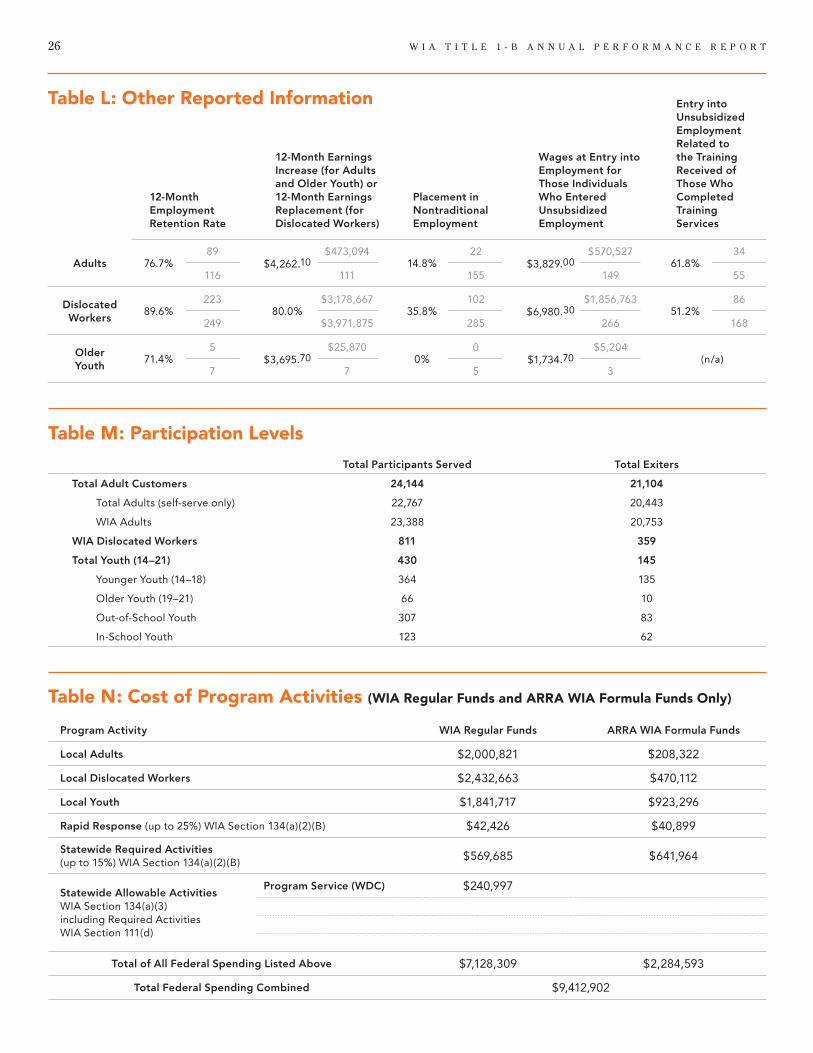
Table m: Participation levels
Total Participants Served Total exiters
Total Adult customers 24,144 21,104
Total Adults (self-serve only) 22,767 20,443
WIA Adults 23,388 20,753
WIA Dislocated Workers 811 359
Total Youth (14–21) 430 145
Younger Youth (14–18) 364 135
Older Youth (19–21) 66 10
Out-of-School Youth 307 83
In-School Youth 123 62
12-Month employment retention rate
12-Month earnings Increase (for Adults and older Youth) or 12-Month earnings replacement (for Dislocated Workers)
Placement in Nontraditional employment
Wages at entry into employment for Those Individuals Who entered unsubsidized employment
entry into unsubsidized employment related to the Training received of Those Who completed Training Services
Adults 76.7%89
$4,262.10$473,094
14.8%22
$3,829.00$570,527
61.8%34
116 111 155 149 55
Dislocated Workers
89.6%223
80.0%$3,178,667
35.8%102
$6,980.30$1,856,763
51.2%86
249 $3,971,875 285 266 168
older Youth
71.4%5
$3,695.70$25,870
0%0
$1,734.70$5,204
(n/a)7 7 5 3
Table l: other Reported Information
Table n: Cost of Program Activities (WIA Regular Funds and ARRA WIA Formula Funds only)
Program Activity WIA regular Funds ArrA WIA Formula Funds
Local Adults $2,000,821 $208,322
Local Dislocated Workers $2,432,663 $470,112
Local Youth $1,841,717 $923,296
rapid response (up to 25%) WIA Section 134(a)(2)(B) $42,426 $40,899
Statewide required Activities (up to 15%) WIA Section 134(a)(2)(B) $569,685 $641,964
Statewide Allowable Activities WIA Section 134(a)(3) including Required Activities WIA Section 111(d)
Program Service (WDc) $240,997
Total of All Federal Spending Listed Above $7,128,309 $2,284,593
Total Federal Spending combined $9,412,902

S t a t e o f H a w a i i , p y 2 0 1 0 ( J u l y 2 0 1 0 – J u n e 2 0 1 1 ) 27
Local Area Name: oahu
Total Participants
Served
Adults 12,279
Dislocated Workers 423
Older Youth (19–21) 25
Younger Youth (14–18) 168
ETA Assigned # 15005
Total exiters
Adults 11,299
Dislocated Workers 201
Older Youth (19–21) 3
Younger Youth (14–18) 61
Negotiated Performance Level
Actual Performance Level
customer SatisfactionProgram Participants 72% –
Employers 82% –
entered employment rates
Adults 50% 77.1%
Dislocated Workers 65% 76.4%
Older Youth (19–21) 40% 33.3%
retention rates
Adults 82.1% 89.8%
Dislocated Workers 86% 91.4%
Older Youth (19–21) 60% 100%
Younger Youth (14–18) 44% 38.8%
Average earningsAdults $10,800.00 $13,122.60
Dislocated Workers $14,750.00 $16,610.10
Six Months earnings Increase
Older Youth (19–21) $1,750.00 $3,544.30
credential/Diploma rates
Adults 55% 61.1%
Dislocated Workers 60% 68.3%
Older Youth (19–21) 38% 33.3%
Younger Youth (14–18) 46% 83.0%
Skill Attainment rate Younger Youth (14–18) 71% 89.9%
Placement in employment or education
Youth (14–21) – 30.7%
Attainment of Degree or certificate
Youth (14–21) – 66.0%
Literacy or Numeracy Gains Youth (14–21) – 30.6%
overall status of local Performance:Note: Two customer satisfaction outcomes not included.
*met within 80% of target level, **between 80% and 100%, ***over 100%
Not met* Met** exceeded***
0 3 12
Table o.1: state and local Performance—oahu

28 w i a t i t l e 1 - b a n n u a l p e r f o r m a n c e r e p o r t
Local Area Name: Hawaii County
Total Participants
Served
Adults 6,433
Dislocated Workers 285
Older Youth (19–21) 15
Younger Youth (14–18) 134
ETA Assigned # 15010
Total exiters
Adults 5,533
Dislocated Workers 119
Older Youth (19–21) 3
Younger Youth (14–18) 50
Negotiated Performance Level
Actual Performance Level
customer SatisfactionProgram Participants 72% –
Employers 82% –
entered employment rates
Adults 50% 50.0%
Dislocated Workers 65% 66.1%
Older Youth (19–21) 40% 100%
retention rates
Adults 82.1% 87.0%
Dislocated Workers 86% 89.1%
Older Youth (19–21) 60% 0%
Younger Youth (14–18) 44% 58.7%
Average earningsAdults $10,800.00 $9,761.80
Dislocated Workers $14,750.00 $14,173.90
Six Months earnings Increase
Older Youth (19–21) $1,750.00 $0.00
credential/Diploma rates
Adults 55% 62.5%
Dislocated Workers 60% 66.7%
Older Youth (19–21) 38% 66.7%
Younger Youth (14–18) 46% 54.5%
Skill Attainment rate Younger Youth (14–18) 71% 93.2%
Placement in employment or education
Youth (14–21) – 74.4%
Attainment of Degree or certificate
Youth (14–21) – 76.7%
Literacy or Numeracy Gains Youth (14–21) – 27.8%
overall status of local Performance:Note: Two customer satisfaction outcomes not included.
*met within 80% of target level, **between 80% and 100%, ***over 100%
Not met* Met** exceeded***
2 3 10
Table o.2: state and local Performance—Hawaii County

S t a t e o f H a w a i i , p y 2 0 1 0 ( J u l y 2 0 1 0 – J u n e 2 0 1 1 ) 29
Local Area Name: kauai
Total Participants
Served
Adults 2,723
Dislocated Workers 56
Older Youth (19–21) 1
Younger Youth (14–18) 41
ETA Assigned # 15020
Total exiters
Adults 2,196
Dislocated Workers 19
Older Youth (19–21) 2
Younger Youth (14–18) 17
Negotiated Performance Level
Actual Performance Level
customer SatisfactionProgram Participants 72% –
Employers 82% –
entered employment rates
Adults 50% 100%
Dislocated Workers 65% 58.3%
Older Youth (19–21) 40% 0%
retention rates
Adults 82.1% 71.4%
Dislocated Workers 86% 75.0%
Older Youth (19–21) 60% 0%
Younger Youth (14–18) 44% 68.0%
Average earningsAdults $10,800.00 $13,172.60
Dislocated Workers $14,750.00 $19,649.30
Six Months earnings Increase
Older Youth (19–21) $1,750.00 $0.00
credential/Diploma rates
Adults 55% 100%
Dislocated Workers 60% 0%
Older Youth (19–21) 38% 0%
Younger Youth (14–18) 46% 46.7%
Skill Attainment rate Younger Youth (14–18) 71% 75.6%
Placement in employment or education
Youth (14–21) – 60.0%
Attainment of Degree or certificate
Youth (14–21) – 39.1%
Literacy or Numeracy Gains Youth (14–21) – 7.7%
overall status of local Performance:Note: Two customer satisfaction outcomes not included.
*met within 80% of target level, **between 80% and 100%, ***over 100%
Not met* Met** exceeded***
5 3 7
Table o.3: state and local Performance—kauai

30 w i a t i t l e 1 - b a n n u a l p e r f o r m a n c e r e p o r t
Local Area Name: maui County
Total Participants
Served
Adults 1,953
Dislocated Workers 46
Older Youth (19–21) 25
Younger Youth (14–18) 21
ETA Assigned # 15015
Total exiters
Adults 1,725
Dislocated Workers 17
Older Youth (19–21) 2
Younger Youth (14–18) 7
Negotiated Performance Level
Actual Performance Level
customer SatisfactionProgram Participants 72% –
Employers 82% –
entered employment rates
Adults 50% 70.0%
Dislocated Workers 65% 85.7%
Older Youth (19–21) 40% 0%
retention rates
Adults 82.1% 100%
Dislocated Workers 86% 91.7%
Older Youth (19–21) 60% 100%
Younger Youth (14–18) 44% 42.9%
Average earningsAdults $10,800.00 $8,165.70
Dislocated Workers $14,750.00 $13,205.00
Six Months earnings Increase
Older Youth (19–21) $1,750.00 $5,475.00
credential/Diploma rates
Adults 55% 0%
Dislocated Workers 60% 33.3%
Older Youth (19–21) 38% 0%
Younger Youth (14–18) 46% 25.0%
Skill Attainment rate Younger Youth (14–18) 71% 58.3%
Placement in employment or education
Youth (14–21) – 60.0%
Attainment of Degree or certificate
Youth (14–21) – 44.4%
Literacy or Numeracy Gains Youth (14–21) – 38.1%
overall status of local Performance:Note: Two customer satisfaction outcomes not included.
*met within 80% of target level, **between 80% and 100%, ***over 100%
Not met* Met** exceeded***
6 3 6
Table o.4: state and local Performance—maui County

Private sector
MARIAn E. TSUJI, WDC Chair
President and CEO, Lanakila Pacific
JOnATHAn CHUn
Attorney, Belles Graham
Proudfood & Wilson
ALLEn CHUnG
President, C Three Consulting LLC
VICKY GAYnOR
Business Dev. Manager,
Environet Inc.
MICHAEL GLEASOn
President & CEO, the ARC of Hilo
CARL HInSOn
Director of Workforce Development,
Hawaii Pacific Health
PAUL RICHARDS
Executive Director,
native Hawaiian Education Council
AL LARDIZABAL
Laborers’ International Union
of north America Local 368
STEVE LUPKES
Research Station Manager,
BASF Kauai
ROBERT MARTIn
Attorney
HAROLD McDERMOTT
Assistant Training Coordinator,
Plumbers and Fitters Union Local
675
nAnI MEDEIROS
Policy and Public Affairs Director,
Hawaii Primary Care Association
AnTOnIO SAUGIBO
Vice President, Account
Management, Sales, Hawaii Medical
Services Association
DR. ARUn SAVARA
CEO, The Maids
MARCIA TAIRA
Director of Human Resources,
Oceanic Time Warner Cable
JEFF THOMPSOn
Vice President & Branch Manager,
Ledcor Construction
JAMES TOLLEFSOn
President & CEO, Chamber of
Commerce of Hawaii
LESLIE WILKInS
Vice President and Program Director,
Maui Economic Development Board Inc.
Public sector
nEIL ABERCROMBIE
Governor, State of Hawaii
DWIGHT TAKAMInE
Director, Department of Labor and
Industrial Relations
M.R.C. GREEnWOOD
President, University of Hawaii System
KATHRYn MATAYOSHI
Superintendant,
Department of Education
BERnARD P. CARVALHO, JR.
Mayor, County of Kauai
ALAn ARAKAWA
Mayor, County of Maui
CLAYTOn HEE
State Senator
JILL TOKUDA
State Senator
KARL RHOADS
State Representative
RYAn YAMAnE
State Representative
RICHARD LIM
Director, Department of Business,
Economic Development and Tourism
PAT McMAnAMAn
Director, Department of
Human Services
Workforce development Council staff
James Hardway,
Executive Director
Eric Butler,
SESP Program Specialist
Ruth Caldwell,
WIA Program Specialist
Stan Fichtman,
Employment Analyst
Anna Powell,
Employment Analyst
Jillian Yasutake, SESP
Senior Program Specialist
