working for queensland employee opinion survey 2015
TRANSCRIPT

Queensland Public SectorHIGHLIGHT REPORT
01 Executive scorecard02 Workplace outcomes and drivers of outcomes03 Workplace outcomes by agency04 Queensland public sector workplace climate at a glance05 Workplace climate by type of agency at a glance06 More about workplace climate in the public sector07 More about workplace climate by the type of agency08 Most changed since 201409 More detail on intention to leave10 Demographic comparison11 Perceptions of executive capabilities in the public sector12 Queensland public sector values13 Comparisons with external benchmarks14 Appendix A – Workplace factors and outcomes15 Appendix B – Further results16 Appendix C – Response rate by agency17 Appendix D – How to interpret this report
Report Content Response Rate:
39%Returned Surveys:
87,102
PurposeThe Highlight Report presents key results from the 2015 Working for Queensland Employee Opinion Survey, which was conducted from late April to early May 2015. Results reflect the views of respondents from across the sector.
Note on the response rateThe displayed response rate was calculated using statistical workforce data (Minimum Obligatory Human Resource Information) for March 2015.
www.orcinternational.com.auPage 1
Queensland Public Sector2015 Working for Queensland Employee Opinion Survey

HIGHLIGHT REPORT
Queensland Public Sector 2013 2014
KEY
2015
01. Executive scorecard
Workplace Outcomes 2015 Outcomes Over Time Key Drivers 2015 and Over Time
Agency Engagement
% positive change since 2014
+42013 2014 2015
Top 3 Drivers % Positive
Organisational leadership
45%50%53%
Learning and development
49%54%57%
Role clarity and goal alignment
87%89%89%
Job engagement and satisfaction
% positive change since 2014
+12013 2014 2015
Top 3 Drivers % Positive
Job empowerment
67%70%72%
Role clarity and goal alignment
87%89%89%
Learning and development
49%54%57%
Intention to leave% positive indicates percentage not intending to leave in the next 12 months
% positive change since 2014
+12013 2014 2015
Top 3 Drivers % Positive
Learning and development
49%54%57%
Job empowerment
67%70%72%
Role clarity and goal alignment
87%89%89%
www.orcinternational.com.auPage 2
Queensland Public Sector2015 Working for Queensland Employee Opinion Survey

HIGHLIGHT REPORT
Queensland Public Sector 01. Executive scorecard (continued)
Agency engagement.• In 2015, agency engagement reached 59%
positive.• This is an increase of 10% points since 2013.• This improvement is underpinned by
improvements in associated items:o I would recommend my organisation as a great place to work: +5% points;o I am proud to tell others I work for my organisation: +4% points;o My organisation motivates me to help achieve its objectives: +4% points; ando My organisation inspires me to do the best in my job: +4% points.
Collaboration.• Collaboration both within workgroups and across
the Sector remains a strength.• As was the case in 2014, in excess of ¾ of
employees responded positively to the presence of:
o Supportive, cooperative, respectful and effective workgroups (78%); ando Effective collaboration between workgroups and organisations within and outside the Queensland Public Sector (78%).
Line management• Employees’ perception of their relationship with
their line manager (72%) is a strength for the Queensland Public Sector.
• Over ¾ of respondents provided a positive response to the following:
o My manager treats employees with dignity and respect (79%);o My manager listens to what I have to say (78%); ando My manager demonstrates honesty and integrity (78%).
CELEBRATE
Continue to build confidence in organisational leadership.
• Organisational leadership is, by far, the strongest driver of agency engagement.
• Organisational leadership has continued to improve over the past three years, with a 3% point increase over the past year (53%).
• Performance in organisational leadership remains in the bottom third of all factors included in the WfQ survey.
Accessibility and relevance of learning and development opportunities.
• Learning and development is the strongest driver of intention to leave.
• Learning and development is a top 3 driver of agency engagement and job engagement and satisfaction.
• Learning and development, generally, has improved over the past three years (+8% to 57% positive).
• However, 56% of respondents replied either neutrally or negatively to being satisfied with the opportunities available for career development.
Workload and health.• As was the case in 2014, workload and health is
the lowest scoring factor (37% positive).• High levels of negative perceptions continue to
dominate the items within this factor.o 40% feel overloaded with work;o 30% feel burnt out by their work; ando 26% feel that work has a negative impact on their health.
IMPROVE
Job empowerment: authority, information and tools.• Empowerment is the strongest driver of job
engagement and satisfaction and also influences intention to leave.
• Overall, perceptions of job empowerment are reasonably strong at 72% positive (+5% points since 2013).
• However, having choice, information or tools to do the job effectively may be an issue.
o Choice 34% neutral or negative;o Tools 32% neutral or negative; ando Information 33% neutral or negative.
Efficiency and Resources.• 41% feel that approval processes are excessive.
o Only 19% feel approval processes are not excessive.
• 49% feel there is too much red tape.o Only 18% feel there is not too much red tape.
• High negative perceptions around these items will negatively impact perceptions of empowerment and workload and burnout.
Barriers to innovation.• Innovation is a prominent theme in discussions of
cultural aspirations across the Queensland Public Sector.
• Innovation is highly correlated with empowerment, leadership, trust, learning and development and performance management.
• 55% of respondents indicated that management was willing to act on suggestions to improve the way things are done.
• 58% felt their organisation was open to new ideas• 59% indicated that their workgroup used research
and expertise to identify better practice.
INVESTIGATE
www.orcinternational.com.auPage 3
Queensland Public Sector2015 Working for Queensland Employee Opinion Survey

HIGHLIGHT REPORT
Queensland Public Sector02. Workplace outcomes and drivers of outcomes
PurposeThis section provides an overview of the sector’s workplace outcomes and the top three drivers of these outcomes. Understanding this information is critical in driving workplace improvement.
Note that the drivers for the sector may differ from those for any individual agency. *This figure has been rounded up for the purposes of consistency of publication.
Agency Engagement Top 3 Drivers % Positive % Change
Organisational leadership +3*
% positive change since 2014
Learning and development +3
+4 Role clarity and goal alignment 0
Job engagement and satisfaction Top 3 Drivers % Positive % Change
Job empowerment +2
% positive change since 2014
Role clarity and goal alignment 0
+1 Learning and development +3
Intention to leave Top 3 Drivers % Positive % Change
% positive indicates percentage not intending to leave in the next 12 months
Learning and development +3
% positive change since 2014
Job empowerment +2
+1 Role clarity and goal alignment 0
www.orcinternational.com.auPage 4
Queensland Public Sector2015 Working for Queensland Employee Opinion Survey

HIGHLIGHT REPORT
Queensland Public Sector03. Workplace outcomes by agency
PurposeThis section provides an overview of the Queensland Public Sector workplace outcomes by agency and their quintile position within the sector. Understanding this information is critical in driving workplace improvement.
Agency engagementJob engagement and
satisfaction Intention to leave
DepartmentsNumber of
Returns % Positive Quintile % Positive Quintile % Positive Quintile
Department of Aboriginal & Torres Strait Islander Partnerships 251 57% 3 76% 4 47% 5
Department of Agriculture & Fisheries 1367 56% 4 80% 3 65% 2
Department of Communities, Child Safety & Disability Services 4117 60% 3 81% 2 63% 2
Department of Education & Training 21517 69% 1 85% 1 74% 1
Department of Energy and Water Supply 185 50% 5 74% 5 46% 5
Department of Environment & Heritage Protection 874 62% 2 79% 3 62% 3
Department of Housing and Public Works 2518 55% 4 77% 4 59% 3
Department of Infrastructure, Local Government & Planning 91 47% 5 75% 5 46% 5
Department of Justice & Attorney-General 5999 56% 4 79% 3 63% 2
Department of National Parks, Sport & Racing 952 67% 2 79% 3 64% 2
Department of Natural Resources & Mines 1915 53% 4 76% 4 61% 3
Department of the Premier and Cabinet 588 69% 1 82% 2 55% 4
Department of Science, Information Technology and Innovation 1956 45% 5 71% 5 52% 4
Department of State Development 720 63% 2 80% 2 57% 4
Department of Tourism Major Events Small Business & Commonwealth Games 107 69% 1 80% 3 57% 3
Department of Transport & Main Roads 5784 57% 3 77% 4 63% 2
Queensland Fire and Emergency Services 866 70% 1 85% 1 76% 1
Queensland Police Service 4851 57% 3 78% 4 75% 1
Queensland Treasury 920 59% 3 79% 3 56% 4
www.orcinternational.com.auPage 5
Queensland Public Sector2015 Working for Queensland Employee Opinion Survey

HIGHLIGHT REPORT
Queensland Public Sector 03. Workplace outcomes by agency (continued)
PurposeThis section provides an overview of the Queensland Public Sector workplace outcomes by agency and their quintile position within the sector. Understanding this information is critical in driving workplace improvement.
Agency engagementJob engagement and
satisfaction Intention to leave
Public Service OfficesNumber of
Returns % Positive Quintile % Positive Quintile % Positive Quintile
Anti-Discrimination Commission Queensland 32 85% 1 90% 1 70% 1
Electoral Commission Queensland 43 49% 5 77% 4 49% 5
Inspector-General Emergency Management 22 71% 1 73% 5 32% 5
Legal Aid Queensland 218 69% 1 86% 1 71% 1
Office of the Health Ombudsman 97 55% 4 70% 5 40% 5
Office of the Information Commissioner 35 67% 1 80% 3 51% 4
Public Safety Business Agency 1495 38% 5 70% 5 50% 4
Public Service Commission 67 73% 1 83% 1 36% 5
Public Trust Office 417 49% 5 72% 5 51% 4
QAGOMA 244 68% 1 77% 4 56% 4
QLeave 50 55% 4 79% 3 55% 4
Queensland Audit Office 139 67% 2 79% 3 48% 5
Queensland Family & Child Commission 38 57% 3 70% 5 41% 5
Queensland Museum 162 60% 2 74% 5 57% 4
Queensland Reconstruction Authority 63 89% 1 89% 1 62% 2
State Library Queensland 279 66% 2 84% 1 61% 3
Trade and Investment Queensland 60 48% 5 76% 4 38% 5
www.orcinternational.com.auPage 6
Queensland Public Sector2015 Working for Queensland Employee Opinion Survey

HIGHLIGHT REPORT
Queensland Public Sector 03. Workplace outcomes by agency (continued)
PurposeThis section provides an overview of the Queensland Public Sector workplace outcomes by agency and their quintile position within the sector. Understanding this information is critical in driving workplace improvement.
Agency engagementJob engagement and
satisfaction Intention to leave
Queensland HealthNumber of
Returns % Positive Quintile % Positive Quintile % Positive Quintile
Cairns & Hinterland Hospital & Health Service 1256 55% 4 82% 2 69% 1
Central Queensland Hospital & Health Service 1205 46% 5 78% 4 62% 3
Central West Hospital and Health Service 200 63% 2 84% 1 56% 4
Children’s Health Queensland Hospital and Health Service 1163 52% 4 76% 4 61% 3
Darling Downs Hospital & Health Service 2235 59% 3 81% 2 71% 1
Department of Health 4452 49% 5 75% 5 58% 3
Gold Coast Hospital and Health Service 2715 60% 2 81% 2 72% 1
Mackay Hospital and Health Service 696 58% 3 83% 1 64% 2
Metro North Hospital and Health Service 2629 53% 4 78% 3 63% 2
Metro South Hospital and Health Service 2143 61% 2 80% 2 68% 2
North West Hospital and Health Service 195 58% 3 82% 2 57% 3
Queensland Ambulance Service 1698 58% 3 81% 2 70% 1
South West Hospital and Health Service 360 62% 2 83% 1 62% 3
Sunshine Coast Hospital and Health Service 2189 61% 2 84% 1 74% 1
Torres and Cape Hospital & Health Service 201 40% 5 77% 4 59% 3
Townsville Hospital and Health Service 2431 54% 4 79% 3 67% 2
West Moreton Hospital and Health Service 1536 55% 4 81% 2 66% 2
Wide Bay Hospital and Health Service 759 57% 3 81% 2 69% 1
www.orcinternational.com.auPage 7
Queensland Public Sector2015 Working for Queensland Employee Opinion Survey

HIGHLIGHT REPORT
Queensland Public SectorAt least 5 percent GREATER
At least 5 percent LESS
KEY
04. Queensland public sector workplace climate at a glance
PurposeThis section provides a more in-depth understanding of factor level results at the public sector level for 2015, 2014 and 2013. *This figure has been rounded up for the purposes of consistency of publication.
Response Scale (%) % Positive vs 2014 vs 2013
Range of all
agenciesPositive Neutral Negative
Workplace outcomes Agency engagement 59 27 14 59% +4 +10 38 - 89
Job engagement and satisfaction 80 12 8 80% +1 +4 70 - 90
Intention to leave 66 23 11 66% +1 +5 32 - 76
Job Factors Role clarity and goal alignment 89 7 4 89% 0 +1 70 - 96
Job empowerment 72 15 13 72% +2 +5 57 - 91Workload and health % positive indicates those who have limited to no issues with workload and health 37 31 32 37% +3 +5 29 - 70
Learning and development 57 24 19 57% +3 +8 21 - 77
Performance assessment 56 24 19 56% +4 +7 17 - 76
Workgroup factors My workgroup 78 14 8 78% +1 +2 67 - 95Collaboration Excludes respondents who indicated collaboration questions were ‘not applicable’ 78 17 5 78% 0 +2 58 - 94
Supervision and leadership factors My manager 72 16 12 72% +1 +5 56 - 92
My senior manager 61 23 16 61% +2 +6 41 - 92
Organisational leadership 53 28 19 53% +3* +8 32 - 89
Workplace and organisational factors Decision making 52 25 22 52% -3 +2 28 - 83
Workplace change 44 31 24 44% +4 +11 23 - 79
Workplace fairness 50 25 25 50% +2 +7 23 - 71
Anti-discrimination 71 22 6 71% +1 +4 52 - 98
Organisational trust 49 26 25 49% +5 +10 23 - 78
Innovation 62 23 15 62% +3 +6 45 - 91
www.orcinternational.com.auPage 8
Queensland Public Sector2015 Working for Queensland Employee Opinion Survey

HIGHLIGHT REPORT
Queensland Public SectorAt least 5 percent GREATER than sector
At least 5 percent LESS than sector
KEY
05. Workplace climate by type of agency at a glance
PurposeThis section provides a more in-depth understanding of factor level results by type of agency.
This section shows the % positive scores for divisions within the agency
Sector% Positive Departments Public Service
Offices Queensland Health
Number of Respondents 87,102 55578 3461 28063
Workplace outcomes Agency engagement 59% 62% 52% 55%
Job engagement and satisfaction 80% 81% 75% 80%
Intention to leave 66% 67% 52% 66%
Job Factors Role clarity and goal alignment 89% 89% 85% 89%
Job empowerment 72% 73% 67% 70%
Workload and health % positive indicates those who have limited to no issues with workload and health
37% 37% 39% 36%
Learning and development 57% 59% 46% 55%
Performance assessment 56% 58% 49% 55%
Workgroup factors My workgroup 78% 80% 78% 73%
Collaboration Excludes respondents who indicated collaboration questions were ‘not applicable’
78% 79% 76% 77%
Supervision and leadership factors
My manager 72% 74% 70% 68%
My senior manager 61% 65% 57% 53%
Organisational leadership 53% 57% 46% 45%
Workplace and organisational factors
Decision making 52% 56% 45% 46%
Workplace change 44% 46% 37% 42%
Workplace fairness 50% 52% 44% 46%
Anti-discrimination 71% 72% 67% 71%
Organisational trust 49% 51% 44% 46%
Innovation 62% 64% 57% 59%
www.orcinternational.com.auPage 9
Queensland Public Sector2015 Working for Queensland Employee Opinion Survey

HIGHLIGHT REPORT
Queensland Public SectorAt least 5 percent GREATER
At least 5 percent LESS
KEY
06. More about workplace climate in the public sector
PurposeThis section focuses on questionnaire items that are not included in the factor results.
For statistical reasons, these items are excluded from the factors, but are important in the context of understanding workplace improvement.
These non-factor results are presented at the sector level and are tracked over time.
Response Scale (%) % Positive vs 2014Positive Neutral Negative
Productivity and effectiveness
My workgroup is adequately resourced to deliver quality services
51 22 28 51% +3
Approval processes at my workplace are excessive % positive indicates those who “strongly disagree” or “disagree” with the statement that approval processes are excessive.
19 40 41 19% +1
Disruptions and/or noise at my workplace make it hard to get things done % positive indicates those who “strongly disagree” or “disagree” with the statement that disruption/noise makes it hard.
48 26 26 48% +1
Satisfaction with physical working environment Percentage responded with ‘very satisfied’ or ‘satisfied’
70 15 14 70% 0
There is too much ‘red tape’ in my work % positive indicates those who “strongly disagree” or “disagree” with the statement that there is too much “red tape”.
18 33 49 18% +1
My organisation uses my time efficiently 54 26 20 54% +3
Work-life balanceMy workplace culture supports people to achieve a good work/life balance
60 20 19 60% +6
Used flexible workplace option % positive indicates those that used at least one of six flexible work options
36 - 64 36% +1
Satisfaction with work-life balance % positive indicates those who responded with “very satisfied” or “satisfied”
62 19 20 62% +2
Harassment and bullying Bullying is not tolerated in my workplace 66 17 17 66% +1
Witnessed harassment/bullying in the last 12 months Percentage responded with ‘No’
61 7 32 61% 0
Experienced harassment/bullying in the last 12 months Percentage responded with ‘No’
78 5 18 78% +1
www.orcinternational.com.auPage 10
Queensland Public Sector2015 Working for Queensland Employee Opinion Survey

HIGHLIGHT REPORT
Queensland Public Sector At least 5 percent GREATER
At least 5 percent LESS
KEY
06. More about workplace climate in the public sector (continued)
PurposeThis section focuses on questionnaire items that are not included in the factor results.
For statistical reasons, these items are excluded from the factors, but are important in the context of understanding workplace improvement.
These non-factor results are presented at the sector level and are tracked over time.
Response Scale (%) % Positive vs 2014Positive Neutral Negative
Performance reviewReceived scheduled performance feedback in the last 12 months Percentage responded with ‘Yes’
63 4 33 63% +3
Has helped/will help improve performance Percentage based on those who responded with ‘Yes’ to item above
62 27 11 62% +5
Career and reward My current job will help my career aspirations 53 30 16 53% +2
I feel valued for the work I do 56 23 21 56% +5
I am fairly paid for the work I do 53 22 25 53% +5
Workplace safetyThere is adequate focus on workplace safety at my workplace
80 14 6 80% +2
People in my workgroup are committed to workplace safety
84 13 3 84% 0
OtherSatisfaction with degree to which your work is interesting/challenging Percentage responded with ‘very satisfied’ or ‘satisfied’
77 14 9 77% +1
I agree with the way my organisation tries to achieve its objectives
60 23 17 60% +3
My work makes a valuable contribution to the Qld public
87 9 3 87% 0
I feel my job is secure 51 24 25 51% +12
Satisfaction with your work location Percentage responded with ‘very satisfied’ or ‘satisfied’
81 12 7 81% +1
My workplace has undergone significant change in the past 12 months
55 31 14 55% -4
www.orcinternational.com.auPage 11
Queensland Public Sector2015 Working for Queensland Employee Opinion Survey

HIGHLIGHT REPORT
Queensland Public SectorAt least 5 percent GREATER than sector
At least 5 percent LESS than sector
KEY
07. More about workplace climate by the type of agency
PurposeThis section shows the breakdown of workforce climate results by type of agency for non-factor items.
For statistical reasons, these items are excluded from the factors, but are important in the context of understanding workplace improvement.
This sections shows the % positive scores for divisions within the agency.
Sector % Positive Departments Public Service
Offices Queensland Health
Number of Respondents 87,102 55578 3461 28063Divisions with less than 10 respondents are not displayed
Productivity and effectiveness
My workgroup is adequately resourced to deliver quality services 51% 52% 43% 49%
Approval processes at my workplace are excessive % positive indicates those who “strongly disagree” or “disagree” with the statement that approval processes are excessive.
19% 21% 22% 15%
Disruptions and/or noise at my workplace make it hard to get things done % positive indicates those who “strongly disagree” or “disagree” with the statement that disruption/noise makes it hard.
48% 49% 49% 46%
Satisfaction with physical working environment Percentage responded with ‘very satisfied’ or ‘satisfied’ 70% 72% 68% 67%
There is too much ‘red tape’ in my work % positive indicates those who “strongly disagree” or “disagree” with the statement that there is too much “red tape”.
18% 18% 23% 17%
My organisation uses my time efficiently 54% 55% 47% 52%
Work-life balance My workplace culture supports people to achieve a good work/life balance 60% 62% 62% 56%
Used flexible workplace option % positive indicates those that used at least one of six flexible work options 36% 36% 60% 32%
Satisfaction with work-life balance % positive indicates those who responded with “very satisfied” or “satisfied” 62% 62% 65% 60%
Harassment and bullying
Bullying is not tolerated in my workplace 66% 70% 63% 59%Witnessed harassment/bullying in the last 12 months Percentage responded with ‘No’ 61% 65% 62% 51%
Experienced harassment/bullying in the last 12 months Percentage responded with ‘No’
78% 81% 79% 71%
www.orcinternational.com.auPage 12
Queensland Public Sector2015 Working for Queensland Employee Opinion Survey

HIGHLIGHT REPORT
Queensland Public SectorAt least 5 percent GREATER than sector
At least 5 percent LESS than sector
KEY
07. More about workplace climate by the type of agency (continued)
PurposeThis section shows the breakdown of workforce climate results by type of agency for non-factor items.
For statistical reasons, these items are excluded from the factors, but are important in the context of understanding workplace improvement.
This sections shows the % positive scores for divisions within the agency.
Sector % Positive Departments Public Service
Offices Queensland Health
Number of Respondents 87102 55578 3461 28063Divisions with less than 10 respondents are not displayed
Performance review
Received scheduled performance feedback in the last 12 months Percentage responded with ‘Yes’
63% 64% 51% 63%
Has helped/will help improve performance Percentage based on those who responded with ‘Yes’ to item above 62% 63% 59% 61%
Career and reward
My current job will help my career aspirations 53% 54% 45% 54%I feel valued for the work I do 56% 57% 51% 54%I am fairly paid for the work I do 53% 49% 53% 61%
Workplace safety There is adequate focus on workplace safety at my workplace 80% 82% 76% 78%
People in my workgroup are committed to workplace safety 84% 85% 81% 82%
Other Satisfaction with degree to which your work is interesting/challenging Percentage responded with ‘very satisfied’ or ‘satisfied’
77% 78% 70% 76%
I agree with the way my organisation tries to achieve its objectives 60% 62% 53% 56%
My work makes a valuable contribution to the Qld public 87% 87% 82% 89%
I feel my job is secure 51% 54% 44% 46%Satisfaction with your work location Percentage responded with ‘very satisfied’ or ‘satisfied’ 81% 82% 80% 78%
My workplace has undergone significant change in the past 12 months 55% 53% 62% 59%
www.orcinternational.com.auPage 13
Queensland Public Sector2015 Working for Queensland Employee Opinion Survey

HIGHLIGHT REPORT
Queensland Public SectorAt least 5 percent GREATER
At least 5 percent LESS
KEY
08. Most changed since 2014
PurposeThis section identifies areas of improvement and highlights good news stories, while also identifying areas that may need attention.
Factor% Positive
2015 vs 2014
The Survey Items With the Most Positive Change
I feel my job is secure Other 51% +12
I would feel comfortable raising complaints in my organisation Organisational trust 55% +6
My workplace culture supports people to achieve a good work/life balance Work-life balance 60% +6
My organisation is committed to developing its employees Learning and development 55% +6
How satisfied are you with your organisation’s action in response to last year’s Working for Queensland Survey? Non factorial item 61% +6
Factor% Positive
2015 vs 2014
The Survey Items With the Most Negative Change
Important decisions made at my workplace are based on a sound understanding of issues Decision Making 54% -5
People in my workgroup do their jobs effectively My workgroup 77% -1
Disability is not a barrier to success in my organisation Anti-discrimination 64% -1
I am clear what my duties and responsibilities are Role clarity and goal alignment 89% -1
Note: Survey items in scope of the above presentation were single response non-demographic questions that were asked of all respondents in 2014 as well as in 2015 and that excluded a ‘na’ option.
"My workplace has undergone significant change in the past 12 months" has not been included in the analysis
www.orcinternational.com.auPage 14
Queensland Public Sector2015 Working for Queensland Employee Opinion Survey

HIGHLIGHT REPORT
Queensland Public Sector09. More detail on intention to leave
PurposeThis section shows more detail about intention to leave (including reasons) by type of agency.
Intention to Leave the Organisation by Type of Agency Percentage of respondents who intend to leave the organisation within the next 12 months
Departments 10%
Public Service Offices 18%
Queensland Health 12%
Reasons for Intention to Leave the Organisation, by Type of Agency Percentage of reasons for respondents intention to leave the organisation within the next 12 months
Pay and conditions
Career or job opportunities
The location of your workplace or the time spent commuting
The workplace culture
Your relationship with your manager
Your relationship with your colleagues
Fit between work and your interests
Work hours
Stress/Health
Professional/personal development
Job security
Contract expiring
Balancing work and life commitments
Family/carer responsibilities
Travel plans
Retirement
Other (please specify)
www.orcinternational.com.auPage 15
Queensland Public Sector2015 Working for Queensland Employee Opinion Survey

HIGHLIGHT REPORT
Queensland Public SectorAt least 5 percent GREATER than sector
At least 5 percent LESS than sector
KEY
10. Demographic comparison
PurposeThe purpose of this section is to provide comparisons of workplace outcome results across various demographic groups, at the public sector level.
This information enables you to understand the perceptions of the varying demographic groups of the public sector workforce.
Number of respondents
Agency engagement(% Positive)
Job engagement and satisfaction
(% Positive)Intention to leave
(% Positive)
Queensland Public Sector 87102 59% 80% 66%
Managerial status Managers 20556 64% 84% 68%
Non-managers 66175 58% 79% 66%
Employment status
Permanent 72165 58% 79% 68%
Non-permanent 14675 68% 85% 59%
Full-time status Full-time basis 69618 59% 80% 66%
Part-time basis 16964 62% 83% 70%
FTE Salary $29,999 or less 3099 75% 87% 72%
$30,000 - 39,999 3864 69% 85% 71%
$40,000 - 49,999 5888 63% 80% 66%
$50,000 - 59,999 11250 60% 79% 66%
$60,000 - 69,999 12309 57% 78% 66%
$70,000 - 79,999 11929 56% 79% 65%
$80,000 - 89,999 13733 55% 78% 67%
$90,000 - 99,999 8182 55% 79% 65%
$100,000 - 109,999 8141 59% 81% 66%
$110,000 - 119,999 3231 61% 83% 66%
$120,000 - 149,999 2684 70% 87% 68%
$150,000 or above 1619 67% 87% 66%
www.orcinternational.com.auPage 16
Queensland Public Sector2015 Working for Queensland Employee Opinion Survey

HIGHLIGHT REPORT
Queensland Public SectorAt least 5 percent GREATER than sector
At least 5 percent LESS than sector
KEY
10. Demographic comparison (continued)
PurposeThe purpose of this section is to provide comparisons of workplace outcome results across various demographic groups, at the public sector level.
This information enables you to understand the perceptions of the varying demographic groups of the public sector workforce.
Number of respondents
Agency engagement(% Positive)
Job engagement and satisfaction
(% Positive)Intention to leave
(% Positive)Queensland Public Sector 87102 59% 80% 66%
Type of Work Direct service delivery 42618 60% 82% 71%
Corporate services and administrative support/clerical 21696 58% 78% 61%
Other 22442 58% 79% 64%
Indigenous Status Aboriginal 1659 61% 80% 60%
Torres Strait Islander 243 60% 78% 56%
Aboriginal and Torres Strait Islander 271 56% 75% 54%
None of the above 84218 59% 80% 67%
Disability Status Yes 3050 50% 74% 60%
No 83588 60% 80% 67%
Carer Status Yes, I am the primary* care giver for at least one person 13915 60% 81% 68%
Yes, I share the primary* care giver role 16430 60% 81% 70%
Yes, but I am not a primary* care giver 2904 56% 79% 64%
No 53531 59% 80% 65%
First Language English 81352 59% 80% 67%
Another language other than English 5427 65% 80% 62%
Country Born Australia 69827 59% 80% 67%
Overseas in a country where English is a primary language 11387 58% 81% 65%
Overseas in a country where English is not a primary language 5640 64% 80% 63%
www.orcinternational.com.auPage 17
Queensland Public Sector2015 Working for Queensland Employee Opinion Survey

HIGHLIGHT REPORT
Queensland Public SectorAt least 5 percent GREATER than sector
At least 5 percent LESS than sector
KEY
10. Demographic comparison (continued)
PurposeThe purpose of this section is to provide comparisons of workplace outcome results across various demographic groups, at the public sector level.
This information enables you to understand the perceptions of the varying demographic groups of the public sector workforce.
Number of respondents
Agency engagement(% Positive)
Job engagement and satisfaction
(% Positive)Intention to leave
(% Positive)Queensland Public Sector 87102 59% 80% 66%
Time in Agency Less than a year 9823 70% 85% 63%
1 year to less than 2 years 7099 64% 82% 63%
2 years to less than 4 years 9789 60% 80% 62%
4 years to less than 6 years 9690 57% 79% 63%
6 years to less than 10 years 16920 55% 78% 65%
10 years or more 33466 58% 80% 71%
Don’t know 210 32% 59% 40%
Age 19 years or under 246 71% 79% 55%
20 – 24 years 3403 72% 84% 62%
25 – 29 years 7262 63% 79% 61%
30 – 34 years 9466 60% 79% 63%
35 – 39 years 10474 58% 79% 65%
40 – 44 years 13152 58% 79% 66%
45 – 49 years 13411 58% 80% 69%
50 – 54 years 13158 58% 80% 71%
55 – 59 years 10172 58% 81% 70%
60 – 64 years 4679 60% 84% 66%
65 and over 1179 64% 87% 52%
Gender Male 28604 56% 78% 63%
Female 57717 61% 82% 68%
www.orcinternational.com.auPage 18
Queensland Public Sector2015 Working for Queensland Employee Opinion Survey

HIGHLIGHT REPORT
Queensland Public SectorAt least 5 percent GREATER than sector
At least 5 percent LESS than sector
KEY
10. Demographic comparison (continued)
PurposeThe purpose of this section is to provide comparisons of workplace outcome results across various demographic groups, at the public sector level.
This information enables you to understand the perceptions of the varying demographic groups of the public sector workforce.
Number of respondents
Agency engagement(% Positive)
Job engagement and satisfaction
(% Positive)Intention to leave
(% Positive)
Queensland Public Sector 87102 59% 80% 66%
Highest Level of Qualififcation Less than year 12 or equivalent 6192 62% 83% 73%
Year 12 or equivalent (Senior certificate/QCE/HSC/Leaving certificate) 8225 58% 78% 67%
Certificate level including trade 10271 59% 80% 68%
Diploma/ Advanced Diploma/ Associate degree 14056 57% 79% 66%
Bachelors degree (including with Honours) 27533 61% 81% 66%
Graduate Certificate or Diploma 10543 58% 81% 65%
Masters degree 7915 60% 81% 62%
PhD or Higher Doctorate 1073 56% 80% 61%
Other 1046 54% 78% 65%
Flexible work Purchased leave 1200 60% 80% 66%
Flexible start and finish times 23924 58% 79% 62%
Compressed work hours* 3071 56% 79% 64%
Telecommuting 1663 56% 80% 58%
Job sharing 2120 66% 84% 72%
Other, please specify 2390 56% 77% 64%
None of the above 55238 60% 81% 68%
www.orcinternational.com.auPage 19
Queensland Public Sector2015 Working for Queensland Employee Opinion Survey

HIGHLIGHT REPORT
Queensland Public SectorAt least 5 percent GREATER than sector
At least 5 percent LESS than sector
KEY
10. Demographic comparison (continued)
PurposeThe purpose of this section is to provide comparisons of workplace outcome results across various demographic groups, at the public sector level.
This information enables you to understand the perceptions of the varying demographic groups of the public sector workforce.
Number of respondents
Agency engagement(% Positive)
Job engagement and satisfaction
(% Positive)Intention to leave
(% Positive)
Queensland Public Sector 87102 59% 80% 66%
Region Brisbane - East 1336 64% 83% 73%
Brisbane - North 2997 57% 78% 66%
Brisbane - South 5186 59% 80% 66%
Brisbane - West 1126 59% 81% 71%
Brisbane Inner City 23618 56% 77% 58%
Cairns 4424 59% 80% 68%
Darling Downs - Maranoa 2481 66% 84% 73%
Fitzroy 4248 59% 81% 68%
Gold Coast 6120 63% 82% 73%
Ipswich 4802 61% 82% 71%
Logan - Beaudesert 2660 62% 83% 72%
Mackay 2384 65% 84% 68%
Moreton Bay - North 2340 61% 82% 72%
Moreton Bay - South 1165 64% 84% 73%
Queensland - Outback 2077 64% 84% 67%
Sunshine Coast 4873 63% 83% 75%
Toowoomba 3245 63% 83% 73%
Townsville 4925 56% 79% 67%
Wide Bay 4481 62% 82% 71%
Unknown 165 49% 75% 60%
www.orcinternational.com.auPage 20
Queensland Public Sector2015 Working for Queensland Employee Opinion Survey

HIGHLIGHT REPORT
Queensland Public SectorAt least 5 percent GREATER
At least 5 percent LESS
KEY
11. Perceptions of executive capabilities in the public sector
PurposeIn this section, respondents who indicated having salaries of $120,000 or more were asked about their managers’ capabilities, as outlined in the Queensland Public Service Workforce Capability Success Profile.
Number of Respondents:
4303
Response Scale (%)
Positive Neutral Negative % Positive 2015 vs 2014
Leads strategically with vision 74 16 11 74% +1
Navigates complex, ambiguous and political environments 79 13 8 79% -1
Leads change with agility 70 19 11 70% 0
Operates across boundaries 80 14 6 80% +1
Engages with ideas, innovation and risk 79 13 8 79% +3
Manages organisational performance 74 16 10 74% +1
Manages internal and external relationships 80 13 7 80% +1
Builds organisational capability 75 17 9 75% +2
Inspires individual and team commitment in the pursuit of results 71 17 11 71% +1
Models professional and ethical behaviour 84 10 7 84% 0
Displays courage in the provision of advice and decision-making 77 15 9 77% 0
Applies sound corporate governance 81 13 6 81% 0
Commits to personal development 76 18 6 76% +2
www.orcinternational.com.auPage 21
Queensland Public Sector2015 Working for Queensland Employee Opinion Survey

HIGHLIGHT REPORT
Queensland Public SectorAt least 5 percent GREATER
At least 5 percent LESS
KEY
12. Queensland public sector values
PurposeThis section shows results for the survey items that express the Queensland Public Sector Values.
Response Scale (%) % Positive vs 2014Positive Neutral Negative
Customers first People in my workgroup treat customers with respect 86 10 3 86% +1
People in my workgroup are committed to delivering excellent service to customers
84 12 4 84% +1
Ideas into action I get the opportunity to develop new and better ways of doing my job 60 23 18 60% +4
I am encouraged to make suggestions about improving work processes and/or services
68 17 15 68% +4
Management is willing to act on sugestions to improve how things are done
55 25 20 55% +4
My organisation is open to new ideas 58 26 16 58% +3
Empower people I have a choice in deciding how to do my work 65 18 16 65% +2
I have the tools I need to do my job effectively 68 16 16 68% +2
I get the information I need to do my job well 67 19 14 67% +1
I have the authority necessary to do my job effectively 71 17 12 71% +2
My job gives me opportunities to utilise my skills 78 12 10 78% +2
Satisfaction with ability to work on own initiative 83 10 7 83% +1
Be courageousPeople take responsibility for their decisions and actions in my workplace
56 25 19 56% +2
People in my workgroup are honest, open and transparent in their dealings
69 18 13 69% +2
My manager demonstrates honesty and integrity 78 13 9 78% +1
My senior manager demonstrates honesty and integrity 66 23 11 66% +2
Unleash potential I receive useful feedback on my performance 58 22 20 58% +4
My performance is assessed against clear criteria 52 28 20 52% +4
My manager draws the best out of me 58 26 16 58% +1
My organisation is committed to developing its employees 55 26 19 55% +6
www.orcinternational.com.auPage 22
Queensland Public Sector2015 Working for Queensland Employee Opinion Survey

HIGHLIGHT REPORT
Queensland Public SectorAt least 5 percent GREATER
At least 5 percent LESS
KEY
13. Comparisons with external benchmarks
PurposeThis section benchmarks the Queensland Public Sector results against the Global High Performing Benchmark as identified in ORC International’s perspectives database.
The Global High Performance Benchmark is made up of the most recent two years of data held in Perspectives and comprises results from the top ten performing organisations (quintile) globally for each question match.
Response Scale (%)
Positive Neutral Negative % Positive 2015 vs BM
I understand what is expected of me to do well in my job 89 6 5 89% -2
I understand how my work contributes to my organisation's objectives 90 6 4 90% -2
I get the information I need to do my job well 67 19 14 67% -11
My job gives me opportunities to utilise my skills 78 12 10 78% -7
I enjoy the work in my current job 78 14 8 78% -12
My job gives me a feeling of personal accomplishment 73 16 11 73% -10
I am fairly paid for the work I do 53 22 25 53% -25
I feel valued for the work I do 56 23 21 56% -16
I am satisfied with the opportunities available for career development 44 27 29 44% -7
My organisation is well managed 49 30 21 49% -23
I would recommend my organisation as a great place to work 60 26 14 60% -18
I am proud to tell others I work for my organisation 67 23 10 67% -19
www.orcinternational.com.auPage 23
Queensland Public Sector2015 Working for Queensland Employee Opinion Survey

HIGHLIGHT REPORT
Queensland Public Sector At least 5 percent GREATER
At least 5 percent LESS
KEY
13. Comparisons with external benchmarks (continued)
PurposeThis section benchmarks the Queensland Public Sector results against results from Australian Public Sector Commission for 2014 year and the United Kingdom Civil Service for 2014 year.
Response Scale (%)
Positive Neutral Negative% Positive
2015 vs APSC
vs UK Civil
Service
Agency engagement
Q35a I would recommend my organisation as a great place to work 60 26 14 60% -2 +11
Q35b I am proud to tell others I work for my organisation 67 23 10 67% -9 +8
Q35c I feel strong personal attachment to my organisation 61 26 14 61% -4 +12
Q35d My organisation motivates me to help it achieve its objectives 54 30 16 54% +1 -
Q35e My organisation inspires me to do the best in my job 54 30 16 54% +2 +9
Job engagement and satisfaction
Q22g I enjoy the work in my current job 78 14 8 78% -3 -
Q22h My job gives me a feeling of personal accomplishment 73 16 11 73% 0 -3
Q22i When needed, I am willing to put in the extra effort to get a job done 96 3 1 96% - -
Q37 All things considered, how satisfied are you with your current job? 73 14 12 73% - -
www.orcinternational.com.auPage 24
Queensland Public Sector2015 Working for Queensland Employee Opinion Survey

HIGHLIGHT REPORT
Queensland Public SectorAt least 5 percent GREATER
At least 5 percent LESS
KEY
14. Appendix A – Workplace factors and outcomes
PurposeThis section provides the detailed information required to engage in in-depth discussions to improve workplace outcomes.
Workplace outcomes % Positive Vs 2014 % Neutral Vs 2014 % Negative Vs 2014
Agency engagement
Q35a I would recommend my organisation as a great place to work 60% +5 26% -3 14% -3
Q35b I am proud to tell others I work for my organisation 67% +4 23% -2 10% -2
Q35c I feel strong personal attachment to my organisation 61% +2 26% -1 14% -1
Q35d My organisation motivates me to help it achieve its objectives 54% +4 30% -2 16% -2
Q35e My organisation inspires me to do the best in my job 54% +4 30% -2 16% -2
Job engagement and satisfaction
Q22g I enjoy the work in my current job 78% +1 14% -1 8% 0
Q22h My job gives me a feeling of personal accomplishment 73% +1 16% -1 11% 0
Q22i When needed, I am willing to put in the extra effort to get a job done 96% 0 3% 0 1% 0
Q37 All things considered, how satisfied are you with your current job? 73% +2 14% -1 12% 0
Intention to leave
Q38 I intend to leave my organisation within the next 12 months 66% +1 23% -1 11% 0
www.orcinternational.com.auPage 25
Queensland Public Sector2015 Working for Queensland Employee Opinion Survey

HIGHLIGHT REPORT
Queensland Public Sector At least 5 percent GREATER
At least 5 percent LESS
KEY
14. Appendix A – Workplace factors and outcomes (continued)
PurposeThis section provides the detailed information required to engage in in-depth discussions to improve workplace outcomes.
Job Factors % Positive Vs 2014 % Neutral Vs 2014 % Negative Vs 2014
Role clarity and goal alignmentQ21a I am clear what my duties and responsibilities are 89% -1 6% 0 6% 0Q21b I understand what is expected of me to do well in my job 89% 0 6% 0 5% 0Q21c I understand how my work contributes to my organisation's objectives 90% 0 6% 0 4% 0Q21d I am committed to my organisation's goals 90% +1 7% -1 2% 0Q21f I feel I make a contribution to achieving the organisation’s objectives 86% 0 10% -1 5% 0
Job empowermentQ22a I have a choice in deciding how I do my work 65% +2 18% -1 16% -1Q22b I have the tools I need to do my job effectively 68% +2 16% -1 16% -1Q22c I get the information I need to do my job well 67% +1 19% -1 14% 0Q22d I have the authority necessary to do my job effectively 71% +2 17% -1 12% 0Q22f My job gives me opportunities to utilise my skills 78% +2 12% -2 10% -1Q36b Your ability to work on your own initiative 83% +1 10% -1 7% 0
Workload and healthQ23a I am overloaded with work 27% +4 33% 0 40% -4Q23b I feel burned out by my work 40% +4 30% -1 30% -2Q23h My work has a negative impact on my health 44% +3 31% -1 26% -1
Learning and developmentQ28d In my organisation, there are opportunities for me to develop my skills and knowledge 65% +3 18% -2 17% -1Q28f I am able to access relevant learning and development opportunities 61% +1 22% 0 16% -1Q28g Learning and development activities I have completed in the past 12 months have
helped to improve my performance 61% +2 25% -1 14% -1Q28h I am satisfied with the opportunities available for career development 44% +3 27% -1 29% -3Q33b My organisation is committed to developing its employees 55% +6 26% -3 19% -3
Performance assessmentQ28a I receive useful feedback on my performance 58% +4 22% -2 20% -1Q28b My performance is assessed against clear criteria 52% +4 28% -3 20% -2Q28c I have performance objectives that are within my control 60% +4 25% -2 15% -2Q28i I have had productive conversations with my manager on my performance in the past
12 months 56% +3 21% -2 22% -1
www.orcinternational.com.auPage 26
Queensland Public Sector2015 Working for Queensland Employee Opinion Survey

HIGHLIGHT REPORT
Queensland Public Sector At least 5 percent GREATER
At least 5 percent LESS
KEY
14. Appendix A – Workplace factors and outcomes (continued)
PurposeThis section provides the detailed information required to engage in in-depth discussions to improve workplace outcomes.
Workgroup factors % Positive Vs 2014 % Neutral Vs 2014 % Negative Vs 2014
My workgroupQ24a People in my workgroup treat each other with respect 76% 0 13% -1 11% +1Q24b I receive help and support from other people in my workgroup 84% +1 11% -1 5% 0Q24c People in my workgroup are honest, open and transparent in their dealings 69% +2 18% -1 13% 0Q24d People in my workgroup use their time and resources efficiently 68% +1 20% -1 12% 0Q24e People in my workgroup treat customers with respect 86% +1 10% -1 3% 0Q24f People in my workgroup are committed to delivering excellent service to customers 84% +1 12% -1 4% 0Q24g People in my workgroup do their jobs effectively 77% -1 16% +1 7% 0
CollaborationQ24j People in my workgroup work effectively with other workgroups in my organisation to
deliver services to our customers 80% 0 14% 0 6% +1
Q24k People in my workgroup work effectively with other Queensland Government organisations to deliver services to our customers 78% +1 17% 0 5% 0
Q24l People in my workgroup work effectively with other organisations outside the Queensland Government to deliver services to our customers 76% 0 20% 0 4% 0
Supervision and leadership factors % Positive Vs 2014 % Neutral Vs 2014 % Negative Vs 2014
My managerQ31a My manager treats employees with dignity and respect 79% 0 11% -1 10% 0Q31b My manager listens to what I have to say 78% +1 12% -1 10% 0Q31c My manager keeps me informed about what’s going on 70% +1 16% -1 14% 0Q31d My manager understands my work 73% +1 14% -1 13% 0Q31e My manager creates a shared sense of purpose 69% +1 18% -1 13% 0Q31f My manager demonstrates honesty and integrity 78% +1 13% -1 9% 0Q31g My manager draws the best out of me 58% +1 26% -1 16% 0
My senior managerQ32a My senior manager communicates timely information that is relevant for my work 59% +2 23% -2 18% -1Q32b My senior manager genuinely listens and is responsive to issues raised by staff 58% +2 23% -2 19% -1Q32c My senior manager demonstrates honesty and integrity 66% +2 23% -2 11% 0
Organisational leadershipQ33a In my organisation, the leadership is of high quality 53% +2 28% -2 20% -1Q33d Management model the behaviours expected of all employees 53% +3 27% -2 20% -1Q33e In my organisation, the leadership operates with a high level of integrity 56% +1 28% -1 16% 0Q33g My organisation is well managed 49% +3 30% -1 21% -2
www.orcinternational.com.auPage 27
Queensland Public Sector2015 Working for Queensland Employee Opinion Survey

HIGHLIGHT REPORT
Queensland Public Sector At least 5 percent GREATER
At least 5 percent LESS
KEY
14. Appendix A – Workplace factors and outcomes (continued)
PurposeThis section provides the detailed information required to engage in in-depth discussions to improve workplace outcomes.
Workplace and organisational factors % Positive Vs 2014 % Neutral Vs 2014 % Negative Vs 2014
Decision makingQ25i Important decisions at my workplace are made by the people best placed to
understand the issues 51% 0 24% 0 25% +1
Q25m Important decisions made at my workplace are based on a sound understanding of issues 54% -5 26% +3 20% +2
Workplace changeQ26a I have received timely and relevant communication about workplace change in the
past 12 months 56% +1 23% -1 21% 0
Q26b Changes that have been implemented in my workplace have been done for a good reason in the past 12 months 47% +6 32% -2 21% -4
Q26c Changes implemented in my workplace have been managed well in the past 12 months 41% +3 32% -1 27% -2
Q26d I feel my workplace is functioning more efficiently as a result of change implemented in the past 12 months 34% +5 38% -1 28% -5
Workplace fairnessQ25f Performance is assessed and rewarded fairly in my workplace 34% +1 35% +1 31% -2Q25g I am confident that poor performance will be appropriately addressed in my
workplace 40% +1 25% 0 35% -1Q25h People are treated fairly and consistently in my workplace 53% +3 22% -1 25% -1Q25j People take responsibility for their decisions and actions in my workplace 56% +2 25% 0 19% -2Q25k Bullying is not tolerated in my workplace 66% +1 17% -1 17% 0
Anti-discriminationQ34a Age is not a barrier to success in my organisation 71% +3 19% -2 10% -1Q34b Gender is not a barrier to success in my organisation 74% +2 17% -1 9% -1Q34c Disability is not a barrier to success in my organisation 64% -1 30% +1 6% 0Q34d Cultural background is not a barrier to success in my organisation 74% +1 22% 0 4% -1Q34e Sexual orientation is not a barrier to success in my organisation 73% +1 24% 0 3% -1
Organisational trustQ33f Recruitment and promotion decisions in this organisation are fair 39% +3 32% -2 29% -1Q34f I would feel comfortable raising complaints in my organisation 55% +6 21% 0 24% -6Q34g If I raised a complaint, I feel confident that it would be taken seriously 53% +5 24% -1 23% -4
InnovationQ27a I get the opportunity to develop new and better ways of doing my job 60% +4 23% -2 18% -2Q27b I am encouraged to make suggestions about improving work processes and/or
services 68% +4 17% -2 15% -2Q27c Management is willing to act on suggestions to improve how things are done 55% +4 25% -2 20% -2Q27d My workgroup uses research and expertise to identify better practice 59% +3 27% -2 14% -1Q27e My workgroup always tries to improve its performance 75% +1 18% -1 7% 0Q27f My organisation is open to new ideas 58% +3 26% -2 16% -1
www.orcinternational.com.auPage 28
Queensland Public Sector2015 Working for Queensland Employee Opinion Survey

HIGHLIGHT REPORT
Queensland Public SectorAt least 5 percent GREATER
At least 5 percent LESS
KEY
15. Appendix B – Further results
PurposeThis section shows further results for non-factor items, at the sector level.
% Positive Vs 2014 % Neutral Vs 2014 % Negative Vs 2014
Productivity and effectivenessQ24h My workgroup is adequately resourced to deliver quality services 51% +3 22% -1 28% -3Q25d Approval processes at my workplace are excessive 19% +1 40% -1 41% 0Q25e Disruptions and/or noise at my workplace make it hard to get things
done 48% +1 26% -2 26% +1Q36c Satisfaction with physical working environment 70% 0 15% -1 14% +1Q23f There is too much ‘red tape’ in my work 18% +1 33% 0 49% -1Q33c My organisation uses my time efficiently 54% +3 26% -2 20% -1
Work-life balance
Q25b My workplace culture supports people to achieve a good work/life balance 60% +6 20% -3 19% -4
Q36e Satisfaction with work-life balance 62% +2 19% -1 20% -1Harassment and bullying
Q25k Bullying is not tolerated in my workplace 66% +1 17% -1 17% 0Q41 Witnessed harassment/bullying in the last 12 months 61% 0 7% +7 32% 0Q42 Experienced harassment/bullying in the last 12 months 78% +1 5% +5 18% 0
Performance reviewQ29 Received scheduled performance feedback in the last 12 months 63% +3 4% +4 33% -3Q30 Has helped/will help improve performance 62% +5 27% -4 11% -1
Career and rewardQ22j My current job will help my career aspirations 53% +2 30% -2 16% -1Q23d I feel valued for the work I do 56% +5 23% -2 21% -3Q23c I am fairly paid for the work I do 53% +5 22% -1 25% -4
Workplace safetyQ25c There is adequate focus on workplace safety at my workplace 80% +2 14% -2 6% 0Q24i People in my workgroup are committed to workplace safety 84% 0 13% 0 3% 0
OtherQ36a Satisfaction with degree to which your work is interesting/challenging 77% +1 14% -1 9% 0Q21e I agree with the way my organisation tries to achieve its objectives 60% +3 23% -2 17% -2Q21g My work makes a valuable contribution to the Qld public 87% 0 9% 0 3% 0Q23e I feel my job is secure 51% +12 24% -1 25% -11Q36d Satisfaction with your work location 81% +1 12% 0 7% 0Q26e My workplace has undergone significant change in the past 12
months 55% -4 31% +2 14% +2
www.orcinternational.com.auPage 29
Queensland Public Sector2015 Working for Queensland Employee Opinion Survey

HIGHLIGHT REPORT
Queensland Public Sector16. Appendix C – Response rate by agency
PurposeThis section shows the final response rate by agency, type of agency and for the sector. It was calculated using statistical workforce data (Minimum Obligatory Human Resource Information) for March 2015. It includes both online and paper based returns.
Number of Responses Response Rate
Queensland Public Service 87102 39%
Departments Total 55578 42%
Queensland Treasury 920 92%
Department of Aboriginal & Torres Strait Islander Partnerships 251 88%
Department of Tourism Major Events Small Business & Commonwealth Games 107 85%
Department of Energy and Water Supply 185 85%
Department of Housing and Public Works 2518 84%
Department of the Premier and Cabinet 588 83%
Department of Transport & Main Roads 5784 83%
Department of Infrastructure, Local Government & Planning 91 83%
Department of Environment & Heritage Protection 874 81%
Department of Natural Resources & Mines 1915 78%
Department of State Development 720 75%
Department of Science, Information Technology and Innovation 1956 71%
Department of National Parks, Sport & Racing 952 68%
Department of Agriculture & Fisheries 1367 67%
Department of Justice & Attorney-General 5999 66%
Department of Communities, Child Safety & Disability Services 4117 65%
Queensland Police Service 4851 35%
Queensland Fire and Emergency Services 866 30%
Department of Education & Training 21517 29%
www.orcinternational.com.auPage 30
Queensland Public Sector2015 Working for Queensland Employee Opinion Survey

HIGHLIGHT REPORT
Queensland Public Sector 16. Appendix C – Response rate by agency (continued)
PurposeThis section shows the final response rate by agency, type of agency and for the sector. It was calculated using statistical workforce data (Minimum Obligatory Human Resource Information) for March 2015. It includes both online and paper based returns.
Number of Responses Response Rate
Queensland Public Service 87102 39%
Public Service Offices Total 3461 66%
Queensland Reconstruction Authority 63 100%
Inspector-General Emergency Management 22 100%
Office of the Health Ombudsman 97 100%
QLeave 50 93%
Public Service Commission 67 89%
Queensland Family & Child Commission 38 88%
Anti-Discrimination Commission Queensland 32 86%
Office of the Information Commissioner 35 83%
State Library Queensland 279 79%
Public Trust Office 417 74%
Queensland Audit Office 139 73%
QAGOMA 244 65%
Electoral Commission Queensland 43 62%
Public Safety Business Agency 1495 62%
Trade and Investment Queensland 60 59%
Queensland Museum 162 52%
Legal Aid Queensland 218 47%
www.orcinternational.com.auPage 31
Queensland Public Sector2015 Working for Queensland Employee Opinion Survey

HIGHLIGHT REPORT
Queensland Public Sector 16. Appendix C – Response rate by agency (continued)
PurposeThis section shows the final response rate by agency, type of agency and for the sector. It was calculated using statistical workforce data (Minimum Obligatory Human Resource Information) for March 2015. It includes both online and paper based returns.
Number of Responses Response Rate
Queensland Public Service 87102 39%
Queensland Health Total 28063 32%
Department of Health 4452 64%
Central West Hospital and Health Service 200 53%
West Moreton Hospital and Health Service 1536 46%
Darling Downs Hospital & Health Service 2235 45%
Sunshine Coast Hospital and Health Service 2189 44%
Townsville Hospital and Health Service 2431 42%
South West Hospital and Health Service 360 42%
Queensland Ambulance Service 1698 40%
Central Queensland Hospital & Health Service 1205 37%
Gold Coast Hospital and Health Service 2715 36%
Children’s Health Queensland Hospital and Health Service 1163 32%
Mackay Hospital and Health Service 696 31%
North West Hospital and Health Service 195 27%
Cairns & Hinterland Hospital & Health Service 1256 24%
Torres and Cape Hospital & Health Service 201 23%
Wide Bay Hospital and Health Service 759 22%
Metro North Hospital and Health Service 2629 16%
Metro South Hospital and Health Service 2143 15%
www.orcinternational.com.auPage 32
Queensland Public Sector2015 Working for Queensland Employee Opinion Survey

HIGHLIGHT REPORTQueensland Public Sector17. Appendix D – How to interpret this report
% Positive, Neutral and Negative Scores
Across all Working for Queensland (WfQ) reporting, data is expressed as % positive,% neutral or % negative.
• % positive presents the proportion of respondents who expressed a positive opinion or assessment i.e. combining ‘Strongly agree’ and ‘Agree’ responses.
• % neutral presents the proportion of respondents who expressed a neutral opinion or assessment.
• % negative presents the proportion of respondents who expressed a negative opinion or assessment i.e. combining ‘Strongly disagree’ and ‘Disagree’ responses.
Negatively Worded Questions: An exampleWhat are negatively worded questions?Negatively worded questions are items in the questionnaire that are phrased in a negative way e.g. “Approval processes at my work are excessive”.
How are the negatively worded responses scored?When responding to a negatively worded question, “Strongly disagree” and “Disagree” responses are classified as positive i.e. it is good that you disagree that approval processes at work are excessive (this means they are not excessive!). Therefore, the “Strongly disagree” and “Disagree” responses are combined to calculate the % positive score.
What does this mean for interpreting the % positive score for negatively worded questions?The % positive combines the negative responses as they are the “preferred”responses to this item.
EXAMPLEIn the table below the % positive score for “Approval processes at my work are excessive” is 82%. This result can be expressed by stating that:
82% disagreed that their“Approval processes at my work are excessive”
OR82% felt that the approvalprocesses at their work
are not excessive.
Conversely, the % negative score means that 8% of the employees perceive that the approval processes at their work are excessive.
How will I know if I am interpreting this correctly?To assist in the interpretation, all negatively worded questions are accompanied by an explanatory statement.
www.orcinternational.com.auPage 33
Queensland Public Sector2015 Working for Queensland Employee Opinion Survey
HIGHLIGHT REPORT
Queensland Public Sector17. Appendix D – How to interpret this report
RoundingResults were rounded to whole numbers. As such, percentages may not add up to 100% and the % change figures may have been amended for internal consistency.
Factor ScoresFactor measures combine information from multiple survey items that correlate highly with the overall factor. The factor scores are calculated as the sum of positive responses given to all questions within the factor, divided by the number of answers to all questions within the factor.
The report depicts 3 workplace outcomes and makes use of 16 factor measures that are documented in Appendix A.
% Change and Division ComparisonsThroughout this report the % change figure and division comparisons are frequently reported. The% change score relates to differences between:
• the 2014 and 2015 % positive, negative and neutral scores
The % score is highlighted green when the 2015work area result is five or more percentage pointshigher than the 2014 score. The % score is highlighted red where the 2015 work area result is five or more percentage points lower.
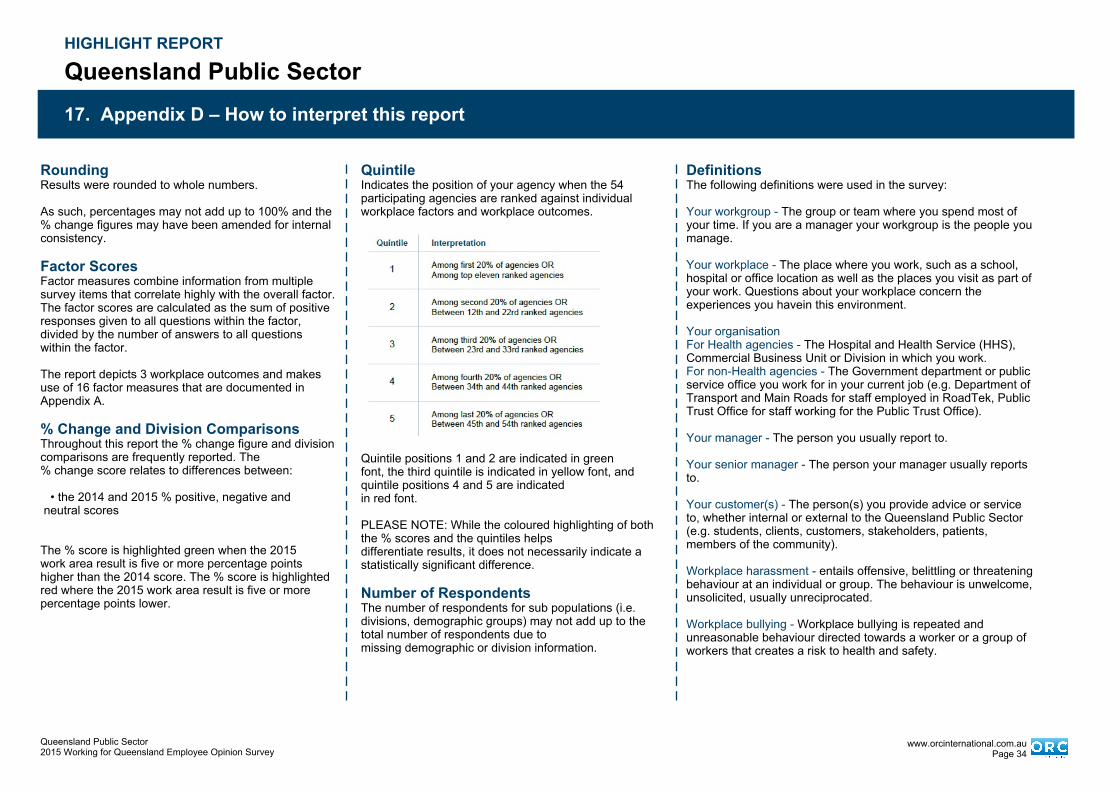
QuintileIndicates the position of your agency when the 54 participating agencies are ranked against individual workplace factors and workplace outcomes.
Quintile positions 1 and 2 are indicated in greenfont, the third quintile is indicated in yellow font, and quintile positions 4 and 5 are indicated in red font.
PLEASE NOTE: While the coloured highlighting of both the % scores and the quintiles helps differentiate results, it does not necessarily indicate a statistically significant difference.
Number of RespondentsThe number of respondents for sub populations (i.e. divisions, demographic groups) may not add up to the total number of respondents due tomissing demographic or division information.
DefinitionsThe following definitions were used in the survey:
Your workgroup - The group or team where you spend most of your time. If you are a manager your workgroup is the people you manage.
Your workplace - The place where you work, such as a school, hospital or office location as well as the places you visit as part of your work. Questions about your workplace concern the experiences you havein this environment.
Your organisationFor Health agencies - The Hospital and Health Service (HHS), Commercial Business Unit or Division in which you work.For non-Health agencies - The Government department or public service office you work for in your current job (e.g. Department of Transport and Main Roads for staff employed in RoadTek, Public Trust Office for staff working for the Public Trust Office).
Your manager - The person you usually report to.
Your senior manager - The person your manager usually reports to.
Your customer(s) - The person(s) you provide advice or service to, whether internal or external to the Queensland Public Sector (e.g. students, clients, customers, stakeholders, patients, members of the community).
Workplace harassment - entails offensive, belittling or threatening behaviour at an individual or group. The behaviour is unwelcome, unsolicited, usually unreciprocated.
Workplace bullying - Workplace bullying is repeated and unreasonable behaviour directed towards a worker or a group of workers that creates a risk to health and safety.
www.orcinternational.com.auPage 34
Queensland Public Sector2015 Working for Queensland Employee Opinion Survey

HIGHLIGHT REPORT
Queensland Public Sector17. Appendix D – How to interpret this report
Key DriversKey drivers identify which of the workplace factors shown in the diagram featured on this page had the greatest statistical impact on each of the threeworkplace outcomes. In the body of the report they are ordered by strength of impact (i.e. strongest listed first). The diagram featured on this page outlines the conceptual model behind the analysis.
Diagram: Workplace factors and workplace outcomes
www.orcinternational.com.auPage 35
Queensland Public Sector2015 Working for Queensland Employee Opinion Survey