working paper 07-1: the trade effects of preferential ... · the trade effects of preferential...
TRANSCRIPT

�
Working Paper S e r i e s
W P 0 7 - 1 J A N U A R Y 2 0 0 7
P E T E R G . P E T E R S O N I N S T I T I T U T E F O R I N T E R N A T I O N A L E C O N O M I C S1 7 5 0 M A S S A C h U S E T T S A v E N U E , N W | W A S h I N G T O N , D C 2 0 0 3 6 - 1 9 0 3T E L : ( 2 0 2 ) 3 2 8 - 9 0 0 0 | F A x : ( 2 0 2 ) 6 5 9 - 3 2 2 5 | W W W . P E T E R S O N I N S T I T U T E . O R G
Copyright © 2006 by the Peterson Institute for International Economics. All rights reserved. No part of this working paper may be reproduced or utilized in any form or by any means, electronic or mechanical, including photocopying,
recording, or by information storage or retrieval system, without permission from the Institute.
The Trade Effects of Preferential Arrangements: New Evidence from the Australia Productivity Commission
Dean A. DeRosa
AbstractThis paper critically examines “new” evidence from the gravity model that indicates the majority of preferential trading arrangements (PTAs) today are predominantly trade diverting. This new evidence on trade diversion was presented in a recent Australia Productivity Commission (APC) working paper. Although no major faults are found in the methodology of the APC study, the present analysis finds the opposite conclusion—that the majority of current PTAs are predominantly trade creating—when a variant of the gravity model formulated by Andrew Rose is applied to up-to-date regression data using a variety of econometric methods, including the Tobit regression method employed by the APC study.
JEL codes: F13, F15, F17 Keywords: trade policy, preferential trading arrangements, free trade agreements, gravity models
Note: Paper prepared for the Peterson Institute for International Economics Project on the Economic Prospects of a Pakistan-US Free Trade Area, directed by senior fellow Gary Hufbauer. Views expressed in the paper are solely those of the author.
Dean A. DeRosa is a visiting fellow at the Peterson Institute and principal economist of ADR International Ltd, Falls Church, Virginia (www.adr-i.com). He contributed to Sustaining Reform with a US-Pakistan Free Trade Agreement (2006), The Shape of a Swiss-US Free Trade Agreement (2005), and Free Trade Agreements: US Strategies and Priorities (2004).
�
1. IntroductIon
Preferential trading arrangements (PTAs) are widely expected to expand trade and economic welfare in PTA partner countries. Notwithstanding the “deeper” integration elements of modern free trade agreements (FTAs)—covering for instance foreign investment rules, observance of intellectual property rights, and greater harmonization of labor and environmental practices—freer trade in merchandise and services between FTA members, leading to gains in economic welfare, remains an essential inspiration for the rapid growth in bilateral and regional FTAs today.
Since Viner’s (1950) seminal study of the customs union issue, a particular concern for economists is whether expansion of intrabloc trade under PTAs is in fact welfare enhancing for bloc member countries and the world economy. Modern economic theory and quantitative methods provide formal measures for assessing trade-related changes in economic welfare across countries. However, Viner’s original approach to judging the expected economic benefits of customs unions, free trade areas, and other PTAs involved the separate but related concepts of trade creation and trade diversion. This approach remains popular today as an initial screen for judging the economic merits of PTAs. Trade creation refers to the expansion of overall trade by a PTA country to the benefit of its economy. Trade diversion, on the other hand, refers to the expansion of trade between PTA partners that supplants erstwhile imports from non-PTA countries at a higher resource cost than would be otherwise. In recent years, applied and empirical studies have widely concluded that trade creation under FTAs and other PTAs outweighs trade diversion and hence that the recent spread of FTAs generally promotes economic welfare within the trading blocs (though not necessarily in each individual member country); it remains, however, an open question whether FTAs promote economic welfare in the world economy at large, including countries outside the trading blocs.1
Against this backdrop, a recent staff working paper published by the Australia Productivity Commission (APC) (Adams et al. 2003) reports empirical findings, based on a gravity model of world trade and aggregate trade data for the period 1970–97, that indicate that the majority of PTAs examined by the authors (circa 2000) are trade diverting on a net basis. If true, this “new” evidence would suggest that the ongoing resurgence of bilateral and regional PTAs could seriously threaten the health of the world economy.
Because the empirical findings and conclusion in the APC study strongly contradict previous empirical findings and the current view of policymakers regarding the trade and welfare impacts of recent PTAs, this paper undertakes a review of the methodology and results. We offer our own empirical results using a similar but more up-to-date gravity model dataset applied over a broader spectrum of estimation periods and techniques.
The remainder of the paper is as follows: Section 2 introduces gravity model analysis, its modern theoretical underpinnings, and the principal econometric issues surrounding estimation of gravity models using panel data and discusses the application of gravity models to the problem of assessing the trade
1. See for instance Greenaway and Milner (2002).

�
and welfare impacts of PTAs; Section 3 next introduces the APC study and reviews its methodology and results, focusing on the study’s contrarian results regarding the trade impacts of PTAs; Section 4 then turns to the estimation results undertaken for the present analysis using a variant of the Rose (2004) gravity model for the period 1970–99, incorporating both bilateral aggregate trade data and bilateral data on trade in manufactures; finally Section 5 summarizes the principal findings.
2. GravIty Model analysIs
As the APC study itself emphasizes, the gravity model is widely considered the workhorse of modern-day empirical analysis in international trade and investment. This follows from not only the model’s robust empirical findings but also its relatively compact specification, making it appealing for the analysis of a variety of trade and investment issues, including the trade potential of trading blocs. Computable general equilibrium (CGE) models and other applied economic models provide much more economic structure and detail, but applied economic models are inherently more complex. Also, the parameters of these models are typically not empirically estimated or tested for their statistical robustness, leaving the specifications of the models—however faithfully derived from economic theory—subject to considerable uncertainty and often the prior assumptions of the model builder.
essential Features of the Gravity Model
The gravity trade model econometrically evaluates cross-sectional or pooled cross-sectional data on bilateral trade flows, measured in a common currency (and adjusted for inflation), against the gravitational “mass” of explanatory variables describing the characteristics of bilateral trading partners.2 The two “core” variables are joint real GDP and distance.3 Nearly all gravity models find that two-way trade between countries increases significantly as their combined GDP increases and the distance between them decreases. Additional explanatory variables are specified as well, and these are frequently of greatest interest. The additional variables show how much two-way trade is added or subtracted from the quantity predicted by the basic core variables on account of political and institutional factors and various “trade resistance factors.” For instance, trading partners that do not share a common border, language, or currency usually enjoy significantly less mutual trade.
Theory-Based Approach. In recent years, Anderson (1979), Helpman and Krugman (1985), Deardorff (1998), and Anderson and van Wincoop (2003), among others, have formalized the theory underlying
2. The origins of the gravity model may be found in the early empirical trade studies of Tinbergen (1962) and Poyhonen (1963).3. A third possible “core” variable is joint GDP per capita. A higher joint GDP per capita figure implies a smaller joint popula-tion figure (for a given joint GDP level). Less combined population tends to depress the bilateral level of trade; hence the coef-ficient on joint GDP per capita is normally negative. However, some gravity model investigators consider joint GDP per capita to serve as a proxy for accumulated physical and human capital, with the expectation that the coefficient on this variable in the regression equation would be positive.

�
the gravity model, mainly in terms of the basic bilateral trade specification:
σ−
=
Π+
1
1Pt
YYYX
ji
ij
w
jiij
(1)
where • Xij = exports of country i to country j;• Yi, Yj = levels of GDP in country i and country j respectively; • Yw = world GDP;• tij = ad valorem index of distance and other trade resistance factors facing country i’s exports to
country j; • Πi, Pj = price indices of “multilateral resistance” faced by exports from country i and by imports to
country j respectively; and • σ = elasticity of substitution in demand between similar traded goods produced by different
countries.
This specification of the fundamental gravity model equation is derived under the familiar but strong assumption that traded goods are differentiated in demand by country of production, analogous to the assumptions underlying the popular Armington (1969) demand system.4 When σ is greater than unity, so that the exponential term is negative, equation (1) states that exports of country i to country j are a positive function of income in the two countries and the two multilateral resistance factors, Πi and Pj. Equation (1) also states that exports of country i to country j are a negative function of both world income and the direct, bilateral trade resistance factors, tij, facing country i’s exports to country j.
The two multilateral resistance variables, Πi and Pj, reflect the extent of trade resistance factors facing exports worldwide from country i (Πi) and facing imports from all sources to country j (Pj). Higher multilateral resistance to trade, reflected in either Πi or Pj, is expected to result in increased trade, between the two countries because they are forced to rely on each other’s markets. When there is no multilateral resistance, Πi and Pj are one, and the entire expression in brackets in equation (1) also becomes one, leaving bilateral trade flows to be determined solely by the combined income levels in the two trading partners and the level of world income.
4. Baldwin and Taglioni (2006) provide a thorough discussion of the derivation of the fundamental gravity model in equation (1). Additionally, they illustrate the biases in coefficient estimates that can arise from three, allegedly common pitfalls in estimat-ing the model: failure to account for unobserved variables (termed the “gold medal error”), failure to compute the dependent variable as a geometric average when two-way trade flows are combined to form the dependent variable (the “silver medal error”), and failure to include a time trend variable in the gravity model regression equation to compensate for inappropriate deflation of all bilateral trade values by the aggregate price index of a single country (the “bronze medal error”). With regard to the last two common errors, both the APC study and the present study specify the natural logarithm of one-way trade flows as the dependent variable, explicitly identifying the exporting and importing country, and they both include a time trend variable in the gravity model regression equation. Most important, with regard to the “gold medal error,” both studies employ econometric methods in panel data analysis that, as discussed in the text, endeavor to take into account the influence of unobserved variables.
1–σ
ijij

�
Of course, transportation costs, protection measures, and other trade resistance factors are significant factors worldwide (Anderson and van Wincoop 2004). Hence, following the theory-based gravity model in equation (1), not only must bilateral trade resistance factors be accounted for (the usual practice), but also the average trade resistances faced by the individual trading countries globally—the so-called “multilateral resistance” factors in equation (1)—must be accounted for, even though these are not commonly represented in gravity model studies. Failing to represent these global resistance factors raises the problem of omitted variables and the specter of possible bias in the estimated parameters of the gravity model.
Selected Econometric Issues. Recent approaches that follow the “high road” of the theory-based gravity model—namely, by explicitly representing the global resistance factors in equation (1)—vary widely.5 Some gravity model investigators have sought to directly quantify the global trade costs of exporting and importing countries by computing indices of actual transport and protection costs using observed trade prices, tariffs, and other indicators of differences between landed-import prices and ex-factory export prices. Other investigators have specified fixed effects variables that essentially add dichotomous (0,1) variables to the gravity model equation to represent each trading country separately as an exporter and importer, thereby representing multilateral resistance factors indirectly. Frequently, these investigators also specify dichotomous year or other time-related variables to account for major events that impact the global trading system and hence trade by all countries.
In practice, however, the omitted variables problem goes beyond the multilateral resistance factors identified in equation (1). Within the traditional gravity model specification, bilateral trade flows are conceivably influenced by unobserved factors too numerous to represent in a single-equation gravity model. In that case, problems may arise in accurately estimating the parameter values of the model. These problems are often indicated by appreciable serial correlation of regression residuals. Econometricians often seek to avoid the problem of omitted variables by including “specific-effects” variables in the gravity model estimation equation to capture the proximate influence of omitted or unobservable (mainly time-invariant) influences that are specific to the individual observed dependent variables. In the context of the gravity model, the observed dependent variables are bilateral trade flows, Xij, between exporting countries i and importing countries j. The unobserved influences associated with each bilateral trade observation are represented by λij.
6 These omitted or unobservable effects are appropriately represented as an augmented element of
the usual random error term uijt in the traditional (log-linear) gravity model regression equation in the following manner:
5. Numerous estimation issues surround the use of cross-section and panel data in econometrics; thus the coverage of estimation problems and issues here is far from exhaustive. The interested reader is directed to advanced textbooks on statistical analysis of panel data by Baltagi (2005), Hsiao (2003), and Wooldridge (2002).6. See for instance Baltagi (2005). For expository convenience, it is assumed here that the specific-effects variable is symmetric, such that λij = λji. However, in the empirical application of the gravity model presented in section 4, the dataset used in the analy-sis separately identifies export and import trade flows between unique pairs of countries, and λij is not assumed to equal λji.

�
lnXijt = α + βln(YitYjt) + δlndistij + γi + γj + γt + (λij + uijt) (2)where
• ln = the natural logarithmic operator;• i = exporting country;• j = importing country;• t = year;• Xijt = exports of country i to country j in year t;• Yit, Yjt = levels of GDP in country i and country j respectively in year t;• distij = measured distance between the “economic centers” of countries i and j;• γi, γj = exporter and importer country fixed effects that control for Πi and Pj,
respectively, in equation (1);• γt = time-related fixed effects;• λij = unobserved country pair effects; and • uijt = random error term.
Alternative econometric approaches are available to estimate the parameters of this basic gravity model (Baltagi 2005, Hsiao 2003, and Wooldridge 2002). The appropriateness of the alternative approaches depends upon whether the unobserved effects λij are independent of the observed explanatory variables. If independence can correctly be assumed, then the gravity model is best estimated using the so-called random-effects approach, using the techniques of either generalized least squares or maximum likelihood estimation. If independence cannot be assumed, then the model may be estimated using the so-called fixed effects approach, in effect using dummy variables to represent the unobservable variables and applying the familiar technique of ordinary least squares (OLS). More sophisticated econometric methods may also be employed, namely, to take into account the possible covariance between the unobserved effects variables and one or more observed explanatory variables. The best known of these is the Hausman-Taylor (1981) method, which involves a multistage estimation procedure.
The mathematical proof of these points and propositions lies beyond the scope of this paper and is left to the technical literature on the econometrics of cross-section and panel data. Nonetheless, it is important to note that, when appropriately applied, the random-effects approach is the preferred approach for complete estimation of the parameters of the gravity model. By contrast, the fixed effects approach does not yield coefficient estimates for the time-invariant explanatory variables of the gravity model, especially including distance and other unchanging explanatory variables characterizing the factors determining bilateral trade flows.7
7. The essential problem is that time-invariant variables in the gravity model regression equation are collinear with the fixed ef-fects dummy variables under the fixed effects approach and hence must be dropped during OLS estimation of the gravity model.

�
Finally, some recent gravity model studies, including the APC study,8 have emphasized that international trade statistics are frequently incomplete in that they often either do not include zero-value trade flows or record trade below a minimum threshold as zero. In these cases, the gravity model parameter estimates may be biased by truncating the trade data to exclude the zero or near zero values or by censoring the trade data by representing small values near zero as zero values. However, in the context of gravity model estimation, the logarithmic transformation of zero-value trade flows is undefined (i.e., negative infinity), which in turn requires either truncating the dataset or censoring the zero-value trade flows. Tobin (1958) pioneered an econometric method for handling truncated and censored data in these cases in order to derive more reliable parameter estimates.9
Preferential trading arrangements
Customs unions, free trade areas, and other PTAs are clearly among the forces that might be expected to impact bilateral trade flows. In gravity model analysis, PTAs are introduced by the inclusion of a dichotomous (0,1) explanatory variable to represent PTAs individually or on a combined basis. If the estimated coefficient of the (0,1) dummy variable is positive and significant, then the PTA may expand mutual two-way trade between the PTA members on a gross basis—that is, the sum of “Vinerian” trade
creation and trade diversion effects on intrabloc trade is positive.10
Various means have been developed to refine this measure of trade expansion under PTAs as well as to assess the extent of possible trade diversion. We focus here on the particular approach of Soloaga and Winters (2001), whose gravity model approach examines not only intrabloc trade expansion effects, but also possible extrabloc import diversion and export diversion effects. Further, Soloaga and Winters provide an important foundation for the approach of the APC study, as seen in the next section.11
To assess the overall effect of FTAs and other PTAs, Soloaga and Winters specify two additional dichotomous dummy, or indicator, variables for each PTA considered. The first additional dummy variable is set equal to one if the importing country is a PTA member (and zero otherwise), while the second additional dummy variable is set equal to one if the exporting country is a PTA member (and zero otherwise).
8. Other recent studies emphasizing the importance of accounting for zero-value trade flows include Helpman, Melitz, and Rubinstein (2004) and Soderling (2005).9. For an introduction to the topic, see Greene (2003). Long (1997) also provides a helpful and somewhat more technical intro-duction.10. The extent of trade expansion is usually measured in percentage terms and can be derived from the estimated coefficient on the dummy variable. Given the log-linear specification of the gravity model regression equation, the impact of a FTA on bilateral trade can be computed in percentage terms as 100*[exp(brta) – 1.00]. In this expression, brta is the estimated coefficient for the dummy variable, representing the presence of a regional trade agreement, and exp(brta) is the value of the natural number e raised to the exponent brta. For example, if the coefficient brta is 0.33, then the value of exp(brta) is 1.39, and the percentage of expansion in trade is estimated as 100*[1.39 – 1.00], which equals 39 percent.11. Other gravity model–based studies of PTAs, for instance by Bayoumi and Eichengreen (1997) and Frankel (1997), also at-tempt to separate trade creation effects from trade diversion effects. However, they typically do not differentiate between import diversion effects and export diversion effects.

�
If the estimated coefficient of the first of these two variables (the importing country supplementary dummy) is significant and positive, it may be interpreted as indicating the general openness of the PTA members vis-à-vis all their trading partners (including both PTA partners and other countries). Also, in the presence of a positive estimated coefficient for this variable, if the main PTA dummy variable is still found to be positive and significant, then the PTA may be viewed as truly leading to substantially increased bilateral trade between PTA members, above and beyond that generally predicted by the gravity model for these countries. However, if the coefficient of the first supplementary PTA variable is estimated to be negative and significant, then this supplementary PTA variable may be interpreted as indicating the occurrence of appreciable import diversion under the PTA.
The interpretation of the second additional dummy variable (the supplementary variable covering exports by PTA members to all their trading partners, including one another) is somewhat more novel. It provides an indication of whether PTA exports are possibly diverted from countries outside the PTA, in which case, the welfare of non-PTA countries would be adversely affected by a reduction in their consumption possibilities. As Soloaga and Winters aptly explain, economic welfare is related to what the residents of countries consume, and hence, ceteris paribus, reduced member exports under a PTA must imply a reduction in welfare to consumers in countries excluded from the PTA.
Finally, Soloaga and Winters term the sum of the three PTA dummy variables the “gross intratrade” effect. So long as this sum is positive, then the PTA may be considered trade creating with respect to intrabloc trade. Conversely, if the sum of the three dummy variables is negative, then the PTA may be considered trade diverting with respect to intrabloc trade. The correspondence of this gross intrabloc trade effect to Viner’s measure of net trade creation is inexact, since the gross intrabloc effect accounts for trade creation and trade diversion only for trade among PTA members and not for bloc trade with nonmembers. As discussed in box 1, a more thorough consideration of the trade effects implied by estimates of the PTA dummy variables could lead to a substantially different assessment of the net trade impact of the PTA. Moreover, the welfare impacts of PTAs do not correspond precisely to the outcome of trade creation and trade diversion calculations.12
Nonetheless, the gross intratrade effect formulated by Soloaga and Winters amounts to a basic screen for net trade creation under the PTA. As emphasized by the authors of the APC study, if the sum of the three PTA dummy variables comprising the intratrade effect is negative, then the PTA should not be expected to enhance the welfare of the trading bloc as a whole. Additionally, depending on the sign and significance of the estimated coefficient of the third PTA dummy variables (the supplementary export dummy), the Soloaga-Winters approach can be interpreted to indicate the bloc’s impact on the economic welfare of excluded countries.
12. There is a rough presumption that net trade creation also means net welfare enhancement. However, examples can be constructed where an increase in trade corresponds to lower welfare. Examples can also be constructed where a decrease in trade corresponds to higher welfare.

�
Box 1 Pta trade effects and economic welfare
Following the Soloaga-Winters (�00�) approach, the effect of a PTA on two-way intrabloc trade Xij between two PTA
members, country i and country j, can be calculated in percent terms according to the equation:
pch (Xij) = �00*[exp (b
pta + b
pta_m + b
pta_x) – �]
In this equation, pch (Xij) represents the percent change in X
ij, exp (b
pta + b
pta_m + b
pta_x) is the value of the natural
number e raised to the exponent (bpta
+ bpta_m
+ bpta_x
), and the b-terms are the estimated coefficients of the three
dummy variables. Each dummy variable has a value of zero or one. The first dummy variable, bpta
, equals one when
two countries are partners in the PTA. The second dummy variable, bpta_m
, equals one when a PTA country (country j)
is the country importing from any other country in the world (including its PTA partner). The third dummy variable,
bpta_x
, equals one when a PTA country (country i) is the country exporting to any other country in the world (including
its PTA partner).
The method of estimating the supplementary import coefficient, bpta_m
, is such that the same dummy variable
takes the value of one either when country A is the importer from PTA partner country B or country B is the importer
from PTA partner country A. Hence this coefficient captures the average effect (positive or negative) on two-way
import trade between A and B. Similarly, the method of estimating the supplementary export coefficient, bpta_x
,
captures the average effect (again positive or negative) of PTA membership on two-way export trade between A
and B. Of course these two coefficients also capture—indeed, principally reflect—the effect of PTA membership on
member country imports and exports to all other countries in the world trading system.
From the pch (Xij) equation, and the explanation just given, it should be clear that the PTA expands intrabloc
trade on a net basis (intrabloc net trade creation) so long as the sum of the b-coefficients is positive.� When the sum
of the b-coefficients is positive, the right side of the equation is greater than zero percent. However, if the sum of the
b-coefficients is negative, the right side of the equation is less than zero percent, which means that intrabloc trade
declines (intrabloc net trade diversion).
As an example, consider two small trading partners that establish a bilateral FTA. Additionally, suppose the
gravity model estimation results imply that, holding all other factors constant, direct bilateral trade between the two
countries would double (bpta
= 0.�), while the multilateral imports and exports of both countries would each decline
by �0 percent (bpta_m
= –0.�; bpta_x
= –0.�). Under these circumstances, according to the Soloaga-Winters measure of
the intrabloc effect, intrabloc net trade creation can be estimated at about �0 percent of intrabloc trade before the
PTA was established (to be more exact, {�00 * [exp(0.� – 0.� – 0.�) – �]} equals �� percent).
However, as mentioned in the text, the correspondence of the Soloaga-Winters measure of the intrabloc effect
does not exactly correspond to Viner’s measure of net trade creation. A broader measure of overall net trade creation
might adapt the Soloaga-Winters approach to determine the change in trade not only between bloc members but
also between the bloc and other countries in the world trading system. The mathematics are cumbersome and will not
be spelled out. However, an example will illustrate that even small negative values of the bpta_m
and bpta_x
coefficients,
when applied to bloc imports and exports with nonmember countries, can result in much different implications for
overall net trade creation by comparison with intrabloc net trade creation in a situation where trade
�. When the sum of the b-coefficients is positive, exp(bpta
+ bpta_m
+ bpta_x
) is greater than one. Hence, the subtraction of one in the bracketed term on the right side of the equation leaves a positive number.
(box continues next page)
�0
3. the aPc study and FIndInGs
The APC study—a working paper authored jointly by APC staff members Richard Adams et al. (2003)—is an extensive, informative, and professionally well crafted piece. It examines not only the trade effects but also the investment effects of recent PTAs, usefully evaluated according to what the authors describe as first, second, and third waves of evolution in the maturation and refinement of PTAs over the last half century.13
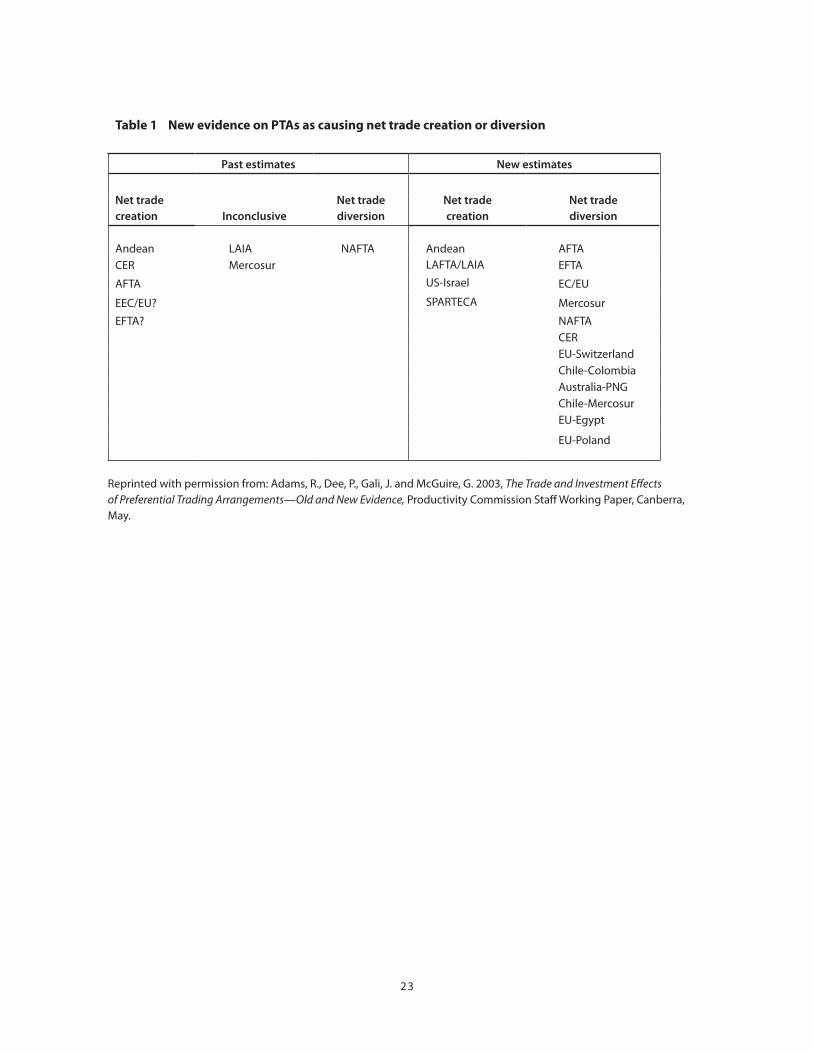
The present discussion focuses on the controversial “new” evidence on trade creation and trade diversion reported by the APC study, based on gravity model estimation results and datasets spanning 1970–97. The findings are summarized in table 1. If substantiated, the APC evidence would imply that the majority of current PTAs worldwide are trade diverting on a net basis for the bloc as a whole. Indeed, the APC evidence suggests that only some relatively minor, “weak” PTAs—the Andean Group, the Latin American Integration Association (LAIA), US-Israel FTA, and the South Pacific Regional Trade and Economic Cooperation Agreement (SPARTECA)—are trade creating, whereas such major PTAs as the European Union, the North American Free Trade Agreement (NAFTA), and Mercado Común del Sur (Mercosur) are predominantly trade diverting.
The authors of the APC study ascribe their new results to careful, painstaking specification and application of the gravity model underlying their analysis. In the remainder of this section, we discuss the prominent features of the APC methodology and findings, leaving section 4 for the presentation of our alternative gravity model results using a similar approach but somewhat more up-to-date dataset.
explanatory variables and Methodology
As seen in table 2, the APC gravity model estimating equation incorporates an extensive yet familiar set of “core” explanatory variables, spanning size and geographical variables, monetary and price variables,
13. Basically, the three evolutionary waves of PTAs described by the APC study categorize the increasing sophistication, deepening, and trade (and investment) coverage of PTAs worldwide from the 1950s to date.
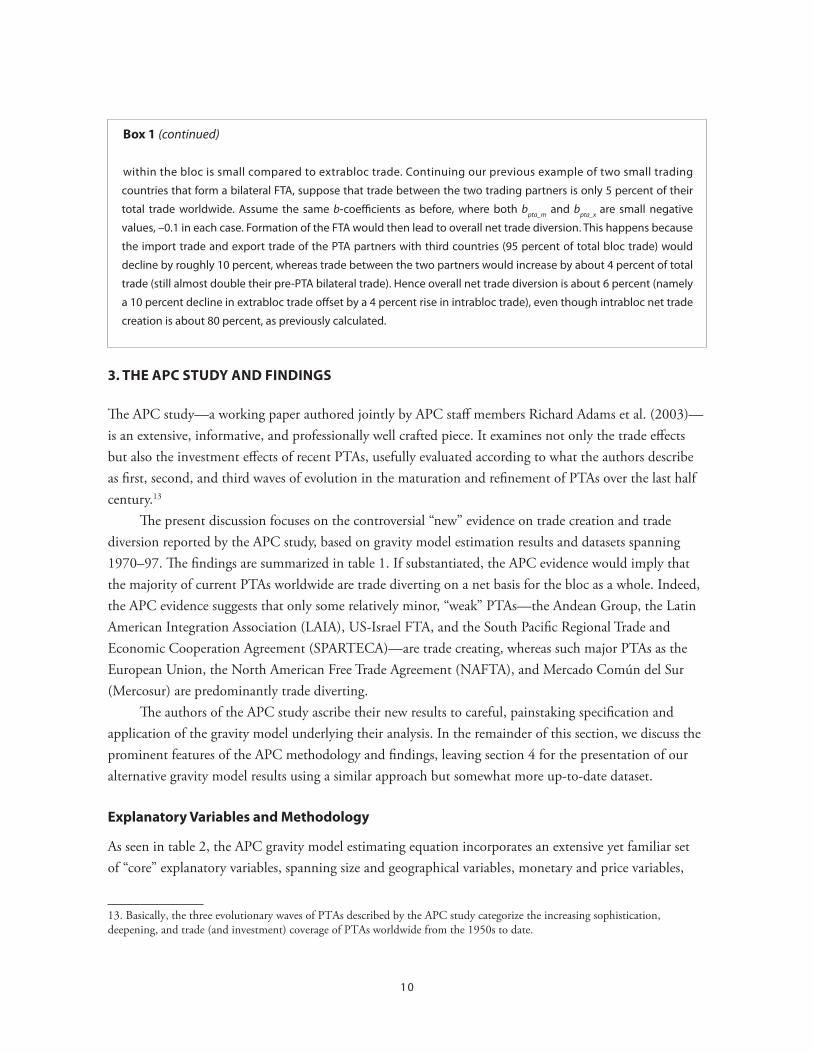
Box 1 (continued)
within the bloc is small compared to extrabloc trade. Continuing our previous example of two small trading
countries that form a bilateral FTA, suppose that trade between the two trading partners is only � percent of their
total trade worldwide. Assume the same b-coefficients as before, where both bpta_m
and bpta_x
are small negative
values, –0.� in each case. Formation of the FTA would then lead to overall net trade diversion. This happens because
the import trade and export trade of the PTA partners with third countries (�� percent of total bloc trade) would
decline by roughly �0 percent, whereas trade between the two partners would increase by about � percent of total
trade (still almost double their pre-PTA bilateral trade). Hence overall net trade diversion is about � percent (namely
a �0 percent decline in extrabloc trade offset by a � percent rise in intrabloc trade), even though intrabloc net trade
creation is about �0 percent, as previously calculated.

��
and policy and institutional variables. However, the first notable innovation of the APC methodology is apparent in the specification of the PTA-related explanatory variables, three of which are the Soloaga-Winters dummy variables—termed here simply PTA, PTA_m, and PTA_x. As discussed in section 2, on a combined basis these three dummy variables are intended to capture the gross intrabloc trade effects of a given PTA and hence provide an indication of whether the PTA is trade creating, on a net basis, for the bloc as a whole.
The APC study emphasizes that the three dummy variables representing each PTA should be “dynamic,” that is, defined to be unity for PTA members only in those years for which the PTA is in force and the individual members are enrolled in the PTA.14 In addition to specifying such dynamic PTA indicator variables, the APC study also weights the three PTA dummy variables by a specially developed liberalization index for each PTA, the member liberalization index (MLI). This index provides a numerical index of the extent of liberalization by members of each PTA, evaluated according to several specific elements covering details of agriculture and industrial trade liberalization by the PTA. By this painstaking and innovative methodology, the APC study arguably places greater weight on the observations for the indicator variables for those PTAs in which the members have, in some average sense, genuinely observed the terms of their PTA.15 However, the MLI weights are not computed on a dynamic basis but rather for a single recent year. Another innovation of the APC study is the specification of a so-called third-wave explanatory variable for all PTAs combined. This variable is specified in a similar fashion as the other PTA indicator variables but is formed by weighting only the primary PTA dummy variable by a MLI index covering trade in services and then summing across all PTAs considered. Thus, the third-wave variable provides a novel approach to assessing the importance of the recent “deepening” of PTAs to include the liberalization of trade in services, together with nontrade policies and factors that impinge on bilateral and regional economic relations. The particular construction of the third-wave variable, however, raises a concern, because the variable may be collinear with the other PTA indicator variables in the regression dataset. This could affect the reliability of the regression estimates for the PTA-related variables.16 A second set of dummy or indicator variables added to the core gravity model variables in the APC study consists of specific-effects variables to capture the possible impacts on bilateral trade of each
14. The APC study points out that many early gravity model studies simply specified PTA dummy variables for PTA members without regard for the actual dates of the trading arrangements or for their changing memberships. The APC study terms this the antimonde PTA specification. 15. The MLI weights provide something of a common scale for judging the comprehensiveness and implementation record of the PTAs considered. However, the MLI weights should not be viewed as improving the precision or reliability of the regression coef-ficient estimates because they apply a linear scale to each PTA (0,1) indicator variable, multiplying it by a single value and hence do not add to the fundamental explanatory power of the “raw” PTA indicator variables.16. By its construction, the third-wave variable may in fact be expressed as a linear combination of the primary PTA indica-tor variables, raising the possibility of serious multicollinearity among the PTA-related explanatory variables. Multicollinearity is a problem that arises in econometrics when two or more explanatory variables are strongly if not perfectly correlated with one another, in which case no reliable estimates for the regression coefficients may be found. Fortunately, econometric software programs generally test for multicollinearity problems and drop individual explanatory variables as necessary when extreme multi-collinearity is detected. See for instance Greene (2003).

��
trading country treated separately as an importing country and as an exporting country and a specific-effects variable for each year covered by the regression data. In the parlance of panel data analysis, these specific effects are unobserved influences and are represented in the gravity model by country and year indicator variables akin to the multilateral-resistance and time factors seen in equation (2) in section 2. As discussed in section 2, the representation of these variables is important to account for possibly omitted variables.
However, it should also be recognized that the inclusion of these variables, especially those representing each country as an importer and exporter, add vastly to the total number of explanatory variables in the gravity model regression equation, reducing degrees of freedom and raising the specter of multicollinearity problems. It should also be recognized that the APC gravity model does not specify a specific-effects variable for each country pair in the regression equation. Such a variable would account for possible unobserved or omitted explanatory variables in the cross-section dimension, as specified in the theory-based gravity model discussed in section 2. Such cross-section dimension variables, and the problems involved in estimating their significance using either a random-effects or a fixed effects approach, are the primary focus of much of the technical literature on the econometric analysis of panel data. It is perhaps surprising that country pair specific-effects variables were not included in the APC study. Finally, the APC study emphasizes the truncated and/or censored nature of the trade data used in many gravity model studies, since zero-value trade flows account for nearly 45 percent of the observations on bilateral trade between 116 countries in the APC study dataset over the 28-year estimation period 1970–97. As discussed in section 2 above, trade statistics are frequently censored or truncated when the recorded values of trade of a country pair is less than a given amount. In the context of the typical log-linear specification of the gravity model, zero-value trade flows present a particular numerical problem, because their logarithmic values approach negative infinity and hence, strictly speaking, are not mathematically defined. To circumvent these problems, following Eaton and Tamura (1994), Clark and Tovares (2000), and Soloaga and Winters (2001), the APC investigators estimate their gravity model using the Tobit method. The Tobit method involves estimation of the gravity model parameters by the maximum likelihood technique on the assumption that the trade data are distributed normally. Essentially, the gravity model observations are divided between nonzero-value and zero-value observations on trade in the dataset, and the probabilities for both sets of observations are computed as an integral part of the maximum likelihood procedure (Long 1997). In this way, the APC study avoids possible estimation errors for the gravity model parameters, including those associated with the PTA indicator variables that might occur if the gravity model dataset were truncated by dropping the observations for zero-value trade flows.
estimation results
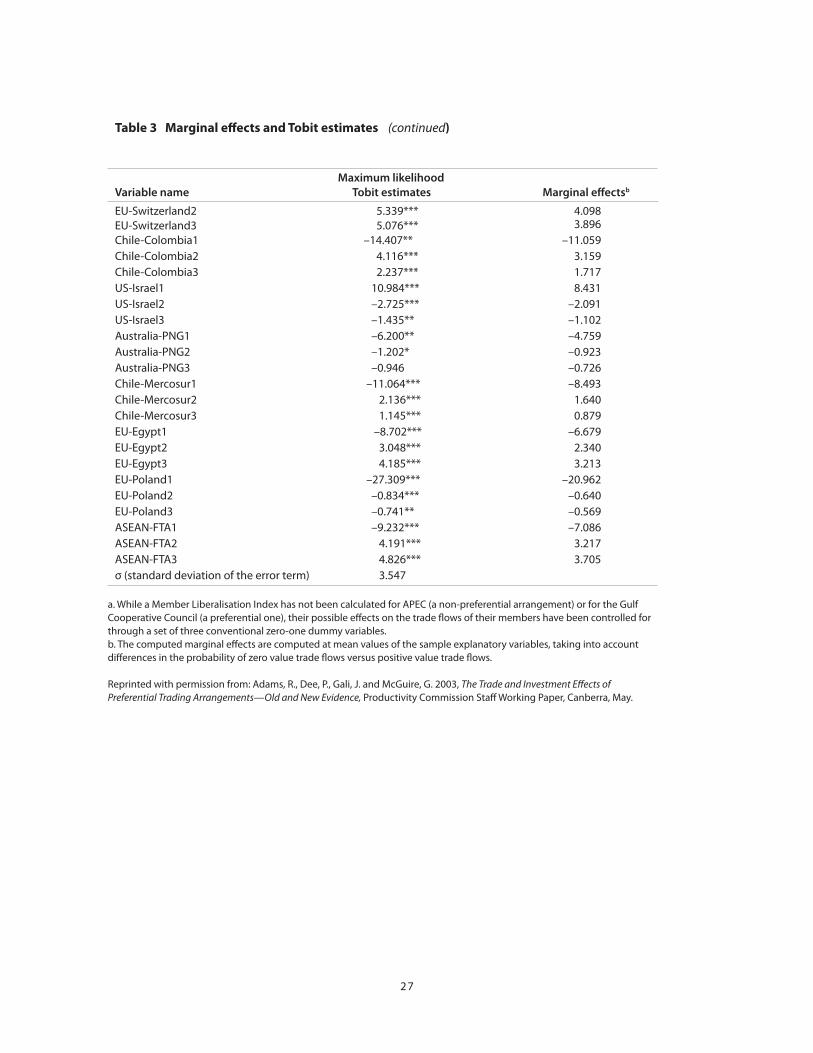
The central estimation results found by the APC gravity model are presented in table 3, which details both the “raw” Tobit regression results and the so-called marginal effects that are generated when the raw

��
estimates are adjusted to reflect the impacts of the censored values of the dependent variable.17 Although differences are apparent between the raw and adjusted estimates, the two sets of estimates are clearly proportional to one another, and so the discussion here focuses simply on the raw estimation results. The estimation results for the fixed effects variables, representing unobserved country and time effects, are not reported in order to save space. The parameter estimates for the “core” explanatory variables mainly bear the anticipated signs and are statistically significant. The innovative third-wave provisions variable is positive and significant in the APC gravity model, suggesting that “deeper” integration under recent PTAs has promoted bilateral merchandise trade—and perhaps foreign investment and trade in services as well. Finally, and most important, the estimation results in table 3 indicate that the PTA indicator variables are usually significant but frequently negative, indicating that net trade diversion occurs in the majority of the PTAs considered by the APC study.18
These last results are at considerable odds with the findings of most previous gravity model studies of PTAs and challenge the widely held perception that the spread of FTAs around the world fosters greater intrabloc trade and perhaps greater economic welfare. The results in table 3 are still more curious because the four PTAs found to be net trade creating—Andean Pact, LAFTA/LAIA, SPARTECA, and US-Israel FTA—are among the smallest and most “illiberal” PTAs covered by the APC dataset.
4. FIndInGs usInG an alternatIve GravIty Model
The APC model and dataset are not publicly available, and therefore the APC study findings are investigated here using an alternative but similar gravity model and dataset.
augmented rose Model
We employ the Rose (2004) gravity model and dataset, augmented by disaggregated bilateral trade data compiled by Feenstra and Lipsey (2005), in association with the National Bureau of Economic Research (NBER), for the period 1970–99.19 In the augmented Rose model, we substitute the NBER trade data for the combined (export plus import) bilateral trade data originally compiled by Rose for the period 1948–99. To make the NBER bilateral trade data manageable, the trade flows are aggregated from the 4-digit level of the Standard International Trade Classification (SITC) system to the total of all merchandise
17. In the adjusted estimates, account is taken for differences in the probability of occurrence of zero-value trade observations versus positive-value trade observations. As the probability of a trade flow being zero becomes more and more remote (at different levels of the explanatory variables), the computed marginal effects of the explanatory variables will approach the effects given by the estimated coefficients in the “raw” Tobit regression results. See Long (1997).18. Moreover, the negative APC estimates for the third PTA indicator variable (exports by PTA members to all countries in the world) indicate that the countries excluded by the PTAs often experience reduced economic welfare.19. The combined Rose and Feenstra-Lipsey gravity model dataset has its origins in a series of gravity model analyses of prospec-tive US FTAs pursued by the Peterson Institute for International Economics. See for instance Hufbauer and Baldwin (2006).
��
trade (SITC 0 through 9) and, alternatively, to an aggregate covering all trade in manufactures (SITC 5 through 8).
The “core” explanatory variables of the Rose gravity model are similar in specification to the explanatory variables in the APC model, with the exception that the Rose gravity model dataset does not include observations on import tariffs and exchange rates (see table 4).
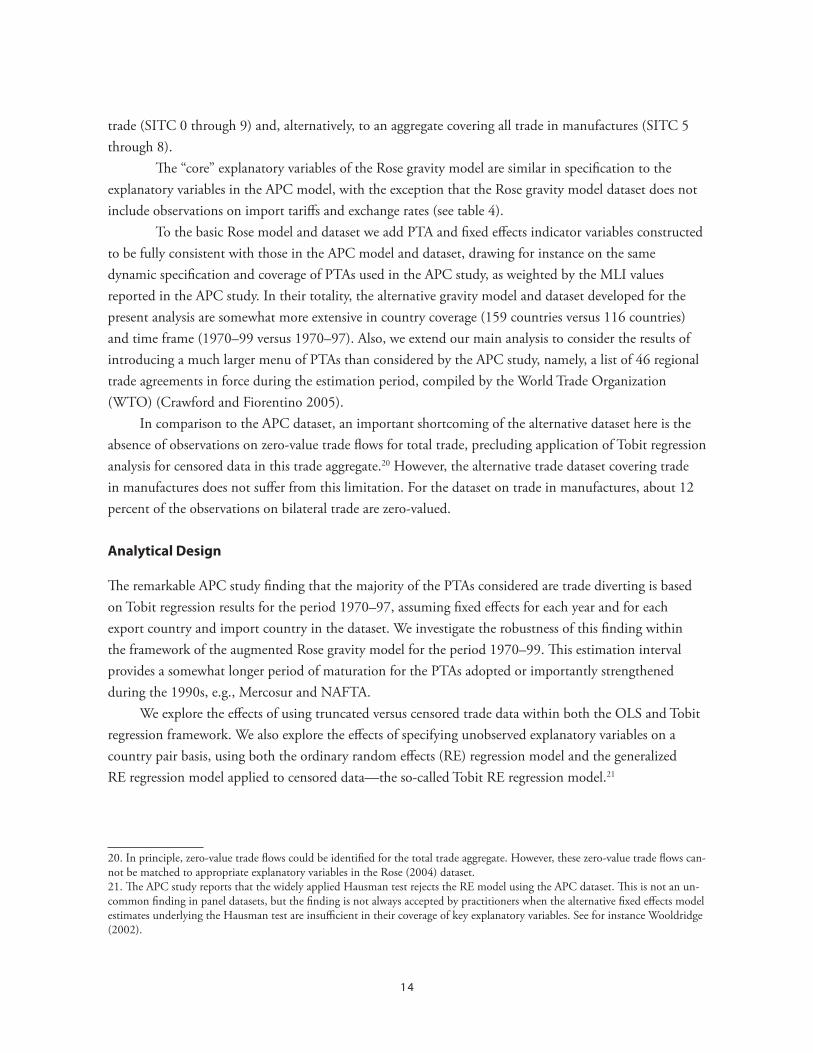
To the basic Rose model and dataset we add PTA and fixed effects indicator variables constructed to be fully consistent with those in the APC model and dataset, drawing for instance on the same dynamic specification and coverage of PTAs used in the APC study, as weighted by the MLI values reported in the APC study. In their totality, the alternative gravity model and dataset developed for the present analysis are somewhat more extensive in country coverage (159 countries versus 116 countries) and time frame (1970–99 versus 1970–97). Also, we extend our main analysis to consider the results of introducing a much larger menu of PTAs than considered by the APC study, namely, a list of 46 regional trade agreements in force during the estimation period, compiled by the World Trade Organization (WTO) (Crawford and Fiorentino 2005).
In comparison to the APC dataset, an important shortcoming of the alternative dataset here is the absence of observations on zero-value trade flows for total trade, precluding application of Tobit regression analysis for censored data in this trade aggregate.20 However, the alternative trade dataset covering trade in manufactures does not suffer from this limitation. For the dataset on trade in manufactures, about 12 percent of the observations on bilateral trade are zero-valued.
analytical design
The remarkable APC study finding that the majority of the PTAs considered are trade diverting is based on Tobit regression results for the period 1970–97, assuming fixed effects for each year and for each export country and import country in the dataset. We investigate the robustness of this finding within the framework of the augmented Rose gravity model for the period 1970–99. This estimation interval provides a somewhat longer period of maturation for the PTAs adopted or importantly strengthened during the 1990s, e.g., Mercosur and NAFTA.
We explore the effects of using truncated versus censored trade data within both the OLS and Tobit regression framework. We also explore the effects of specifying unobserved explanatory variables on a country pair basis, using both the ordinary random effects (RE) regression model and the generalized RE regression model applied to censored data—the so-called Tobit RE regression model.21
20. In principle, zero-value trade flows could be identified for the total trade aggregate. However, these zero-value trade flows can-not be matched to appropriate explanatory variables in the Rose (2004) dataset.21. The APC study reports that the widely applied Hausman test rejects the RE model using the APC dataset. This is not an un-common finding in panel datasets, but the finding is not always accepted by practitioners when the alternative fixed effects model estimates underlying the Hausman test are insufficient in their coverage of key explanatory variables. See for instance Wooldridge (2002).
��
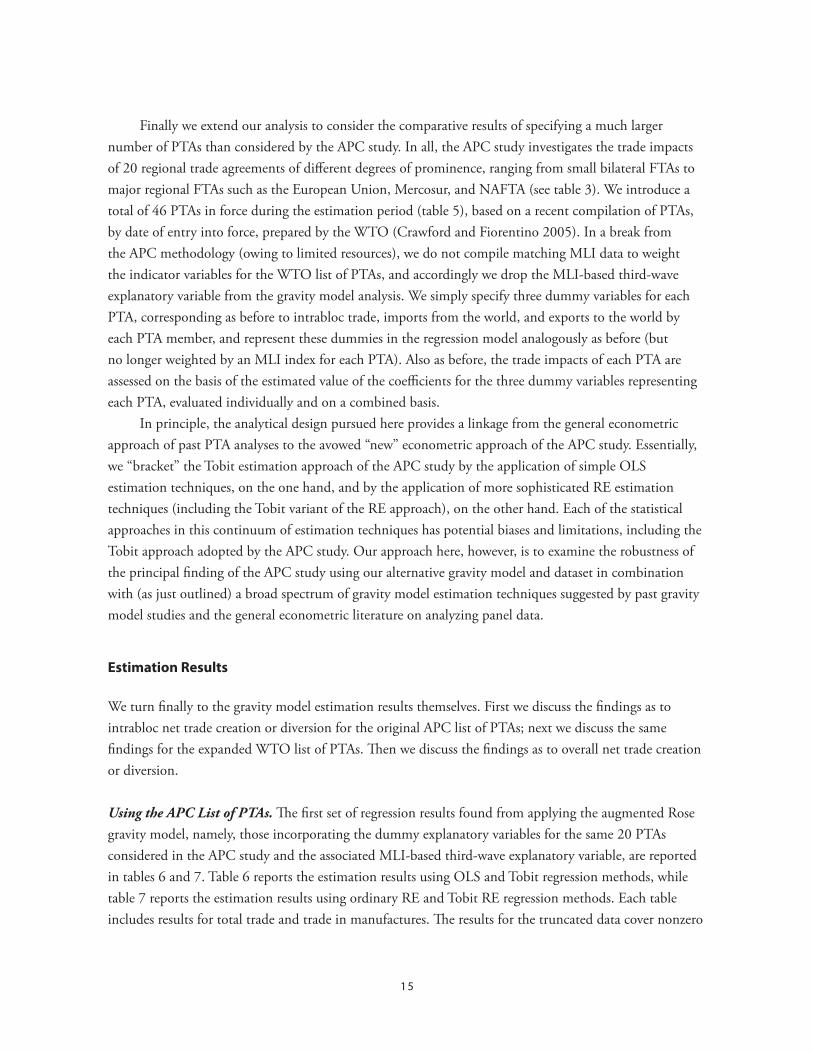
Finally we extend our analysis to consider the comparative results of specifying a much larger number of PTAs than considered by the APC study. In all, the APC study investigates the trade impacts of 20 regional trade agreements of different degrees of prominence, ranging from small bilateral FTAs to major regional FTAs such as the European Union, Mercosur, and NAFTA (see table 3). We introduce a total of 46 PTAs in force during the estimation period (table 5), based on a recent compilation of PTAs, by date of entry into force, prepared by the WTO (Crawford and Fiorentino 2005). In a break from the APC methodology (owing to limited resources), we do not compile matching MLI data to weight the indicator variables for the WTO list of PTAs, and accordingly we drop the MLI-based third-wave explanatory variable from the gravity model analysis. We simply specify three dummy variables for each PTA, corresponding as before to intrabloc trade, imports from the world, and exports to the world by each PTA member, and represent these dummies in the regression model analogously as before (but no longer weighted by an MLI index for each PTA). Also as before, the trade impacts of each PTA are assessed on the basis of the estimated value of the coefficients for the three dummy variables representing each PTA, evaluated individually and on a combined basis.
In principle, the analytical design pursued here provides a linkage from the general econometric approach of past PTA analyses to the avowed “new” econometric approach of the APC study. Essentially, we “bracket” the Tobit estimation approach of the APC study by the application of simple OLS estimation techniques, on the one hand, and by the application of more sophisticated RE estimation techniques (including the Tobit variant of the RE approach), on the other hand. Each of the statistical approaches in this continuum of estimation techniques has potential biases and limitations, including the Tobit approach adopted by the APC study. Our approach here, however, is to examine the robustness of the principal finding of the APC study using our alternative gravity model and dataset in combination with (as just outlined) a broad spectrum of gravity model estimation techniques suggested by past gravity model studies and the general econometric literature on analyzing panel data.
estimation results
We turn finally to the gravity model estimation results themselves. First we discuss the findings as to intrabloc net trade creation or diversion for the original APC list of PTAs; next we discuss the same findings for the expanded WTO list of PTAs. Then we discuss the findings as to overall net trade creation or diversion.
Using the APC List of PTAs. The first set of regression results found from applying the augmented Rose gravity model, namely, those incorporating the dummy explanatory variables for the same 20 PTAs considered in the APC study and the associated MLI-based third-wave explanatory variable, are reported in tables 6 and 7. Table 6 reports the estimation results using OLS and Tobit regression methods, while table 7 reports the estimation results using ordinary RE and Tobit RE regression methods. Each table includes results for total trade and trade in manufactures. The results for the truncated data cover nonzero
��
trade flows only. Those for the censored data (manufactured trade only) additionally include observations for zero-value trade flows, with all trade flows equal to or less than $10,000 (in 1984 dollars) set equal to the natural log value of this arbitrarily assumed, lower-bound figure for aggregate trade in manufactures between countries.22 Also, the two tables present regression results without and with export and import country fixed effects.23 Finally, the tables report the numbers of PTAs found to be trade creating and, alternatively, found to be trade diverting. This count is based on (1) the sign and significance of the estimated coefficient for the first PTA indicator variable (this is the common practice in most gravity model studies) and (2) the sign of the sum of significant estimated coefficients for the three indicator variables corresponding to each PTA (the Soloaga-Winters approach adopted in the APC study).24, 25
The regression results for total trade, and alternatively for trade in manufactures, mirror the widely reported empirical robustness of the gravity model. In particular, the core explanatory variables, led by distance, joint real GDP, and joint real GDP per capita, bear the anticipated signs and are generally significant at high levels. Thus, for instance, bilateral trade is positively related to the joint GDP of the partner countries and negatively related to the distance between them. Similarly countries sharing a common border tend to trade significantly more with one another, whereas landlocked countries tend to trade significantly less than other pairs of countries.
The overall explanatory power of the augmented gravity model varies depending upon the estimation technique employed, whether censored data are included, and whether the export and import country fixed effects are included. The overall explanatory power of both the OLS and the RE regression results are very similar for total trade and trade in manufactures (R-squared 0.60 to 0.75). At the same time, the explanatory power of the Tobit regressions that utilize the censored trade data is appreciably lower (R-squared 0.16 to 0.33). The seemingly lower explanatory power of the Tobit regressions, however, is something of an artifact, resulting from the difficulty of precisely defining the goodness of fit for Tobit regressions involving censored data.26 More important to note in the estimation results is that including the country fixed effects variables in the regression equations boosts the overall explanatory power of the equations substantially.27
Our interest here is primarily in the estimation results for the PTA indicator variables specified by the APC study, including the third-wave variable. The coefficients estimated for these variables are far
22. See Rose (2004) for a similar approach to investigating the implications of censored trade data in gravity models.23. Year fixed effects are included in all regressions. To conserve space, year and country fixed effects are not reported in the tables of regression results.24. In total, some 20 PTAs are specified following the format of the APC study. However, the indicator variables for three of the PTAs are dropped in the regressions because of their recent adoption (e.g., the Singapore–New Zealand PTA) and resulting col-linearity problems. 25. Although it might be feasible, no joint test of the statistical significance of the sum of the three PTA indicator variables was conducted under the Soloaga-Winters approach.26. The R-squared values in the tables for the Tobit regressions are “pseudo” values provided by the regression software. Unfortu-nately, they do not make it entirely clear whether the overall explanatory power of the Tobit regressions is in fact weaker than that of the other regressions in the tables. For discussion, see Long (1997). 27. It is noteworthy that considerable investments in both personal computer hardware and computational time were necessary to carry out the econometric analysis described here. The Tobit RE regressions in particular required more than two gigabytes of random access memory and more than 72 hours of processor time using the 64-bit version of Stata 9.1 for Windows.
��
from uniform in sign and statistical significance across the different estimation intervals and estimation techniques employed. For instance, the third-wave variable is generally positive and significant in the OLS regressions for trade in manufactures and the RE regressions for total trade but generally negative in the OLS regressions for total trade and RE regression for trade in manufactures.28
By design, tables 6 and 7 provide a guide to the instances in which the coefficient estimates for the PTA indicator variables imply that the individual PTAs are trade diverting, according to either common practice (PTA coefficient estimates individually highlighted in bold) or the Soloaga-Winters approach (shaded PTA coefficient estimates). There appears to be no regularity in the pattern of trade diverting PTAs indicated by either the highlighted or shaded PTA coefficient estimates. Moreover, there is no apparent correlation between the instances of trade diverting PTAs identified by the two approaches. For instance, although the ASEAN FTA is frequently found to be trade diverting by the first approach, it is seldom so judged by the Soloaga-Winters approach. The reason for the different evaluations is that the coefficient estimates for the import- and export-related indicator variables for the ASEAN FTA are strongly positive and significant, with the result that the PTA is judged to be trade creating on balance. Similar differences are frequently apparent in the regression results for the European Union.
The one case in which there does appear to be a strong correlation between trade diverting PTAs identified by the two criteria is the EU-Switzerland PTA, most prominently in the OLS regression results for total trade and in the RE regression results for trade in manufactures.
More generally, neither the common interpretation of the PTA indicator variables nor the Soloaga-Winters interpretation of these variables over the different estimation intervals and techniques applied in the present analysis leads to uniform judgments regarding the trade creating or trade diverting nature of the 20 PTAs considered in the APC study.
Finally, the present estimation results do not find evidence of near uniform net trade diversion for the 20 PTAs considered for any of the estimation intervals or econometric techniques applied using the augmented Rose gravity model and dataset, including instances when the export and import country fixed effects are included in the regression analysis. Although in some instances, the frequency of PTAs identified as trade diverting by the Soloaga-Winters criterion climbs as high as about 45 percent (eight out of 18 PTAs in force during 1970–99, mainly in the regression results without country effects), the predominant finding in tables 6 and 7 is that the PTAs considered in the APC study are mainly trade creating. The frequency of net trade creating versus net trade diverting PTAs is substantially higher than 50 percent across a relatively broad spectrum of estimation intervals and techniques, inclusive of the specific estimation interval and technique employed by the APC study.
Using the WTO List of PTAs. The second set of regression results considered here is presented in table 8 (OLS and Tobit) and table 9 (RE and Tobit RE). The second set of regression results is based on the
28. Whether these obverse results may be traced to some degree of collinearity in the regression data between the third-wave vari-able and the related PTA indicator variables is uncertain.
��
same technical specifications as the first set, but incorporates dummy explanatory variables for 46 PTAs identified by the WTO (Crawford and Fiorentino 2005).
Broadly speaking, the basic profile of the second set of regression results is very similar to the first. The estimated coefficients of the “core” explanatory variables of the augmented Rose gravity model continue to exhibit their anticipated signs and, in the main, are statistically significant. Moreover, the goodness of fit of the regressions appears much as before, with R-squared values ranging between about 0.60 and 0.75 except for the ordinary Tobit and Tobit RE regressions.
The second set of regressions provides a larger and arguably more interesting set of PTAs to assess their intrabloc and multilateral trade impacts. In particular, the second set of regression results indicates that a number of bilateral FTAs are judged to be mainly trade diverting based on either common practice (PTA coefficient estimates individually highlighted in bold) or the Soloaga-Winters approach (shaded PTA coefficient estimates). Generally, the prominent, “large” regional trade agreements, such as the European Union, Mercosur, NAFTA, and again ASEAN, are judged to be trade creating, including through their trade with third countries.
Most important is the continued finding of the analysis here that the preponderance of PTAs—more than 50 percent of the PTAs identified by the WTO included in the second set of gravity model regressions—are judged to be trade creating on a net basis. As before in the first set of regression results, this finding stands in stark contrast to the principal finding of the APC study that most PTAs today are trade diverting on an intrabloc basis.
PTA Impact on Overall Trade. To this point, the net trade creation and trade diversion effects of the WTO list of PTAs have been evaluated strictly in terms of the gravity model estimates of the PTA indicator variable coefficients, following both the common approach and the Soloaga-Winters approach. However, as discussed in box 1, these approaches are narrowly focused on the net impact of the PTAs on intrabloc trade, disregarding possibly larger and critically important impacts of the PTAs on overall bloc trade and world welfare.
We investigate this possibility by calculating the overall trade impacts of the WTO PTAs, based on the estimated coefficients of the PTA indicator variables in one of the “central” regression models in table 9—the RE variant of the augmented Rose gravity model with country fixed effects and truncated data (for total trade and trade in manufactures). Our calculations are based on the mean levels of intrabloc and extrabloc trade of the PTAs over the estimation period 1970–99.
There are two reasons for calling out manufactures for separate examination. First, PTAs are most likely to provide the greatest new liberalization between members in manufactured goods trade—rather than agricultural goods, which are often subject to high and resistant barriers, or minerals, which are often freely traded even before the PTA. Hence, the trade effects are likely to be largest for manufactured goods. Second, the degree of potential substitution, and hence the potential for trade diversion, is likely to be higher for manufactured goods than for agriculture or minerals.
To our central regression model estimates for the PTA indicator variables, we add a second set of regression model estimates suggested by Rieder (2006). The Rieder approach to incorporating PTA
��
variables into the gravity trade model framework is more straightforward, albeit more narrowly focused, than the Soloaga-Winters approach. It specifies a primary, dynamic dummy variable for each PTA to capture direct intrabloc trade creation or trade diversion effects as before, but then adds a single secondary dummy variable to assess the extent of possible trade diversion effects arising from changes in imports solely from nonmember countries.29 Under the Rieder approach, the net impact of a given PTA is measured by the sum of the direct and indirect effects of the trade bloc, as captured by the estimated coefficients of the PTA and PTA_m indicator variables.
For the present analysis, we have reestimated the augmented Rose gravity model with country fixed effects and truncated data, using both total merchandise trade and trade in manufactures. We leave the details of the regression results for the interested reader to peruse in table 10. However, we may note that, broadly speaking, the regression results using the Rieder PTA indicator variables are very similar in character to the regression results using the Soloaga-Winters PTA indicator variables. This similarity extends to 46 WTO-compiled PTAs that are identified as either trade creating or trade diverting on a net basis, based on the sign of either the first estimated PTA coefficient or the sum of the two estimated PTA coefficients.
Our present analysis goes an important step further, as seen in our calculations for total trade using both the Soloaga-Winters and the Rieder PTA indicators in table 11 and those for trade in manufactures in table 12. The impact on intrabloc trade is estimated by applying the sum of the coefficients of the PTA indicator variables to the mean level of intrabloc trade, whereas the impact on extrabloc trade is estimated by applying the coefficients of the global imports and global exports PTA indicator variables to the appropriate mean level of extrabloc imports and extrabloc exports, respectively. The impacts on intrabloc trade are calculated both as percent changes relative to the mean level of two-way intrabloc trade, and as percent changes relative to the mean level of total two-way bloc trade (intrabloc plus extrabloc). The impacts on extrabloc trade are calculated only as percent changes relative to the mean level of total two-way bloc trade. The overall trade impact of each PTA is computed as the sum of the intrabloc and extrabloc effects, both expressed as a percent change relative to the mean level of total two-way bloc trade. If the overall trade impact is positive, then the PTA may be considered trade creating on an overall net basis. Conversely, if the overall trade impact is negative, then the PTA must be considered trade diverting on an overall net basis.
It is apparent that the extrabloc trade effects frequently dominate the intrabloc trade effects of PTAs. In the case of the Andean Community, for instance, when the Soloaga-Winters PTA indicators are assumed, the impact on total intrabloc trade of the PTA (namely –0.2 percent of overall trade) is simply dwarfed by the impacts of the PTA on total extrabloc imports (–7.9 percent of overall trade) and total extrabloc exports (–10.4 percent of overall trade). Similarly, when the Rieder PTA indicators are assumed, the impact on total intrabloc trade of the Andean PTA is zero (the estimated PTA coefficient is insignificant), and the overall net impact of the PTA is entirely attributable to the impact of the PTA on total imports from nonmember countries (–8.8 percent of overall trade).
29. In contrast, recall that the Soloaga-Winters approach specifies separate dummies for both bloc exports and bloc imports with all trading partners.

�0
The most important finding from the calculations reported in tables 11 and 12 is that only a modest number of the WTO PTAs (not more than 15 out of 46) are found to be trade diverting on an overall net basis, for both total trade and trade in manufactures. This is true regardless whether the Soloaga-Winters PTA indicators or the Rieder PTA indicators are assumed. Casual inspection suggests a high correlation between the PTAs identified as trade diverting by the two approaches. Above all, our extended method of assessing the trade impacts of PTAs, adapted from Soloaga-Winters (2001) and Rieder (2006), finds the preponderance of the WTO PTAs to be trade creating on an overall net basis.
5. conclusIon
The contrarian, “new” evidence that current PTAs worldwide are predominantly trade diverting provided by the recent APC gravity model study by Adams et al. (2003) poses a fundamental challenge to the ongoing rapid spread of FTAs and other PTAs. The APC finding leads directly to skeptical questions about the presumed trade and welfare benefits of these arrangements. In response, this paper has reviewed both the general methodology of applying gravity trade models to the problem of assessing the efficacy of PTAs and the specific details of the APC gravity model study. This evaluation leads to no major criticisms of the APC methodology.
However, to explore the robustness of the APC study results, the present paper has undertaken an independent empirical analysis of the trade impacts of the same PTAs considered by the APC study and a substantially larger number of current PTAs identified by the WTO. Using a variant of the Rose (2004) gravity model augmented by somewhat more up-to-date data than utilized by the APC study and applying a variety of econometric techniques, inclusive of the Tobit method employed by the APC investigators, the present analysis finds that the majority of PTAs in force today are trade creating rather than trade diverting. This is true not only on an intrabloc basis but also on an overall trade basis. In sum, the present econometric results are diametrically at odds with the APC study findings but nearly squarely in line with most of the gravity model literature on PTAs.
reFerences
Adams, R., P. Dee, J. Gali, and G. McGuire. 2003. The Trade and Investment Effects of Preferential Trading Arrangements—Old and New Evidence. Staff Working Paper. Australia Productivity Commission. Canberra.
Anderson, J. E. 1979. A Theoretical Foundation for the Gravity Equation. American Economic Review 69: 106–116.
Anderson, J. E., and E. van Wincoop. 2003. Gravity with Gravitas: A Solution to the Border Puzzle. American Economic Review 93, no.1: 170–92.
Anderson, J. E., and E. van Wincoop. 2004. Trade Costs. Journal of Economic Literature 42 (September): 691–751.

��
Armington, P. 1969. A Theory of Demand for Products Distinguished by Place of Production. International Monetary Fund Staff Papers 16, no. 1: 159–78.
Baldwin, R., and D. Taglioni. 2006. Gravity for Dummies and Dummies for Gravity Equations. NBER Working Paper 12516. Cambridge, MA: National Bureau of Economic Research.
Baltagi, B. H. 2005. Econometric Analysis of Panel Data (3d. ed.). Chichester, UK: John Wiley and Sons. Bayoumi, T., and B. Eichengreen. 1997. Is Regionalism Simply a Diversion? Evidence from the Evolution of the EC and EFTA. In Regionalism versus Multilateral Trade Arrangements, ed. T. Ito and A. O. Krueger. Chicago: University of Chicago Press.
Clark, X., and J. Tovares. 2000. A Quantitative Approach Using the Gravity Model. Development Discussion Paper No. 748. Cambridge, MA: Harvard Institute for International Development.
Crawford, J., and R.V. Fiorentino. 2005. The Changing Landscape of Regional Trade Agreements. WTO Discussion Paper 8. Geneva: World Trade Organization
Deardorff, A. V. 1998. Determinants of Bilateral Trade: Does the Gravity Work in a Neoclassical World. In The Regionalization of the World Economy, ed. J. A. Frankel. Chicago: University of Chicago Press.
Eaton, J., and A. Tamura. 1994. Bilateralism and Regionalism in Japanese and US Trade and Direct Investment Patterns. Journal of the Japanese and International Economies 8 (December): 478–510.
Feenstra, R. C., R. E. Lipsey, et al. 2005. World Trade Flows: 1962–2000. NBER Working Paper 11040. Cambridge, MA: National Bureau of Economic Research.
Frankel, J. A. 1997. Regional Trading Blocs in the World Economic System. Washington: Institute for International Economics.
Greenaway, D., and C. Milner. 2002. Regionalism and Gravity. Scottish Journal of Political Economy 49, no. 5: 574–85.
Greene, W. H. 2003. Econometric Analysis (5h ed). Upper Saddle River, NJ: Prentice-Hall.
Hausman, J. A., and W. E. Taylor. 1981. Panel Data and Unobservable Individual Effects. Econometrica 49, no. 6: 1377–98.
Helpman, E., and P. Krugman. 1985. Market Structure and Foreign Trade. Cambridge, MA: MIT Press.
Helpman, E., M. Melitz, and Y. Rubenstein. 2004. Trading Partners and Trading Volumes. Available at http://post.economics.harvard.edu/faculty/helpman/papers.html.
Hsiao, C. 2003. Analysis of Panel Data (2d ed.). Cambridge: Cambridge University Press.
Hufbauer, G. C., and R. Baldwin. 2006. The Shape of a Swiss-US Free Trade Agreement. Washington: Institute for International Economics.

��
Long, J. S. 1997. Regression Models for Categorical and Limited Dependent Variables. Advanced Quantitative Techniques in the Social Sciences Series, no. 7. Thousand Oaks, CA: Sage Publications.
Poyhonen, P. 1963. A Tentative Model for the Volume of Trade between Countries. Weltwirtschaftliches Archiv 90: 93–99.
Rieder, R. 2006. Playing dominoes in Europe: An Empirical Analysis of the Domino heory for the EU, 1962–2004. HEI Working Paper 11/2006. Geneva, Switzerland: Graduate Institute of International Studies.
Rose, A. K. 2004. Do We Really Know That the WTO Increases Trade? American Economic Review 94, no. 1: 98–114.
Soderling, L. 2005. Is the Middle East and North Africa Region Achieving Its Trade Potential? IMF Working Paper WP/05/90. Washington: International Monetary Fund.
Soloaga, I., and L. A. Winters. 2001. Regionalism in the Nineties: What Effect on Trade? North American Journal of Economics and Finance 12: 1–29.
Tinbergen, J. 1962. Shaping the World Economy. New York: Twentieth Century Fund.
Tobin, J. 1958. Estimation of Relationships for Limited Dependent Variables. Econometrica 26: 24–36.
Viner, J. 1950. The Customs Union Issue. New York: Carnegie Endowment for International Peace.
Wooldridge, J. M. 2002. Econometric Analysis of Cross Section and Panel Data. Cambridge, MA: MIT Press.
��
table 1 new evidence on Ptas as causing net trade creation or diversion
Past estimates New estimates
Net trade creation
Net trade diversion
Net trade creation
Net tradediversionInconclusive
Andean LAIA NAFTA Andean AFTA CER Mercosur LAFTA/LAIA EFTA
AFTA US-Israel EC/EU
EEC/EU? SPARTECA Mercosur
EFTA? NAFTA CEREU-SwitzerlandChile-ColombiaAustralia-PNGChile-MercosurEU-Egypt
EU-Poland
Reprinted with permission from: Adams, R., Dee, P., Gali, J. and McGuire, G. �00�, The Trade and Investment Effects of Preferential Trading Arrangements—Old and New Evidence, Productivity Commission Staff Working Paper, Canberra, May.

��
(table contniunes next page)
Table 2 The APC Gravity Model
Ln X*ijt = a + αi + γj + λt + β1 LnSGDPijt + β2 LnRLFAijt + β3 LnSimilarijt
+ β4 LnDisij + β5 LnRERijt + β6 LnTarijt + β7 Linij + β8 Borij
+ β9 Colij + β10 Curij + β 11Isi + β12 Isj + β13locki + β14 lockj
+ β153waveij + ∑ ij MRTAij + ∑− j MRTAi j + ∑− I MRTAj i
+ Ln ε ijt
where
Ln represents the natural logarithmic transformation;
X*ijt is the value of exports from country i to j in year t; using exports as a dependent variable
rather than total bilateral trade allows the identification of export and import diversion separately;
αi
is unobserved specific effects in exporting country i;
γj
is unobserved specific effects in importing country j;
λt is unobserved specific effects in time period t;
SGDPijt
is the sum of bilateral GDPs of i and j in year t;
RLFAijt
is the absolute differences in GDP per capita of i and j in year t;
Similarijt
is similarity in country size between i and j in year t in terms of aggregate GDP;
Disij
is distance between the two largest or capital cities of countries i and j;
RERijt
is the bilateral real exchange rate between i and j in year t;
Tarijt
is an average tariff rate between i and j in year t;
Linij
is a measure of linguistic similarity between i and j;
Borij
is a dummy that takes a value 1 if i and j share a land border and 0 otherwise;
Colij
is a dummy that takes a value 1 if i and j have colonial linkages and 0 otherwise;

��
Reprinted with permission from: Adams, R., Dee, P., Gali, J. and McGuire, G. �00�, The Trade and Investment Effects of Preferential Trading Arrangements—Old and New Evidence, Productivity Commission Staff Working Paper, Canberra, May.
table 2 the aPec Gravity Model (continued)
Curij
is a dummy that takes a value 1 if i and j have the same currency and 0 otherwise;
Isi
is a dummy that takes a value 1 when i is island nations and 0 otherwise;
Lock i
is a dummy that takes a value 1 when i is a landlocked nation and 0 otherwise;
3waveij
is an index capturing the third wave provisions of a PTA; the index takes the value of the
non-merchandise MLI index if the i and j are participants of a specific PTA in the sample, and 0 otherwise; it also has a time dimension when defined in dynamic rather than antimonde form;
MRTAij
is an index capturing the merchandise trade provisions of a PTA; the index takes the value
of the merchandise MLI if both countries i and j belong to the same PTA, and 0 otherwise; it also has a time dimension when defined in dynamic rather than antimonde form;
MRTAi j
is an index that takes the value of the merchandise MLI when the importing country jbelongs to that particular PTA and 0 otherwise; it also has a time dimension when defined in dynamic rather than antimonde form;
MRTAj −i is an index that takes the value of the merchandise MLI when the exporting country i
belongs to that particular PTA, and 0 otherwise; it also has time dimension when defined in dynamic rather than antimonde form;
εijt is an error term.
Source: Adams et al. (2003).

��
table 3 Marginal effects and tobit estimates
Variable name Maximum likelihood
Tobit estimates Marginal effectsb
Ln SGDP �.00�*** �.���Ln SGDP �.00�*** �.���Ln Similarity 0.���*** 0.���Ln RLFA 0.��0*** 0.���Ln distance –�.���*** –�.���Ln bilateral real exchange rate 0.0��*** 0.0��Linguistic similarity 0.000*** 0.000Colonial �.���*** �.���Border –0.���*** –0.���Currency union �.���*** �.���Exporting country is an island –�.��0*** –�.���Importing country is an island –�.���*** –�.���Exporting country is landlocked –�.���*** –�.���Importing country is landlocked �.���*** �.���Non-merchandise MLI ��.���*** �0.���Andean� �.���*** �.���Andean� –0.�00 –0.���Andean� –�.0��*** –�.��0APEC�a –�.���*** –�.���APEC�a 0.���*** 0.��0APEC�a 0.���*** 0.���EFTA� –�.0��*** –�.���EFTA� 0.��� 0.���EFTA� �.���*** �.���EC/EU� –��.0��*** –��.���EC/EU� –�.�0�*** -0.���EC/EU� –0.���* -0.���GCC�a –�.���*** -�.���GCC�a 0.���* 0.�0�GCC�a –0.�00*** -0.���LAFTA/LAIA� ��.���*** ��.���LAFTA/LAIA� –�.���*** -�.00�LAFTA/LAIA� –0.��� -0.���Mercosur� –�.���*** -�.���Mercosur� �.���*** �.���Mercosur� –�.�0�*** –�.00�NAFTA� –��.��0*** –��.���NAFTA� �.���** 0.���NAFTA� –0.��0 –.�0�SPARTECA� ��.0��*** ��.���SPARTECA� –0.�0� –0.�0�SPARTECA� 0.��� 0.���ANZCERTA� –��.���*** –��.���ANZCERTA� –�.���*** –�.��0ANZCERTA� –�.0��*** –�.���EU-Switzerland� ��.��0*** –��.�0�
��
table 3 Marginal effects and tobit estimates (continued)
Variable name Maximum likelihood Tobit estimates Marginal effectsb
EU-Switzerland� �.���*** �.0��EU-Switzerland� �.0��*** �.���Chile-Colombia� –��.�0�** –��.0��Chile-Colombia� �.���*** �.���Chile-Colombia� �.���*** �.���US-Israel� �0.���*** �.���US-Israel� –�.���*** –�.0��US-Israel� –�.���** –�.�0�Australia-PNG� –�.�00** –�.���Australia-PNG� –�.�0�* –0.���Australia-PNG� –0.��� –0.���Chile-Mercosur� –��.0��*** –�.���Chile-Mercosur� �.���*** �.��0Chile-Mercosur� �.���*** 0.���EU-Egypt� –�.�0�*** –�.���EU-Egypt� �.0��*** �.��0EU-Egypt� �.���*** �.���EU-Poland� –��.�0�*** –�0.���EU-Poland� –0.���*** –0.��0EU-Poland� –0.���** –0.���ASEAN-FTA� –�.���*** –�.0��ASEAN-FTA� �.���*** �.���ASEAN-FTA� �.���*** �.�0�σ (standard deviation of the error term) �.���
a. While a Member Liberalisation Index has not been calculated for APEC (a non-preferential arrangement) or for the Gulf Cooperative Council (a preferential one), their possible effects on the trade flows of their members have been controlled for through a set of three conventional zero-one dummy variables.b. The computed marginal effects are computed at mean values of the sample explanatory variables, taking into account differences in the probability of zero value trade flows versus positive value trade flows.
Reprinted with permission from: Adams, R., Dee, P., Gali, J. and McGuire, G. �00�, The Trade and Investment Effects of Preferential Trading Arrangements—Old and New Evidence, Productivity Commission Staff Working Paper, Canberra, May.
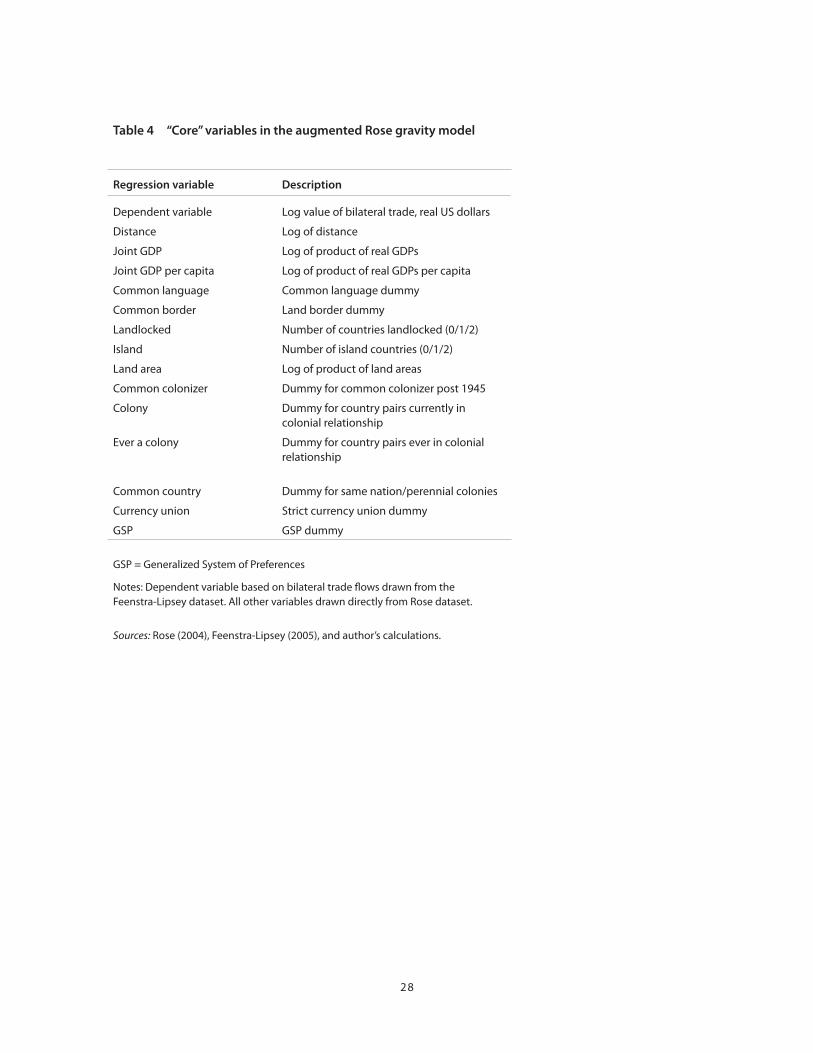
��
Table 4 “Core” variables in the augmented Rose gravity model
Regression variable Description
Dependent variable Log value of bilateral trade, real US dollars
Distance Log of distance
Joint GDP Log of product of real GDPs
Joint GDP per capita Log of product of real GDPs per capita
Common language Common language dummy
Common border Land border dummy
Landlocked Number of countries landlocked (0/�/�)
Island Number of island countries (0/�/�)
Land area Log of product of land areas
Common colonizer Dummy for common colonizer post ����
Colony Dummy for country pairs currently in colonial relationship
Ever a colony Dummy for country pairs ever in colonial relationship
Common country Dummy for same nation/perennial colonies
Currency union Strict currency union dummy
GSP GSP dummy
GSP = Generalized System of Preferences
Notes: Dependent variable based on bilateral trade flows drawn from the Feenstra-Lipsey dataset. All other variables drawn directly from Rose dataset.
Sources: Rose (�00�), Feenstra-Lipsey (�00�), and author’s calculations.

��
(table continues next page)
Table 5 WTO list of preferential trading arrangements, 1970–99
Preferential trading arrangement Date of entry into force Type of arrangement
Andean Community May ��, ���� Preferential arrangement
ANZCERTA January �, ���� Free trade agreement
Armenia-Russian Federation March ��, ���� Free trade agreement
ASEAN FTA January ��, ���� Preferential arrangement
Bangkok Agreement (BKA) June ��, ���� Preferential arrangement
Bulgaria-Turkey January �, ���� Free trade agreement
Canada-Chile July �, ���� Free trade agreement
Canada-Israel January �, ���� Free trade agreement
Central European FTA (CAFTA) March �, ���� Free trade agreement
Chile-Mexico August �, ���� Free trade agreement
Commonwealth of Independent States (CIS) December �0, ���� Free trade agreement
EFTA (Stockholm Convention) May �, ���0 Free trade agreement
EFTA-Bulgaria July �, ���� Free trade agreement
EFTA-Israel January �, ���� Free trade agreement
EFTA-Romania May �, ���� Free trade agreement
EFTA-Turkey April �, ���� Free trade agreement
EU (Treaty of Rome) January �, ���� Customs union
EU-Algeria July �, ���� Free trade agreement
EU-Bulgaria December ��, ���� Free trade agreement
EU-Iceland April �, ���� Free trade agreement
EU-Norway July �, ���� Free trade agreement
Eurasian Economic Community (EAEC) October �, ���� Customs union
EU-Romania May �, ���� Free trade agreement
EU-Switzerland and Liechtenstein January �, ���� Free trade agreement
EU-Syria July �, ���� Free trade agreement
EU-Tunisia March �, ���� Free trade agreement
EU-Turkey January �, ���� Customs union
General System of Trade Preferences (GSTP) April ��, ���� Preferential arrangement
Georgia-Kazakhstan July ��, ���� Free trade agreement
Georgia-Russian Federation May �0, ���� Free trade agreement
Gulf Cooperation Council (GCC) July �, ���� Preferential arrangement
Israel-Turkey May �, ���� Free trade agreement
Kyrgyz Republic-Kazakhstan November ��, ���� Free trade agreement
Kyrgyz Republic-Russian Federation April ��, ���� Free trade agreement
Laos-Thailand June �0, ���� Preferential arrangement
Latin American Integration Association (LAIA) March ��, ���� Preferential arrangement
Mercosur November ��, ���� Customs union
North American Free Trade Agreement (NAFTA) January �, ���� Free trade agreement

�0
Table 5 WTO list of preferential trading arrangements, 1970–99 (continued)
Preferential trading arrangement Date of entry into force Type of arrangement
PATCRA February �, ���� Free trade agreement
Protocol on Trade among Developing Countries (PTN)
February ��, ���� Preferential arrangement
Romania-Moldova January �, ���� Free trade agreement
Romania-Turkey February �, ���� Free trade agreement
South Asian Preferential Trade Arrangement (SAPTA)
December �, ���� Preferential arrangement
SPARTECA January �, ���� Preferential arrangement
Tripartite Agreement April �, ���� Preferential arrangement
US-Israel August ��, ���� Free trade agreement
Source: Crawford and Fiorentino (�00�).

��
(table continues next page)
Total merchandise trade Trade in manufactures
Truncated (OLS) Censored (OLS) Censored (Tobit) Truncated (OLS) Censored (OLS) Censored (Tobit)Without With Without With Without With Without With Without With Without Withcountry country country country country country country country country country country country
Explanatory variable effects effects effects effects effects effects effects effects effects effects effects effects
Distance –0.91 *** –1.19 *** Censored regressions for total trade –0.91 *** –1.32 *** –1.05 *** n.c. –1.15 *** –1.54 ***
Joint GDP 0.82 *** 0.89 *** not supported by dataset 0.94 *** 1.16 *** 1.04 *** n.c. 1.13 *** 0.95 ***
Joint GDP per capita 0.36 *** –0.43 *** 0.32 *** –0.7 *** 0.36 *** n.c. 0.40 *** –0.39 ***
Common language 0.34 *** 0.31 *** 0.46 *** 0.44 *** 0.54 *** n.c. 0.62 *** 0.57 ***
Common border 0.44 *** 0.17 *** 0.44 *** 0.09 *** 0.43 *** n.c. 0.39 *** –0.01
Landlocked –0.21 *** –0.73 *** –0.01 –0.89 *** –0.04 n.c. –0.06 *** –1.45 ***
Island 0.18 *** 2.03 *** 0.15 *** 1.11 *** 0.16 *** n.c. 0.18 *** 1.95 ***
Land area –0.04 *** 0.30 *** –0.13 *** 0.10 ** –0.17 *** n.c. –0.18 *** 0.09
Common colonizer 0.54 *** 0.60 *** 0.44 *** 0.56 *** 0.45 *** n.c. 0.47 *** 0.64 ***
Colony 0.78 *** 0.66 *** 1.06 *** 0.84 *** 1.06 ** n.c. 1.15 *** 0.92 ***
Ever a colony 1.22 *** 1.31 *** 1.04 *** 1.21 *** 1.18 *** n.c. 1.23 *** 1.38 ***
Common country –0.68 *** 0.10 –0.82 *** –0.06 –0.83 n.c. –0.87 *** –0.18
Currency union 1.38 *** 0.48 *** 0.96 *** –0.03 1.09 *** n.c. 1.13 *** 0.04
GSP 0.26 *** 0.28 *** 0.03 *** 0.11 *** 0.08 ** n.c. 0.12 *** 0.28 ***
Third-wave provisions –0.27 *** –0.41 *** 0.62 *** 0.25 *** 1.04 *** n.c. 1.09 *** 0.74 ***
Andean Community 2.29 *** 1.83 *** 3.73 *** 3.43 *** 4.22 *** n.c. 4.87 *** 4.20 ***
Andean Community_m –1.16 *** –0.55 ** 0.23 * –1.01 *** 0.53 n.c. 0.68 *** –1.06 ***
Andean Community_x –1.70 *** –1.12 *** –3.68 *** 0.92 *** –4.00 *** n.c. –4.49 *** 1.06 ***
ANZCERTA 0.44 0.41 –0.45 –0.74 0.64 n.c. –0.04 0.39
ANZCERTA_m –0.95 *** 0.41 ** –0.29 1.52 *** –1.46 *** n.c. –2.01 *** 0.40
ANZCERTA_x –1.53 *** –0.90 *** –0.42 * –1.15 *** –0.05 n.c. 0.90 *** –1.31 ***
ASEAN FTA 0.08 –1.48 ** –1.25 –3.69 *** –2.42 ** n.c. –3.05 *** –5.60 ***
ASEAN FTA_m 1.64 *** 2.03 *** 2.67 *** 1.40 *** 3.72 *** n.c. 4.15 *** 2.38 ***
ASEAN FTA_x 1.42 *** 3.02 *** 0.96 *** 5.80 *** 2.06 *** n.c. 2.59 *** 7.54 ***
Cusfta-NAFTA 3.57 *** 4.19 *** 4.24 *** 4.32 *** 1.17 n.c. –0.23 0.83
Cusfta-NAFTA_m –0.92 *** –0.64 *** 0.54 ** 0.21 2.41 *** n.c. 2.91 *** 1.09 ***
Cusfta-NAFTA_x –2.71 *** –1.82 *** –3.12 *** –2.51 *** –3.35 *** n.c. –3.76 *** –2.80 ***
European Union –1.10 *** –0.94 *** –0.48 * –0.68 *** –1.05 ** n.c. –1.16 *** –1.05 ***
European Union_m 1.46 *** 0.79 *** –0.74 *** 0.75 *** –0.56 * n.c. –0.56 *** 0.89 ***
European Union_x 1.15 *** 1.44 *** 2.49 *** 1.87 *** 2.14 *** n.c. 2.19 *** 1.68 ***
EFTA 4.78 *** 3.81 *** 5.39 *** 4.00 *** 5.28 *** n.c. 5.67 *** 4.06 ***
EFTA_m 0.89 *** 0.38 ** –1.80 *** 0.58 *** –2.30 *** n.c. –3.10 *** 0.13
EFTA_x 1.30 *** 2.06 *** 5.21 *** 2.31 *** 6.96 *** n.c. 7.83 *** 2.14 ***
LAIA 9.10 *** 5.31 *** 7.05 *** 3.37 *** 10.14 *** n.c. 10.47 *** 7.09 ***
LAIA_m –5.23 *** –0.55 * –3.81 *** –2.12 *** –3.78 *** n.c. –3.87 *** –1.46 ***
Table 6 OLS and Tobit regression estimates for total merchandise trade and trade in manufactures using truncated and data, with export and import country fixed effects, and 20 APC-compiled PTAs, 1970–99
CUSTA
CUSTA
CUSTA
censored

��
(continued)
(table continues next page)
Total merchandise trade Trade in manufactures
Truncated (OLS) Censored (OLS) Censored (Tobit) Truncated (OLS) Censored (OLS) Censored (Tobit)Without With Without With Without With Without With Without With Without Withcountry country country country country country country country country country country country
Explanatory variable effects effects effects effects effects effects effects effects effects effects effects effects
Distance –0.91 *** –1.19 *** Censored regressions for total trade –0.91 *** –1.32 *** –1.05 *** n.c. –1.15 *** –1.54 ***
Joint GDP 0.82 *** 0.89 *** not supported by dataset 0.94 *** 1.16 *** 1.04 *** n.c. 1.13 *** 0.95 ***
Joint GDP per capita 0.36 *** –0.43 *** 0.32 *** –0.7 *** 0.36 *** n.c. 0.40 *** –0.39 ***
Common language 0.34 *** 0.31 *** 0.46 *** 0.44 *** 0.54 *** n.c. 0.62 *** 0.57 ***
Common border 0.44 *** 0.17 *** 0.44 *** 0.09 *** 0.43 *** n.c. 0.39 *** –0.01
Landlocked –0.21 *** –0.73 *** –0.01 –0.89 *** –0.04 n.c. –0.06 *** –1.45 ***
Island 0.18 *** 2.03 *** 0.15 *** 1.11 *** 0.16 *** n.c. 0.18 *** 1.95 ***
Land area –0.04 *** 0.30 *** –0.13 *** 0.10 ** –0.17 *** n.c. –0.18 *** 0.09
Common colonizer 0.54 *** 0.60 *** 0.44 *** 0.56 *** 0.45 *** n.c. 0.47 *** 0.64 ***
Colony 0.78 *** 0.66 *** 1.06 *** 0.84 *** 1.06 ** n.c. 1.15 *** 0.92 ***
Ever a colony 1.22 *** 1.31 *** 1.04 *** 1.21 *** 1.18 *** n.c. 1.23 *** 1.38 ***
Common country –0.68 *** 0.10 –0.82 *** –0.06 –0.83 n.c. –0.87 *** –0.18
Currency union 1.38 *** 0.48 *** 0.96 *** –0.03 1.09 *** n.c. 1.13 *** 0.04
GSP 0.26 *** 0.28 *** 0.03 *** 0.11 *** 0.08 ** n.c. 0.12 *** 0.28 ***
Third-wave provisions –0.27 *** –0.41 *** 0.62 *** 0.25 *** 1.04 *** n.c. 1.09 *** 0.74 ***
Andean Community 2.29 *** 1.83 *** 3.73 *** 3.43 *** 4.22 *** n.c. 4.87 *** 4.20 ***
Andean Community_m –1.16 *** –0.55 ** 0.23 * –1.01 *** 0.53 n.c. 0.68 *** –1.06 ***
Andean Community_x –1.70 *** –1.12 *** –3.68 *** 0.92 *** –4.00 *** n.c. –4.49 *** 1.06 ***
ANZCERTA 0.44 0.41 –0.45 –0.74 0.64 n.c. –0.04 0.39
ANZCERTA_m –0.95 *** 0.41 ** –0.29 1.52 *** –1.46 *** n.c. –2.01 *** 0.40
ANZCERTA_x –1.53 *** –0.90 *** –0.42 * –1.15 *** –0.05 n.c. 0.90 *** –1.31 ***
ASEAN FTA 0.08 –1.48 ** –1.25 –3.69 *** –2.42 ** n.c. –3.05 *** –5.60 ***
ASEAN FTA_m 1.64 *** 2.03 *** 2.67 *** 1.40 *** 3.72 *** n.c. 4.15 *** 2.38 ***
ASEAN FTA_x 1.42 *** 3.02 *** 0.96 *** 5.80 *** 2.06 *** n.c. 2.59 *** 7.54 ***
Cusfta-NAFTA 3.57 *** 4.19 *** 4.24 *** 4.32 *** 1.17 n.c. –0.23 0.83
Cusfta-NAFTA_m –0.92 *** –0.64 *** 0.54 ** 0.21 2.41 *** n.c. 2.91 *** 1.09 ***
Cusfta-NAFTA_x –2.71 *** –1.82 *** –3.12 *** –2.51 *** –3.35 *** n.c. –3.76 *** –2.80 ***
European Union –1.10 *** –0.94 *** –0.48 * –0.68 *** –1.05 ** n.c. –1.16 *** –1.05 ***
European Union_m 1.46 *** 0.79 *** –0.74 *** 0.75 *** –0.56 * n.c. –0.56 *** 0.89 ***
European Union_x 1.15 *** 1.44 *** 2.49 *** 1.87 *** 2.14 *** n.c. 2.19 *** 1.68 ***
EFTA 4.78 *** 3.81 *** 5.39 *** 4.00 *** 5.28 *** n.c. 5.67 *** 4.06 ***
EFTA_m 0.89 *** 0.38 ** –1.80 *** 0.58 *** –2.30 *** n.c. –3.10 *** 0.13
EFTA_x 1.30 *** 2.06 *** 5.21 *** 2.31 *** 6.96 *** n.c. 7.83 *** 2.14 ***
LAIA 9.10 *** 5.31 *** 7.05 *** 3.37 *** 10.14 *** n.c. 10.47 *** 7.09 ***
LAIA_m –5.23 *** –0.55 * –3.81 *** –2.12 *** –3.78 *** n.c. –3.87 *** –1.46 ***
Table 6 OLS and Tobit regression estimates for total merchandise trade and trade in manufactures using truncated and data, with export and import country fixed effects, and 20 APC-compiled PTAs, 1970–99
LAIA_x 0.86 *** 2.35 *** 0.79 *** 4.41 *** 3.48 *** n.c. 4.75 *** 4.96 ***
Mercosur 3.28 *** 3.50 *** 4.15 *** 4.49 *** 3.85 *** n.c. 3.64 *** 4.15 ***
Mercosur_m 1.24 *** 2.22 *** 0.89 *** 2.45 *** 0.24 n.c. 0.10 2.86 ***
Mercosur_x 1.74 *** 0.00 1.18 *** –1.01 *** 2.33 *** n.c. 2.58 *** –0.88 ***
SPARTECA 15.02 *** 12.04 *** 21.29 *** 18.75 *** 22.59 *** n.c. 25.62 *** 21.25 ***
SPARTECA_m 0.65 * –2.79 *** 2.28 *** –3.74 *** 4.92 *** n.c. 5.86 *** –3.23 ***
SPARTECA_x 3.32 *** –0.13 –5.77 *** 1.50 *** –7.73 *** n.c. –11.14 *** –0.66
US-Israel FTA 7.10 *** 8.55 *** 9.31 *** 9.67 *** 7.82 *** n.c. 6.67 ** 6.80 ***
US-Israel FTA_m 1.16 *** –1.24 *** –0.59 ** –0.79 *** –0.94 n.c. –1.47 *** 0.30
US-Israel FTA_x 2.08 *** –0.85 *** 3.43 *** –2.17 *** 5.87 *** n.c. 6.15 *** –0.59 *
PATCRA 0.77 0.16 –4.95 *** –3.73 *** –2.81 n.c. –2.88 –1.54PATCRA_m –1.63 *** –0.19 –0.51 * –0.08 –0.84 n.c. –0.77 ** –0.05PATCRA_x –1.54 *** –1.10 *** –0.09 –3.79 *** 0.26 n.c. 0.84 *** –4.01 ***
Chile-Colombia 2.88 2.54 4.78 * 3.90 * 5.84 n.c. 5.99 * 4.62 *
Chile-Colombia_m 1.93 *** 2.18 *** 2.09 *** 2.22 *** 2.35 *** n.c. 2.43 *** 2.53 ***
Chile-Colombia_x 0.32 0.96 *** –0.54 –1.01 *** –1.95 *** n.c. –2.3 *** –1.40 ***
Chile-Mercosur –0.05 –0.75 0.45 –0.75 0.14 n.c. –0.05 –1.34 *
Chile-Mercosur_m 0.04 0.12 0.45 ** 0.31 * 0.80 *** n.c. 0.91 *** 0.45 **
Chile-Mercosur_x –0.62 *** –0.27 * –1.56 *** –0.88 *** –1.90 *** n.c. –2.10 *** –0.97 ***
Chile-Mexico 1.88 3.23 3.04 4.31 1.99 * n.c. 2.02 3.51
Chile-Mexico_m 1.58 *** 1.77 *** 1.93 *** 1.03 ** 2.29 *** n.c. 2.57 *** 0.99
Chile-Mexico_x –0.48 1.13 ** –0.51 1.65 *** –0.86 * n.c. –1.04 1.67 ***
EU-Egypt 5.65 *** 6.29 *** 4.71 *** 5.97 *** 5.98 *** n.c. 6.42 *** 6.32 ***
EU-Egypt_m –2.70 *** –1.81 *** 1.00 *** 0.64 *** 0.73 n.c. 0.36 –0.27
EU-Egypt_x –5.91 *** –1.43 *** –10.26 *** –3.21 *** –8.36 *** n.c. –8.53 *** –1.60 ***
EU-Poland 1.61 *** 2.50 *** 0.28 1.60 *** 0.11 n.c. 0.03 1.35 ***
EU-Poland_m –2.26 *** –1.10 *** –0.86 *** 0.15 –1.81 *** n.c. –2.19 *** –0.31 **
EU-Poland_x –1.53 *** –0.75 *** –2.23 *** –1.66 *** –1.75 *** n.c. –1.89 *** –1.67 ***
EU-Switzerland –1.47 *** –4.66 *** –1.13 ** –5.79 *** –2.94 *** n.c. –4.35 *** –8.61 ***
EU-Switzerland_m 0.94 *** –0.02 –0.78 *** 1.49 *** –1.19 n.c. –1.53 *** 1.21 ***
EU-Switzerland_x 4.24 *** –0.58 ** 6.99 *** –1.05 *** 9.11 *** n.c. 9.77 *** –1.06 ***
Singapore-NZ (dropped) (dropped) (dropped) (dropped) (dropped) n.c. (dropped) (dropped)
Singapore-NZ_m (dropped) (dropped) (dropped) (dropped) (dropped) n.c. (dropped) (dropped)
Singapore-NZ_x (dropped) (dropped) (dropped) (dropped) (dropped) n.c. (dropped) (dropped)
APEC 1.04 *** 0.89 *** 0.19 0.06 –0.16 n.c. –0.29 * –0.50 ***
APEC_m 0.13 *** 0.20 *** –0.30 *** 0.38 *** –0.66 *** n.c. –0.83 *** 0.29 ***
APEC_x 0.53 *** 0.08 *** 0.88 *** 0.04 * 1.31 *** n.c. 1.42 *** 0.19 ***
GCC (dropped) (dropped) (dropped) (dropped) (dropped) n.c. (dropped) (dropped)GCC_m 0.07 *** –0.01 0.10 *** –0.49 *** 0.02 n.c. –0.03 –0.49 ***
GCC_x 0.03 –0.18 *** –0.68 *** 1.42 *** –0.52 *** n.c. –0.46 *** 1.96 ***
Constant –29.68 *** –28.07 *** –33.20 *** –31.93 *** –37.69 *** n.c. –41.43 *** –25.37 ***
R-squared 0.61 0.70 0.61 0.76 0.60 n.c. 0.16 0.26Observations (thousands 200 200 176 176 200 n.c. 200 200
Groups (thousands) n.a. n.a. n.a. n.a. n.a. n.c. n.a. n.a.
Memorandum item: Trade creating versus trade diverting PTAs under alternative criteria
censored

��
(table continues next page)
(continued)
Total merchandise trade Trade in manufactures
Truncated (OLS) Censored (OLS) Censored (Tobit) Truncated (OLS) Censored (OLS) Censored (Tobit)Without With Without With Without With Without With Without With Without Withcountry country country country country country country country country country country country
Explanatory variable effects effects effects effects effects effects effects effects effects effects effects effects
Distance –0.91 *** –1.19 *** Censored regressions for total trade –0.91 *** –1.32 *** –1.05 *** n.c. –1.15 *** –1.54 ***
Joint GDP 0.82 *** 0.89 *** not supported by dataset 0.94 *** 1.16 *** 1.04 *** n.c. 1.13 *** 0.95 ***
Joint GDP per capita 0.36 *** –0.43 *** 0.32 *** –0.7 *** 0.36 *** n.c. 0.40 *** –0.39 ***
Common language 0.34 *** 0.31 *** 0.46 *** 0.44 *** 0.54 *** n.c. 0.62 *** 0.57 ***
Common border 0.44 *** 0.17 *** 0.44 *** 0.09 *** 0.43 *** n.c. 0.39 *** –0.01
Landlocked –0.21 *** –0.73 *** –0.01 –0.89 *** –0.04 n.c. –0.06 *** –1.45 ***
Island 0.18 *** 2.03 *** 0.15 *** 1.11 *** 0.16 *** n.c. 0.18 *** 1.95 ***
Land area –0.04 *** 0.30 *** –0.13 *** 0.10 ** –0.17 *** n.c. –0.18 *** 0.09
Common colonizer 0.54 *** 0.60 *** 0.44 *** 0.56 *** 0.45 *** n.c. 0.47 *** 0.64 ***
Colony 0.78 *** 0.66 *** 1.06 *** 0.84 *** 1.06 ** n.c. 1.15 *** 0.92 ***
Ever a colony 1.22 *** 1.31 *** 1.04 *** 1.21 *** 1.18 *** n.c. 1.23 *** 1.38 ***
Common country –0.68 *** 0.10 –0.82 *** –0.06 –0.83 n.c. –0.87 *** –0.18
Currency union 1.38 *** 0.48 *** 0.96 *** –0.03 1.09 *** n.c. 1.13 *** 0.04
GSP 0.26 *** 0.28 *** 0.03 *** 0.11 *** 0.08 ** n.c. 0.12 *** 0.28 ***
Third-wave provisions –0.27 *** –0.41 *** 0.62 *** 0.25 *** 1.04 *** n.c. 1.09 *** 0.74 ***
Andean Community 2.29 *** 1.83 *** 3.73 *** 3.43 *** 4.22 *** n.c. 4.87 *** 4.20 ***
Andean Community_m –1.16 *** –0.55 ** 0.23 * –1.01 *** 0.53 n.c. 0.68 *** –1.06 ***
Andean Community_x –1.70 *** –1.12 *** –3.68 *** 0.92 *** –4.00 *** n.c. –4.49 *** 1.06 ***
ANZCERTA 0.44 0.41 –0.45 –0.74 0.64 n.c. –0.04 0.39
ANZCERTA_m –0.95 *** 0.41 ** –0.29 1.52 *** –1.46 *** n.c. –2.01 *** 0.40
ANZCERTA_x –1.53 *** –0.90 *** –0.42 * –1.15 *** –0.05 n.c. 0.90 *** –1.31 ***
ASEAN FTA 0.08 –1.48 ** –1.25 –3.69 *** –2.42 ** n.c. –3.05 *** –5.60 ***
ASEAN FTA_m 1.64 *** 2.03 *** 2.67 *** 1.40 *** 3.72 *** n.c. 4.15 *** 2.38 ***
ASEAN FTA_x 1.42 *** 3.02 *** 0.96 *** 5.80 *** 2.06 *** n.c. 2.59 *** 7.54 ***
Cusfta-NAFTA 3.57 *** 4.19 *** 4.24 *** 4.32 *** 1.17 n.c. –0.23 0.83
Cusfta-NAFTA_m –0.92 *** –0.64 *** 0.54 ** 0.21 2.41 *** n.c. 2.91 *** 1.09 ***
Cusfta-NAFTA_x –2.71 *** –1.82 *** –3.12 *** –2.51 *** –3.35 *** n.c. –3.76 *** –2.80 ***
European Union –1.10 *** –0.94 *** –0.48 * –0.68 *** –1.05 ** n.c. –1.16 *** –1.05 ***
European Union_m 1.46 *** 0.79 *** –0.74 *** 0.75 *** –0.56 * n.c. –0.56 *** 0.89 ***
European Union_x 1.15 *** 1.44 *** 2.49 *** 1.87 *** 2.14 *** n.c. 2.19 *** 1.68 ***
EFTA 4.78 *** 3.81 *** 5.39 *** 4.00 *** 5.28 *** n.c. 5.67 *** 4.06 ***
EFTA_m 0.89 *** 0.38 ** –1.80 *** 0.58 *** –2.30 *** n.c. –3.10 *** 0.13
EFTA_x 1.30 *** 2.06 *** 5.21 *** 2.31 *** 6.96 *** n.c. 7.83 *** 2.14 ***
LAIA 9.10 *** 5.31 *** 7.05 *** 3.37 *** 10.14 *** n.c. 10.47 *** 7.09 ***
LAIA_m –5.23 *** –0.55 * –3.81 *** –2.12 *** –3.78 *** n.c. –3.87 *** –1.46 ***
Table 6 OLS and Tobit regression estimates for total merchandise trade and trade in manufactures using truncated and data, with export and import country fixed effects, and 20 APC-compiled PTAs, 1970–99
LAIA_x 0.86 *** 2.35 *** 0.79 *** 4.41 *** 3.48 *** n.c. 4.75 *** 4.96 ***
Mercosur 3.28 *** 3.50 *** 4.15 *** 4.49 *** 3.85 *** n.c. 3.64 *** 4.15 ***
Mercosur_m 1.24 *** 2.22 *** 0.89 *** 2.45 *** 0.24 n.c. 0.10 2.86 ***
Mercosur_x 1.74 *** 0.00 1.18 *** –1.01 *** 2.33 *** n.c. 2.58 *** –0.88 ***
SPARTECA 15.02 *** 12.04 *** 21.29 *** 18.75 *** 22.59 *** n.c. 25.62 *** 21.25 ***
SPARTECA_m 0.65 * –2.79 *** 2.28 *** –3.74 *** 4.92 *** n.c. 5.86 *** –3.23 ***
SPARTECA_x 3.32 *** –0.13 –5.77 *** 1.50 *** –7.73 *** n.c. –11.14 *** –0.66
US-Israel FTA 7.10 *** 8.55 *** 9.31 *** 9.67 *** 7.82 *** n.c. 6.67 ** 6.80 ***
US-Israel FTA_m 1.16 *** –1.24 *** –0.59 ** –0.79 *** –0.94 n.c. –1.47 *** 0.30
US-Israel FTA_x 2.08 *** –0.85 *** 3.43 *** –2.17 *** 5.87 *** n.c. 6.15 *** –0.59 *
PATCRA 0.77 0.16 –4.95 *** –3.73 *** –2.81 n.c. –2.88 –1.54PATCRA_m –1.63 *** –0.19 –0.51 * –0.08 –0.84 n.c. –0.77 ** –0.05PATCRA_x –1.54 *** –1.10 *** –0.09 –3.79 *** 0.26 n.c. 0.84 *** –4.01 ***
Chile-Colombia 2.88 2.54 4.78 * 3.90 * 5.84 n.c. 5.99 * 4.62 *
Chile-Colombia_m 1.93 *** 2.18 *** 2.09 *** 2.22 *** 2.35 *** n.c. 2.43 *** 2.53 ***
Chile-Colombia_x 0.32 0.96 *** –0.54 –1.01 *** –1.95 *** n.c. –2.3 *** –1.40 ***
Chile-Mercosur –0.05 –0.75 0.45 –0.75 0.14 n.c. –0.05 –1.34 *
Chile-Mercosur_m 0.04 0.12 0.45 ** 0.31 * 0.80 *** n.c. 0.91 *** 0.45 **
Chile-Mercosur_x –0.62 *** –0.27 * –1.56 *** –0.88 *** –1.90 *** n.c. –2.10 *** –0.97 ***
Chile-Mexico 1.88 3.23 3.04 4.31 1.99 * n.c. 2.02 3.51
Chile-Mexico_m 1.58 *** 1.77 *** 1.93 *** 1.03 ** 2.29 *** n.c. 2.57 *** 0.99
Chile-Mexico_x –0.48 1.13 ** –0.51 1.65 *** –0.86 * n.c. –1.04 1.67 ***
EU-Egypt 5.65 *** 6.29 *** 4.71 *** 5.97 *** 5.98 *** n.c. 6.42 *** 6.32 ***
EU-Egypt_m –2.70 *** –1.81 *** 1.00 *** 0.64 *** 0.73 n.c. 0.36 –0.27
EU-Egypt_x –5.91 *** –1.43 *** –10.26 *** –3.21 *** –8.36 *** n.c. –8.53 *** –1.60 ***
EU-Poland 1.61 *** 2.50 *** 0.28 1.60 *** 0.11 n.c. 0.03 1.35 ***
EU-Poland_m –2.26 *** –1.10 *** –0.86 *** 0.15 –1.81 *** n.c. –2.19 *** –0.31 **
EU-Poland_x –1.53 *** –0.75 *** –2.23 *** –1.66 *** –1.75 *** n.c. –1.89 *** –1.67 ***
EU-Switzerland –1.47 *** –4.66 *** –1.13 ** –5.79 *** –2.94 *** n.c. –4.35 *** –8.61 ***
EU-Switzerland_m 0.94 *** –0.02 –0.78 *** 1.49 *** –1.19 n.c. –1.53 *** 1.21 ***
EU-Switzerland_x 4.24 *** –0.58 ** 6.99 *** –1.05 *** 9.11 *** n.c. 9.77 *** –1.06 ***
Singapore-NZ (dropped) (dropped) (dropped) (dropped) (dropped) n.c. (dropped) (dropped)
Singapore-NZ_m (dropped) (dropped) (dropped) (dropped) (dropped) n.c. (dropped) (dropped)
Singapore-NZ_x (dropped) (dropped) (dropped) (dropped) (dropped) n.c. (dropped) (dropped)
APEC 1.04 *** 0.89 *** 0.19 0.06 –0.16 n.c. –0.29 * –0.50 ***
APEC_m 0.13 *** 0.20 *** –0.30 *** 0.38 *** –0.66 *** n.c. –0.83 *** 0.29 ***
APEC_x 0.53 *** 0.08 *** 0.88 *** 0.04 * 1.31 *** n.c. 1.42 *** 0.19 ***
GCC (dropped) (dropped) (dropped) (dropped) (dropped) n.c. (dropped) (dropped)GCC_m 0.07 *** –0.01 0.10 *** –0.49 *** 0.02 n.c. –0.03 –0.49 ***
GCC_x 0.03 –0.18 *** –0.68 *** 1.42 *** –0.52 *** n.c. –0.46 *** 1.96 ***
Constant –29.68 *** –28.07 *** –33.20 *** –31.93 *** –37.69 *** n.c. –41.43 *** –25.37 ***
R-squared 0.61 0.70 0.61 0.76 0.60 n.c. 0.16 0.26Observations (thousands 200 200 176 176 200 n.c. 200 200
Groups (thousands) n.a. n.a. n.a. n.a. n.a. n.c. n.a. n.a.
Memorandum item: Trade creating versus trade diverting PTAs under alternative criteria
s)
censored
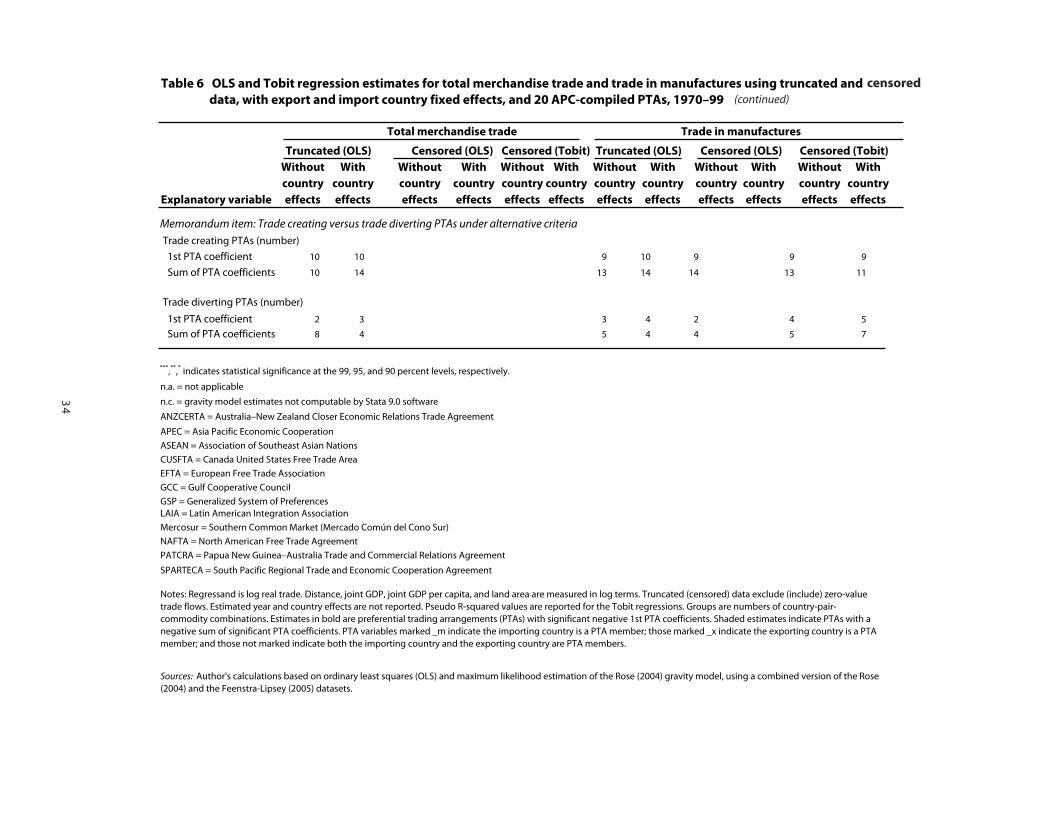
��
(continued)
LAIA_x 0.86 *** 2.35 *** 0.79 *** 4.41 *** 3.48 *** n.c. 4.75 *** 4.96 ***
Mercosur 3.28 *** 3.50 *** 4.15 *** 4.49 *** 3.85 *** n.c. 3.64 *** 4.15 ***
Mercosur_m 1.24 *** 2.22 *** 0.89 *** 2.45 *** 0.24 n.c. 0.10 2.86 ***
Mercosur_x 1.74 *** 0.00 1.18 *** –1.01 *** 2.33 *** n.c. 2.58 *** –0.88 ***
SPARTECA 15.02 *** 12.04 *** 21.29 *** 18.75 *** 22.59 *** n.c. 25.62 *** 21.25 ***
SPARTECA_m 0.65 * –2.79 *** 2.28 *** –3.74 *** 4.92 *** n.c. 5.86 *** –3.23 ***
SPARTECA_x 3.32 *** –0.13 –5.77 *** 1.50 *** –7.73 *** n.c. –11.14 *** –0.66
US-Israel FTA 7.10 *** 8.55 *** 9.31 *** 9.67 *** 7.82 *** n.c. 6.67 ** 6.80 ***
US-Israel FTA_m 1.16 *** –1.24 *** –0.59 ** –0.79 *** –0.94 n.c. –1.47 *** 0.30
US-Israel FTA_x 2.08 *** –0.85 *** 3.43 *** –2.17 *** 5.87 *** n.c. 6.15 *** –0.59 *
PATCRA 0.77 0.16 –4.95 *** –3.73 *** –2.81 n.c. –2.88 –1.54PATCRA_m –1.63 *** –0.19 –0.51 * –0.08 –0.84 n.c. –0.77 ** –0.05PATCRA_x –1.54 *** –1.10 *** –0.09 –3.79 *** 0.26 n.c. 0.84 *** –4.01 ***
Chile-Colombia 2.88 2.54 4.78 * 3.90 * 5.84 n.c. 5.99 * 4.62 *
Chile-Colombia_m 1.93 *** 2.18 *** 2.09 *** 2.22 *** 2.35 *** n.c. 2.43 *** 2.53 ***
Chile-Colombia_x 0.32 0.96 *** –0.54 –1.01 *** –1.95 *** n.c. –2.3 *** –1.40 ***
Chile-Mercosur –0.05 –0.75 0.45 –0.75 0.14 n.c. –0.05 –1.34 *
Chile-Mercosur_m 0.04 0.12 0.45 ** 0.31 * 0.80 *** n.c. 0.91 *** 0.45 **
Chile-Mercosur_x –0.62 *** –0.27 * –1.56 *** –0.88 *** –1.90 *** n.c. –2.10 *** –0.97 ***
Chile-Mexico 1.88 3.23 3.04 4.31 1.99 * n.c. 2.02 3.51
Chile-Mexico_m 1.58 *** 1.77 *** 1.93 *** 1.03 ** 2.29 *** n.c. 2.57 *** 0.99
Chile-Mexico_x –0.48 1.13 ** –0.51 1.65 *** –0.86 * n.c. –1.04 1.67 ***
EU-Egypt 5.65 *** 6.29 *** 4.71 *** 5.97 *** 5.98 *** n.c. 6.42 *** 6.32 ***
EU-Egypt_m –2.70 *** –1.81 *** 1.00 *** 0.64 *** 0.73 n.c. 0.36 –0.27
EU-Egypt_x –5.91 *** –1.43 *** –10.26 *** –3.21 *** –8.36 *** n.c. –8.53 *** –1.60 ***
EU-Poland 1.61 *** 2.50 *** 0.28 1.60 *** 0.11 n.c. 0.03 1.35 ***
EU-Poland_m –2.26 *** –1.10 *** –0.86 *** 0.15 –1.81 *** n.c. –2.19 *** –0.31 **
EU-Poland_x –1.53 *** –0.75 *** –2.23 *** –1.66 *** –1.75 *** n.c. –1.89 *** –1.67 ***
EU-Switzerland –1.47 *** –4.66 *** –1.13 ** –5.79 *** –2.94 *** n.c. –4.35 *** –8.61 ***
EU-Switzerland_m 0.94 *** –0.02 –0.78 *** 1.49 *** –1.19 n.c. –1.53 *** 1.21 ***
EU-Switzerland_x 4.24 *** –0.58 ** 6.99 *** –1.05 *** 9.11 *** n.c. 9.77 *** –1.06 ***
Singapore-NZ (dropped) (dropped) (dropped) (dropped) (dropped) n.c. (dropped) (dropped)
Singapore-NZ_m (dropped) (dropped) (dropped) (dropped) (dropped) n.c. (dropped) (dropped)
Singapore-NZ_x (dropped) (dropped) (dropped) (dropped) (dropped) n.c. (dropped) (dropped)
APEC 1.04 *** 0.89 *** 0.19 0.06 –0.16 n.c. –0.29 * –0.50 ***
APEC_m 0.13 *** 0.20 *** –0.30 *** 0.38 *** –0.66 *** n.c. –0.83 *** 0.29 ***
APEC_x 0.53 *** 0.08 *** 0.88 *** 0.04 * 1.31 *** n.c. 1.42 *** 0.19 ***
GCC (dropped) (dropped) (dropped) (dropped) (dropped) n.c. (dropped) (dropped)GCC_m 0.07 *** –0.01 0.10 *** –0.49 *** 0.02 n.c. –0.03 –0.49 ***
GCC_x 0.03 –0.18 *** –0.68 *** 1.42 *** –0.52 *** n.c. –0.46 *** 1.96 ***
Constant –29.68 *** –28.07 *** –33.20 *** –31.93 *** –37.69 *** n.c. –41.43 *** –25.37 ***
R-squared 0.61 0.70 0.61 0.76 0.60 n.c. 0.16 0.26Observations (thousands 200 200 176 176 200 n.c. 200 200
Groups (thousands) n.a. n.a. n.a. n.a. n.a. n.c. n.a. n.a.
Memorandum item: Trade creating versus trade diverting PTAs under alternative criteria
Total merchandise trade Trade in manufactures
Truncated (OLS) Censored (OLS) Censored (Tobit) Truncated (OLS) Censored (OLS) Censored (Tobit)Without With Without With Without With Without With Without With Without Withcountry country country country country country country country country country country country
Explanatory variable effects effects effects effects effects effects effects effects effects effects effects effects
Distance –0.91 *** –1.19 *** Censored regressions for total trade –0.91 *** –1.32 *** –1.05 *** n.c. –1.15 *** –1.54 ***
Joint GDP 0.82 *** 0.89 *** not supported by dataset 0.94 *** 1.16 *** 1.04 *** n.c. 1.13 *** 0.95 ***
Joint GDP per capita 0.36 *** –0.43 *** 0.32 *** –0.7 *** 0.36 *** n.c. 0.40 *** –0.39 ***
Common language 0.34 *** 0.31 *** 0.46 *** 0.44 *** 0.54 *** n.c. 0.62 *** 0.57 ***
Common border 0.44 *** 0.17 *** 0.44 *** 0.09 *** 0.43 *** n.c. 0.39 *** –0.01
Landlocked –0.21 *** –0.73 *** –0.01 –0.89 *** –0.04 n.c. –0.06 *** –1.45 ***
Island 0.18 *** 2.03 *** 0.15 *** 1.11 *** 0.16 *** n.c. 0.18 *** 1.95 ***
Land area –0.04 *** 0.30 *** –0.13 *** 0.10 ** –0.17 *** n.c. –0.18 *** 0.09
Common colonizer 0.54 *** 0.60 *** 0.44 *** 0.56 *** 0.45 *** n.c. 0.47 *** 0.64 ***
Colony 0.78 *** 0.66 *** 1.06 *** 0.84 *** 1.06 ** n.c. 1.15 *** 0.92 ***
Ever a colony 1.22 *** 1.31 *** 1.04 *** 1.21 *** 1.18 *** n.c. 1.23 *** 1.38 ***
Common country –0.68 *** 0.10 –0.82 *** –0.06 –0.83 n.c. –0.87 *** –0.18
Currency union 1.38 *** 0.48 *** 0.96 *** –0.03 1.09 *** n.c. 1.13 *** 0.04
GSP 0.26 *** 0.28 *** 0.03 *** 0.11 *** 0.08 ** n.c. 0.12 *** 0.28 ***
Third-wave provisions –0.27 *** –0.41 *** 0.62 *** 0.25 *** 1.04 *** n.c. 1.09 *** 0.74 ***
Andean Community 2.29 *** 1.83 *** 3.73 *** 3.43 *** 4.22 *** n.c. 4.87 *** 4.20 ***
Andean Community_m –1.16 *** –0.55 ** 0.23 * –1.01 *** 0.53 n.c. 0.68 *** –1.06 ***
Andean Community_x –1.70 *** –1.12 *** –3.68 *** 0.92 *** –4.00 *** n.c. –4.49 *** 1.06 ***
ANZCERTA 0.44 0.41 –0.45 –0.74 0.64 n.c. –0.04 0.39
ANZCERTA_m –0.95 *** 0.41 ** –0.29 1.52 *** –1.46 *** n.c. –2.01 *** 0.40
ANZCERTA_x –1.53 *** –0.90 *** –0.42 * –1.15 *** –0.05 n.c. 0.90 *** –1.31 ***
ASEAN FTA 0.08 –1.48 ** –1.25 –3.69 *** –2.42 ** n.c. –3.05 *** –5.60 ***
ASEAN FTA_m 1.64 *** 2.03 *** 2.67 *** 1.40 *** 3.72 *** n.c. 4.15 *** 2.38 ***
ASEAN FTA_x 1.42 *** 3.02 *** 0.96 *** 5.80 *** 2.06 *** n.c. 2.59 *** 7.54 ***
Cusfta-NAFTA 3.57 *** 4.19 *** 4.24 *** 4.32 *** 1.17 n.c. –0.23 0.83
Cusfta-NAFTA_m –0.92 *** –0.64 *** 0.54 ** 0.21 2.41 *** n.c. 2.91 *** 1.09 ***
Cusfta-NAFTA_x –2.71 *** –1.82 *** –3.12 *** –2.51 *** –3.35 *** n.c. –3.76 *** –2.80 ***
European Union –1.10 *** –0.94 *** –0.48 * –0.68 *** –1.05 ** n.c. –1.16 *** –1.05 ***
European Union_m 1.46 *** 0.79 *** –0.74 *** 0.75 *** –0.56 * n.c. –0.56 *** 0.89 ***
European Union_x 1.15 *** 1.44 *** 2.49 *** 1.87 *** 2.14 *** n.c. 2.19 *** 1.68 ***
EFTA 4.78 *** 3.81 *** 5.39 *** 4.00 *** 5.28 *** n.c. 5.67 *** 4.06 ***
EFTA_m 0.89 *** 0.38 ** –1.80 *** 0.58 *** –2.30 *** n.c. –3.10 *** 0.13
EFTA_x 1.30 *** 2.06 *** 5.21 *** 2.31 *** 6.96 *** n.c. 7.83 *** 2.14 ***
LAIA 9.10 *** 5.31 *** 7.05 *** 3.37 *** 10.14 *** n.c. 10.47 *** 7.09 ***
LAIA_m –5.23 *** –0.55 * –3.81 *** –2.12 *** –3.78 *** n.c. –3.87 *** –1.46 ***
Table 6 OLS and Tobit regression estimates for total merchandise trade and trade in manufactures using truncated and data, with export and import country fixed effects, and 20 APC-compiled PTAs, 1970–99
Trade creating PTAs (number)
1st PTA coefficient 10 10 9 10 9 9 9
Sum of PTA coefficients 10 14 13 14 14 13 11
Trade diverting PTAs (number)
1st PTA coefficient 2 3 3 4 2 4 5
Sum of PTA coefficients 8 4 5 4 4 5 7
***,**,* indicates statistical significance at the 99, 95, and 90 percent levels, respectively.
n.a. = not applicable
n.c. = gravity model estimates not computable by Stata 9.0 software
ANZCERTA = Australia–New Zealand Closer Economic Relations Trade Agreement
APEC = Asia Pacific Economic Cooperation
ASEAN = Association of Southeast Asian Nations
CUSFTA = Canada United States Free Trade Area
EFTA = European Free Trade Association
GCC = Gulf Cooperative Council
GSP = Generalized System of PreferencesLAIA = Latin American Integration Association
Mercosur = Southern Common Market (Mercado Común del Cono Sur)
NAFTA = North American Free Trade Agreement
PATCRA = Papua New Guinea–Australia Trade and Commercial Relations Agreement
SPARTECA = South Pacific Regional Trade and Economic Cooperation Agreement
Sources: Author's calculations based on ordinary least squares (OLS) and maximum likelihood estimation of the Rose (2004) gravity model, using a combined version of the Rose (2004) and the Feenstra-Lipsey (2005) datasets.
Notes: Regressand is log real trade. Distance, joint GDP, joint GDP per capita, and land area are measured in log terms. Truncated (censored) data exclude (include) zero-value trade flows. Estimated year and country effects are not reported. Pseudo R-squared values are reported for the Tobit regressions. Groups are numbers of country-pair-commodity combinations. Estimates in bold are preferential trading arrangements (PTAs) with significant negative 1st PTA coefficients. Shaded estimates indicate PTAs with a negative sum of significant PTA coefficients. PTA variables marked _m indicate the importing country is a PTA member; those marked _x indicate the exporting country is a PTA member; and those not marked indicate both the importing country and the exporting country are PTA members.
censored

��
(table continues next page)
Total merchandise trade Trade in manufacturesTruncated (RE) Censored (RE) Censored (RE Tobit) Truncated (RE) Censored (RE) Censored (RE Tobit)
Without With Without With Without With Without With Without With Without Withcountry country country country country country country country country country country country
Explanatory variable effects effects effects effects effects effects effects effects effects effects effects effects
Distance –1.04 *** –1.17 *** Censored regressions for total trade –1.13 *** –1.32 *** –1.28 *** –1.41 *** –1.41 *** –1.53 ***
Joint GDP 0.82 *** 0.98 *** not supported by dataset 0.92 *** 1.19 *** 0.96 *** 0.91 *** 1.03 *** 1.08 ***
Joint GDP per capita –0.08 *** –0.48 *** –0.17 *** –0.68 *** –0.16 *** –0.35 *** –0.24 *** –0.49 ***
Common language 0.36 *** 0.34 *** 0.44 *** 0.52 *** 0.48 *** 0.56 *** 0.54 *** 0.67 ***
Common border 0.75 *** 0.49 *** 0.73 *** 0.41 *** 0.75 *** 0.41 *** 0.74 *** 0.38 ***
Landlocked –0.37 *** –0.62 *** –0.13 *** –0.81 *** –0.21 *** –1.35 *** –0.29 *** –1.24 ***
Island 0.40 *** 2.02 *** 0.37 *** 0.76 0.43 *** 1.93 *** 0.54 *** 2.19 ***
Land area –0.10 *** 0.24 *** –0.18 *** 0.07 –0.20 *** 0.10 * –0.23 *** 0.01
Common colonizer 0.07 0.71 *** –0.13 * 0.63 *** –0.18 ** 0.69 *** –0.31 *** 0.73 ***
Colony 0.04 0.10 0.48 *** 0.55 *** 0.45 *** 0.51 *** 0.49 *** 0.58 ***
Ever a colony 1.63 *** 1.39 *** 1.37 *** 1.23 *** 1.59 *** 1.33 *** 1.72 *** 1.39 ***
Common country 0.40 0.68 0.22 0.37 0.29 0.39 0.29 0.24
Currency union 0.74 *** 0.59 *** 0.45 *** 0.29 *** 0.43 *** 0.31 ** 0.45 *** 0.37 ***
GSP 0.05 *** 0.00 0.03 ** 0.00 0.04 *** 0.01 0.01 0.02
3rd wave provisions 0.34 *** 0.29 *** –0.98 *** –0.99 *** –0.84 *** –0.80 *** –1.1 *** –0.98 ***
Andean Community 1.13 ** 1.34 *** 0.57 1.03 ** 0.51 1.10 ** 0.60 1.41 ***
Andean Community_m –1.16 *** –0.83 *** –0.57 *** –1.02 *** –0.73 *** –1.13 *** –0.90 *** –1.23 ***
Andean Community_x –1.26 *** –0.92 *** –0.21 1.24 *** –0.3 * 1.01 *** –0.04 0.99 ***
ANZCERTA 1.75 * 1.79 * –0.74 –0.56 0.48 0.64 0.98 0.95
ANZCERTA_m 0.19 0.21 0.82 *** 0.96 *** 0.16 0.20 –0.02 0.03
ANZCERTA_x –1.22 *** –1.24 *** –1.45 *** –1.57 *** –1.34 *** –1.52 *** –1.54 *** –1.71 ***
ASEAN FTA –3.33 *** –3.21 *** –2.28 *** –2.47 *** –3.26 *** –3.36 *** –4.01 *** –4.13 ***
ASEAN FTA_m 1.99 *** 2.15 *** 1.20 *** 1.31 *** 1.86 *** 2.03 *** 2.28 *** 2.39 ***
ASEAN FTA_x 3.06 *** 3.24 *** 5.66 *** 5.95 *** 6.81 *** 7.23 *** 7.27 *** 7.50 ***
CUSFTA-NAFTA 2.15 ** 2.48 ** 2.93 *** 3.38 *** 1.87 * 2.16 * 2.37 * 2.50 **
CUSFTA-NAFTA_m –0.03 –0.45 *** 0.63 *** 0.16 1.56 *** 1.05 *** 1.30 *** 0.85 ***
CUSFTA-NAFTA_x –1.44 *** –1.80 *** –2.27 *** –2.66 *** –2.25 *** –2.66 *** –2.48 *** –2.83 ***
European Union –0.85 *** –0.91 *** –0.22 –0.35 –0.47 –0.52 * –0.54 –0.65 *
European Union_m 1.07 *** 0.72 *** 0.38 *** 0.86 *** 0.16 0.46 *** 0.56 *** 0.83 ***
European Union_x 1.42 *** 1.26 *** 2.34 *** 1.69 *** 1.98 *** 1.36 *** 2.06 *** 1.57 ***
EFTA 0.28 –0.01 1.22 *** 0.88 ** 0.76 * 0.60 0.87 * 0.73
EFTA_m 1.39 *** 0.64 *** 0.31 ** 0.83 *** 0.22 * 0.48 *** 0.24 0.39 **
EFTA_x 2.69 *** 2.17 *** 3.79 *** 2.33 *** 3.71 *** 2.23 *** 3.51 *** 2.29 ***
LAIA –4.15 *** –4.31 *** –6.12 *** –5.94 *** –4.40 *** –3.73 *** –6.21 *** –4.97 ***
Table 7 Random effects (RE) regression estimates for total merchandise trade and trade in manufactures using truncated and censored data, without and with export and import country fixed effects, and 20 APC-compiled PTAs, 1970–99
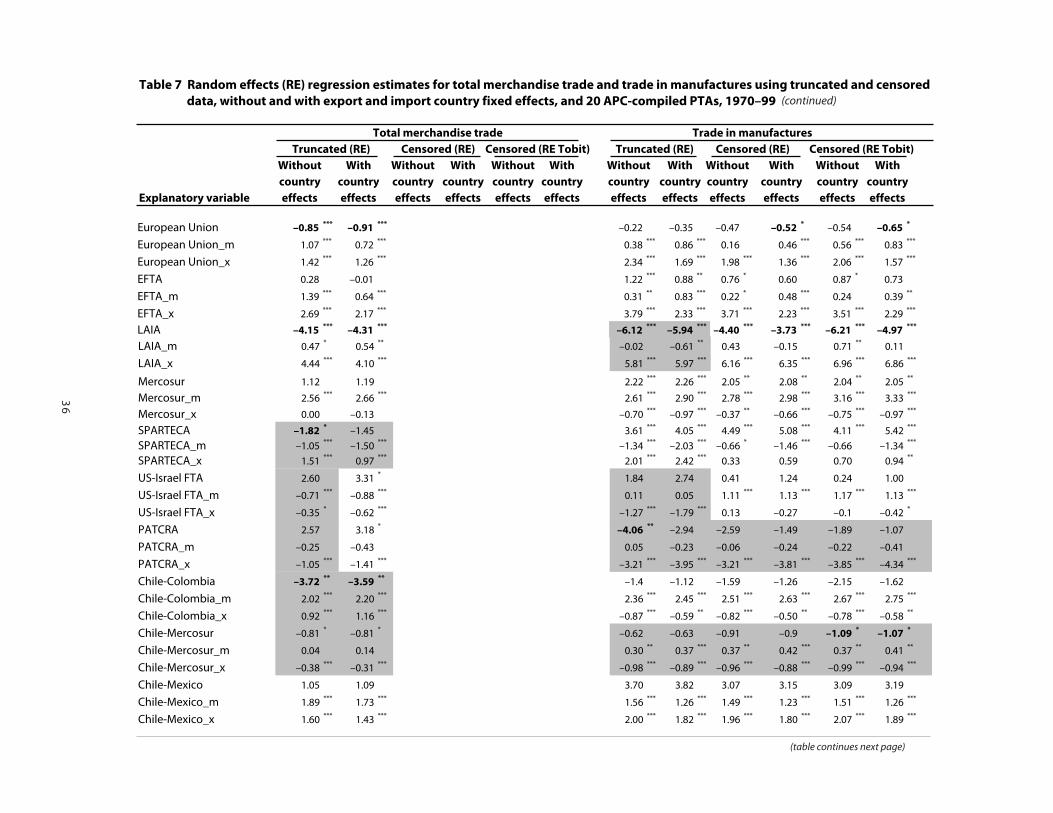
��
(table continues next page)
(continued)
Total merchandise trade Trade in manufacturesTruncated (RE) Censored (RE) Censored (RE Tobit) Truncated (RE) Censored (RE) Censored (RE Tobit)
Without With Without With Without With Without With Without With Without Withcountry country country country country country country country country country country country
Explanatory variable effects effects effects effects effects effects effects effects effects effects effects effects
Distance –1.04 *** –1.17 *** Censored regressions for total trade –1.13 *** –1.32 *** –1.28 *** –1.41 *** –1.41 *** –1.53 ***
Joint GDP 0.82 *** 0.98 *** not supported by dataset 0.92 *** 1.19 *** 0.96 *** 0.91 *** 1.03 *** 1.08 ***
Joint GDP per capita –0.08 *** –0.48 *** –0.17 *** –0.68 *** –0.16 *** –0.35 *** –0.24 *** –0.49 ***
Common language 0.36 *** 0.34 *** 0.44 *** 0.52 *** 0.48 *** 0.56 *** 0.54 *** 0.67 ***
Common border 0.75 *** 0.49 *** 0.73 *** 0.41 *** 0.75 *** 0.41 *** 0.74 *** 0.38 ***
Landlocked –0.37 *** –0.62 *** –0.13 *** –0.81 *** –0.21 *** –1.35 *** –0.29 *** –1.24 ***
Island 0.40 *** 2.02 *** 0.37 *** 0.76 0.43 *** 1.93 *** 0.54 *** 2.19 ***
Land area –0.10 *** 0.24 *** –0.18 *** 0.07 –0.20 *** 0.10 * –0.23 *** 0.01
Common colonizer 0.07 0.71 *** –0.13 * 0.63 *** –0.18 ** 0.69 *** –0.31 *** 0.73 ***
Colony 0.04 0.10 0.48 *** 0.55 *** 0.45 *** 0.51 *** 0.49 *** 0.58 ***
Ever a colony 1.63 *** 1.39 *** 1.37 *** 1.23 *** 1.59 *** 1.33 *** 1.72 *** 1.39 ***
Common country 0.40 0.68 0.22 0.37 0.29 0.39 0.29 0.24
Currency union 0.74 *** 0.59 *** 0.45 *** 0.29 *** 0.43 *** 0.31 ** 0.45 *** 0.37 ***
GSP 0.05 *** 0.00 0.03 ** 0.00 0.04 *** 0.01 0.01 0.02
3rd wave provisions 0.34 *** 0.29 *** –0.98 *** –0.99 *** –0.84 *** –0.80 *** –1.1 *** –0.98 ***
Andean Community 1.13 ** 1.34 *** 0.57 1.03 ** 0.51 1.10 ** 0.60 1.41 ***
Andean Community_m –1.16 *** –0.83 *** –0.57 *** –1.02 *** –0.73 *** –1.13 *** –0.90 *** –1.23 ***
Andean Community_x –1.26 *** –0.92 *** –0.21 1.24 *** –0.3 * 1.01 *** –0.04 0.99 ***
ANZCERTA 1.75 * 1.79 * –0.74 –0.56 0.48 0.64 0.98 0.95
ANZCERTA_m 0.19 0.21 0.82 *** 0.96 *** 0.16 0.20 –0.02 0.03
ANZCERTA_x –1.22 *** –1.24 *** –1.45 *** –1.57 *** –1.34 *** –1.52 *** –1.54 *** –1.71 ***
ASEAN FTA –3.33 *** –3.21 *** –2.28 *** –2.47 *** –3.26 *** –3.36 *** –4.01 *** –4.13 ***
ASEAN FTA_m 1.99 *** 2.15 *** 1.20 *** 1.31 *** 1.86 *** 2.03 *** 2.28 *** 2.39 ***
ASEAN FTA_x 3.06 *** 3.24 *** 5.66 *** 5.95 *** 6.81 *** 7.23 *** 7.27 *** 7.50 ***
CUSFTA-NAFTA 2.15 ** 2.48 ** 2.93 *** 3.38 *** 1.87 * 2.16 * 2.37 * 2.50 **
CUSFTA-NAFTA_m –0.03 –0.45 *** 0.63 *** 0.16 1.56 *** 1.05 *** 1.30 *** 0.85 ***
CUSFTA-NAFTA_x –1.44 *** –1.80 *** –2.27 *** –2.66 *** –2.25 *** –2.66 *** –2.48 *** –2.83 ***
European Union –0.85 *** –0.91 *** –0.22 –0.35 –0.47 –0.52 * –0.54 –0.65 *
European Union_m 1.07 *** 0.72 *** 0.38 *** 0.86 *** 0.16 0.46 *** 0.56 *** 0.83 ***
European Union_x 1.42 *** 1.26 *** 2.34 *** 1.69 *** 1.98 *** 1.36 *** 2.06 *** 1.57 ***
EFTA 0.28 –0.01 1.22 *** 0.88 ** 0.76 * 0.60 0.87 * 0.73
EFTA_m 1.39 *** 0.64 *** 0.31 ** 0.83 *** 0.22 * 0.48 *** 0.24 0.39 **
EFTA_x 2.69 *** 2.17 *** 3.79 *** 2.33 *** 3.71 *** 2.23 *** 3.51 *** 2.29 ***
LAIA –4.15 *** –4.31 *** –6.12 *** –5.94 *** –4.40 *** –3.73 *** –6.21 *** –4.97 ***
Table 7 Random effects (RE) regression estimates for total merchandise trade and trade in manufactures using truncated and censored data, without and with export and import country fixed effects, and 20 APC-compiled PTAs, 1970–99
LAIA_m 0.47 * 0.54 ** –0.02 –0.61 ** 0.43 –0.15 0.71 ** 0.11
LAIA_x 4.44 *** 4.10 *** 5.81 *** 5.97 *** 6.16 *** 6.35 *** 6.96 *** 6.86 ***
Mercosur 1.12 1.19 2.22 *** 2.26 *** 2.05 ** 2.08 ** 2.04 ** 2.05 **
Mercosur_m 2.56 *** 2.66 *** 2.61 *** 2.90 *** 2.78 *** 2.98 *** 3.16 *** 3.33 ***
Mercosur_x 0.00 –0.13 –0.70 *** –0.97 *** –0.37 ** –0.66 *** –0.75 *** –0.97 ***
SPARTECA –1.82 * –1.45 3.61 *** 4.05 *** 4.49 *** 5.08 *** 4.11 *** 5.42 ***
SPARTECA_m –1.05 *** –1.50 *** –1.34 *** –2.03 *** –0.66 * –1.46 *** –0.66 –1.34 ***
SPARTECA_x 1.51 *** 0.97 *** 2.01 *** 2.42 *** 0.33 0.59 0.70 0.94 **
US-Israel FTA 2.60 3.31 * 1.84 2.74 0.41 1.24 0.24 1.00
US-Israel FTA_m –0.71 *** –0.88 *** 0.11 0.05 1.11 *** 1.13 *** 1.17 *** 1.13 ***
US-Israel FTA_x –0.35 * –0.62 *** –1.27 *** –1.79 *** 0.13 –0.27 –0.1 –0.42 *
PATCRA 2.57 3.18 * –4.06 ** –2.94 –2.59 –1.49 –1.89 –1.07
PATCRA_m –0.25 –0.43 0.05 –0.23 –0.06 –0.24 –0.22 –0.41
PATCRA_x –1.05 *** –1.41 *** –3.21 *** –3.95 *** –3.21 *** –3.81 *** –3.85 *** –4.34 ***
Chile-Colombia –3.72 ** –3.59 ** –1.4 –1.12 –1.59 –1.26 –2.15 –1.62
Chile-Colombia_m 2.02 *** 2.20 *** 2.36 *** 2.45 *** 2.51 *** 2.63 *** 2.67 *** 2.75 ***
Chile-Colombia_x 0.92 *** 1.16 *** –0.87 *** –0.59 ** –0.82 *** –0.50 ** –0.78 *** –0.58 **
Chile-Mercosur –0.81 * –0.81 * –0.62 –0.63 –0.91 –0.9 –1.09 * –1.07 *
Chile-Mercosur_m 0.04 0.14 0.30 ** 0.37 *** 0.37 ** 0.42 *** 0.37 ** 0.41 **
Chile-Mercosur_x –0.38 *** –0.31 *** –0.98 *** –0.89 *** –0.96 *** –0.88 *** –0.99 *** –0.94 ***
Chile-Mexico 1.05 1.09 3.70 3.82 3.07 3.15 3.09 3.19
Chile-Mexico_m 1.89 *** 1.73 *** 1.56 *** 1.26 *** 1.49 *** 1.23 *** 1.51 *** 1.26 ***
Chile-Mexico_x 1.60 *** 1.43 *** 2.00 *** 1.82 *** 1.96 *** 1.80 *** 2.07 *** 1.89 ***
EU-Egypt 4.38 *** 4.89 *** 4.46 *** 5.03 *** 5.67 *** 6.17 *** 6.20 *** 6.64 ***
EU-Egypt_m –1.72 *** –1.40 *** 0.94 *** 1.01 *** 0.52 ** 0.42 ** 0.09 0.09
EU-Egypt_x –1.43 *** –0.96 *** –3.39 *** –2.61 *** –1.91 *** –1.35 *** –1.90 *** –1.44 ***
EU-Poland 1.36 *** 1.69 *** 1.86 *** 2.12 *** 1.36 *** 1.56 *** 1.64 *** 1.78 ***
EU-Poland_m –1.71 *** –1.31 *** –0.47 *** 0.00 –0.54 *** –0.25 ** –0.57 *** –0.28 **
EU-Poland_x –1.35 *** –1.00 *** –2.10 *** –1.72 *** –1.64 *** –1.41 *** –1.99 *** –1.75 ***
EU-Switzerland 0.33 –0.18 –1.25 ** –1.79 *** –0.74 –1.64 *** –0.82 –1.86 ***
EU-Switzerland_m 0.17 –0.13 0.98 *** 0.99 *** 1.05 *** 0.94 *** 0.86 *** 0.76 ***
EU-Switzerland_x 0.08 –0.61 *** –0.29 –1.21 *** 0.13 –0.82 *** –0.60 ** –1.30 ***
Singapore-NZ (dropped) (dropped) (dropped) (dropped) (dropped) (dropped) (dropped) (dropped)
Singapore-NZ_m (dropped) (dropped) (dropped) (dropped) (dropped) (dropped) (dropped) (dropped)
Singapore-NZ_x (dropped) (dropped) (dropped) (dropped) (dropped) (dropped) (dropped) (dropped)
APEC –0.35 *** –0.28 ** 0.92 *** 0.93 *** 0.84 *** 0.81 *** 0.97 *** 0.87 ***
APEC_m 0.22 *** 0.30 *** 0.37 *** 0.49 *** 0.23 *** 0.34 *** 0.32 *** 0.41 ***
APEC_x 0.18 *** 0.21 *** 0.17 *** 0.17 *** 0.31 *** 0.30 *** 0.28 *** 0.28 ***
GCC (dropped) (dropped) (dropped) (dropped) (dropped) (dropped) (dropped) (dropped)
GCC_m 0.27 *** 0.07 ** 0.01 –0.29 *** 0.00 –0.17 *** –0.09 ** –0.27 ***
GCC_x –0.05 –0.27 *** 1.64 *** 1.62 *** 1.86 *** 1.91 *** 2.13 *** 2.10 ***
Constant –19.54 *** –30.37 *** –21.13 *** –32.76 *** –22.17 *** –25.05 *** –22.92 *** –28.35 ***

��
(table continues next page)
(continued)
Total merchandise trade Trade in manufacturesTruncated (RE) Censored (RE) Censored (RE Tobit) Truncated (RE) Censored (RE) Censored (RE Tobit)
Without With Without With Without With Without With Without With Without Withcountry country country country country country country country country country country country
Explanatory variable effects effects effects effects effects effects effects effects effects effects effects effects
Distance –1.04 *** –1.17 *** Censored regressions for total trade –1.13 *** –1.32 *** –1.28 *** –1.41 *** –1.41 *** –1.53 ***
Joint GDP 0.82 *** 0.98 *** not supported by dataset 0.92 *** 1.19 *** 0.96 *** 0.91 *** 1.03 *** 1.08 ***
Joint GDP per capita –0.08 *** –0.48 *** –0.17 *** –0.68 *** –0.16 *** –0.35 *** –0.24 *** –0.49 ***
Common language 0.36 *** 0.34 *** 0.44 *** 0.52 *** 0.48 *** 0.56 *** 0.54 *** 0.67 ***
Common border 0.75 *** 0.49 *** 0.73 *** 0.41 *** 0.75 *** 0.41 *** 0.74 *** 0.38 ***
Landlocked –0.37 *** –0.62 *** –0.13 *** –0.81 *** –0.21 *** –1.35 *** –0.29 *** –1.24 ***
Island 0.40 *** 2.02 *** 0.37 *** 0.76 0.43 *** 1.93 *** 0.54 *** 2.19 ***
Land area –0.10 *** 0.24 *** –0.18 *** 0.07 –0.20 *** 0.10 * –0.23 *** 0.01
Common colonizer 0.07 0.71 *** –0.13 * 0.63 *** –0.18 ** 0.69 *** –0.31 *** 0.73 ***
Colony 0.04 0.10 0.48 *** 0.55 *** 0.45 *** 0.51 *** 0.49 *** 0.58 ***
Ever a colony 1.63 *** 1.39 *** 1.37 *** 1.23 *** 1.59 *** 1.33 *** 1.72 *** 1.39 ***
Common country 0.40 0.68 0.22 0.37 0.29 0.39 0.29 0.24
Currency union 0.74 *** 0.59 *** 0.45 *** 0.29 *** 0.43 *** 0.31 ** 0.45 *** 0.37 ***
GSP 0.05 *** 0.00 0.03 ** 0.00 0.04 *** 0.01 0.01 0.02
3rd wave provisions 0.34 *** 0.29 *** –0.98 *** –0.99 *** –0.84 *** –0.80 *** –1.1 *** –0.98 ***
Andean Community 1.13 ** 1.34 *** 0.57 1.03 ** 0.51 1.10 ** 0.60 1.41 ***
Andean Community_m –1.16 *** –0.83 *** –0.57 *** –1.02 *** –0.73 *** –1.13 *** –0.90 *** –1.23 ***
Andean Community_x –1.26 *** –0.92 *** –0.21 1.24 *** –0.3 * 1.01 *** –0.04 0.99 ***
ANZCERTA 1.75 * 1.79 * –0.74 –0.56 0.48 0.64 0.98 0.95
ANZCERTA_m 0.19 0.21 0.82 *** 0.96 *** 0.16 0.20 –0.02 0.03
ANZCERTA_x –1.22 *** –1.24 *** –1.45 *** –1.57 *** –1.34 *** –1.52 *** –1.54 *** –1.71 ***
ASEAN FTA –3.33 *** –3.21 *** –2.28 *** –2.47 *** –3.26 *** –3.36 *** –4.01 *** –4.13 ***
ASEAN FTA_m 1.99 *** 2.15 *** 1.20 *** 1.31 *** 1.86 *** 2.03 *** 2.28 *** 2.39 ***
ASEAN FTA_x 3.06 *** 3.24 *** 5.66 *** 5.95 *** 6.81 *** 7.23 *** 7.27 *** 7.50 ***
CUSFTA-NAFTA 2.15 ** 2.48 ** 2.93 *** 3.38 *** 1.87 * 2.16 * 2.37 * 2.50 **
CUSFTA-NAFTA_m –0.03 –0.45 *** 0.63 *** 0.16 1.56 *** 1.05 *** 1.30 *** 0.85 ***
CUSFTA-NAFTA_x –1.44 *** –1.80 *** –2.27 *** –2.66 *** –2.25 *** –2.66 *** –2.48 *** –2.83 ***
European Union –0.85 *** –0.91 *** –0.22 –0.35 –0.47 –0.52 * –0.54 –0.65 *
European Union_m 1.07 *** 0.72 *** 0.38 *** 0.86 *** 0.16 0.46 *** 0.56 *** 0.83 ***
European Union_x 1.42 *** 1.26 *** 2.34 *** 1.69 *** 1.98 *** 1.36 *** 2.06 *** 1.57 ***
EFTA 0.28 –0.01 1.22 *** 0.88 ** 0.76 * 0.60 0.87 * 0.73
EFTA_m 1.39 *** 0.64 *** 0.31 ** 0.83 *** 0.22 * 0.48 *** 0.24 0.39 **
EFTA_x 2.69 *** 2.17 *** 3.79 *** 2.33 *** 3.71 *** 2.23 *** 3.51 *** 2.29 ***
LAIA –4.15 *** –4.31 *** –6.12 *** –5.94 *** –4.40 *** –3.73 *** –6.21 *** –4.97 ***
Table 7 Random effects (RE) regression estimates for total merchandise trade and trade in manufactures using truncated and censored data, without and with export and import country fixed effects, and 20 APC-compiled PTAs, 1970–99
LAIA_m 0.47 * 0.54 ** –0.02 –0.61 ** 0.43 –0.15 0.71 ** 0.11
LAIA_x 4.44 *** 4.10 *** 5.81 *** 5.97 *** 6.16 *** 6.35 *** 6.96 *** 6.86 ***
Mercosur 1.12 1.19 2.22 *** 2.26 *** 2.05 ** 2.08 ** 2.04 ** 2.05 **
Mercosur_m 2.56 *** 2.66 *** 2.61 *** 2.90 *** 2.78 *** 2.98 *** 3.16 *** 3.33 ***
Mercosur_x 0.00 –0.13 –0.70 *** –0.97 *** –0.37 ** –0.66 *** –0.75 *** –0.97 ***
SPARTECA –1.82 * –1.45 3.61 *** 4.05 *** 4.49 *** 5.08 *** 4.11 *** 5.42 ***
SPARTECA_m –1.05 *** –1.50 *** –1.34 *** –2.03 *** –0.66 * –1.46 *** –0.66 –1.34 ***
SPARTECA_x 1.51 *** 0.97 *** 2.01 *** 2.42 *** 0.33 0.59 0.70 0.94 **
US-Israel FTA 2.60 3.31 * 1.84 2.74 0.41 1.24 0.24 1.00
US-Israel FTA_m –0.71 *** –0.88 *** 0.11 0.05 1.11 *** 1.13 *** 1.17 *** 1.13 ***
US-Israel FTA_x –0.35 * –0.62 *** –1.27 *** –1.79 *** 0.13 –0.27 –0.1 –0.42 *
PATCRA 2.57 3.18 * –4.06 ** –2.94 –2.59 –1.49 –1.89 –1.07
PATCRA_m –0.25 –0.43 0.05 –0.23 –0.06 –0.24 –0.22 –0.41
PATCRA_x –1.05 *** –1.41 *** –3.21 *** –3.95 *** –3.21 *** –3.81 *** –3.85 *** –4.34 ***
Chile-Colombia –3.72 ** –3.59 ** –1.4 –1.12 –1.59 –1.26 –2.15 –1.62
Chile-Colombia_m 2.02 *** 2.20 *** 2.36 *** 2.45 *** 2.51 *** 2.63 *** 2.67 *** 2.75 ***
Chile-Colombia_x 0.92 *** 1.16 *** –0.87 *** –0.59 ** –0.82 *** –0.50 ** –0.78 *** –0.58 **
Chile-Mercosur –0.81 * –0.81 * –0.62 –0.63 –0.91 –0.9 –1.09 * –1.07 *
Chile-Mercosur_m 0.04 0.14 0.30 ** 0.37 *** 0.37 ** 0.42 *** 0.37 ** 0.41 **
Chile-Mercosur_x –0.38 *** –0.31 *** –0.98 *** –0.89 *** –0.96 *** –0.88 *** –0.99 *** –0.94 ***
Chile-Mexico 1.05 1.09 3.70 3.82 3.07 3.15 3.09 3.19
Chile-Mexico_m 1.89 *** 1.73 *** 1.56 *** 1.26 *** 1.49 *** 1.23 *** 1.51 *** 1.26 ***
Chile-Mexico_x 1.60 *** 1.43 *** 2.00 *** 1.82 *** 1.96 *** 1.80 *** 2.07 *** 1.89 ***
EU-Egypt 4.38 *** 4.89 *** 4.46 *** 5.03 *** 5.67 *** 6.17 *** 6.20 *** 6.64 ***
EU-Egypt_m –1.72 *** –1.40 *** 0.94 *** 1.01 *** 0.52 ** 0.42 ** 0.09 0.09
EU-Egypt_x –1.43 *** –0.96 *** –3.39 *** –2.61 *** –1.91 *** –1.35 *** –1.90 *** –1.44 ***
EU-Poland 1.36 *** 1.69 *** 1.86 *** 2.12 *** 1.36 *** 1.56 *** 1.64 *** 1.78 ***
EU-Poland_m –1.71 *** –1.31 *** –0.47 *** 0.00 –0.54 *** –0.25 ** –0.57 *** –0.28 **
EU-Poland_x –1.35 *** –1.00 *** –2.10 *** –1.72 *** –1.64 *** –1.41 *** –1.99 *** –1.75 ***
EU-Switzerland 0.33 –0.18 –1.25 ** –1.79 *** –0.74 –1.64 *** –0.82 –1.86 ***
EU-Switzerland_m 0.17 –0.13 0.98 *** 0.99 *** 1.05 *** 0.94 *** 0.86 *** 0.76 ***
EU-Switzerland_x 0.08 –0.61 *** –0.29 –1.21 *** 0.13 –0.82 *** –0.60 ** –1.30 ***
Singapore-NZ (dropped) (dropped) (dropped) (dropped) (dropped) (dropped) (dropped) (dropped)
Singapore-NZ_m (dropped) (dropped) (dropped) (dropped) (dropped) (dropped) (dropped) (dropped)
Singapore-NZ_x (dropped) (dropped) (dropped) (dropped) (dropped) (dropped) (dropped) (dropped)
APEC –0.35 *** –0.28 ** 0.92 *** 0.93 *** 0.84 *** 0.81 *** 0.97 *** 0.87 ***
APEC_m 0.22 *** 0.30 *** 0.37 *** 0.49 *** 0.23 *** 0.34 *** 0.32 *** 0.41 ***
APEC_x 0.18 *** 0.21 *** 0.17 *** 0.17 *** 0.31 *** 0.30 *** 0.28 *** 0.28 ***
GCC (dropped) (dropped) (dropped) (dropped) (dropped) (dropped) (dropped) (dropped)
GCC_m 0.27 *** 0.07 ** 0.01 –0.29 *** 0.00 –0.17 *** –0.09 ** –0.27 ***
GCC_x –0.05 –0.27 *** 1.64 *** 1.62 *** 1.86 *** 1.91 *** 2.13 *** 2.10 ***
Constant –19.54 *** –30.37 *** –21.13 *** –32.76 *** –22.17 *** –25.05 *** –22.92 *** –28.35 ***
R-squared 0.56 0.69 0.51 0.75 0.50 0.76 0.32 0.33
Observations (thousands) 200 200 176 176 200 200 200 200
Groups (thousands) 11 11 10 10 11 11 11 11
Memorandum item: Trade creating versus trade diverting PTAs under alternative criteria
Trade creating PTAs (number)
1st PTA coefficient 6 8 7 9 7 7 7 7
Sum of PTA coefficients 10 12 10 12 14 12 13 13
Trade diverting PTAs (number)
1st PTA coefficient 6 5 4 3 2 4 3 5
Sum of PTA coefficients 7 6 8 6 4 6 5 5
***,**,* indicates statistical significance at the 99, 95, and 90 percent levels, respectively.
ANZCERTA = Australia–New Zealand Closer Economic Relations Trade Agreement
APEC = Asia Pacific Economic Cooperation
ASEAN = Association of Southeast Asian Nations
CUSFTA = Canada United States Free Trade Area
EFTA = European Free Trade Association
GCC = Gulf Cooperative Council
GSP = Generalized System of Preferences
LAIA = Latin American Integration AssociationMercosur = Southern Common Market (Mercado Común del Cono Sur)
NAFTA = North American Free Trade Agreement
PATCRA = Papua New Guinea–Australia Trade and Commercial Relations Agreement
SPARTECA = South Pacific Regional Trade and Economic Cooperation Agreement
Sources: Author's calculations based on generalized least squares estimation of the Rose (2004) gravity model with random effects, using a combined version of the Rose (2004) and the Feenstra-Lipsey (2005) datasets.
Notes: Regressand is log real trade. Distance, joint GDP, joint GDP per capita, and land area are measured in log terms. Truncated (censored) data exclude (include) zero-value trade flows. Estimated year and country effects are not reported. Pseudo R-squared values are reported for the Tobit regressions. Groups are numbers of country-pair-commodity combinations. Estimates in bold are preferential trading arrangements (PTAs) with significant negative 1st PTA coefficients. Shaded estimates indicate PTAs with a negative sum of significant PTA coefficients. PTA variables marked _m indicate the importing country is a PTA member; those marked _x indicate the exporting country is a PTA member; and those not marked indicate both the importing country and the exporting country are PTA members.

��
(continued)
Total merchandise trade Trade in manufacturesTruncated (RE) Censored (RE) Censored (RE Tobit) Truncated (RE) Censored (RE) Censored (RE Tobit)
Without With Without With Without With Without With Without With Without Withcountry country country country country country country country country country country country
Explanatory variable effects effects effects effects effects effects effects effects effects effects effects effects
Distance –1.04 *** –1.17 *** Censored regressions for total trade –1.13 *** –1.32 *** –1.28 *** –1.41 *** –1.41 *** –1.53 ***
Joint GDP 0.82 *** 0.98 *** not supported by dataset 0.92 *** 1.19 *** 0.96 *** 0.91 *** 1.03 *** 1.08 ***
Joint GDP per capita –0.08 *** –0.48 *** –0.17 *** –0.68 *** –0.16 *** –0.35 *** –0.24 *** –0.49 ***
Common language 0.36 *** 0.34 *** 0.44 *** 0.52 *** 0.48 *** 0.56 *** 0.54 *** 0.67 ***
Common border 0.75 *** 0.49 *** 0.73 *** 0.41 *** 0.75 *** 0.41 *** 0.74 *** 0.38 ***
Landlocked –0.37 *** –0.62 *** –0.13 *** –0.81 *** –0.21 *** –1.35 *** –0.29 *** –1.24 ***
Island 0.40 *** 2.02 *** 0.37 *** 0.76 0.43 *** 1.93 *** 0.54 *** 2.19 ***
Land area –0.10 *** 0.24 *** –0.18 *** 0.07 –0.20 *** 0.10 * –0.23 *** 0.01
Common colonizer 0.07 0.71 *** –0.13 * 0.63 *** –0.18 ** 0.69 *** –0.31 *** 0.73 ***
Colony 0.04 0.10 0.48 *** 0.55 *** 0.45 *** 0.51 *** 0.49 *** 0.58 ***
Ever a colony 1.63 *** 1.39 *** 1.37 *** 1.23 *** 1.59 *** 1.33 *** 1.72 *** 1.39 ***
Common country 0.40 0.68 0.22 0.37 0.29 0.39 0.29 0.24
Currency union 0.74 *** 0.59 *** 0.45 *** 0.29 *** 0.43 *** 0.31 ** 0.45 *** 0.37 ***
GSP 0.05 *** 0.00 0.03 ** 0.00 0.04 *** 0.01 0.01 0.02
3rd wave provisions 0.34 *** 0.29 *** –0.98 *** –0.99 *** –0.84 *** –0.80 *** –1.1 *** –0.98 ***
Andean Community 1.13 ** 1.34 *** 0.57 1.03 ** 0.51 1.10 ** 0.60 1.41 ***
Andean Community_m –1.16 *** –0.83 *** –0.57 *** –1.02 *** –0.73 *** –1.13 *** –0.90 *** –1.23 ***
Andean Community_x –1.26 *** –0.92 *** –0.21 1.24 *** –0.3 * 1.01 *** –0.04 0.99 ***
ANZCERTA 1.75 * 1.79 * –0.74 –0.56 0.48 0.64 0.98 0.95
ANZCERTA_m 0.19 0.21 0.82 *** 0.96 *** 0.16 0.20 –0.02 0.03
ANZCERTA_x –1.22 *** –1.24 *** –1.45 *** –1.57 *** –1.34 *** –1.52 *** –1.54 *** –1.71 ***
ASEAN FTA –3.33 *** –3.21 *** –2.28 *** –2.47 *** –3.26 *** –3.36 *** –4.01 *** –4.13 ***
ASEAN FTA_m 1.99 *** 2.15 *** 1.20 *** 1.31 *** 1.86 *** 2.03 *** 2.28 *** 2.39 ***
ASEAN FTA_x 3.06 *** 3.24 *** 5.66 *** 5.95 *** 6.81 *** 7.23 *** 7.27 *** 7.50 ***
CUSFTA-NAFTA 2.15 ** 2.48 ** 2.93 *** 3.38 *** 1.87 * 2.16 * 2.37 * 2.50 **
CUSFTA-NAFTA_m –0.03 –0.45 *** 0.63 *** 0.16 1.56 *** 1.05 *** 1.30 *** 0.85 ***
CUSFTA-NAFTA_x –1.44 *** –1.80 *** –2.27 *** –2.66 *** –2.25 *** –2.66 *** –2.48 *** –2.83 ***
European Union –0.85 *** –0.91 *** –0.22 –0.35 –0.47 –0.52 * –0.54 –0.65 *
European Union_m 1.07 *** 0.72 *** 0.38 *** 0.86 *** 0.16 0.46 *** 0.56 *** 0.83 ***
European Union_x 1.42 *** 1.26 *** 2.34 *** 1.69 *** 1.98 *** 1.36 *** 2.06 *** 1.57 ***
EFTA 0.28 –0.01 1.22 *** 0.88 ** 0.76 * 0.60 0.87 * 0.73
EFTA_m 1.39 *** 0.64 *** 0.31 ** 0.83 *** 0.22 * 0.48 *** 0.24 0.39 **
EFTA_x 2.69 *** 2.17 *** 3.79 *** 2.33 *** 3.71 *** 2.23 *** 3.51 *** 2.29 ***
LAIA –4.15 *** –4.31 *** –6.12 *** –5.94 *** –4.40 *** –3.73 *** –6.21 *** –4.97 ***
Table 7 Random effects (RE) regression estimates for total merchandise trade and trade in manufactures using truncated and censored data, without and with export and import country fixed effects, and 20 APC-compiled PTAs, 1970–99
R-squared 0.56 0.69 0.51 0.75 0.50 0.76 0.32 0.33
Observations (thousands) 200 200 176 176 200 200 200 200
Groups (thousands) 11 11 10 10 11 11 11 11
Memorandum item: Trade creating versus trade diverting PTAs under alternative criteria
Trade creating PTAs (number)
1st PTA coefficient 6 8 7 9 7 7 7 7
Sum of PTA coefficients 10 12 10 12 14 12 13 13
Trade diverting PTAs (number)
1st PTA coefficient 6 5 4 3 2 4 3 5
Sum of PTA coefficients 7 6 8 6 4 6 5 5
***,**,* indicates statistical significance at the 99, 95, and 90 percent levels, respectively.
ANZCERTA = Australia–New Zealand Closer Economic Relations Trade Agreement
APEC = Asia Pacific Economic Cooperation
ASEAN = Association of Southeast Asian Nations
CUSFTA = Canada United States Free Trade Area
EFTA = European Free Trade Association
GCC = Gulf Cooperative Council
GSP = Generalized System of Preferences
LAIA = Latin American Integration AssociationMercosur = Southern Common Market (Mercado Común del Cono Sur)
NAFTA = North American Free Trade Agreement
PATCRA = Papua New Guinea–Australia Trade and Commercial Relations Agreement
SPARTECA = South Pacific Regional Trade and Economic Cooperation Agreement
Sources: Author's calculations based on generalized least squares estimation of the Rose (2004) gravity model with random effects, using a combined version of the Rose (2004) and the Feenstra-Lipsey (2005) datasets.
Notes: Regressand is log real trade. Distance, joint GDP, joint GDP per capita, and land area are measured in log terms. Truncated (censored) data exclude (include) zero-value trade flows. Estimated year and country effects are not reported. Pseudo R-squared values are reported for the Tobit regressions. Groups are numbers of country-pair-commodity combinations. Estimates in bold are preferential trading arrangements (PTAs) with significant negative 1st PTA coefficients. Shaded estimates indicate PTAs with a negative sum of significant PTA coefficients. PTA variables marked _m indicate the importing country is a PTA member; those marked _x indicate the exporting country is a PTA member; and those not marked indicate both the importing country and the exporting country are PTA members.

��
(table continues next page)
Total merchandise trade Trade in manufactures
Truncated (OLS) Censored (Tobit) Truncated (OLS) Censored (OLS) Censored (Tobit)Without With Without With Without With Without With Without With Without Withcountry country country country country country country country country country country country
Explanatory variable effects effects effects effects effects effects effects effects effects effects effects effects
Distance –0.89 *** –1.20 *** –0.91 *** –1.34 *** –1.03 *** –1.44 *** –1.12 *** –1.55 ***
Joint GDP 0.87 *** 0.91 *** 0.97 *** 1.06 *** 1.05 *** 0.77 *** 1.13 *** 0.91 ***
Joint GDP per capita 0.33 *** –0.38 *** 0.32 *** –0.54 *** 0.39 *** –0.17 *** 0.44 *** –0.26 ***
Common language 0.43 *** 0.31 *** 0.53 *** 0.44 *** 0.61 *** 0.49 *** 0.69 *** 0.57 ***
Common border 0.40 *** 0.13 *** 0.42 *** 0.06 0.40 *** 0.02 0.36 *** –0.04
Landlocked –0.35 *** 0.85 *** –0.14 *** 1.47 *** –0.18 *** 1.72 *** –0.21 *** 2.02 ***
Island 0.22 *** 2.60 *** 0.20 *** 4.32 *** 0.22 *** 3.12 *** 0.25 *** 3.40 ***
Land area –0.05 *** 0.24 *** –0.13 *** 0.16 –0.15 *** 0.44 *** –0.17 *** 0.42 ***
Common colonizer 0.57 *** 0.58 *** 0.52 *** 0.53 *** 0.54 *** 0.58 *** 0.57 *** 0.61 ***
Colony 0.78 *** 0.62 *** 1.07 ** 0.79 * 1.05 *** 0.74 *** 1.13 *** 0.83 ***
Ever a colony 1.15 *** 1.31 *** 1.01 *** 1.21 *** 1.16 *** 1.32 *** 1.22 *** 1.37 ***
Common country –0.70 *** 0.16 –0.85 –0.01 –0.86 *** 0.04 –0.89 *** –0.11
Currency union 1.27 *** 0.45 *** 0.90 ** –0.06 1.05 *** 0.05 1.10 *** 0.02
GSP 0.23 *** 0.29 *** 0.04 0.10 *** 0.09 *** 0.18 *** 0.15 *** 0.27 ***
Andean Community 0.61 *** 0.44 *** 1.02 *** 0.89 *** 1.19 *** 0.99 *** 1.36 *** 1.12 ***
Andean Community_m –0.35 *** –0.14 ** –0.02 –0.34 *** 0.02 –0.33 *** 0.04 –0.33 ***
Andean Community_x –0.57 *** –0.27 *** –0.90 *** 0.39 *** –0.87 *** 0.41 *** –0.93 *** 0.42 ***
ANZCERTA 0.42 0.28 0.33 –0.07 0.80 ** 0.57 * 0.54 0.34
ANZCERTA_m –0.32 *** 0.30 *** –0.37 ** 0.73 *** –0.96 *** 0.31 *** –1.26 *** 0.31 ***
ANZCERTA_x –0.28 *** –0.22 *** 0.38 ** –0.30 ** 0.64 *** –0.22 *** 1.04 *** –0.27 ***
Armenia-Russia –0.98 0.15 –0.85 ** 0.28 –0.82 0.44 –0.86 0.45
Armenia-Russia_m 0.29 ** 0.18 0.18 0.07 –0.18 –0.49 ** –0.27 –0.78 ***
Armenia-Russia_x 0.17 –1.81 *** 0.23 –0.69 0.74 *** –1.05 *** 0.92 *** –1.06 ***
ASEAN 0.50 *** –0.07 0.40 * –0.44 *** 0.29 * –0.55 *** 0.12 –0.79 ***
ASEAN_m 0.35 *** 0.39 *** 0.26 *** 0.50 *** 0.12 *** 0.50 *** 0.05 0.56 ***
ASEAN_x 0.73 *** 0.49 *** 1.25 *** 0.74 *** 2.03 *** 1.11 *** 2.30 *** 1.13 ***
BKA –0.48 *** –0.47 *** –0.92 ** –0.86 *** –0.82 *** –0.79 *** –0.87 *** –0.84 ***
BKA_m –0.25 *** 0.66 *** –0.45 *** 0.86 *** –0.54 *** 0.89 *** –0.61 *** 1.00 ***
BKA_x 0.20 *** 0.34 *** 0.71 *** 0.28 *** 1.06 *** 0.51 *** 1.19 *** 0.46 ***
Bulgaria-Turkey –0.32 –0.59 0.01 –0.37 * –0.22 –0.53 –0.15 –0.47
Bulgaria-Turkey_m 0.98 *** 0.65 *** 0.94 *** 0.61 *** 1.18 *** 0.70 *** 1.27 *** 0.73 ***
Bulgaria-Turkey_x 0.76 *** 0.80 *** 0.99 *** 0.74 *** 1.40 *** 0.81 *** 1.62 *** 0.86 ***
Table 8 OLS and Tobit estimates for total merchandise trade and trade in manufactures using truncated and censored data, without and with and import country fixed effects, and 46 WTO-compiled PTAs, 1970–99
Censored (OLS)
Censored regressions for total trade
not supported by dataset
export
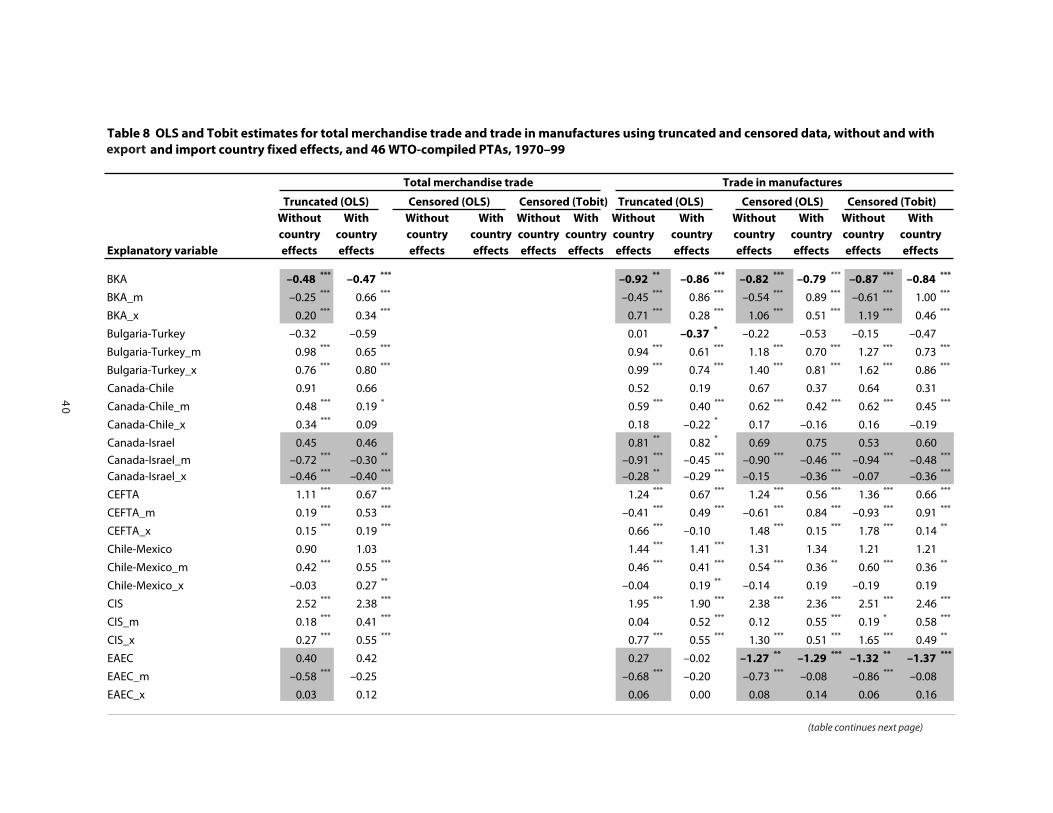
�0
(table continues next page)
Total merchandise trade Trade in manufactures
Truncated (OLS) Censored (Tobit) Truncated (OLS) Censored (OLS) Censored (Tobit)Without With Without With Without With Without With Without With Without Withcountry country country country country country country country country country country country
Explanatory variable effects effects effects effects effects effects effects effects effects effects effects effects
Distance –0.89 *** –1.20 *** –0.91 *** –1.34 *** –1.03 *** –1.44 *** –1.12 *** –1.55 ***
Joint GDP 0.87 *** 0.91 *** 0.97 *** 1.06 *** 1.05 *** 0.77 *** 1.13 *** 0.91 ***
Joint GDP per capita 0.33 *** –0.38 *** 0.32 *** –0.54 *** 0.39 *** –0.17 *** 0.44 *** –0.26 ***
Common language 0.43 *** 0.31 *** 0.53 *** 0.44 *** 0.61 *** 0.49 *** 0.69 *** 0.57 ***
Common border 0.40 *** 0.13 *** 0.42 *** 0.06 0.40 *** 0.02 0.36 *** –0.04
Landlocked –0.35 *** 0.85 *** –0.14 *** 1.47 *** –0.18 *** 1.72 *** –0.21 *** 2.02 ***
Island 0.22 *** 2.60 *** 0.20 *** 4.32 *** 0.22 *** 3.12 *** 0.25 *** 3.40 ***
Land area –0.05 *** 0.24 *** –0.13 *** 0.16 –0.15 *** 0.44 *** –0.17 *** 0.42 ***
Common colonizer 0.57 *** 0.58 *** 0.52 *** 0.53 *** 0.54 *** 0.58 *** 0.57 *** 0.61 ***
Colony 0.78 *** 0.62 *** 1.07 ** 0.79 * 1.05 *** 0.74 *** 1.13 *** 0.83 ***
Ever a colony 1.15 *** 1.31 *** 1.01 *** 1.21 *** 1.16 *** 1.32 *** 1.22 *** 1.37 ***
Common country –0.70 *** 0.16 –0.85 –0.01 –0.86 *** 0.04 –0.89 *** –0.11
Currency union 1.27 *** 0.45 *** 0.90 ** –0.06 1.05 *** 0.05 1.10 *** 0.02
GSP 0.23 *** 0.29 *** 0.04 0.10 *** 0.09 *** 0.18 *** 0.15 *** 0.27 ***
Andean Community 0.61 *** 0.44 *** 1.02 *** 0.89 *** 1.19 *** 0.99 *** 1.36 *** 1.12 ***
Andean Community_m –0.35 *** –0.14 ** –0.02 –0.34 *** 0.02 –0.33 *** 0.04 –0.33 ***
Andean Community_x –0.57 *** –0.27 *** –0.90 *** 0.39 *** –0.87 *** 0.41 *** –0.93 *** 0.42 ***
ANZCERTA 0.42 0.28 0.33 –0.07 0.80 ** 0.57 * 0.54 0.34
ANZCERTA_m –0.32 *** 0.30 *** –0.37 ** 0.73 *** –0.96 *** 0.31 *** –1.26 *** 0.31 ***
ANZCERTA_x –0.28 *** –0.22 *** 0.38 ** –0.30 ** 0.64 *** –0.22 *** 1.04 *** –0.27 ***
Armenia-Russia –0.98 0.15 –0.85 ** 0.28 –0.82 0.44 –0.86 0.45
Armenia-Russia_m 0.29 ** 0.18 0.18 0.07 –0.18 –0.49 ** –0.27 –0.78 ***
Armenia-Russia_x 0.17 –1.81 *** 0.23 –0.69 0.74 *** –1.05 *** 0.92 *** –1.06 ***
ASEAN 0.50 *** –0.07 0.40 * –0.44 *** 0.29 * –0.55 *** 0.12 –0.79 ***
ASEAN_m 0.35 *** 0.39 *** 0.26 *** 0.50 *** 0.12 *** 0.50 *** 0.05 0.56 ***
ASEAN_x 0.73 *** 0.49 *** 1.25 *** 0.74 *** 2.03 *** 1.11 *** 2.30 *** 1.13 ***
BKA –0.48 *** –0.47 *** –0.92 ** –0.86 *** –0.82 *** –0.79 *** –0.87 *** –0.84 ***
BKA_m –0.25 *** 0.66 *** –0.45 *** 0.86 *** –0.54 *** 0.89 *** –0.61 *** 1.00 ***
BKA_x 0.20 *** 0.34 *** 0.71 *** 0.28 *** 1.06 *** 0.51 *** 1.19 *** 0.46 ***
Bulgaria-Turkey –0.32 –0.59 0.01 –0.37 * –0.22 –0.53 –0.15 –0.47
Bulgaria-Turkey_m 0.98 *** 0.65 *** 0.94 *** 0.61 *** 1.18 *** 0.70 *** 1.27 *** 0.73 ***
Bulgaria-Turkey_x 0.76 *** 0.80 *** 0.99 *** 0.74 *** 1.40 *** 0.81 *** 1.62 *** 0.86 ***
Table 8 OLS and Tobit estimates for total merchandise trade and trade in manufactures using truncated and censored data, without and with and import country fixed effects, and 46 WTO-compiled PTAs, 1970–99
Censored (OLS)
Censored regressions for total trade
not supported by dataset
Canada-Chile 0.91 0.66 0.52 0.19 0.67 0.37 0.64 0.31
Canada-Chile_m 0.48 *** 0.19 * 0.59 *** 0.40 *** 0.62 *** 0.42 *** 0.62 *** 0.45 ***
Canada-Chile_x 0.34 *** 0.09 0.18 –0.22 * 0.17 –0.16 0.16 –0.19
Canada-Israel 0.45 0.46 0.81 ** 0.82 * 0.69 0.75 0.53 0.60
Canada-Israel_m –0.72 *** –0.30 ** –0.91 *** –0.45 *** –0.90 *** –0.46 *** –0.94 *** –0.48 ***
Canada-Israel_x –0.46 *** –0.40 *** –0.28 ** –0.29 *** –0.15 –0.36 *** –0.07 –0.36 ***
CEFTA 1.11 *** 0.67 *** 1.24 *** 0.67 *** 1.24 *** 0.56 *** 1.36 *** 0.66 ***
CEFTA_m 0.19 *** 0.53 *** –0.41 *** 0.49 *** –0.61 *** 0.84 *** –0.93 *** 0.91 ***
CEFTA_x 0.15 *** 0.19 *** 0.66 *** –0.10 1.48 *** 0.15 *** 1.78 *** 0.14 **
Chile-Mexico 0.90 1.03 1.44 *** 1.41 *** 1.31 1.34 1.21 1.21
Chile-Mexico_m 0.42 *** 0.55 *** 0.46 *** 0.41 *** 0.54 *** 0.36 ** 0.60 *** 0.36 **
Chile-Mexico_x –0.03 0.27 ** –0.04 0.19 ** –0.14 0.19 –0.19 0.19
CIS 2.52 *** 2.38 *** 1.95 *** 1.90 *** 2.38 *** 2.36 *** 2.51 *** 2.46 ***
CIS_m 0.18 *** 0.41 *** 0.04 0.52 *** 0.12 0.55 *** 0.19 * 0.58 ***
CIS_x 0.27 *** 0.55 *** 0.77 *** 0.55 *** 1.30 *** 0.51 *** 1.65 *** 0.49 **
EAEC 0.40 0.42 0.27 –0.02 –1.27 ** –1.29 *** –1.32 ** –1.37 ***
EAEC_m –0.58 *** –0.25 –0.68 *** –0.20 –0.73 *** –0.08 –0.86 *** –0.08
EAEC_x 0.03 0.12 0.06 0.00 0.08 0.14 0.06 0.16
EFTA 1.11 *** 0.84 *** 1.32 *** 0.88 *** 1.22 *** 0.76 *** 1.29 *** 0.81 ***
EFTA_m 0.35 *** 0.05 –0.56 *** 0.07 –0.63 *** 0.04 –0.85 *** 0.00
EFTA_x 0.47 *** 0.42 *** 1.49 *** 0.51 *** 1.94 *** 0.45 *** 2.17 *** 0.46 ***
EFTA-Bulgaria 0.33 0.41 0.41 0.57 0.76 * 0.90 *** 0.97 ** 1.09 ***
EFTA-Bulgaria_m –0.96 *** –0.61 *** –0.97 *** –0.73 *** –1.09 *** –0.93 *** –1.19 *** –1.06 ***
EFTA-Bulgaria_x –0.95 *** –0.68 *** –2.04 *** –0.95 *** –2.91 *** –1.40 *** –3.25 *** –1.43 ***
EFTA-Israel 0.26 0.30 –0.19 –0.08 0.01 0.12 0.02 0.13
EFTA-Israel_m 0.02 0.46 *** 0.31 ** 0.43 *** 0.09 0.26 ** 0.03 0.24 **
EFTA-Israel_x 0.09 0.35 *** –0.07 0.23 ** –0.10 0.20 * –0.05 0.13
EFTA-Romania –0.41 –0.52 ** –0.37 –0.54 * –0.46 –0.63 ** –0.54 –0.7 **
EFTA-Romania_m 0.40 *** –0.50 *** 0.66 *** –0.11 0.86 *** –0.06 1.07 *** 0.01
EFTA-Romania_x 0.68 *** –0.34 *** 1.54 *** –0.46 *** 2.06 *** –0.33 ** 2.26 *** –0.33 **
EFTA-Turkey –0.05 –0.14 –0.07 –0.18 0.03 –0.05 0.03 –0.09
EFTA-Turkey_m 0.07 0.61 *** –0.02 0.59 *** –0.10 0.65 *** –0.18 ** 0.73 ***
EFTA-Turkey_x –0.03 0.55 *** –0.15 ** 0.80 *** 0.25 *** 1.15 *** 0.30 *** 1.22 ***
European Union –1.25 *** –0.91 *** –0.37 0.04 –0.52 *** –0.15 –0.61 *** –0.20
European Union_m 0.93 *** 0.22 *** –0.77 *** 0.24 *** –0.72 *** 0.13 ** –0.8 *** 0.28 ***
European Union_x 1.09 *** 0.55 *** 2.12 *** 0.72 *** 2.32 *** 0.56 *** 2.47 *** 0.64 ***
EU-Algeria –0.07 –0.22 –0.51 ** –0.59 *** –0.47 –0.45 * –0.50 –0.48 *
EU-Algeria_m 0.10 0.12 * 0.08 0.23 *** –0.03 0.25 *** –0.06 0.28 ***
EU-Algeria_x –0.17 ** 0.00 –0.21 *** 0.08 ** –0.51 *** 0.01 –0.58 *** –0.01
EU-Bulgaria 0.16 0.29 *** 0.22 ** 0.33 *** 0.34 ** 0.38 *** 0.44 *** 0.47 ***
export

��
(table continues next page)
(continued)
Total merchandise trade Trade in manufactures
Truncated (OLS) Censored (Tobit) Truncated (OLS) Censored (OLS) Censored (Tobit)Without With Without With Without With Without With Without With Without Withcountry country country country country country country country country country country country
Explanatory variable effects effects effects effects effects effects effects effects effects effects effects effects
Distance –0.89 *** –1.20 *** –0.91 *** –1.34 *** –1.03 *** –1.44 *** –1.12 *** –1.55 ***
Joint GDP 0.87 *** 0.91 *** 0.97 *** 1.06 *** 1.05 *** 0.77 *** 1.13 *** 0.91 ***
Joint GDP per capita 0.33 *** –0.38 *** 0.32 *** –0.54 *** 0.39 *** –0.17 *** 0.44 *** –0.26 ***
Common language 0.43 *** 0.31 *** 0.53 *** 0.44 *** 0.61 *** 0.49 *** 0.69 *** 0.57 ***
Common border 0.40 *** 0.13 *** 0.42 *** 0.06 0.40 *** 0.02 0.36 *** –0.04
Landlocked –0.35 *** 0.85 *** –0.14 *** 1.47 *** –0.18 *** 1.72 *** –0.21 *** 2.02 ***
Island 0.22 *** 2.60 *** 0.20 *** 4.32 *** 0.22 *** 3.12 *** 0.25 *** 3.40 ***
Land area –0.05 *** 0.24 *** –0.13 *** 0.16 –0.15 *** 0.44 *** –0.17 *** 0.42 ***
Common colonizer 0.57 *** 0.58 *** 0.52 *** 0.53 *** 0.54 *** 0.58 *** 0.57 *** 0.61 ***
Colony 0.78 *** 0.62 *** 1.07 ** 0.79 * 1.05 *** 0.74 *** 1.13 *** 0.83 ***
Ever a colony 1.15 *** 1.31 *** 1.01 *** 1.21 *** 1.16 *** 1.32 *** 1.22 *** 1.37 ***
Common country –0.70 *** 0.16 –0.85 –0.01 –0.86 *** 0.04 –0.89 *** –0.11
Currency union 1.27 *** 0.45 *** 0.90 ** –0.06 1.05 *** 0.05 1.10 *** 0.02
GSP 0.23 *** 0.29 *** 0.04 0.10 *** 0.09 *** 0.18 *** 0.15 *** 0.27 ***
Andean Community 0.61 *** 0.44 *** 1.02 *** 0.89 *** 1.19 *** 0.99 *** 1.36 *** 1.12 ***
Andean Community_m –0.35 *** –0.14 ** –0.02 –0.34 *** 0.02 –0.33 *** 0.04 –0.33 ***
Andean Community_x –0.57 *** –0.27 *** –0.90 *** 0.39 *** –0.87 *** 0.41 *** –0.93 *** 0.42 ***
ANZCERTA 0.42 0.28 0.33 –0.07 0.80 ** 0.57 * 0.54 0.34
ANZCERTA_m –0.32 *** 0.30 *** –0.37 ** 0.73 *** –0.96 *** 0.31 *** –1.26 *** 0.31 ***
ANZCERTA_x –0.28 *** –0.22 *** 0.38 ** –0.30 ** 0.64 *** –0.22 *** 1.04 *** –0.27 ***
Armenia-Russia –0.98 0.15 –0.85 ** 0.28 –0.82 0.44 –0.86 0.45
Armenia-Russia_m 0.29 ** 0.18 0.18 0.07 –0.18 –0.49 ** –0.27 –0.78 ***
Armenia-Russia_x 0.17 –1.81 *** 0.23 –0.69 0.74 *** –1.05 *** 0.92 *** –1.06 ***
ASEAN 0.50 *** –0.07 0.40 * –0.44 *** 0.29 * –0.55 *** 0.12 –0.79 ***
ASEAN_m 0.35 *** 0.39 *** 0.26 *** 0.50 *** 0.12 *** 0.50 *** 0.05 0.56 ***
ASEAN_x 0.73 *** 0.49 *** 1.25 *** 0.74 *** 2.03 *** 1.11 *** 2.30 *** 1.13 ***
BKA –0.48 *** –0.47 *** –0.92 ** –0.86 *** –0.82 *** –0.79 *** –0.87 *** –0.84 ***
BKA_m –0.25 *** 0.66 *** –0.45 *** 0.86 *** –0.54 *** 0.89 *** –0.61 *** 1.00 ***
BKA_x 0.20 *** 0.34 *** 0.71 *** 0.28 *** 1.06 *** 0.51 *** 1.19 *** 0.46 ***
Bulgaria-Turkey –0.32 –0.59 0.01 –0.37 * –0.22 –0.53 –0.15 –0.47
Bulgaria-Turkey_m 0.98 *** 0.65 *** 0.94 *** 0.61 *** 1.18 *** 0.70 *** 1.27 *** 0.73 ***
Bulgaria-Turkey_x 0.76 *** 0.80 *** 0.99 *** 0.74 *** 1.40 *** 0.81 *** 1.62 *** 0.86 ***
Table 8 OLS and Tobit estimates for total merchandise trade and trade in manufactures using truncated and censored data, without and with and import country fixed effects, and 46 WTO-compiled PTAs, 1970–99
Censored (OLS)
Censored regressions for total trade
not supported by dataset
Canada-Chile 0.91 0.66 0.52 0.19 0.67 0.37 0.64 0.31
Canada-Chile_m 0.48 *** 0.19 * 0.59 *** 0.40 *** 0.62 *** 0.42 *** 0.62 *** 0.45 ***
Canada-Chile_x 0.34 *** 0.09 0.18 –0.22 * 0.17 –0.16 0.16 –0.19
Canada-Israel 0.45 0.46 0.81 ** 0.82 * 0.69 0.75 0.53 0.60
Canada-Israel_m –0.72 *** –0.30 ** –0.91 *** –0.45 *** –0.90 *** –0.46 *** –0.94 *** –0.48 ***
Canada-Israel_x –0.46 *** –0.40 *** –0.28 ** –0.29 *** –0.15 –0.36 *** –0.07 –0.36 ***
CEFTA 1.11 *** 0.67 *** 1.24 *** 0.67 *** 1.24 *** 0.56 *** 1.36 *** 0.66 ***
CEFTA_m 0.19 *** 0.53 *** –0.41 *** 0.49 *** –0.61 *** 0.84 *** –0.93 *** 0.91 ***
CEFTA_x 0.15 *** 0.19 *** 0.66 *** –0.10 1.48 *** 0.15 *** 1.78 *** 0.14 **
Chile-Mexico 0.90 1.03 1.44 *** 1.41 *** 1.31 1.34 1.21 1.21
Chile-Mexico_m 0.42 *** 0.55 *** 0.46 *** 0.41 *** 0.54 *** 0.36 ** 0.60 *** 0.36 **
Chile-Mexico_x –0.03 0.27 ** –0.04 0.19 ** –0.14 0.19 –0.19 0.19
CIS 2.52 *** 2.38 *** 1.95 *** 1.90 *** 2.38 *** 2.36 *** 2.51 *** 2.46 ***
CIS_m 0.18 *** 0.41 *** 0.04 0.52 *** 0.12 0.55 *** 0.19 * 0.58 ***
CIS_x 0.27 *** 0.55 *** 0.77 *** 0.55 *** 1.30 *** 0.51 *** 1.65 *** 0.49 **
EAEC 0.40 0.42 0.27 –0.02 –1.27 ** –1.29 *** –1.32 ** –1.37 ***
EAEC_m –0.58 *** –0.25 –0.68 *** –0.20 –0.73 *** –0.08 –0.86 *** –0.08
EAEC_x 0.03 0.12 0.06 0.00 0.08 0.14 0.06 0.16
EFTA 1.11 *** 0.84 *** 1.32 *** 0.88 *** 1.22 *** 0.76 *** 1.29 *** 0.81 ***
EFTA_m 0.35 *** 0.05 –0.56 *** 0.07 –0.63 *** 0.04 –0.85 *** 0.00
EFTA_x 0.47 *** 0.42 *** 1.49 *** 0.51 *** 1.94 *** 0.45 *** 2.17 *** 0.46 ***
EFTA-Bulgaria 0.33 0.41 0.41 0.57 0.76 * 0.90 *** 0.97 ** 1.09 ***
EFTA-Bulgaria_m –0.96 *** –0.61 *** –0.97 *** –0.73 *** –1.09 *** –0.93 *** –1.19 *** –1.06 ***
EFTA-Bulgaria_x –0.95 *** –0.68 *** –2.04 *** –0.95 *** –2.91 *** –1.40 *** –3.25 *** –1.43 ***
EFTA-Israel 0.26 0.30 –0.19 –0.08 0.01 0.12 0.02 0.13
EFTA-Israel_m 0.02 0.46 *** 0.31 ** 0.43 *** 0.09 0.26 ** 0.03 0.24 **
EFTA-Israel_x 0.09 0.35 *** –0.07 0.23 ** –0.10 0.20 * –0.05 0.13
EFTA-Romania –0.41 –0.52 ** –0.37 –0.54 * –0.46 –0.63 ** –0.54 –0.7 **
EFTA-Romania_m 0.40 *** –0.50 *** 0.66 *** –0.11 0.86 *** –0.06 1.07 *** 0.01
EFTA-Romania_x 0.68 *** –0.34 *** 1.54 *** –0.46 *** 2.06 *** –0.33 ** 2.26 *** –0.33 **
EFTA-Turkey –0.05 –0.14 –0.07 –0.18 0.03 –0.05 0.03 –0.09
EFTA-Turkey_m 0.07 0.61 *** –0.02 0.59 *** –0.10 0.65 *** –0.18 ** 0.73 ***
EFTA-Turkey_x –0.03 0.55 *** –0.15 ** 0.80 *** 0.25 *** 1.15 *** 0.30 *** 1.22 ***
European Union –1.25 *** –0.91 *** –0.37 0.04 –0.52 *** –0.15 –0.61 *** –0.20
European Union_m 0.93 *** 0.22 *** –0.77 *** 0.24 *** –0.72 *** 0.13 ** –0.8 *** 0.28 ***
European Union_x 1.09 *** 0.55 *** 2.12 *** 0.72 *** 2.32 *** 0.56 *** 2.47 *** 0.64 ***
EU-Algeria –0.07 –0.22 –0.51 ** –0.59 *** –0.47 –0.45 * –0.50 –0.48 *
EU-Algeria_m 0.10 0.12 * 0.08 0.23 *** –0.03 0.25 *** –0.06 0.28 ***
EU-Algeria_x –0.17 ** 0.00 –0.21 *** 0.08 ** –0.51 *** 0.01 –0.58 *** –0.01
EU-Bulgaria 0.16 0.29 *** 0.22 ** 0.33 *** 0.34 ** 0.38 *** 0.44 *** 0.47 ***
EU-Bulgaria_m 0.00 0.00 0.12 *** 0.03 0.14 * 0.01 0.15 * 0.00
EU-Bulgaria_x –0.13 ** 0.03 0.01 0.03 0.15 ** 0.03 0.18 ** 0.01
EU-Iceland 0.60 *** 0.53 *** 0.37 * 0.18 0.38 *** 0.22 *** 0.49 *** 0.25 ***
EU-Iceland_m –0.64 *** 0.37 *** 0.31 * –0.03 0.49 *** 0.11 0.63 *** 0.20
EU-Iceland_x –1.03 *** 0.19 * –1.58 *** 0.56 *** –1.92 *** 0.39 *** –2.09 *** 0.57 ***
EU-Norway 0.50 *** 0.19 *** 0.59 *** 0.02 0.47 *** –0.07 0.37 *** –0.17 **
EU-Norway_m –0.08 ** –0.16 * 0.35 ** –0.04 0.37 *** –0.06 0.39 *** –0.15
EU-Norway_x –0.26 *** –0.23 *** –0.31 *** –0.44 *** –0.23 *** –0.36 *** –0.23 *** –0.49 ***
EU-Romania 0.04 –0.01 0.07 0.05 –0.03 –0.04 –0.06 –0.05
EU-Romania_m –0.24 *** –0.15 *** –0.06 0.00 –0.14 * –0.04 –0.19 ** –0.07
EU-Romania_x –0.04 –0.08 * –0.46 *** –0.28 *** –0.37 *** –0.18 *** –0.39 *** –0.18 ***
EU-Switzerland –0.46 *** –0.88 *** –0.31 * –1.04 *** –0.65 *** –1.3 *** –0.92 *** –1.56 ***
EU-Switzerland_m 0.42 *** –0.1 –0.32 ** 0.35 *** –0.36 *** 0.27 *** –0.47 *** 0.25 **
EU-Switzerland_x 1.12 *** –0.04 1.89 *** –0.19 ** 2.51 *** 0.05 2.73 *** –0.04
EU-Syria 0.57 ** 0.70 *** 0.43 *** 0.71 *** 0.73 ** 0.90 *** 0.86 ** 1.03 ***
EU-Syria_m –0.28 *** –0.24 *** –0.05 –0.07 –0.19 ** –0.14 ** –0.27 *** –0.21 ***
EU-Syria_x –0.22 *** –0.06 –0.68 *** –0.35 *** –0.45 *** –0.18 *** –0.46 *** –0.19 **
EU-Tunisia –0.16 –0.10 –0.26 *** –0.17 *** –0.27 * –0.18 –0.28 –0.18
EU-Tunisia_m –0.59 *** –0.21 *** –0.60 *** –0.16 *** –0.68 *** –0.21 *** –0.77 *** –0.23 ***
EU-Tunisia_x –0.70 *** –0.28 *** –0.70 *** –0.29 *** –0.79 *** –0.32 *** –0.82 *** –0.33 ***
EU-Turkey 0.16 0.21 ** 0.08 0.17 ** –0.04 0.10 –0.14 0.02
EU-Turkey_m –0.11 ** –0.07 –0.11 *** –0.06 ** –0.10 –0.05 –0.09 –0.02
EU-Turkey_x 0.07 0.01 0.18 *** 0.06 ** 0.19 *** 0.03 0.21 *** 0.03
GCC –0.25 ** –0.39 *** 0.68 *** 0.27 1.14 *** 0.76 *** 1.19 *** 0.77 ***
GCC_m 0.06 ** 0.06 –0.03 –0.43 *** –0.16 *** –0.30 *** –0.26 *** –0.41 ***
GCC_x 0.01 –0.12 *** –0.62 *** 1.61 *** –0.42 *** 1.91 *** –0.31 *** 2.13 ***
Georgia-Kazakhstan –1.17 –1.17 –0.38 –0.40 –0.12 –0.19 0.10 –0.06
Georgia-Kazakhstan_m 0.29 0.28 0.23 0.21 * 0.34 0.24 0.35 0.23
Georgia-Kazakhstan_x 0.19 0.34 * –0.22 –0.05 –0.07 0.05 –0.09 0.03
Georgia-Russia –0.08 0.16 0.24 0.51 0.54 0.76 0.73 0.90
Georgia-Russia_m –0.45 *** 0.62 ** –0.51 ** 1.00 *** –0.61 *** 0.88 *** –0.68 *** 0.89 **
Georgia-Russia_x –0.71 *** –0.29 –0.48 0.41 –0.77 *** 0.47 –0.89 *** 0.57
GSTP –0.02 0.03 –0.20 *** –0.13 ** –0.21 *** –0.14 *** –0.20 *** –0.10 ***
GSTP_m 0.08 *** 0.10 *** 0.01 –0.01 0.07 *** 0.07 *** 0.04 0.06 **
GSTP_x 0.08 *** 0.08 *** –0.09 ** 0.42 *** –0.22 *** 0.38 *** –0.25 *** 0.39 ***
Israel-Turkey 0.10 –0.50 0.27 –0.55 0.17 –0.61 –0.03 –0.84
Israel-Turkey_m –0.23 * 0.06 –0.24 ** 0.10 –0.39 ** 0.01 –0.4 ** 0.03
Israel-Turkey_x 0.03 0.39 *** 0.06 0.45 *** 0.02 0.54 *** –0.02 0.54 ***
Kyrgyz Republic–Kazakhstan 0.29 0.73 0.27 0.98 ** 1.53 ** 2.00 *** 1.66 * 2.12 ***
Kyrgyz Republic–Kazakhstan_m 0.35 *** –0.49 * 0.71 *** –0.51 ** 0.62 *** –0.98 *** 0.68 *** –1.15 ***
export

��
(table continues next page)
(continued)
Total merchandise trade Trade in manufactures
Truncated (OLS) Censored (Tobit) Truncated (OLS) Censored (OLS) Censored (Tobit)Without With Without With Without With Without With Without With Without Withcountry country country country country country country country country country country country
Explanatory variable effects effects effects effects effects effects effects effects effects effects effects effects
Distance –0.89 *** –1.20 *** –0.91 *** –1.34 *** –1.03 *** –1.44 *** –1.12 *** –1.55 ***
Joint GDP 0.87 *** 0.91 *** 0.97 *** 1.06 *** 1.05 *** 0.77 *** 1.13 *** 0.91 ***
Joint GDP per capita 0.33 *** –0.38 *** 0.32 *** –0.54 *** 0.39 *** –0.17 *** 0.44 *** –0.26 ***
Common language 0.43 *** 0.31 *** 0.53 *** 0.44 *** 0.61 *** 0.49 *** 0.69 *** 0.57 ***
Common border 0.40 *** 0.13 *** 0.42 *** 0.06 0.40 *** 0.02 0.36 *** –0.04
Landlocked –0.35 *** 0.85 *** –0.14 *** 1.47 *** –0.18 *** 1.72 *** –0.21 *** 2.02 ***
Island 0.22 *** 2.60 *** 0.20 *** 4.32 *** 0.22 *** 3.12 *** 0.25 *** 3.40 ***
Land area –0.05 *** 0.24 *** –0.13 *** 0.16 –0.15 *** 0.44 *** –0.17 *** 0.42 ***
Common colonizer 0.57 *** 0.58 *** 0.52 *** 0.53 *** 0.54 *** 0.58 *** 0.57 *** 0.61 ***
Colony 0.78 *** 0.62 *** 1.07 ** 0.79 * 1.05 *** 0.74 *** 1.13 *** 0.83 ***
Ever a colony 1.15 *** 1.31 *** 1.01 *** 1.21 *** 1.16 *** 1.32 *** 1.22 *** 1.37 ***
Common country –0.70 *** 0.16 –0.85 –0.01 –0.86 *** 0.04 –0.89 *** –0.11
Currency union 1.27 *** 0.45 *** 0.90 ** –0.06 1.05 *** 0.05 1.10 *** 0.02
GSP 0.23 *** 0.29 *** 0.04 0.10 *** 0.09 *** 0.18 *** 0.15 *** 0.27 ***
Andean Community 0.61 *** 0.44 *** 1.02 *** 0.89 *** 1.19 *** 0.99 *** 1.36 *** 1.12 ***
Andean Community_m –0.35 *** –0.14 ** –0.02 –0.34 *** 0.02 –0.33 *** 0.04 –0.33 ***
Andean Community_x –0.57 *** –0.27 *** –0.90 *** 0.39 *** –0.87 *** 0.41 *** –0.93 *** 0.42 ***
ANZCERTA 0.42 0.28 0.33 –0.07 0.80 ** 0.57 * 0.54 0.34
ANZCERTA_m –0.32 *** 0.30 *** –0.37 ** 0.73 *** –0.96 *** 0.31 *** –1.26 *** 0.31 ***
ANZCERTA_x –0.28 *** –0.22 *** 0.38 ** –0.30 ** 0.64 *** –0.22 *** 1.04 *** –0.27 ***
Armenia-Russia –0.98 0.15 –0.85 ** 0.28 –0.82 0.44 –0.86 0.45
Armenia-Russia_m 0.29 ** 0.18 0.18 0.07 –0.18 –0.49 ** –0.27 –0.78 ***
Armenia-Russia_x 0.17 –1.81 *** 0.23 –0.69 0.74 *** –1.05 *** 0.92 *** –1.06 ***
ASEAN 0.50 *** –0.07 0.40 * –0.44 *** 0.29 * –0.55 *** 0.12 –0.79 ***
ASEAN_m 0.35 *** 0.39 *** 0.26 *** 0.50 *** 0.12 *** 0.50 *** 0.05 0.56 ***
ASEAN_x 0.73 *** 0.49 *** 1.25 *** 0.74 *** 2.03 *** 1.11 *** 2.30 *** 1.13 ***
BKA –0.48 *** –0.47 *** –0.92 ** –0.86 *** –0.82 *** –0.79 *** –0.87 *** –0.84 ***
BKA_m –0.25 *** 0.66 *** –0.45 *** 0.86 *** –0.54 *** 0.89 *** –0.61 *** 1.00 ***
BKA_x 0.20 *** 0.34 *** 0.71 *** 0.28 *** 1.06 *** 0.51 *** 1.19 *** 0.46 ***
Bulgaria-Turkey –0.32 –0.59 0.01 –0.37 * –0.22 –0.53 –0.15 –0.47
Bulgaria-Turkey_m 0.98 *** 0.65 *** 0.94 *** 0.61 *** 1.18 *** 0.70 *** 1.27 *** 0.73 ***
Bulgaria-Turkey_x 0.76 *** 0.80 *** 0.99 *** 0.74 *** 1.40 *** 0.81 *** 1.62 *** 0.86 ***
Table 8 OLS and Tobit estimates for total merchandise trade and trade in manufactures using truncated and censored data, without and with and import country fixed effects, and 46 WTO-compiled PTAs, 1970–99
Censored (OLS)
Censored regressions for total trade
not supported by dataset
EU-Bulgaria_m 0.00 0.00 0.12 *** 0.03 0.14 * 0.01 0.15 * 0.00
EU-Bulgaria_x –0.13 ** 0.03 0.01 0.03 0.15 ** 0.03 0.18 ** 0.01
EU-Iceland 0.60 *** 0.53 *** 0.37 * 0.18 0.38 *** 0.22 *** 0.49 *** 0.25 ***
EU-Iceland_m –0.64 *** 0.37 *** 0.31 * –0.03 0.49 *** 0.11 0.63 *** 0.20
EU-Iceland_x –1.03 *** 0.19 * –1.58 *** 0.56 *** –1.92 *** 0.39 *** –2.09 *** 0.57 ***
EU-Norway 0.50 *** 0.19 *** 0.59 *** 0.02 0.47 *** –0.07 0.37 *** –0.17 **
EU-Norway_m –0.08 ** –0.16 * 0.35 ** –0.04 0.37 *** –0.06 0.39 *** –0.15
EU-Norway_x –0.26 *** –0.23 *** –0.31 *** –0.44 *** –0.23 *** –0.36 *** –0.23 *** –0.49 ***
EU-Romania 0.04 –0.01 0.07 0.05 –0.03 –0.04 –0.06 –0.05
EU-Romania_m –0.24 *** –0.15 *** –0.06 0.00 –0.14 * –0.04 –0.19 ** –0.07
EU-Romania_x –0.04 –0.08 * –0.46 *** –0.28 *** –0.37 *** –0.18 *** –0.39 *** –0.18 ***
EU-Switzerland –0.46 *** –0.88 *** –0.31 * –1.04 *** –0.65 *** –1.3 *** –0.92 *** –1.56 ***
EU-Switzerland_m 0.42 *** –0.1 –0.32 ** 0.35 *** –0.36 *** 0.27 *** –0.47 *** 0.25 **
EU-Switzerland_x 1.12 *** –0.04 1.89 *** –0.19 ** 2.51 *** 0.05 2.73 *** –0.04
EU-Syria 0.57 ** 0.70 *** 0.43 *** 0.71 *** 0.73 ** 0.90 *** 0.86 ** 1.03 ***
EU-Syria_m –0.28 *** –0.24 *** –0.05 –0.07 –0.19 ** –0.14 ** –0.27 *** –0.21 ***
EU-Syria_x –0.22 *** –0.06 –0.68 *** –0.35 *** –0.45 *** –0.18 *** –0.46 *** –0.19 **
EU-Tunisia –0.16 –0.10 –0.26 *** –0.17 *** –0.27 * –0.18 –0.28 –0.18
EU-Tunisia_m –0.59 *** –0.21 *** –0.60 *** –0.16 *** –0.68 *** –0.21 *** –0.77 *** –0.23 ***
EU-Tunisia_x –0.70 *** –0.28 *** –0.70 *** –0.29 *** –0.79 *** –0.32 *** –0.82 *** –0.33 ***
EU-Turkey 0.16 0.21 ** 0.08 0.17 ** –0.04 0.10 –0.14 0.02
EU-Turkey_m –0.11 ** –0.07 –0.11 *** –0.06 ** –0.10 –0.05 –0.09 –0.02
EU-Turkey_x 0.07 0.01 0.18 *** 0.06 ** 0.19 *** 0.03 0.21 *** 0.03
GCC –0.25 ** –0.39 *** 0.68 *** 0.27 1.14 *** 0.76 *** 1.19 *** 0.77 ***
GCC_m 0.06 ** 0.06 –0.03 –0.43 *** –0.16 *** –0.30 *** –0.26 *** –0.41 ***
GCC_x 0.01 –0.12 *** –0.62 *** 1.61 *** –0.42 *** 1.91 *** –0.31 *** 2.13 ***
Georgia-Kazakhstan –1.17 –1.17 –0.38 –0.40 –0.12 –0.19 0.10 –0.06
Georgia-Kazakhstan_m 0.29 0.28 0.23 0.21 * 0.34 0.24 0.35 0.23
Georgia-Kazakhstan_x 0.19 0.34 * –0.22 –0.05 –0.07 0.05 –0.09 0.03
Georgia-Russia –0.08 0.16 0.24 0.51 0.54 0.76 0.73 0.90
Georgia-Russia_m –0.45 *** 0.62 ** –0.51 ** 1.00 *** –0.61 *** 0.88 *** –0.68 *** 0.89 **
Georgia-Russia_x –0.71 *** –0.29 –0.48 0.41 –0.77 *** 0.47 –0.89 *** 0.57
GSTP –0.02 0.03 –0.20 *** –0.13 ** –0.21 *** –0.14 *** –0.20 *** –0.10 ***
GSTP_m 0.08 *** 0.10 *** 0.01 –0.01 0.07 *** 0.07 *** 0.04 0.06 **
GSTP_x 0.08 *** 0.08 *** –0.09 ** 0.42 *** –0.22 *** 0.38 *** –0.25 *** 0.39 ***
Israel-Turkey 0.10 –0.50 0.27 –0.55 0.17 –0.61 –0.03 –0.84
Israel-Turkey_m –0.23 * 0.06 –0.24 ** 0.10 –0.39 ** 0.01 –0.4 ** 0.03
Israel-Turkey_x 0.03 0.39 *** 0.06 0.45 *** 0.02 0.54 *** –0.02 0.54 ***
Kyrgyz Republic–Kazakhstan 0.29 0.73 0.27 0.98 ** 1.53 ** 2.00 *** 1.66 * 2.12 ***
Kyrgyz Republic–Kazakhstan_m 0.35 *** –0.49 * 0.71 *** –0.51 ** 0.62 *** –0.98 *** 0.68 *** –1.15 ***
export

��
(table continues next page)
(continued)
EU-Bulgaria_m 0.00 0.00 0.12 *** 0.03 0.14 * 0.01 0.15 * 0.00
EU-Bulgaria_x –0.13 ** 0.03 0.01 0.03 0.15 ** 0.03 0.18 ** 0.01
EU-Iceland 0.60 *** 0.53 *** 0.37 * 0.18 0.38 *** 0.22 *** 0.49 *** 0.25 ***
EU-Iceland_m –0.64 *** 0.37 *** 0.31 * –0.03 0.49 *** 0.11 0.63 *** 0.20
EU-Iceland_x –1.03 *** 0.19 * –1.58 *** 0.56 *** –1.92 *** 0.39 *** –2.09 *** 0.57 ***
EU-Norway 0.50 *** 0.19 *** 0.59 *** 0.02 0.47 *** –0.07 0.37 *** –0.17 **
EU-Norway_m –0.08 ** –0.16 * 0.35 ** –0.04 0.37 *** –0.06 0.39 *** –0.15
EU-Norway_x –0.26 *** –0.23 *** –0.31 *** –0.44 *** –0.23 *** –0.36 *** –0.23 *** –0.49 ***
EU-Romania 0.04 –0.01 0.07 0.05 –0.03 –0.04 –0.06 –0.05
EU-Romania_m –0.24 *** –0.15 *** –0.06 0.00 –0.14 * –0.04 –0.19 ** –0.07
EU-Romania_x –0.04 –0.08 * –0.46 *** –0.28 *** –0.37 *** –0.18 *** –0.39 *** –0.18 ***
EU-Switzerland –0.46 *** –0.88 *** –0.31 * –1.04 *** –0.65 *** –1.3 *** –0.92 *** –1.56 ***
EU-Switzerland_m 0.42 *** –0.1 –0.32 ** 0.35 *** –0.36 *** 0.27 *** –0.47 *** 0.25 **
EU-Switzerland_x 1.12 *** –0.04 1.89 *** –0.19 ** 2.51 *** 0.05 2.73 *** –0.04
EU-Syria 0.57 ** 0.70 *** 0.43 *** 0.71 *** 0.73 ** 0.90 *** 0.86 ** 1.03 ***
EU-Syria_m –0.28 *** –0.24 *** –0.05 –0.07 –0.19 ** –0.14 ** –0.27 *** –0.21 ***
EU-Syria_x –0.22 *** –0.06 –0.68 *** –0.35 *** –0.45 *** –0.18 *** –0.46 *** –0.19 **
EU-Tunisia –0.16 –0.10 –0.26 *** –0.17 *** –0.27 * –0.18 –0.28 –0.18
EU-Tunisia_m –0.59 *** –0.21 *** –0.60 *** –0.16 *** –0.68 *** –0.21 *** –0.77 *** –0.23 ***
EU-Tunisia_x –0.70 *** –0.28 *** –0.70 *** –0.29 *** –0.79 *** –0.32 *** –0.82 *** –0.33 ***
EU-Turkey 0.16 0.21 ** 0.08 0.17 ** –0.04 0.10 –0.14 0.02
EU-Turkey_m –0.11 ** –0.07 –0.11 *** –0.06 ** –0.10 –0.05 –0.09 –0.02
EU-Turkey_x 0.07 0.01 0.18 *** 0.06 ** 0.19 *** 0.03 0.21 *** 0.03
GCC –0.25 ** –0.39 *** 0.68 *** 0.27 1.14 *** 0.76 *** 1.19 *** 0.77 ***
GCC_m 0.06 ** 0.06 –0.03 –0.43 *** –0.16 *** –0.30 *** –0.26 *** –0.41 ***
GCC_x 0.01 –0.12 *** –0.62 *** 1.61 *** –0.42 *** 1.91 *** –0.31 *** 2.13 ***
Georgia-Kazakhstan –1.17 –1.17 –0.38 –0.40 –0.12 –0.19 0.10 –0.06
Georgia-Kazakhstan_m 0.29 0.28 0.23 0.21 * 0.34 0.24 0.35 0.23
Georgia-Kazakhstan_x 0.19 0.34 * –0.22 –0.05 –0.07 0.05 –0.09 0.03
Georgia-Russia –0.08 0.16 0.24 0.51 0.54 0.76 0.73 0.90
Georgia-Russia_m –0.45 *** 0.62 ** –0.51 ** 1.00 *** –0.61 *** 0.88 *** –0.68 *** 0.89 **
Georgia-Russia_x –0.71 *** –0.29 –0.48 0.41 –0.77 *** 0.47 –0.89 *** 0.57
GSTP –0.02 0.03 –0.20 *** –0.13 ** –0.21 *** –0.14 *** –0.20 *** –0.10 ***
GSTP_m 0.08 *** 0.10 *** 0.01 –0.01 0.07 *** 0.07 *** 0.04 0.06 **
GSTP_x 0.08 *** 0.08 *** –0.09 ** 0.42 *** –0.22 *** 0.38 *** –0.25 *** 0.39 ***
Israel-Turkey 0.10 –0.50 0.27 –0.55 0.17 –0.61 –0.03 –0.84
Israel-Turkey_m –0.23 * 0.06 –0.24 ** 0.10 –0.39 ** 0.01 –0.4 ** 0.03
Israel-Turkey_x 0.03 0.39 *** 0.06 0.45 *** 0.02 0.54 *** –0.02 0.54 ***
Kyrgyz Republic–Kazakhstan 0.29 0.73 0.27 0.98 ** 1.53 ** 2.00 *** 1.66 * 2.12 ***
Kyrgyz Republic–Kazakhstan_m 0.35 *** –0.49 * 0.71 *** –0.51 ** 0.62 *** –0.98 *** 0.68 *** –1.15 ***
Total merchandise trade Trade in manufactures
Truncated (OLS) Censored (Tobit) Truncated (OLS) Censored (OLS) Censored (Tobit)Without With Without With Without With Without With Without With Without Withcountry country country country country country country country country country country country
Explanatory variable effects effects effects effects effects effects effects effects effects effects effects effects
Distance –0.89 *** –1.20 *** –0.91 *** –1.34 *** –1.03 *** –1.44 *** –1.12 *** –1.55 ***
Joint GDP 0.87 *** 0.91 *** 0.97 *** 1.06 *** 1.05 *** 0.77 *** 1.13 *** 0.91 ***
Joint GDP per capita 0.33 *** –0.38 *** 0.32 *** –0.54 *** 0.39 *** –0.17 *** 0.44 *** –0.26 ***
Common language 0.43 *** 0.31 *** 0.53 *** 0.44 *** 0.61 *** 0.49 *** 0.69 *** 0.57 ***
Common border 0.40 *** 0.13 *** 0.42 *** 0.06 0.40 *** 0.02 0.36 *** –0.04
Landlocked –0.35 *** 0.85 *** –0.14 *** 1.47 *** –0.18 *** 1.72 *** –0.21 *** 2.02 ***
Island 0.22 *** 2.60 *** 0.20 *** 4.32 *** 0.22 *** 3.12 *** 0.25 *** 3.40 ***
Land area –0.05 *** 0.24 *** –0.13 *** 0.16 –0.15 *** 0.44 *** –0.17 *** 0.42 ***
Common colonizer 0.57 *** 0.58 *** 0.52 *** 0.53 *** 0.54 *** 0.58 *** 0.57 *** 0.61 ***
Colony 0.78 *** 0.62 *** 1.07 ** 0.79 * 1.05 *** 0.74 *** 1.13 *** 0.83 ***
Ever a colony 1.15 *** 1.31 *** 1.01 *** 1.21 *** 1.16 *** 1.32 *** 1.22 *** 1.37 ***
Common country –0.70 *** 0.16 –0.85 –0.01 –0.86 *** 0.04 –0.89 *** –0.11
Currency union 1.27 *** 0.45 *** 0.90 ** –0.06 1.05 *** 0.05 1.10 *** 0.02
GSP 0.23 *** 0.29 *** 0.04 0.10 *** 0.09 *** 0.18 *** 0.15 *** 0.27 ***
Andean Community 0.61 *** 0.44 *** 1.02 *** 0.89 *** 1.19 *** 0.99 *** 1.36 *** 1.12 ***
Andean Community_m –0.35 *** –0.14 ** –0.02 –0.34 *** 0.02 –0.33 *** 0.04 –0.33 ***
Andean Community_x –0.57 *** –0.27 *** –0.90 *** 0.39 *** –0.87 *** 0.41 *** –0.93 *** 0.42 ***
ANZCERTA 0.42 0.28 0.33 –0.07 0.80 ** 0.57 * 0.54 0.34
ANZCERTA_m –0.32 *** 0.30 *** –0.37 ** 0.73 *** –0.96 *** 0.31 *** –1.26 *** 0.31 ***
ANZCERTA_x –0.28 *** –0.22 *** 0.38 ** –0.30 ** 0.64 *** –0.22 *** 1.04 *** –0.27 ***
Armenia-Russia –0.98 0.15 –0.85 ** 0.28 –0.82 0.44 –0.86 0.45
Armenia-Russia_m 0.29 ** 0.18 0.18 0.07 –0.18 –0.49 ** –0.27 –0.78 ***
Armenia-Russia_x 0.17 –1.81 *** 0.23 –0.69 0.74 *** –1.05 *** 0.92 *** –1.06 ***
ASEAN 0.50 *** –0.07 0.40 * –0.44 *** 0.29 * –0.55 *** 0.12 –0.79 ***
ASEAN_m 0.35 *** 0.39 *** 0.26 *** 0.50 *** 0.12 *** 0.50 *** 0.05 0.56 ***
ASEAN_x 0.73 *** 0.49 *** 1.25 *** 0.74 *** 2.03 *** 1.11 *** 2.30 *** 1.13 ***
BKA –0.48 *** –0.47 *** –0.92 ** –0.86 *** –0.82 *** –0.79 *** –0.87 *** –0.84 ***
BKA_m –0.25 *** 0.66 *** –0.45 *** 0.86 *** –0.54 *** 0.89 *** –0.61 *** 1.00 ***
BKA_x 0.20 *** 0.34 *** 0.71 *** 0.28 *** 1.06 *** 0.51 *** 1.19 *** 0.46 ***
Bulgaria-Turkey –0.32 –0.59 0.01 –0.37 * –0.22 –0.53 –0.15 –0.47
Bulgaria-Turkey_m 0.98 *** 0.65 *** 0.94 *** 0.61 *** 1.18 *** 0.70 *** 1.27 *** 0.73 ***
Bulgaria-Turkey_x 0.76 *** 0.80 *** 0.99 *** 0.74 *** 1.40 *** 0.81 *** 1.62 *** 0.86 ***
Table 8 OLS and Tobit estimates for total merchandise trade and trade in manufactures using truncated and censored data, without and with and import country fixed effects, and 46 WTO-compiled PTAs, 1970–99
Censored (OLS)
Censored regressions for total trade
not supported by dataset
Kyrgyz Republic–Kazakhstan_x 0.27 ** –0.67 ** 0.43 ** –0.72 ** 0.45 *** –0.52 0.57 *** –0.48
Kyrgyz Republic–Russia –2.13 ** –1.37 –1.41 *** –0.28 0.17 0.96 0.17 1.00
Kyrgyz Republic–Russia_m 1.03 *** 0.68 *** 0.87 *** 0.75 1.11 *** 0.50 ** 1.21 *** 0.46 *
Kyrgyz Republic–Russia_x 1.09 *** 3.05 *** 0.85 ** 0.81 * 0.80 *** 2.71 *** 0.72 *** 2.74 ***
LAIA 0.81 *** 0.45 *** 0.74 *** 0.34 *** 1.06 *** 0.71 *** 1.09 *** 0.68 ***
LAIA_m –0.41 *** –0.05 –0.25 *** –0.12 ** –0.23 *** –0.08 *** –0.21 *** –0.07 *
LAIA_x 0.27 *** 0.22 *** 0.13 ** 0.28 *** 0.27 *** 0.29 *** 0.34 *** 0.32 ***
Laos-Thailand 1.06 ** 1.61 *** –0.04 0.28 –0.65 –0.23 –0.61 –0.26
Laos-Thailand_m –0.05 0.58 *** –0.13 0.51 *** –0.10 0.40 *** –0.07 0.50 ***
Laos-Thailand_x –0.14 *** 0.60 *** –0.01 0.84 *** 0.16 ** 1.00 *** 0.24 *** 1.12 ***
Mercosur 0.85 *** 0.70 *** 1.08 *** 0.96 *** 0.98 *** 0.91 *** 0.89 *** 0.84 ***
Mercosur_m 0.21 *** 0.45 *** 0.25 *** 0.54 *** 0.21 *** 0.60 *** 0.21 *** 0.66 ***
Mercosur_x 0.18 *** –0.07 * –0.05 –0.47 *** 0.20 *** –0.38 *** 0.27 *** –0.43 ***
NAFTA 1.35 *** 1.13 *** 1.60 *** 1.12 *** 1.13 *** 0.78 *** 0.79 ** 0.45
NAFTA_m –0.14 *** 0.18 *** –0.22 *** 0.45 *** –0.21 *** 0.53 *** –0.3 *** 0.55 ***
NAFTA_x –0.14 *** –0.14 *** 0.22 *** –0.27 *** 0.67 *** –0.15 *** 0.74 *** –0.19 ***
PATCRA 0.51 * 0.11 –0.60 –0.69 –0.22 –0.36 –0.25 –0.26
PATCRA_m –0.34 *** 0.02 –0.16 0.06 –0.27 *** 0.09 –0.28 *** 0.06
PATCRA_x –0.30 *** –0.18 ** 0.00 –0.74 *** 0.17 *** –0.67 *** 0.28 *** –0.77 ***
PTN 0.06 * 0.11 *** –0.16 –0.04 –0.19 *** –0.06 ** –0.15 *** 0.01
PTN_m –0.16 *** 0.38 *** –0.23 *** 0.24 *** –0.35 *** 0.22 *** –0.44 *** 0.24 ***
PTN_x –0.33 *** 0.25 *** 0.21 *** 0.39 *** 0.57 *** 0.55 *** 0.71 *** 0.55 ***
Romania-Moldova 2.69 *** 2.41 *** 2.32 *** 2.04 *** 2.64 *** 2.28 *** 2.81 *** 2.38 ***
Romania-Moldova_m 0.21 * 0.20 0.13 0.15 0.20 –0.07 0.31 ** –0.05
Romania-Moldova_x 0.22 * 0.14 0.02 0.14 –0.13 –0.06 –0.15 –0.09
Romania-Turkey –0.14 –0.67 0.28 –0.49 ** –0.11 –0.83 –0.20 –0.95
Romania-Turkey_m –0.31 ** –0.10 –0.44 *** –0.18 * –0.31 * 0.04 –0.43 ** –0.03
Romania-Turkey_x –0.20 –0.23 ** –0.45 *** –0.11 –0.82 *** –0.14 –0.94 *** –0.11
SAPTA 0.21 0.05 –0.37 –0.68 –0.56 * –0.87 *** –0.60 * –0.93 ***
SAPTA_m 0.00 0.29 *** –0.09 0.15 ** 0.01 0.12 ** 0.00 0.09
SAPTA_x 0.18 *** 0.39 *** 0.46 *** 0.32 *** 0.93 *** 0.59 *** 1.11 *** 0.61 ***
SPARTECA 2.20 *** 1.76 *** 3.11 *** 2.76 *** 3.35 *** 2.84 *** 3.79 *** 3.15 ***
SPARTECA_m 0.17 *** –0.33 *** 0.32 ** –0.50 *** 0.64 *** –0.40 *** 0.74 *** –0.41 ***
SPARTECA_x 0.60 *** 0.05 –0.71 *** 0.31 *** –0.89 *** 0.00 –1.35 *** 0.00
TRIPART 1.40 *** 1.30 *** –0.34 –0.23 –0.15 –0.04 –0.17 –0.05
TRIPART_m –0.56 *** 0.67 ** –0.44 *** 1.60 *** –0.41 *** 1.59 *** –0.44 *** 1.30 ***
TRIPART_x –0.86 *** 1.01 –0.76 *** 0.76 –0.45 *** 1.11 –0.38 *** 1.00 **
US-Israel 1.21 *** 1.41 *** 1.53 *** 1.64 *** 1.26 *** 1.39 *** 1.06 ** 1.17 ***
US-Israel_m 0.26 *** –0.29 *** –0.10 –0.21 ** –0.01 0.08 –0.07 0.06
US-Israel_x 0.44 *** –0.24 *** 0.53 *** –0.43 *** 0.86 *** –0.14 *** 0.86 *** –0.15 **
export
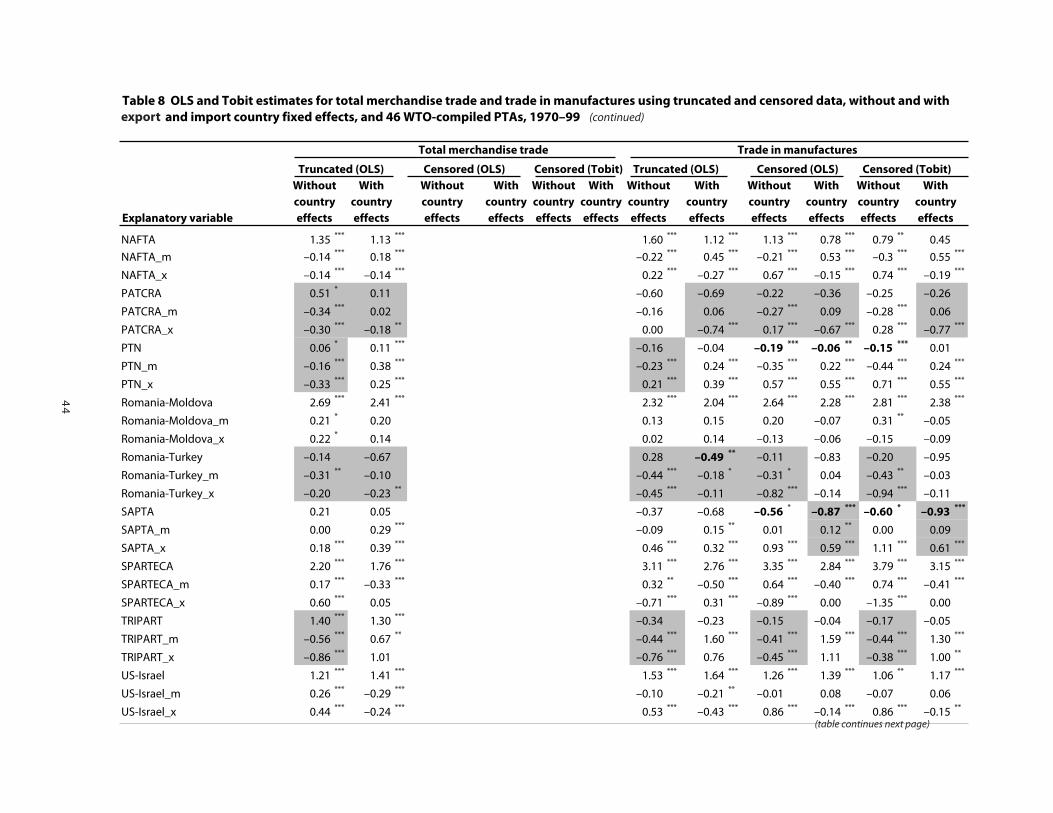
��
(table continues next page)
(continued)
Total merchandise trade Trade in manufactures
Truncated (OLS) Censored (Tobit) Truncated (OLS) Censored (OLS) Censored (Tobit)Without With Without With Without With Without With Without With Without Withcountry country country country country country country country country country country country
Explanatory variable effects effects effects effects effects effects effects effects effects effects effects effects
Distance –0.89 *** –1.20 *** –0.91 *** –1.34 *** –1.03 *** –1.44 *** –1.12 *** –1.55 ***
Joint GDP 0.87 *** 0.91 *** 0.97 *** 1.06 *** 1.05 *** 0.77 *** 1.13 *** 0.91 ***
Joint GDP per capita 0.33 *** –0.38 *** 0.32 *** –0.54 *** 0.39 *** –0.17 *** 0.44 *** –0.26 ***
Common language 0.43 *** 0.31 *** 0.53 *** 0.44 *** 0.61 *** 0.49 *** 0.69 *** 0.57 ***
Common border 0.40 *** 0.13 *** 0.42 *** 0.06 0.40 *** 0.02 0.36 *** –0.04
Landlocked –0.35 *** 0.85 *** –0.14 *** 1.47 *** –0.18 *** 1.72 *** –0.21 *** 2.02 ***
Island 0.22 *** 2.60 *** 0.20 *** 4.32 *** 0.22 *** 3.12 *** 0.25 *** 3.40 ***
Land area –0.05 *** 0.24 *** –0.13 *** 0.16 –0.15 *** 0.44 *** –0.17 *** 0.42 ***
Common colonizer 0.57 *** 0.58 *** 0.52 *** 0.53 *** 0.54 *** 0.58 *** 0.57 *** 0.61 ***
Colony 0.78 *** 0.62 *** 1.07 ** 0.79 * 1.05 *** 0.74 *** 1.13 *** 0.83 ***
Ever a colony 1.15 *** 1.31 *** 1.01 *** 1.21 *** 1.16 *** 1.32 *** 1.22 *** 1.37 ***
Common country –0.70 *** 0.16 –0.85 –0.01 –0.86 *** 0.04 –0.89 *** –0.11
Currency union 1.27 *** 0.45 *** 0.90 ** –0.06 1.05 *** 0.05 1.10 *** 0.02
GSP 0.23 *** 0.29 *** 0.04 0.10 *** 0.09 *** 0.18 *** 0.15 *** 0.27 ***
Andean Community 0.61 *** 0.44 *** 1.02 *** 0.89 *** 1.19 *** 0.99 *** 1.36 *** 1.12 ***
Andean Community_m –0.35 *** –0.14 ** –0.02 –0.34 *** 0.02 –0.33 *** 0.04 –0.33 ***
Andean Community_x –0.57 *** –0.27 *** –0.90 *** 0.39 *** –0.87 *** 0.41 *** –0.93 *** 0.42 ***
ANZCERTA 0.42 0.28 0.33 –0.07 0.80 ** 0.57 * 0.54 0.34
ANZCERTA_m –0.32 *** 0.30 *** –0.37 ** 0.73 *** –0.96 *** 0.31 *** –1.26 *** 0.31 ***
ANZCERTA_x –0.28 *** –0.22 *** 0.38 ** –0.30 ** 0.64 *** –0.22 *** 1.04 *** –0.27 ***
Armenia-Russia –0.98 0.15 –0.85 ** 0.28 –0.82 0.44 –0.86 0.45
Armenia-Russia_m 0.29 ** 0.18 0.18 0.07 –0.18 –0.49 ** –0.27 –0.78 ***
Armenia-Russia_x 0.17 –1.81 *** 0.23 –0.69 0.74 *** –1.05 *** 0.92 *** –1.06 ***
ASEAN 0.50 *** –0.07 0.40 * –0.44 *** 0.29 * –0.55 *** 0.12 –0.79 ***
ASEAN_m 0.35 *** 0.39 *** 0.26 *** 0.50 *** 0.12 *** 0.50 *** 0.05 0.56 ***
ASEAN_x 0.73 *** 0.49 *** 1.25 *** 0.74 *** 2.03 *** 1.11 *** 2.30 *** 1.13 ***
BKA –0.48 *** –0.47 *** –0.92 ** –0.86 *** –0.82 *** –0.79 *** –0.87 *** –0.84 ***
BKA_m –0.25 *** 0.66 *** –0.45 *** 0.86 *** –0.54 *** 0.89 *** –0.61 *** 1.00 ***
BKA_x 0.20 *** 0.34 *** 0.71 *** 0.28 *** 1.06 *** 0.51 *** 1.19 *** 0.46 ***
Bulgaria-Turkey –0.32 –0.59 0.01 –0.37 * –0.22 –0.53 –0.15 –0.47
Bulgaria-Turkey_m 0.98 *** 0.65 *** 0.94 *** 0.61 *** 1.18 *** 0.70 *** 1.27 *** 0.73 ***
Bulgaria-Turkey_x 0.76 *** 0.80 *** 0.99 *** 0.74 *** 1.40 *** 0.81 *** 1.62 *** 0.86 ***
Table 8 OLS and Tobit estimates for total merchandise trade and trade in manufactures using truncated and censored data, without and with and import country fixed effects, and 46 WTO-compiled PTAs, 1970–99
Censored (OLS)
Censored regressions for total trade
not supported by dataset
Kyrgyz Republic–Kazakhstan_x 0.27 ** –0.67 ** 0.43 ** –0.72 ** 0.45 *** –0.52 0.57 *** –0.48
Kyrgyz Republic–Russia –2.13 ** –1.37 –1.41 *** –0.28 0.17 0.96 0.17 1.00
Kyrgyz Republic–Russia_m 1.03 *** 0.68 *** 0.87 *** 0.75 1.11 *** 0.50 ** 1.21 *** 0.46 *
Kyrgyz Republic–Russia_x 1.09 *** 3.05 *** 0.85 ** 0.81 * 0.80 *** 2.71 *** 0.72 *** 2.74 ***
LAIA 0.81 *** 0.45 *** 0.74 *** 0.34 *** 1.06 *** 0.71 *** 1.09 *** 0.68 ***
LAIA_m –0.41 *** –0.05 –0.25 *** –0.12 ** –0.23 *** –0.08 *** –0.21 *** –0.07 *
LAIA_x 0.27 *** 0.22 *** 0.13 ** 0.28 *** 0.27 *** 0.29 *** 0.34 *** 0.32 ***
Laos-Thailand 1.06 ** 1.61 *** –0.04 0.28 –0.65 –0.23 –0.61 –0.26
Laos-Thailand_m –0.05 0.58 *** –0.13 0.51 *** –0.10 0.40 *** –0.07 0.50 ***
Laos-Thailand_x –0.14 *** 0.60 *** –0.01 0.84 *** 0.16 ** 1.00 *** 0.24 *** 1.12 ***
Mercosur 0.85 *** 0.70 *** 1.08 *** 0.96 *** 0.98 *** 0.91 *** 0.89 *** 0.84 ***
Mercosur_m 0.21 *** 0.45 *** 0.25 *** 0.54 *** 0.21 *** 0.60 *** 0.21 *** 0.66 ***
Mercosur_x 0.18 *** –0.07 * –0.05 –0.47 *** 0.20 *** –0.38 *** 0.27 *** –0.43 ***
NAFTA 1.35 *** 1.13 *** 1.60 *** 1.12 *** 1.13 *** 0.78 *** 0.79 ** 0.45
NAFTA_m –0.14 *** 0.18 *** –0.22 *** 0.45 *** –0.21 *** 0.53 *** –0.3 *** 0.55 ***
NAFTA_x –0.14 *** –0.14 *** 0.22 *** –0.27 *** 0.67 *** –0.15 *** 0.74 *** –0.19 ***
PATCRA 0.51 * 0.11 –0.60 –0.69 –0.22 –0.36 –0.25 –0.26
PATCRA_m –0.34 *** 0.02 –0.16 0.06 –0.27 *** 0.09 –0.28 *** 0.06
PATCRA_x –0.30 *** –0.18 ** 0.00 –0.74 *** 0.17 *** –0.67 *** 0.28 *** –0.77 ***
PTN 0.06 * 0.11 *** –0.16 –0.04 –0.19 *** –0.06 ** –0.15 *** 0.01
PTN_m –0.16 *** 0.38 *** –0.23 *** 0.24 *** –0.35 *** 0.22 *** –0.44 *** 0.24 ***
PTN_x –0.33 *** 0.25 *** 0.21 *** 0.39 *** 0.57 *** 0.55 *** 0.71 *** 0.55 ***
Romania-Moldova 2.69 *** 2.41 *** 2.32 *** 2.04 *** 2.64 *** 2.28 *** 2.81 *** 2.38 ***
Romania-Moldova_m 0.21 * 0.20 0.13 0.15 0.20 –0.07 0.31 ** –0.05
Romania-Moldova_x 0.22 * 0.14 0.02 0.14 –0.13 –0.06 –0.15 –0.09
Romania-Turkey –0.14 –0.67 0.28 –0.49 ** –0.11 –0.83 –0.20 –0.95
Romania-Turkey_m –0.31 ** –0.10 –0.44 *** –0.18 * –0.31 * 0.04 –0.43 ** –0.03
Romania-Turkey_x –0.20 –0.23 ** –0.45 *** –0.11 –0.82 *** –0.14 –0.94 *** –0.11
SAPTA 0.21 0.05 –0.37 –0.68 –0.56 * –0.87 *** –0.60 * –0.93 ***
SAPTA_m 0.00 0.29 *** –0.09 0.15 ** 0.01 0.12 ** 0.00 0.09
SAPTA_x 0.18 *** 0.39 *** 0.46 *** 0.32 *** 0.93 *** 0.59 *** 1.11 *** 0.61 ***
SPARTECA 2.20 *** 1.76 *** 3.11 *** 2.76 *** 3.35 *** 2.84 *** 3.79 *** 3.15 ***
SPARTECA_m 0.17 *** –0.33 *** 0.32 ** –0.50 *** 0.64 *** –0.40 *** 0.74 *** –0.41 ***
SPARTECA_x 0.60 *** 0.05 –0.71 *** 0.31 *** –0.89 *** 0.00 –1.35 *** 0.00
TRIPART 1.40 *** 1.30 *** –0.34 –0.23 –0.15 –0.04 –0.17 –0.05
TRIPART_m –0.56 *** 0.67 ** –0.44 *** 1.60 *** –0.41 *** 1.59 *** –0.44 *** 1.30 ***
TRIPART_x –0.86 *** 1.01 –0.76 *** 0.76 –0.45 *** 1.11 –0.38 *** 1.00 **
US-Israel 1.21 *** 1.41 *** 1.53 *** 1.64 *** 1.26 *** 1.39 *** 1.06 ** 1.17 ***
US-Israel_m 0.26 *** –0.29 *** –0.10 –0.21 ** –0.01 0.08 –0.07 0.06
US-Israel_x 0.44 *** –0.24 *** 0.53 *** –0.43 *** 0.86 *** –0.14 *** 0.86 *** –0.15 **
export

��
(continued)
Total merchandise trade Trade in manufactures
Truncated (OLS) Censored (Tobit) Truncated (OLS) Censored (OLS) Censored (Tobit)Without With Without With Without With Without With Without With Without Withcountry country country country country country country country country country country country
Explanatory variable effects effects effects effects effects effects effects effects effects effects effects effects
Distance –0.89 *** –1.20 *** –0.91 *** –1.34 *** –1.03 *** –1.44 *** –1.12 *** –1.55 ***
Joint GDP 0.87 *** 0.91 *** 0.97 *** 1.06 *** 1.05 *** 0.77 *** 1.13 *** 0.91 ***
Joint GDP per capita 0.33 *** –0.38 *** 0.32 *** –0.54 *** 0.39 *** –0.17 *** 0.44 *** –0.26 ***
Common language 0.43 *** 0.31 *** 0.53 *** 0.44 *** 0.61 *** 0.49 *** 0.69 *** 0.57 ***
Common border 0.40 *** 0.13 *** 0.42 *** 0.06 0.40 *** 0.02 0.36 *** –0.04
Landlocked –0.35 *** 0.85 *** –0.14 *** 1.47 *** –0.18 *** 1.72 *** –0.21 *** 2.02 ***
Island 0.22 *** 2.60 *** 0.20 *** 4.32 *** 0.22 *** 3.12 *** 0.25 *** 3.40 ***
Land area –0.05 *** 0.24 *** –0.13 *** 0.16 –0.15 *** 0.44 *** –0.17 *** 0.42 ***
Common colonizer 0.57 *** 0.58 *** 0.52 *** 0.53 *** 0.54 *** 0.58 *** 0.57 *** 0.61 ***
Colony 0.78 *** 0.62 *** 1.07 ** 0.79 * 1.05 *** 0.74 *** 1.13 *** 0.83 ***
Ever a colony 1.15 *** 1.31 *** 1.01 *** 1.21 *** 1.16 *** 1.32 *** 1.22 *** 1.37 ***
Common country –0.70 *** 0.16 –0.85 –0.01 –0.86 *** 0.04 –0.89 *** –0.11
Currency union 1.27 *** 0.45 *** 0.90 ** –0.06 1.05 *** 0.05 1.10 *** 0.02
GSP 0.23 *** 0.29 *** 0.04 0.10 *** 0.09 *** 0.18 *** 0.15 *** 0.27 ***
Andean Community 0.61 *** 0.44 *** 1.02 *** 0.89 *** 1.19 *** 0.99 *** 1.36 *** 1.12 ***
Andean Community_m –0.35 *** –0.14 ** –0.02 –0.34 *** 0.02 –0.33 *** 0.04 –0.33 ***
Andean Community_x –0.57 *** –0.27 *** –0.90 *** 0.39 *** –0.87 *** 0.41 *** –0.93 *** 0.42 ***
ANZCERTA 0.42 0.28 0.33 –0.07 0.80 ** 0.57 * 0.54 0.34
ANZCERTA_m –0.32 *** 0.30 *** –0.37 ** 0.73 *** –0.96 *** 0.31 *** –1.26 *** 0.31 ***
ANZCERTA_x –0.28 *** –0.22 *** 0.38 ** –0.30 ** 0.64 *** –0.22 *** 1.04 *** –0.27 ***
Armenia-Russia –0.98 0.15 –0.85 ** 0.28 –0.82 0.44 –0.86 0.45
Armenia-Russia_m 0.29 ** 0.18 0.18 0.07 –0.18 –0.49 ** –0.27 –0.78 ***
Armenia-Russia_x 0.17 –1.81 *** 0.23 –0.69 0.74 *** –1.05 *** 0.92 *** –1.06 ***
ASEAN 0.50 *** –0.07 0.40 * –0.44 *** 0.29 * –0.55 *** 0.12 –0.79 ***
ASEAN_m 0.35 *** 0.39 *** 0.26 *** 0.50 *** 0.12 *** 0.50 *** 0.05 0.56 ***
ASEAN_x 0.73 *** 0.49 *** 1.25 *** 0.74 *** 2.03 *** 1.11 *** 2.30 *** 1.13 ***
BKA –0.48 *** –0.47 *** –0.92 ** –0.86 *** –0.82 *** –0.79 *** –0.87 *** –0.84 ***
BKA_m –0.25 *** 0.66 *** –0.45 *** 0.86 *** –0.54 *** 0.89 *** –0.61 *** 1.00 ***
BKA_x 0.20 *** 0.34 *** 0.71 *** 0.28 *** 1.06 *** 0.51 *** 1.19 *** 0.46 ***
Bulgaria-Turkey –0.32 –0.59 0.01 –0.37 * –0.22 –0.53 –0.15 –0.47
Bulgaria-Turkey_m 0.98 *** 0.65 *** 0.94 *** 0.61 *** 1.18 *** 0.70 *** 1.27 *** 0.73 ***
Bulgaria-Turkey_x 0.76 *** 0.80 *** 0.99 *** 0.74 *** 1.40 *** 0.81 *** 1.62 *** 0.86 ***
Table 8 OLS and Tobit estimates for total merchandise trade and trade in manufactures using truncated and censored data, without and with and import country fixed effects, and 46 WTO-compiled PTAs, 1970–99
Censored (OLS)
Censored regressions for total trade
not supported by dataset
Constant –30.96 *** –30.55 *** –35.02 *** –35.48 *** –38.91 *** –32.88 *** –42.83 *** –37.44 ***
R-squared 0.62 0.70 0.62 0.76 0.62 0.77 0.17 0.26
Observations (thousands) 200 200 176 176 200 200 200 200
Groups (thousands) n.a. n.a. n.a. n.a. n.a. n.a. n.a. n.a.
Memorandum item: Trade creating versus trade diverting PTAs under alternative criteria
Trade creating PTAs (number)
1st PTA coefficient 18 18 18 16 19 17 17 15
Sum of PTA coefficients 23 32 26 34 30 31 30 31
Trade diverting PTAs (number)
1st PTA coefficient 5 5 7 9 8 9 7 9
Sum of PTA coefficients 20 13 17 10 14 12 14 12
***,**,* indicates statistical significance at the 99, 95, and 90 percent levels, respectively.
n.a. = not applicable
BKA = Bangkok Agreement
CEFTA = Central European Free Trade Agreement
CIS = Commonwealth of Independent States
EAEC = Eurasian Economic Community
GCC = Gulf Cooperation Council
GSTP = General System of Trade Preferences
NAFTA = North American Free Trade Agreement
PATCRA = Papua New Guinea–Australia Trade and Commercial Relations Agreement
PTN = Protocol on Trade among Developing Countries
TRIPART = Tripartite Agreement
Notes: Regressand is log real trade. Distance, joint GDP, joint GDP per capita, and land area are measured in log terms. Truncated (censored) data exclude (include) zero-value trade flows. Estimated year and country effects are not reported. Pseudo R-squared values are reported for the Tobit regressions. Groups are numbers of country-pair-commodity combinations. Estimates in bold are preferential trading arrangements (PTAs) with significant negative 1st PTA coefficients. Shaded estimates indicate PTAs with a negative sum of significant PTA coefficients. PTA variables marked _m indicate the importing country is a PTA member; those marked _x indicate the exporting country is a PTA member; and those not marked indicate both the importing country and the exporting country are PTA members.
Sources: Author's calculations based on ordinary least squares (OLS) and maximum likelihood estimation of the Rose (2004) gravity model, using a combined version of the Rose (2004) and the Feenstra-Lipsey (2005) datasets.
export
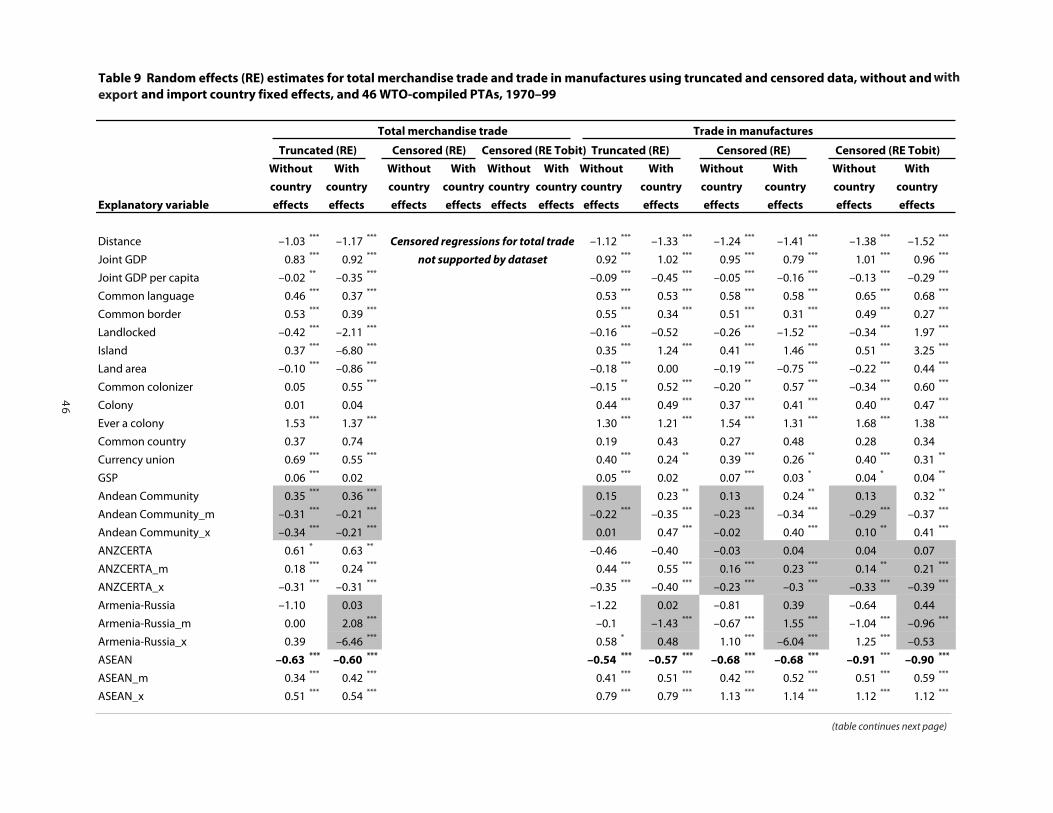
��
(table continues next page)
Total merchandise trade Trade in manufactures
Truncated (RE) Censored (RE Tobit) Truncated (RE) Censored (RE) Censored (RE Tobit)
Without With Without With Without With Without With Without With Without With
country country country country country country country country country country country country
Explanatory variable effects effects effects effects effects effects effects effects effects effects effects effects
Distance –1.03 *** –1.17 *** Censored regressions for total trade –1.12 *** –1.33 *** –1.24 *** –1.41 *** –1.38 *** –1.52 ***
Joint GDP 0.83 *** 0.92 *** not supported by dataset 0.92 *** 1.02 *** 0.95 *** 0.79 *** 1.01 *** 0.96 ***
Joint GDP per capita –0.02 ** –0.35 *** –0.09 *** –0.45 *** –0.05 *** –0.16 *** –0.13 *** –0.29 ***
Common language 0.46 *** 0.37 *** 0.53 *** 0.53 *** 0.58 *** 0.58 *** 0.65 *** 0.68 ***
Common border 0.53 *** 0.39 *** 0.55 *** 0.34 *** 0.51 *** 0.31 *** 0.49 *** 0.27 ***
Landlocked –0.42 *** –2.11 *** –0.16 *** –0.52 –0.26 *** –1.52 *** –0.34 *** 1.97 ***
Island 0.37 *** –6.80 *** 0.35 *** 1.24 *** 0.41 *** 1.46 *** 0.51 *** 3.25 ***
Land area –0.10 *** –0.86 *** –0.18 *** 0.00 –0.19 *** –0.75 *** –0.22 *** 0.44 ***
Common colonizer 0.05 0.55 *** –0.15 ** 0.52 *** –0.20 ** 0.57 *** –0.34 *** 0.60 ***
Colony 0.01 0.04 0.44 *** 0.49 *** 0.37 *** 0.41 *** 0.40 *** 0.47 ***
Ever a colony 1.53 *** 1.37 *** 1.30 *** 1.21 *** 1.54 *** 1.31 *** 1.68 *** 1.38 ***
Common country 0.37 0.74 0.19 0.43 0.27 0.48 0.28 0.34
Currency union 0.69 *** 0.55 *** 0.40 *** 0.24 ** 0.39 *** 0.26 ** 0.40 *** 0.31 **
GSP 0.06 *** 0.02 0.05 *** 0.02 0.07 *** 0.03 * 0.04 * 0.04 **
Andean Community 0.35 *** 0.36 *** 0.15 0.23 ** 0.13 0.24 ** 0.13 0.32 **
Andean Community_m –0.31 *** –0.21 *** –0.22 *** –0.35 *** –0.23 *** –0.34 *** –0.29 *** –0.37 ***
Andean Community_x –0.34 *** –0.21 *** 0.01 0.47 *** –0.02 0.40 *** 0.10 ** 0.41 ***
ANZCERTA 0.61 * 0.63 ** –0.46 –0.40 –0.03 0.04 0.04 0.07
ANZCERTA_m 0.18 *** 0.24 *** 0.44 *** 0.55 *** 0.16 *** 0.23 *** 0.14 ** 0.21 ***
ANZCERTA_x –0.31 *** –0.31 *** –0.35 *** –0.40 *** –0.23 *** –0.3 *** –0.33 *** –0.39 ***
Armenia-Russia –1.10 0.03 –1.22 0.02 –0.81 0.39 –0.64 0.44
Armenia-Russia_m 0.00 2.08 *** –0.1 –1.43 *** –0.67 *** 1.55 *** –1.04 *** –0.96 ***
Armenia-Russia_x 0.39 –6.46 *** 0.58 * 0.48 1.10 *** –6.04 *** 1.25 *** –0.53
ASEAN –0.63 *** –0.60 *** –0.54 *** –0.57 *** –0.68 *** –0.68 *** –0.91 *** –0.90 ***
ASEAN_m 0.34 *** 0.42 *** 0.41 *** 0.51 *** 0.42 *** 0.52 *** 0.51 *** 0.59 ***
ASEAN_x 0.51 *** 0.54 *** 0.79 *** 0.79 *** 1.13 *** 1.14 *** 1.12 *** 1.12 ***
BKA –0.82 *** –0.67 *** –0.57 *** –0.60 *** –0.43 ** –0.47 *** –0.39 * –0.55 ***
BKA_m 0.41 *** 0.69 *** 0.49 *** 0.86 *** 0.54 *** 0.87 *** 0.71 *** 0.98 ***
BKA_x 0.26 *** 0.37 *** 0.31 *** 0.32 *** 0.49 *** 0.51 *** 0.44 *** 0.46 ***
Bulgaria-Turkey 0.42 0.16 0.76 0.45 0.53 0.23 0.41 0.12
Bulgaria-Turkey_m 0.66 *** 0.52 *** 0.62 *** 0.50 *** 0.68 *** 0.53 *** 0.67 *** 0.56 ***
Table 9 Random effects (RE) estimates for total merchandise trade and trade in manufactures using truncated and censored data, without and and import country fixed effects, and 46 WTO-compiled PTAs, 1970–99
Censored (RE)
withexport
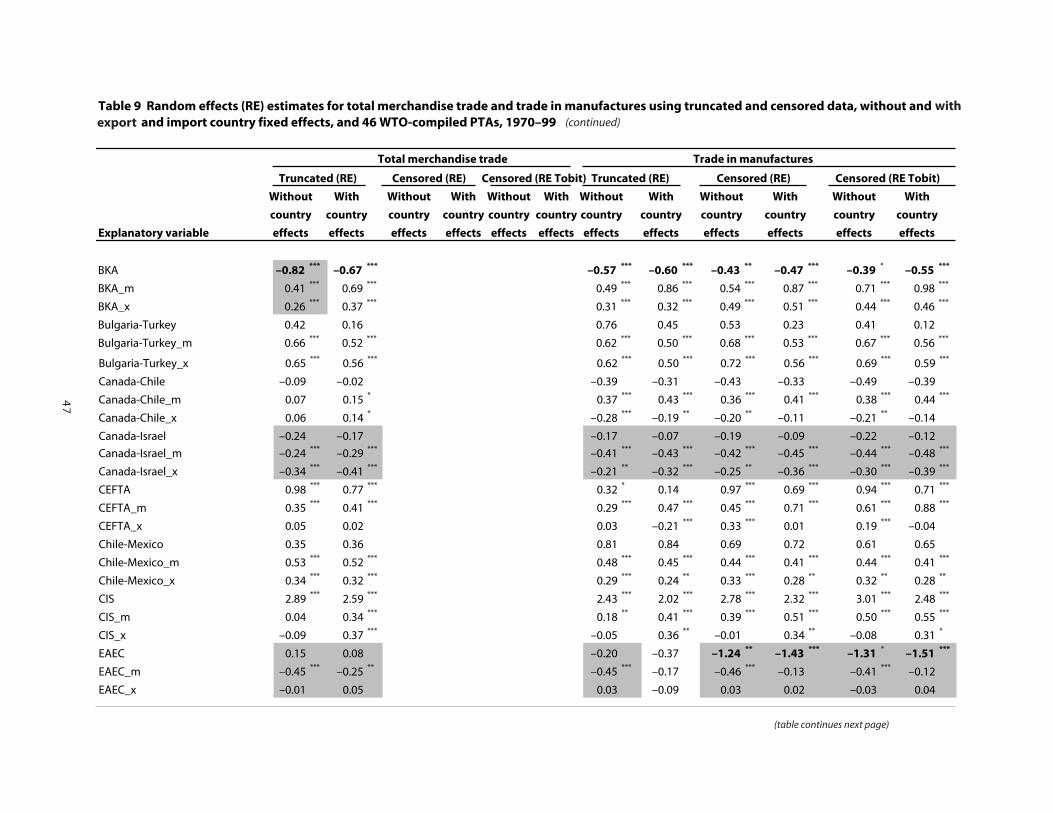
��
(table continues next page)
(continued)
Total merchandise trade Trade in manufactures
Truncated (RE) Censored (RE Tobit) Truncated (RE) Censored (RE) Censored (RE Tobit)
Without With Without With Without With Without With Without With Without With
country country country country country country country country country country country country
Explanatory variable effects effects effects effects effects effects effects effects effects effects effects effects
Distance –1.03 *** –1.17 *** Censored regressions for total trade –1.12 *** –1.33 *** –1.24 *** –1.41 *** –1.38 *** –1.52 ***
Joint GDP 0.83 *** 0.92 *** not supported by dataset 0.92 *** 1.02 *** 0.95 *** 0.79 *** 1.01 *** 0.96 ***
Joint GDP per capita –0.02 ** –0.35 *** –0.09 *** –0.45 *** –0.05 *** –0.16 *** –0.13 *** –0.29 ***
Common language 0.46 *** 0.37 *** 0.53 *** 0.53 *** 0.58 *** 0.58 *** 0.65 *** 0.68 ***
Common border 0.53 *** 0.39 *** 0.55 *** 0.34 *** 0.51 *** 0.31 *** 0.49 *** 0.27 ***
Landlocked –0.42 *** –2.11 *** –0.16 *** –0.52 –0.26 *** –1.52 *** –0.34 *** 1.97 ***
Island 0.37 *** –6.80 *** 0.35 *** 1.24 *** 0.41 *** 1.46 *** 0.51 *** 3.25 ***
Land area –0.10 *** –0.86 *** –0.18 *** 0.00 –0.19 *** –0.75 *** –0.22 *** 0.44 ***
Common colonizer 0.05 0.55 *** –0.15 ** 0.52 *** –0.20 ** 0.57 *** –0.34 *** 0.60 ***
Colony 0.01 0.04 0.44 *** 0.49 *** 0.37 *** 0.41 *** 0.40 *** 0.47 ***
Ever a colony 1.53 *** 1.37 *** 1.30 *** 1.21 *** 1.54 *** 1.31 *** 1.68 *** 1.38 ***
Common country 0.37 0.74 0.19 0.43 0.27 0.48 0.28 0.34
Currency union 0.69 *** 0.55 *** 0.40 *** 0.24 ** 0.39 *** 0.26 ** 0.40 *** 0.31 **
GSP 0.06 *** 0.02 0.05 *** 0.02 0.07 *** 0.03 * 0.04 * 0.04 **
Andean Community 0.35 *** 0.36 *** 0.15 0.23 ** 0.13 0.24 ** 0.13 0.32 **
Andean Community_m –0.31 *** –0.21 *** –0.22 *** –0.35 *** –0.23 *** –0.34 *** –0.29 *** –0.37 ***
Andean Community_x –0.34 *** –0.21 *** 0.01 0.47 *** –0.02 0.40 *** 0.10 ** 0.41 ***
ANZCERTA 0.61 * 0.63 ** –0.46 –0.40 –0.03 0.04 0.04 0.07
ANZCERTA_m 0.18 *** 0.24 *** 0.44 *** 0.55 *** 0.16 *** 0.23 *** 0.14 ** 0.21 ***
ANZCERTA_x –0.31 *** –0.31 *** –0.35 *** –0.40 *** –0.23 *** –0.3 *** –0.33 *** –0.39 ***
Armenia-Russia –1.10 0.03 –1.22 0.02 –0.81 0.39 –0.64 0.44
Armenia-Russia_m 0.00 2.08 *** –0.1 –1.43 *** –0.67 *** 1.55 *** –1.04 *** –0.96 ***
Armenia-Russia_x 0.39 –6.46 *** 0.58 * 0.48 1.10 *** –6.04 *** 1.25 *** –0.53
ASEAN –0.63 *** –0.60 *** –0.54 *** –0.57 *** –0.68 *** –0.68 *** –0.91 *** –0.90 ***
ASEAN_m 0.34 *** 0.42 *** 0.41 *** 0.51 *** 0.42 *** 0.52 *** 0.51 *** 0.59 ***
ASEAN_x 0.51 *** 0.54 *** 0.79 *** 0.79 *** 1.13 *** 1.14 *** 1.12 *** 1.12 ***
BKA –0.82 *** –0.67 *** –0.57 *** –0.60 *** –0.43 ** –0.47 *** –0.39 * –0.55 ***
BKA_m 0.41 *** 0.69 *** 0.49 *** 0.86 *** 0.54 *** 0.87 *** 0.71 *** 0.98 ***
BKA_x 0.26 *** 0.37 *** 0.31 *** 0.32 *** 0.49 *** 0.51 *** 0.44 *** 0.46 ***
Bulgaria-Turkey 0.42 0.16 0.76 0.45 0.53 0.23 0.41 0.12
Bulgaria-Turkey_m 0.66 *** 0.52 *** 0.62 *** 0.50 *** 0.68 *** 0.53 *** 0.67 *** 0.56 ***
Table 9 Random effects (RE) estimates for total merchandise trade and trade in manufactures using truncated and censored data, without and and import country fixed effects, and 46 WTO-compiled PTAs, 1970–99
Censored (RE)
Bulgaria-Turkey_x 0.65 *** 0.56 *** 0.62 *** 0.50 *** 0.72 *** 0.56 *** 0.69 *** 0.59 ***
Canada-Chile –0.09 –0.02 –0.39 –0.31 –0.43 –0.33 –0.49 –0.39
Canada-Chile_m 0.07 0.15 * 0.37 *** 0.43 *** 0.36 *** 0.41 *** 0.38 *** 0.44 ***
Canada-Chile_x 0.06 0.14 * –0.28 *** –0.19 ** –0.20 ** –0.11 –0.21 ** –0.14
Canada-Israel –0.24 –0.17 –0.17 –0.07 –0.19 –0.09 –0.22 –0.12
Canada-Israel_m –0.24 *** –0.29 *** –0.41 *** –0.43 *** –0.42 *** –0.45 *** –0.44 *** –0.48 ***
Canada-Israel_x –0.34 *** –0.41 *** –0.21 ** –0.32 *** –0.25 ** –0.36 *** –0.30 *** –0.39 ***
CEFTA 0.98 *** 0.77 *** 0.32 * 0.14 0.97 *** 0.69 *** 0.94 *** 0.71 ***
CEFTA_m 0.35 *** 0.41 *** 0.29 *** 0.47 *** 0.45 *** 0.71 *** 0.61 *** 0.88 ***
CEFTA_x 0.05 0.02 0.03 –0.21 *** 0.33 *** 0.01 0.19 *** –0.04
Chile-Mexico 0.35 0.36 0.81 0.84 0.69 0.72 0.61 0.65
Chile-Mexico_m 0.53 *** 0.52 *** 0.48 *** 0.45 *** 0.44 *** 0.41 *** 0.44 *** 0.41 ***
Chile-Mexico_x 0.34 *** 0.32 *** 0.29 *** 0.24 ** 0.33 *** 0.28 ** 0.32 ** 0.28 **
CIS 2.89 *** 2.59 *** 2.43 *** 2.02 *** 2.78 *** 2.32 *** 3.01 *** 2.48 ***
CIS_m 0.04 0.34 *** 0.18 ** 0.41 *** 0.39 *** 0.51 *** 0.50 *** 0.55 ***
CIS_x –0.09 0.37 *** –0.05 0.36 ** –0.01 0.34 ** –0.08 0.31 *
EAEC 0.15 0.08 –0.20 –0.37 –1.24 ** –1.43 *** –1.31 * –1.51 ***
EAEC_m –0.45 *** –0.25 ** –0.45 *** –0.17 –0.46 *** –0.13 –0.41 *** –0.12
EAEC_x –0.01 0.05 0.03 –0.09 0.03 0.02 –0.03 0.04
EFTA 0.04 0.01 0.18 ** 0.14 * 0.04 0.03 0.03 0.04
EFTA_m 0.31 *** 0.12 *** 0.02 0.14 *** 0.03 0.09 *** 0.04 0.07 *
EFTA_x 0.59 *** 0.45 *** 0.88 *** 0.52 *** 0.85 *** 0.48 *** 0.78 *** 0.50 ***
EFTA-Bulgaria 0.58 ** 0.55 ** 0.20 0.21 0.52 * 0.47 * 0.59 * 0.57 *
EFTA-Bulgaria_m –0.67 *** –0.63 *** –0.73 *** –0.73 *** –0.87 *** –0.94 *** –0.99 *** –1.05 ***
EFTA-Bulgaria_x –0.67 *** –0.60 *** –1.06 *** –0.87 *** –1.39 *** –1.23 *** –1.3 *** –1.2 ***
EFTA-Israel –0.52 *** –0.48 ** –0.40 * –0.36 * –0.16 –0.10 –0.16 –0.10
EFTA-Israel_m 0.42 *** 0.51 *** 0.52 *** 0.59 *** 0.32 *** 0.44 *** 0.36 *** 0.46 ***
EFTA-Israel_x 0.34 *** 0.37 *** 0.22 *** 0.23 *** 0.17 ** 0.21 *** 0.07 0.10
EFTA-Romania 0.33 * 0.34 * 0.11 0.10 0.08 0.06 0.12 0.09
EFTA-Romania_m –0.49 *** –0.59 *** –0.21 ** –0.31 *** –0.11 –0.22 ** –0.13 –0.21 *
EFTA-Romania_x –0.36 *** –0.44 *** –0.38 *** –0.55 *** –0.25 ** –0.44 *** –0.34 *** –0.46 ***
EFTA-Turkey –0.27 * –0.3 * –0.24 –0.30 * –0.34 * –0.35 * –0.44 ** –0.45 **
EFTA-Turkey_m 0.50 *** 0.58 *** 0.49 *** 0.57 *** 0.52 *** 0.60 *** 0.62 *** 0.69 ***
EFTA-Turkey_x 0.48 *** 0.53 *** 0.70 *** 0.77 *** 1.03 *** 1.09 *** 1.09 *** 1.13 ***
European Union –0.19 –0.29 * 0.38 ** 0.30 * 0.36 ** 0.30 * 0.35 * 0.26
European Union_m 0.45 *** 0.22 *** 0.09 ** 0.28 *** 0.00 0.11 ** 0.17 *** 0.26 ***
European Union_x 0.67 *** 0.49 *** 1.07 *** 0.66 *** 0.92 *** 0.51 *** 0.90 *** 0.60 ***
EU-Algeria –0.03 –0.04 –0.34 * –0.34 * –0.36 * –0.34 * –0.40 * –0.38 *
EU-Algeria_m 0.07 0.10 ** 0.19 *** 0.22 *** 0.20 *** 0.24 *** 0.24 *** 0.27 ***
EU-Algeria_x –0.06 –0.03 0.01 0.05 –0.05 0.00 –0.05 –0.02
withexport

��
(table continues next page)
(continued)
Total merchandise trade Trade in manufactures
Truncated (RE) Censored (RE Tobit) Truncated (RE) Censored (RE) Censored (RE Tobit)
Without With Without With Without With Without With Without With Without With
country country country country country country country country country country country country
Explanatory variable effects effects effects effects effects effects effects effects effects effects effects effects
Distance –1.03 *** –1.17 *** Censored regressions for total trade –1.12 *** –1.33 *** –1.24 *** –1.41 *** –1.38 *** –1.52 ***
Joint GDP 0.83 *** 0.92 *** not supported by dataset 0.92 *** 1.02 *** 0.95 *** 0.79 *** 1.01 *** 0.96 ***
Joint GDP per capita –0.02 ** –0.35 *** –0.09 *** –0.45 *** –0.05 *** –0.16 *** –0.13 *** –0.29 ***
Common language 0.46 *** 0.37 *** 0.53 *** 0.53 *** 0.58 *** 0.58 *** 0.65 *** 0.68 ***
Common border 0.53 *** 0.39 *** 0.55 *** 0.34 *** 0.51 *** 0.31 *** 0.49 *** 0.27 ***
Landlocked –0.42 *** –2.11 *** –0.16 *** –0.52 –0.26 *** –1.52 *** –0.34 *** 1.97 ***
Island 0.37 *** –6.80 *** 0.35 *** 1.24 *** 0.41 *** 1.46 *** 0.51 *** 3.25 ***
Land area –0.10 *** –0.86 *** –0.18 *** 0.00 –0.19 *** –0.75 *** –0.22 *** 0.44 ***
Common colonizer 0.05 0.55 *** –0.15 ** 0.52 *** –0.20 ** 0.57 *** –0.34 *** 0.60 ***
Colony 0.01 0.04 0.44 *** 0.49 *** 0.37 *** 0.41 *** 0.40 *** 0.47 ***
Ever a colony 1.53 *** 1.37 *** 1.30 *** 1.21 *** 1.54 *** 1.31 *** 1.68 *** 1.38 ***
Common country 0.37 0.74 0.19 0.43 0.27 0.48 0.28 0.34
Currency union 0.69 *** 0.55 *** 0.40 *** 0.24 ** 0.39 *** 0.26 ** 0.40 *** 0.31 **
GSP 0.06 *** 0.02 0.05 *** 0.02 0.07 *** 0.03 * 0.04 * 0.04 **
Andean Community 0.35 *** 0.36 *** 0.15 0.23 ** 0.13 0.24 ** 0.13 0.32 **
Andean Community_m –0.31 *** –0.21 *** –0.22 *** –0.35 *** –0.23 *** –0.34 *** –0.29 *** –0.37 ***
Andean Community_x –0.34 *** –0.21 *** 0.01 0.47 *** –0.02 0.40 *** 0.10 ** 0.41 ***
ANZCERTA 0.61 * 0.63 ** –0.46 –0.40 –0.03 0.04 0.04 0.07
ANZCERTA_m 0.18 *** 0.24 *** 0.44 *** 0.55 *** 0.16 *** 0.23 *** 0.14 ** 0.21 ***
ANZCERTA_x –0.31 *** –0.31 *** –0.35 *** –0.40 *** –0.23 *** –0.3 *** –0.33 *** –0.39 ***
Armenia-Russia –1.10 0.03 –1.22 0.02 –0.81 0.39 –0.64 0.44
Armenia-Russia_m 0.00 2.08 *** –0.1 –1.43 *** –0.67 *** 1.55 *** –1.04 *** –0.96 ***
Armenia-Russia_x 0.39 –6.46 *** 0.58 * 0.48 1.10 *** –6.04 *** 1.25 *** –0.53
ASEAN –0.63 *** –0.60 *** –0.54 *** –0.57 *** –0.68 *** –0.68 *** –0.91 *** –0.90 ***
ASEAN_m 0.34 *** 0.42 *** 0.41 *** 0.51 *** 0.42 *** 0.52 *** 0.51 *** 0.59 ***
ASEAN_x 0.51 *** 0.54 *** 0.79 *** 0.79 *** 1.13 *** 1.14 *** 1.12 *** 1.12 ***
BKA –0.82 *** –0.67 *** –0.57 *** –0.60 *** –0.43 ** –0.47 *** –0.39 * –0.55 ***
BKA_m 0.41 *** 0.69 *** 0.49 *** 0.86 *** 0.54 *** 0.87 *** 0.71 *** 0.98 ***
BKA_x 0.26 *** 0.37 *** 0.31 *** 0.32 *** 0.49 *** 0.51 *** 0.44 *** 0.46 ***
Bulgaria-Turkey 0.42 0.16 0.76 0.45 0.53 0.23 0.41 0.12
Bulgaria-Turkey_m 0.66 *** 0.52 *** 0.62 *** 0.50 *** 0.68 *** 0.53 *** 0.67 *** 0.56 ***
Table 9 Random effects (RE) estimates for total merchandise trade and trade in manufactures using truncated and censored data, without and and import country fixed effects, and 46 WTO-compiled PTAs, 1970–99
Censored (RE)
Bulgaria-Turkey_x 0.65 *** 0.56 *** 0.62 *** 0.50 *** 0.72 *** 0.56 *** 0.69 *** 0.59 ***
Canada-Chile –0.09 –0.02 –0.39 –0.31 –0.43 –0.33 –0.49 –0.39
Canada-Chile_m 0.07 0.15 * 0.37 *** 0.43 *** 0.36 *** 0.41 *** 0.38 *** 0.44 ***
Canada-Chile_x 0.06 0.14 * –0.28 *** –0.19 ** –0.20 ** –0.11 –0.21 ** –0.14
Canada-Israel –0.24 –0.17 –0.17 –0.07 –0.19 –0.09 –0.22 –0.12
Canada-Israel_m –0.24 *** –0.29 *** –0.41 *** –0.43 *** –0.42 *** –0.45 *** –0.44 *** –0.48 ***
Canada-Israel_x –0.34 *** –0.41 *** –0.21 ** –0.32 *** –0.25 ** –0.36 *** –0.30 *** –0.39 ***
CEFTA 0.98 *** 0.77 *** 0.32 * 0.14 0.97 *** 0.69 *** 0.94 *** 0.71 ***
CEFTA_m 0.35 *** 0.41 *** 0.29 *** 0.47 *** 0.45 *** 0.71 *** 0.61 *** 0.88 ***
CEFTA_x 0.05 0.02 0.03 –0.21 *** 0.33 *** 0.01 0.19 *** –0.04
Chile-Mexico 0.35 0.36 0.81 0.84 0.69 0.72 0.61 0.65
Chile-Mexico_m 0.53 *** 0.52 *** 0.48 *** 0.45 *** 0.44 *** 0.41 *** 0.44 *** 0.41 ***
Chile-Mexico_x 0.34 *** 0.32 *** 0.29 *** 0.24 ** 0.33 *** 0.28 ** 0.32 ** 0.28 **
CIS 2.89 *** 2.59 *** 2.43 *** 2.02 *** 2.78 *** 2.32 *** 3.01 *** 2.48 ***
CIS_m 0.04 0.34 *** 0.18 ** 0.41 *** 0.39 *** 0.51 *** 0.50 *** 0.55 ***
CIS_x –0.09 0.37 *** –0.05 0.36 ** –0.01 0.34 ** –0.08 0.31 *
EAEC 0.15 0.08 –0.20 –0.37 –1.24 ** –1.43 *** –1.31 * –1.51 ***
EAEC_m –0.45 *** –0.25 ** –0.45 *** –0.17 –0.46 *** –0.13 –0.41 *** –0.12
EAEC_x –0.01 0.05 0.03 –0.09 0.03 0.02 –0.03 0.04
EFTA 0.04 0.01 0.18 ** 0.14 * 0.04 0.03 0.03 0.04
EFTA_m 0.31 *** 0.12 *** 0.02 0.14 *** 0.03 0.09 *** 0.04 0.07 *
EFTA_x 0.59 *** 0.45 *** 0.88 *** 0.52 *** 0.85 *** 0.48 *** 0.78 *** 0.50 ***
EFTA-Bulgaria 0.58 ** 0.55 ** 0.20 0.21 0.52 * 0.47 * 0.59 * 0.57 *
EFTA-Bulgaria_m –0.67 *** –0.63 *** –0.73 *** –0.73 *** –0.87 *** –0.94 *** –0.99 *** –1.05 ***
EFTA-Bulgaria_x –0.67 *** –0.60 *** –1.06 *** –0.87 *** –1.39 *** –1.23 *** –1.3 *** –1.2 ***
EFTA-Israel –0.52 *** –0.48 ** –0.40 * –0.36 * –0.16 –0.10 –0.16 –0.10
EFTA-Israel_m 0.42 *** 0.51 *** 0.52 *** 0.59 *** 0.32 *** 0.44 *** 0.36 *** 0.46 ***
EFTA-Israel_x 0.34 *** 0.37 *** 0.22 *** 0.23 *** 0.17 ** 0.21 *** 0.07 0.10
EFTA-Romania 0.33 * 0.34 * 0.11 0.10 0.08 0.06 0.12 0.09
EFTA-Romania_m –0.49 *** –0.59 *** –0.21 ** –0.31 *** –0.11 –0.22 ** –0.13 –0.21 *
EFTA-Romania_x –0.36 *** –0.44 *** –0.38 *** –0.55 *** –0.25 ** –0.44 *** –0.34 *** –0.46 ***
EFTA-Turkey –0.27 * –0.3 * –0.24 –0.30 * –0.34 * –0.35 * –0.44 ** –0.45 **
EFTA-Turkey_m 0.50 *** 0.58 *** 0.49 *** 0.57 *** 0.52 *** 0.60 *** 0.62 *** 0.69 ***
EFTA-Turkey_x 0.48 *** 0.53 *** 0.70 *** 0.77 *** 1.03 *** 1.09 *** 1.09 *** 1.13 ***
European Union –0.19 –0.29 * 0.38 ** 0.30 * 0.36 ** 0.30 * 0.35 * 0.26
European Union_m 0.45 *** 0.22 *** 0.09 ** 0.28 *** 0.00 0.11 ** 0.17 *** 0.26 ***
European Union_x 0.67 *** 0.49 *** 1.07 *** 0.66 *** 0.92 *** 0.51 *** 0.90 *** 0.60 ***
EU-Algeria –0.03 –0.04 –0.34 * –0.34 * –0.36 * –0.34 * –0.40 * –0.38 *
EU-Algeria_m 0.07 0.10 ** 0.19 *** 0.22 *** 0.20 *** 0.24 *** 0.24 *** 0.27 ***
EU-Algeria_x –0.06 –0.03 0.01 0.05 –0.05 0.00 –0.05 –0.02
EU-Bulgaria 0.23 *** 0.23 *** 0.25 *** 0.25 *** 0.30 *** 0.28 *** 0.35 *** 0.34 ***
EU-Bulgaria_m –0.04 –0.03 0.01 –0.01 0.01 –0.01 –0.01 –0.02
EU-Bulgaria_x –0.06 –0.05 –0.05 –0.03 –0.02 –0.02 –0.06 –0.05
EU-Iceland 0.00 0.03 –0.10 –0.12 –0.21 * –0.20 * –0.30 ** –0.26 **
EU-Iceland_m 0.06 0.31 *** 0.02 –0.01 0.11 0.14 0.17 * 0.25 **
EU-Iceland_x –0.22 *** 0.14 * –0.12 0.54 *** –0.23 *** 0.38 *** 0.07 0.55 ***
EU-Norway 0.18 * 0.17 * –0.05 –0.05 0.05 0.03 0.04 0.03
EU-Norway_m –0.08 –0.14 ** 0.07 0.02 –0.01 –0.07 –0.06 –0.16 *
EU-Norway_x –0.22 *** –0.22 *** –0.26 *** –0.44 *** –0.21 *** –0.37 *** –0.35 *** –0.51 ***
EU-Romania 0.26 *** 0.31 *** 0.10 0.16 ** 0.04 0.09 0.05 0.10
EU-Romania_m –0.22 *** –0.20 *** –0.02 –0.02 –0.04 –0.04 –0.07 –0.06
EU-Romania_x –0.11 *** –0.10 *** –0.29 *** –0.26 *** –0.18 *** –0.16 *** –0.20 *** –0.19 ***
EU-Switzerland 0.01 –0.04 –0.15 –0.23 ** –0.06 –0.20 * –0.04 –0.23 *
EU-Switzerland_m 0.07 –0.09 0.12 ** 0.20 *** 0.15 ** 0.18 ** 0.12 0.13
EU-Switzerland_x 0.33 *** –0.01 0.32 *** –0.19 *** 0.53 *** 0.03 0.29 *** –0.07
EU-Syria 0.31 * 0.36 ** 0.28 0.34 ** 0.42 ** 0.47 ** 0.50 ** 0.56 ***
EU-Syria_m –0.20 *** –0.19 *** –0.03 –0.05 –0.09 * –0.12 ** –0.15 *** –0.17 ***
EU-Syria_x 0.00 0.00 –0.31 *** –0.29 *** –0.16 *** –0.15 *** –0.17 *** –0.16 ***
EU-Tunisia –0.14 –0.09 –0.15 * –0.12 –0.19 ** –0.15 –0.19 * –0.16
EU-Tunisia_m –0.42 *** –0.29 *** –0.4 *** –0.23 *** –0.43 *** –0.27 *** –0.42 *** –0.28 ***
EU-Tunisia_x –0.45 *** –0.32 *** –0.46 *** –0.34 *** –0.48 *** –0.35 *** –0.46 *** –0.36 ***
EU-Turkey –0.19 ** –0.17 ** –0.17 ** –0.16 ** –0.28 *** –0.26 *** –0.34 *** –0.32 ***
EU-Turkey_m –0.01 –0.02 –0.02 –0.01 0.01 0.00 0.02 0.01
EU-Turkey_x 0.06 * 0.04 0.13 *** 0.09 *** 0.13 *** 0.08 ** 0.10 ** 0.07 *
GCC 0.35 *** 0.29 *** –0.98 *** –1.01 *** –0.83 *** –0.80 *** –1.11 *** –0.99 ***
GCC_m 0.33 *** 0.16 *** 0.03 –0.20 *** 0.04 –0.07 ** –0.03 –0.16 ***
GCC_x 0.00 –0.17 *** 1.77 *** 1.84 *** 1.99 *** 2.11 *** 2.30 *** 2.31 ***
Georgia-Kazakhstan –1.05 –1.03 –0.15 –0.16 –0.23 –0.21 –0.18 –0.16
Georgia-Kazakhstan_m 0.29 ** 0.26 * 0.30 ** 0.24 * 0.35 ** 0.27 * 0.35 ** 0.28
Georgia-Kazakhstan_x 0.26 * 0.32 ** –0.09 –0.03 0.06 0.10 0.09 0.09
Georgia-Russia –1.18 –0.16 –1.29 0.09 –0.90 0.52 –1.02 0.65
Georgia-Russia_m 0.24 0.60 ** 0.31 * 0.86 *** 0.16 0.78 *** 0.24 0.78 ***
Georgia-Russia_x –0.36 * –0.42 0.16 0.35 0.16 0.46 0.29 0.57
GSTP 0.18 *** 0.15 *** 0.20 *** 0.16 *** 0.20 *** 0.16 *** 0.24 *** 0.20 ***
GSTP_m 0.06 *** 0.06 *** –0.09 *** –0.10 *** –0.05 ** –0.04 ** –0.05 ** –0.04 *
GSTP_x 0.06 *** 0.06 *** 0.30 *** 0.35 *** 0.26 *** 0.32 *** 0.29 *** 0.32 ***
Israel-Turkey –0.08 –0.19 0.29 0.15 0.12 0.02 –0.07 –0.15
Israel-Turkey_m 0.00 0.14 –0.05 0.09 –0.07 0.05 –0.02 0.07
Israel-Turkey_x 0.30 *** 0.44 *** 0.34 *** 0.48 *** 0.42 *** 0.57 *** 0.46 *** 0.57 ***
Kyrgyz Republic–Kazakhstan 0.20 0.72 0.23 0.83 1.49 1.87 * 1.89 2.02 *
withexport

��
(table continues next page)
(continued)
Total merchandise trade Trade in manufactures
Truncated (RE) Censored (RE Tobit) Truncated (RE) Censored (RE) Censored (RE Tobit)
Without With Without With Without With Without With Without With Without With
country country country country country country country country country country country country
Explanatory variable effects effects effects effects effects effects effects effects effects effects effects effects
Distance –1.03 *** –1.17 *** Censored regressions for total trade –1.12 *** –1.33 *** –1.24 *** –1.41 *** –1.38 *** –1.52 ***
Joint GDP 0.83 *** 0.92 *** not supported by dataset 0.92 *** 1.02 *** 0.95 *** 0.79 *** 1.01 *** 0.96 ***
Joint GDP per capita –0.02 ** –0.35 *** –0.09 *** –0.45 *** –0.05 *** –0.16 *** –0.13 *** –0.29 ***
Common language 0.46 *** 0.37 *** 0.53 *** 0.53 *** 0.58 *** 0.58 *** 0.65 *** 0.68 ***
Common border 0.53 *** 0.39 *** 0.55 *** 0.34 *** 0.51 *** 0.31 *** 0.49 *** 0.27 ***
Landlocked –0.42 *** –2.11 *** –0.16 *** –0.52 –0.26 *** –1.52 *** –0.34 *** 1.97 ***
Island 0.37 *** –6.80 *** 0.35 *** 1.24 *** 0.41 *** 1.46 *** 0.51 *** 3.25 ***
Land area –0.10 *** –0.86 *** –0.18 *** 0.00 –0.19 *** –0.75 *** –0.22 *** 0.44 ***
Common colonizer 0.05 0.55 *** –0.15 ** 0.52 *** –0.20 ** 0.57 *** –0.34 *** 0.60 ***
Colony 0.01 0.04 0.44 *** 0.49 *** 0.37 *** 0.41 *** 0.40 *** 0.47 ***
Ever a colony 1.53 *** 1.37 *** 1.30 *** 1.21 *** 1.54 *** 1.31 *** 1.68 *** 1.38 ***
Common country 0.37 0.74 0.19 0.43 0.27 0.48 0.28 0.34
Currency union 0.69 *** 0.55 *** 0.40 *** 0.24 ** 0.39 *** 0.26 ** 0.40 *** 0.31 **
GSP 0.06 *** 0.02 0.05 *** 0.02 0.07 *** 0.03 * 0.04 * 0.04 **
Andean Community 0.35 *** 0.36 *** 0.15 0.23 ** 0.13 0.24 ** 0.13 0.32 **
Andean Community_m –0.31 *** –0.21 *** –0.22 *** –0.35 *** –0.23 *** –0.34 *** –0.29 *** –0.37 ***
Andean Community_x –0.34 *** –0.21 *** 0.01 0.47 *** –0.02 0.40 *** 0.10 ** 0.41 ***
ANZCERTA 0.61 * 0.63 ** –0.46 –0.40 –0.03 0.04 0.04 0.07
ANZCERTA_m 0.18 *** 0.24 *** 0.44 *** 0.55 *** 0.16 *** 0.23 *** 0.14 ** 0.21 ***
ANZCERTA_x –0.31 *** –0.31 *** –0.35 *** –0.40 *** –0.23 *** –0.3 *** –0.33 *** –0.39 ***
Armenia-Russia –1.10 0.03 –1.22 0.02 –0.81 0.39 –0.64 0.44
Armenia-Russia_m 0.00 2.08 *** –0.1 –1.43 *** –0.67 *** 1.55 *** –1.04 *** –0.96 ***
Armenia-Russia_x 0.39 –6.46 *** 0.58 * 0.48 1.10 *** –6.04 *** 1.25 *** –0.53
ASEAN –0.63 *** –0.60 *** –0.54 *** –0.57 *** –0.68 *** –0.68 *** –0.91 *** –0.90 ***
ASEAN_m 0.34 *** 0.42 *** 0.41 *** 0.51 *** 0.42 *** 0.52 *** 0.51 *** 0.59 ***
ASEAN_x 0.51 *** 0.54 *** 0.79 *** 0.79 *** 1.13 *** 1.14 *** 1.12 *** 1.12 ***
BKA –0.82 *** –0.67 *** –0.57 *** –0.60 *** –0.43 ** –0.47 *** –0.39 * –0.55 ***
BKA_m 0.41 *** 0.69 *** 0.49 *** 0.86 *** 0.54 *** 0.87 *** 0.71 *** 0.98 ***
BKA_x 0.26 *** 0.37 *** 0.31 *** 0.32 *** 0.49 *** 0.51 *** 0.44 *** 0.46 ***
Bulgaria-Turkey 0.42 0.16 0.76 0.45 0.53 0.23 0.41 0.12
Bulgaria-Turkey_m 0.66 *** 0.52 *** 0.62 *** 0.50 *** 0.68 *** 0.53 *** 0.67 *** 0.56 ***
Table 9 Random effects (RE) estimates for total merchandise trade and trade in manufactures using truncated and censored data, without and and import country fixed effects, and 46 WTO-compiled PTAs, 1970–99
Censored (RE)
EU-Bulgaria 0.23 *** 0.23 *** 0.25 *** 0.25 *** 0.30 *** 0.28 *** 0.35 *** 0.34 ***
EU-Bulgaria_m –0.04 –0.03 0.01 –0.01 0.01 –0.01 –0.01 –0.02
EU-Bulgaria_x –0.06 –0.05 –0.05 –0.03 –0.02 –0.02 –0.06 –0.05
EU-Iceland 0.00 0.03 –0.10 –0.12 –0.21 * –0.20 * –0.30 ** –0.26 **
EU-Iceland_m 0.06 0.31 *** 0.02 –0.01 0.11 0.14 0.17 * 0.25 **
EU-Iceland_x –0.22 *** 0.14 * –0.12 0.54 *** –0.23 *** 0.38 *** 0.07 0.55 ***
EU-Norway 0.18 * 0.17 * –0.05 –0.05 0.05 0.03 0.04 0.03
EU-Norway_m –0.08 –0.14 ** 0.07 0.02 –0.01 –0.07 –0.06 –0.16 *
EU-Norway_x –0.22 *** –0.22 *** –0.26 *** –0.44 *** –0.21 *** –0.37 *** –0.35 *** –0.51 ***
EU-Romania 0.26 *** 0.31 *** 0.10 0.16 ** 0.04 0.09 0.05 0.10
EU-Romania_m –0.22 *** –0.20 *** –0.02 –0.02 –0.04 –0.04 –0.07 –0.06
EU-Romania_x –0.11 *** –0.10 *** –0.29 *** –0.26 *** –0.18 *** –0.16 *** –0.20 *** –0.19 ***
EU-Switzerland 0.01 –0.04 –0.15 –0.23 ** –0.06 –0.20 * –0.04 –0.23 *
EU-Switzerland_m 0.07 –0.09 0.12 ** 0.20 *** 0.15 ** 0.18 ** 0.12 0.13
EU-Switzerland_x 0.33 *** –0.01 0.32 *** –0.19 *** 0.53 *** 0.03 0.29 *** –0.07
EU-Syria 0.31 * 0.36 ** 0.28 0.34 ** 0.42 ** 0.47 ** 0.50 ** 0.56 ***
EU-Syria_m –0.20 *** –0.19 *** –0.03 –0.05 –0.09 * –0.12 ** –0.15 *** –0.17 ***
EU-Syria_x 0.00 0.00 –0.31 *** –0.29 *** –0.16 *** –0.15 *** –0.17 *** –0.16 ***
EU-Tunisia –0.14 –0.09 –0.15 * –0.12 –0.19 ** –0.15 –0.19 * –0.16
EU-Tunisia_m –0.42 *** –0.29 *** –0.4 *** –0.23 *** –0.43 *** –0.27 *** –0.42 *** –0.28 ***
EU-Tunisia_x –0.45 *** –0.32 *** –0.46 *** –0.34 *** –0.48 *** –0.35 *** –0.46 *** –0.36 ***
EU-Turkey –0.19 ** –0.17 ** –0.17 ** –0.16 ** –0.28 *** –0.26 *** –0.34 *** –0.32 ***
EU-Turkey_m –0.01 –0.02 –0.02 –0.01 0.01 0.00 0.02 0.01
EU-Turkey_x 0.06 * 0.04 0.13 *** 0.09 *** 0.13 *** 0.08 ** 0.10 ** 0.07 *
GCC 0.35 *** 0.29 *** –0.98 *** –1.01 *** –0.83 *** –0.80 *** –1.11 *** –0.99 ***
GCC_m 0.33 *** 0.16 *** 0.03 –0.20 *** 0.04 –0.07 ** –0.03 –0.16 ***
GCC_x 0.00 –0.17 *** 1.77 *** 1.84 *** 1.99 *** 2.11 *** 2.30 *** 2.31 ***
Georgia-Kazakhstan –1.05 –1.03 –0.15 –0.16 –0.23 –0.21 –0.18 –0.16
Georgia-Kazakhstan_m 0.29 ** 0.26 * 0.30 ** 0.24 * 0.35 ** 0.27 * 0.35 ** 0.28
Georgia-Kazakhstan_x 0.26 * 0.32 ** –0.09 –0.03 0.06 0.10 0.09 0.09
Georgia-Russia –1.18 –0.16 –1.29 0.09 –0.90 0.52 –1.02 0.65
Georgia-Russia_m 0.24 0.60 ** 0.31 * 0.86 *** 0.16 0.78 *** 0.24 0.78 ***
Georgia-Russia_x –0.36 * –0.42 0.16 0.35 0.16 0.46 0.29 0.57
GSTP 0.18 *** 0.15 *** 0.20 *** 0.16 *** 0.20 *** 0.16 *** 0.24 *** 0.20 ***
GSTP_m 0.06 *** 0.06 *** –0.09 *** –0.10 *** –0.05 ** –0.04 ** –0.05 ** –0.04 *
GSTP_x 0.06 *** 0.06 *** 0.30 *** 0.35 *** 0.26 *** 0.32 *** 0.29 *** 0.32 ***
Israel-Turkey –0.08 –0.19 0.29 0.15 0.12 0.02 –0.07 –0.15
Israel-Turkey_m 0.00 0.14 –0.05 0.09 –0.07 0.05 –0.02 0.07
Israel-Turkey_x 0.30 *** 0.44 *** 0.34 *** 0.48 *** 0.42 *** 0.57 *** 0.46 *** 0.57 ***
Kyrgyz Republic–Kazakhstan 0.20 0.72 0.23 0.83 1.49 1.87 * 1.89 2.02 *
withexport

�0
(table continues next page)
(continued)
Total merchandise trade Trade in manufactures
Truncated (RE) Censored (RE Tobit) Truncated (RE) Censored (RE) Censored (RE Tobit)
Without With Without With Without With Without With Without With Without With
country country country country country country country country country country country country
Explanatory variable effects effects effects effects effects effects effects effects effects effects effects effects
Distance –1.03 *** –1.17 *** Censored regressions for total trade –1.12 *** –1.33 *** –1.24 *** –1.41 *** –1.38 *** –1.52 ***
Joint GDP 0.83 *** 0.92 *** not supported by dataset 0.92 *** 1.02 *** 0.95 *** 0.79 *** 1.01 *** 0.96 ***
Joint GDP per capita –0.02 ** –0.35 *** –0.09 *** –0.45 *** –0.05 *** –0.16 *** –0.13 *** –0.29 ***
Common language 0.46 *** 0.37 *** 0.53 *** 0.53 *** 0.58 *** 0.58 *** 0.65 *** 0.68 ***
Common border 0.53 *** 0.39 *** 0.55 *** 0.34 *** 0.51 *** 0.31 *** 0.49 *** 0.27 ***
Landlocked –0.42 *** –2.11 *** –0.16 *** –0.52 –0.26 *** –1.52 *** –0.34 *** 1.97 ***
Island 0.37 *** –6.80 *** 0.35 *** 1.24 *** 0.41 *** 1.46 *** 0.51 *** 3.25 ***
Land area –0.10 *** –0.86 *** –0.18 *** 0.00 –0.19 *** –0.75 *** –0.22 *** 0.44 ***
Common colonizer 0.05 0.55 *** –0.15 ** 0.52 *** –0.20 ** 0.57 *** –0.34 *** 0.60 ***
Colony 0.01 0.04 0.44 *** 0.49 *** 0.37 *** 0.41 *** 0.40 *** 0.47 ***
Ever a colony 1.53 *** 1.37 *** 1.30 *** 1.21 *** 1.54 *** 1.31 *** 1.68 *** 1.38 ***
Common country 0.37 0.74 0.19 0.43 0.27 0.48 0.28 0.34
Currency union 0.69 *** 0.55 *** 0.40 *** 0.24 ** 0.39 *** 0.26 ** 0.40 *** 0.31 **
GSP 0.06 *** 0.02 0.05 *** 0.02 0.07 *** 0.03 * 0.04 * 0.04 **
Andean Community 0.35 *** 0.36 *** 0.15 0.23 ** 0.13 0.24 ** 0.13 0.32 **
Andean Community_m –0.31 *** –0.21 *** –0.22 *** –0.35 *** –0.23 *** –0.34 *** –0.29 *** –0.37 ***
Andean Community_x –0.34 *** –0.21 *** 0.01 0.47 *** –0.02 0.40 *** 0.10 ** 0.41 ***
ANZCERTA 0.61 * 0.63 ** –0.46 –0.40 –0.03 0.04 0.04 0.07
ANZCERTA_m 0.18 *** 0.24 *** 0.44 *** 0.55 *** 0.16 *** 0.23 *** 0.14 ** 0.21 ***
ANZCERTA_x –0.31 *** –0.31 *** –0.35 *** –0.40 *** –0.23 *** –0.3 *** –0.33 *** –0.39 ***
Armenia-Russia –1.10 0.03 –1.22 0.02 –0.81 0.39 –0.64 0.44
Armenia-Russia_m 0.00 2.08 *** –0.1 –1.43 *** –0.67 *** 1.55 *** –1.04 *** –0.96 ***
Armenia-Russia_x 0.39 –6.46 *** 0.58 * 0.48 1.10 *** –6.04 *** 1.25 *** –0.53
ASEAN –0.63 *** –0.60 *** –0.54 *** –0.57 *** –0.68 *** –0.68 *** –0.91 *** –0.90 ***
ASEAN_m 0.34 *** 0.42 *** 0.41 *** 0.51 *** 0.42 *** 0.52 *** 0.51 *** 0.59 ***
ASEAN_x 0.51 *** 0.54 *** 0.79 *** 0.79 *** 1.13 *** 1.14 *** 1.12 *** 1.12 ***
BKA –0.82 *** –0.67 *** –0.57 *** –0.60 *** –0.43 ** –0.47 *** –0.39 * –0.55 ***
BKA_m 0.41 *** 0.69 *** 0.49 *** 0.86 *** 0.54 *** 0.87 *** 0.71 *** 0.98 ***
BKA_x 0.26 *** 0.37 *** 0.31 *** 0.32 *** 0.49 *** 0.51 *** 0.44 *** 0.46 ***
Bulgaria-Turkey 0.42 0.16 0.76 0.45 0.53 0.23 0.41 0.12
Bulgaria-Turkey_m 0.66 *** 0.52 *** 0.62 *** 0.50 *** 0.68 *** 0.53 *** 0.67 *** 0.56 ***
Table 9 Random effects (RE) estimates for total merchandise trade and trade in manufactures using truncated and censored data, without and and import country fixed effects, and 46 WTO-compiled PTAs, 1970–99
Censored (RE)
EU-Bulgaria 0.23 *** 0.23 *** 0.25 *** 0.25 *** 0.30 *** 0.28 *** 0.35 *** 0.34 ***
EU-Bulgaria_m –0.04 –0.03 0.01 –0.01 0.01 –0.01 –0.01 –0.02
EU-Bulgaria_x –0.06 –0.05 –0.05 –0.03 –0.02 –0.02 –0.06 –0.05
EU-Iceland 0.00 0.03 –0.10 –0.12 –0.21 * –0.20 * –0.30 ** –0.26 **
EU-Iceland_m 0.06 0.31 *** 0.02 –0.01 0.11 0.14 0.17 * 0.25 **
EU-Iceland_x –0.22 *** 0.14 * –0.12 0.54 *** –0.23 *** 0.38 *** 0.07 0.55 ***
EU-Norway 0.18 * 0.17 * –0.05 –0.05 0.05 0.03 0.04 0.03
EU-Norway_m –0.08 –0.14 ** 0.07 0.02 –0.01 –0.07 –0.06 –0.16 *
EU-Norway_x –0.22 *** –0.22 *** –0.26 *** –0.44 *** –0.21 *** –0.37 *** –0.35 *** –0.51 ***
EU-Romania 0.26 *** 0.31 *** 0.10 0.16 ** 0.04 0.09 0.05 0.10
EU-Romania_m –0.22 *** –0.20 *** –0.02 –0.02 –0.04 –0.04 –0.07 –0.06
EU-Romania_x –0.11 *** –0.10 *** –0.29 *** –0.26 *** –0.18 *** –0.16 *** –0.20 *** –0.19 ***
EU-Switzerland 0.01 –0.04 –0.15 –0.23 ** –0.06 –0.20 * –0.04 –0.23 *
EU-Switzerland_m 0.07 –0.09 0.12 ** 0.20 *** 0.15 ** 0.18 ** 0.12 0.13
EU-Switzerland_x 0.33 *** –0.01 0.32 *** –0.19 *** 0.53 *** 0.03 0.29 *** –0.07
EU-Syria 0.31 * 0.36 ** 0.28 0.34 ** 0.42 ** 0.47 ** 0.50 ** 0.56 ***
EU-Syria_m –0.20 *** –0.19 *** –0.03 –0.05 –0.09 * –0.12 ** –0.15 *** –0.17 ***
EU-Syria_x 0.00 0.00 –0.31 *** –0.29 *** –0.16 *** –0.15 *** –0.17 *** –0.16 ***
EU-Tunisia –0.14 –0.09 –0.15 * –0.12 –0.19 ** –0.15 –0.19 * –0.16
EU-Tunisia_m –0.42 *** –0.29 *** –0.4 *** –0.23 *** –0.43 *** –0.27 *** –0.42 *** –0.28 ***
EU-Tunisia_x –0.45 *** –0.32 *** –0.46 *** –0.34 *** –0.48 *** –0.35 *** –0.46 *** –0.36 ***
EU-Turkey –0.19 ** –0.17 ** –0.17 ** –0.16 ** –0.28 *** –0.26 *** –0.34 *** –0.32 ***
EU-Turkey_m –0.01 –0.02 –0.02 –0.01 0.01 0.00 0.02 0.01
EU-Turkey_x 0.06 * 0.04 0.13 *** 0.09 *** 0.13 *** 0.08 ** 0.10 ** 0.07 *
GCC 0.35 *** 0.29 *** –0.98 *** –1.01 *** –0.83 *** –0.80 *** –1.11 *** –0.99 ***
GCC_m 0.33 *** 0.16 *** 0.03 –0.20 *** 0.04 –0.07 ** –0.03 –0.16 ***
GCC_x 0.00 –0.17 *** 1.77 *** 1.84 *** 1.99 *** 2.11 *** 2.30 *** 2.31 ***
Georgia-Kazakhstan –1.05 –1.03 –0.15 –0.16 –0.23 –0.21 –0.18 –0.16
Georgia-Kazakhstan_m 0.29 ** 0.26 * 0.30 ** 0.24 * 0.35 ** 0.27 * 0.35 ** 0.28
Georgia-Kazakhstan_x 0.26 * 0.32 ** –0.09 –0.03 0.06 0.10 0.09 0.09
Georgia-Russia –1.18 –0.16 –1.29 0.09 –0.90 0.52 –1.02 0.65
Georgia-Russia_m 0.24 0.60 ** 0.31 * 0.86 *** 0.16 0.78 *** 0.24 0.78 ***
Georgia-Russia_x –0.36 * –0.42 0.16 0.35 0.16 0.46 0.29 0.57
GSTP 0.18 *** 0.15 *** 0.20 *** 0.16 *** 0.20 *** 0.16 *** 0.24 *** 0.20 ***
GSTP_m 0.06 *** 0.06 *** –0.09 *** –0.10 *** –0.05 ** –0.04 ** –0.05 ** –0.04 *
GSTP_x 0.06 *** 0.06 *** 0.30 *** 0.35 *** 0.26 *** 0.32 *** 0.29 *** 0.32 ***
Israel-Turkey –0.08 –0.19 0.29 0.15 0.12 0.02 –0.07 –0.15
Israel-Turkey_m 0.00 0.14 –0.05 0.09 –0.07 0.05 –0.02 0.07
Israel-Turkey_x 0.30 *** 0.44 *** 0.34 *** 0.48 *** 0.42 *** 0.57 *** 0.46 *** 0.57 ***
Kyrgyz Republic–Kazakhstan 0.20 0.72 0.23 0.83 1.49 1.87 * 1.89 2.02 *
Kyrgyz Republic–Kazakhstan_m 0.06 –0.45 ** 0.16 –0.53 ** –0.12 –0.87 *** –0.42 * –1.01 ***
Kyrgyz Republic–Kazakhstan_x 0.12 –0.46 * 0.38 ** –0.57 ** 0.44 ** –0.42 0.44 * –0.37
Kyrgyz Republic–Russia –1.78 –1.00 –1.14 –0.05 0.36 1.21 0.65 1.30
Kyrgyz Republic–Russia_m 0.91 *** 4.67 *** 0.87 *** –0.41 1.02 *** 4.78 *** 1.06 *** 0.22
Kyrgyz Republic–Russia_x 1.06 *** –3.10 *** 0.95 *** 1.96 *** 0.81 ** –3.50 *** 0.68 2.11 ***
LAIA –0.40 *** –0.41 *** –0.61 *** –0.58 *** –0.42 *** –0.36 *** –0.61 *** –0.49 ***
LAIA_m 0.06 ** 0.05 ** 0.09 *** 0.02 0.11 *** 0.05 * 0.14 *** 0.08 **
LAIA_x 0.42 *** 0.38 *** 0.42 *** 0.43 *** 0.45 *** 0.46 *** 0.52 *** 0.51 ***
Laos-Thailand –0.27 –0.17 –1.26 *** –1.10 *** –0.95 ** –0.86 ** –1.01 ** –0.92 *
Laos-Thailand_m 0.48 *** 0.60 *** 0.36 *** 0.50 *** 0.32 *** 0.42 *** 0.44 *** 0.52 ***
Laos-Thailand_x 0.53 *** 0.64 *** 0.76 *** 0.88 *** 0.88 *** 0.98 *** 1.01 *** 1.08 ***
Mercosur 0.23 0.23 0.42 *** 0.42 *** 0.34 ** 0.36 ** 0.30 0.31
Mercosur_m 0.52 *** 0.55 *** 0.57 *** 0.64 *** 0.62 *** 0.67 *** 0.70 *** 0.74 ***
Mercosur_x –0.11 *** –0.13 *** –0.41 *** –0.49 *** –0.31 *** –0.40 *** –0.42 *** –0.48 ***
NAFTA 0.50 ** 0.56 *** 0.40 * 0.47 ** 0.24 0.31 0.21 0.26
NAFTA_m 0.24 *** 0.23 *** 0.46 *** 0.47 *** 0.54 *** 0.54 *** 0.55 *** 0.55 ***
NAFTA_x –0.06 ** –0.10 *** –0.17 *** –0.26 *** –0.03 –0.12 *** –0.13 *** –0.20 ***
PATCRA 0.55 0.64 * –0.82 ** –0.6 –0.55 –0.34 –0.44 –0.26
PATCRA_m –0.02 –0.03 0.05 0.03 0.02 0.02 0.00 –0.01
PATCRA_x –0.2 *** –0.25 *** –0.63 *** –0.77 *** –0.6 *** –0.72 *** –0.75 *** –0.84 ***
PTN –0.04 –0.10 * 0.01 –0.06 –0.03 –0.1 –0.08 –0.1
PTN_m 0.11 *** 0.38 *** –0.01 0.22 *** –0.02 0.21 *** 0.06 0.26 ***
PTN_x 0.03 0.27 *** 0.25 *** 0.40 *** 0.43 *** 0.55 *** 0.46 *** 0.52 ***
Romania-Moldova 2.12 ** 2.28 *** 1.56 1.78 ** 1.85 2.10 ** 1.57 2.18 **
Romania-Moldova_m 0.14 0.18 * 0.09 0.13 0.08 0.00 0.13 0.03
Romania-Moldova_x 0.09 0.12 0.00 0.12 –0.17 –0.07 –0.18 –0.10
Romania-Turkey –0.12 –0.25 0.29 0.12 –0.10 –0.27 –0.28 –0.45
Romania-Turkey_m –0.2 ** –0.17 * –0.18 * –0.15 –0.10 –0.01 –0.11 –0.03
Romania-Turkey_x –0.11 –0.11 –0.08 –0.01 –0.15 –0.03 –0.06 0.01
SAPTA –0.27 –0.34 ** –0.17 –0.26 –0.33 * –0.39 ** –0.40 * –0.45 **
SAPTA_m 0.38 *** 0.34 *** 0.20 *** 0.16 *** 0.24 *** 0.18 *** 0.22 *** 0.16 ***
SAPTA_x 0.48 *** 0.41 *** 0.47 *** 0.35 *** 0.72 *** 0.60 *** 0.68 *** 0.58 ***
SPARTECA –0.24 * –0.19 0.54 *** 0.60 *** 0.70 *** 0.78 *** 0.63 *** 0.82 ***
SPARTECA_m –0.10 ** –0.16 *** –0.16 *** –0.26 *** –0.05 –0.17 *** –0.05 –0.14 **
SPARTECA_x 0.28 *** 0.20 *** 0.37 *** 0.43 *** 0.14 ** 0.18 *** 0.19 *** 0.23 ***
TRIPART 1.41 1.26 * –0.29 –0.28 –0.04 –0.08 –0.08 –0.13
TRIPART_m –1.21 *** 3.55 *** –1.03 *** –3.06 *** –1.20 *** 4.17 *** –1.43 *** 1.03 **
TRIPART_x –1.25 *** –6.76 *** –1.00 *** 0.00 –0.76 *** –5.84 *** –0.73 *** 0.60
US-Israel 0.40 0.50 * 0.23 0.37 –0.02 0.11 –0.05 0.07
US-Israel_m –0.18 *** –0.24 *** –0.04 –0.09 ** 0.19 *** 0.15 *** 0.19 *** 0.15 ***
with export

��
(continued)
Total merchandise trade Trade in manufactures
Truncated (RE) Censored (RE Tobit) Truncated (RE) Censored (RE) Censored (RE Tobit)
Without With Without With Without With Without With Without With Without With
country country country country country country country country country country country country
Explanatory variable effects effects effects effects effects effects effects effects effects effects effects effects
Distance –1.03 *** –1.17 *** Censored regressions for total trade –1.12 *** –1.33 *** –1.24 *** –1.41 *** –1.38 *** –1.52 ***
Joint GDP 0.83 *** 0.92 *** not supported by dataset 0.92 *** 1.02 *** 0.95 *** 0.79 *** 1.01 *** 0.96 ***
Joint GDP per capita –0.02 ** –0.35 *** –0.09 *** –0.45 *** –0.05 *** –0.16 *** –0.13 *** –0.29 ***
Common language 0.46 *** 0.37 *** 0.53 *** 0.53 *** 0.58 *** 0.58 *** 0.65 *** 0.68 ***
Common border 0.53 *** 0.39 *** 0.55 *** 0.34 *** 0.51 *** 0.31 *** 0.49 *** 0.27 ***
Landlocked –0.42 *** –2.11 *** –0.16 *** –0.52 –0.26 *** –1.52 *** –0.34 *** 1.97 ***
Island 0.37 *** –6.80 *** 0.35 *** 1.24 *** 0.41 *** 1.46 *** 0.51 *** 3.25 ***
Land area –0.10 *** –0.86 *** –0.18 *** 0.00 –0.19 *** –0.75 *** –0.22 *** 0.44 ***
Common colonizer 0.05 0.55 *** –0.15 ** 0.52 *** –0.20 ** 0.57 *** –0.34 *** 0.60 ***
Colony 0.01 0.04 0.44 *** 0.49 *** 0.37 *** 0.41 *** 0.40 *** 0.47 ***
Ever a colony 1.53 *** 1.37 *** 1.30 *** 1.21 *** 1.54 *** 1.31 *** 1.68 *** 1.38 ***
Common country 0.37 0.74 0.19 0.43 0.27 0.48 0.28 0.34
Currency union 0.69 *** 0.55 *** 0.40 *** 0.24 ** 0.39 *** 0.26 ** 0.40 *** 0.31 **
GSP 0.06 *** 0.02 0.05 *** 0.02 0.07 *** 0.03 * 0.04 * 0.04 **
Andean Community 0.35 *** 0.36 *** 0.15 0.23 ** 0.13 0.24 ** 0.13 0.32 **
Andean Community_m –0.31 *** –0.21 *** –0.22 *** –0.35 *** –0.23 *** –0.34 *** –0.29 *** –0.37 ***
Andean Community_x –0.34 *** –0.21 *** 0.01 0.47 *** –0.02 0.40 *** 0.10 ** 0.41 ***
ANZCERTA 0.61 * 0.63 ** –0.46 –0.40 –0.03 0.04 0.04 0.07
ANZCERTA_m 0.18 *** 0.24 *** 0.44 *** 0.55 *** 0.16 *** 0.23 *** 0.14 ** 0.21 ***
ANZCERTA_x –0.31 *** –0.31 *** –0.35 *** –0.40 *** –0.23 *** –0.3 *** –0.33 *** –0.39 ***
Armenia-Russia –1.10 0.03 –1.22 0.02 –0.81 0.39 –0.64 0.44
Armenia-Russia_m 0.00 2.08 *** –0.1 –1.43 *** –0.67 *** 1.55 *** –1.04 *** –0.96 ***
Armenia-Russia_x 0.39 –6.46 *** 0.58 * 0.48 1.10 *** –6.04 *** 1.25 *** –0.53
ASEAN –0.63 *** –0.60 *** –0.54 *** –0.57 *** –0.68 *** –0.68 *** –0.91 *** –0.90 ***
ASEAN_m 0.34 *** 0.42 *** 0.41 *** 0.51 *** 0.42 *** 0.52 *** 0.51 *** 0.59 ***
ASEAN_x 0.51 *** 0.54 *** 0.79 *** 0.79 *** 1.13 *** 1.14 *** 1.12 *** 1.12 ***
BKA –0.82 *** –0.67 *** –0.57 *** –0.60 *** –0.43 ** –0.47 *** –0.39 * –0.55 ***
BKA_m 0.41 *** 0.69 *** 0.49 *** 0.86 *** 0.54 *** 0.87 *** 0.71 *** 0.98 ***
BKA_x 0.26 *** 0.37 *** 0.31 *** 0.32 *** 0.49 *** 0.51 *** 0.44 *** 0.46 ***
Bulgaria-Turkey 0.42 0.16 0.76 0.45 0.53 0.23 0.41 0.12
Bulgaria-Turkey_m 0.66 *** 0.52 *** 0.62 *** 0.50 *** 0.68 *** 0.53 *** 0.67 *** 0.56 ***
Table 9 Random effects (RE) estimates for total merchandise trade and trade in manufactures using truncated and censored data, without and and import country fixed effects, and 46 WTO-compiled PTAs, 1970–99
Censored (RE)
US-Israel_x –0.12 *** –0.20 *** –0.27 *** –0.36 *** –0.03 –0.11 ** –0.04 –0.10 **
Constant –21.45 *** (dropped) –22.66 *** –26.55 *** –24.24 *** (dropped) –24.5 *** –39.7 ***
R-squared 0.57 0.70 0.52 0.75 0.52 0.76 0.32 0.33
Observation (thousands) 200 200 176 176 200 200 200 200
Groups (thousands) 11 11 10 10 11 11 11 11
Memorandum item: Trade creating versus trade diverting PTAs under alternative criteria
Trade creating PTAs (number)
1st PTA coefficient 14 17 9 12 9 12 8 10
Sum of PTA coefficients 25 33 27 29 29 31 29 31
Trade diverting PTAs (number)
1st PTA coefficient 7 9 10 10 12 12 12 12
Sum of PTA coefficients 17 12 17 15 14 14 14 13
***,**,* indicates statistical significance at the 99, 95, and 90 percent levels, respectively.
Sources: Author's calculations based on generalized least squares estimation of the Rose (2004) gravity model with random effects, using a combined version of the Rose (2004) and the Feenstra-Lipsey (2005) datasets.
Notes: Regressand is log real trade. Distance, joint GDP, joint GDP per capita, and land area are measured in log terms. Truncated (censored) data exclude (include) zero-value trade flows. Estimated year and country effects are not reported. Pseudo R-squared values are reported for the Tobit regressions. Groups are numbers of country-pair-commodity combinations. Boldfaced estimates are preferential trading arrangements (PTAs) with significant negative 1st PTA coefficients. Shaded estimates indicate PTAs with a negative sum of significant PTA coefficients. PTA variables marked _m indicate the importing country is a PTA member; those marked _x indicate the exporting country is a PTA member; and those not marked indicate both the importing country and the exporting country are PTA members.
Kyrgyz Republic–Kazakhstan_m 0.06 –0.45 ** 0.16 –0.53 ** –0.12 –0.87 *** –0.42 * –1.01 ***
Kyrgyz Republic–Kazakhstan_x 0.12 –0.46 * 0.38 ** –0.57 ** 0.44 ** –0.42 0.44 * –0.37
Kyrgyz Republic–Russia –1.78 –1.00 –1.14 –0.05 0.36 1.21 0.65 1.30
Kyrgyz Republic–Russia_m 0.91 *** 4.67 *** 0.87 *** –0.41 1.02 *** 4.78 *** 1.06 *** 0.22
Kyrgyz Republic–Russia_x 1.06 *** –3.10 *** 0.95 *** 1.96 *** 0.81 ** –3.50 *** 0.68 2.11 ***
LAIA –0.40 *** –0.41 *** –0.61 *** –0.58 *** –0.42 *** –0.36 *** –0.61 *** –0.49 ***
LAIA_m 0.06 ** 0.05 ** 0.09 *** 0.02 0.11 *** 0.05 * 0.14 *** 0.08 **
LAIA_x 0.42 *** 0.38 *** 0.42 *** 0.43 *** 0.45 *** 0.46 *** 0.52 *** 0.51 ***
Laos-Thailand –0.27 –0.17 –1.26 *** –1.10 *** –0.95 ** –0.86 ** –1.01 ** –0.92 *
Laos-Thailand_m 0.48 *** 0.60 *** 0.36 *** 0.50 *** 0.32 *** 0.42 *** 0.44 *** 0.52 ***
Laos-Thailand_x 0.53 *** 0.64 *** 0.76 *** 0.88 *** 0.88 *** 0.98 *** 1.01 *** 1.08 ***
Mercosur 0.23 0.23 0.42 *** 0.42 *** 0.34 ** 0.36 ** 0.30 0.31
Mercosur_m 0.52 *** 0.55 *** 0.57 *** 0.64 *** 0.62 *** 0.67 *** 0.70 *** 0.74 ***
Mercosur_x –0.11 *** –0.13 *** –0.41 *** –0.49 *** –0.31 *** –0.40 *** –0.42 *** –0.48 ***
NAFTA 0.50 ** 0.56 *** 0.40 * 0.47 ** 0.24 0.31 0.21 0.26
NAFTA_m 0.24 *** 0.23 *** 0.46 *** 0.47 *** 0.54 *** 0.54 *** 0.55 *** 0.55 ***
NAFTA_x –0.06 ** –0.10 *** –0.17 *** –0.26 *** –0.03 –0.12 *** –0.13 *** –0.20 ***
PATCRA 0.55 0.64 * –0.82 ** –0.6 –0.55 –0.34 –0.44 –0.26
PATCRA_m –0.02 –0.03 0.05 0.03 0.02 0.02 0.00 –0.01
PATCRA_x –0.2 *** –0.25 *** –0.63 *** –0.77 *** –0.6 *** –0.72 *** –0.75 *** –0.84 ***
PTN –0.04 –0.10 * 0.01 –0.06 –0.03 –0.1 –0.08 –0.1
PTN_m 0.11 *** 0.38 *** –0.01 0.22 *** –0.02 0.21 *** 0.06 0.26 ***
PTN_x 0.03 0.27 *** 0.25 *** 0.40 *** 0.43 *** 0.55 *** 0.46 *** 0.52 ***
Romania-Moldova 2.12 ** 2.28 *** 1.56 1.78 ** 1.85 2.10 ** 1.57 2.18 **
Romania-Moldova_m 0.14 0.18 * 0.09 0.13 0.08 0.00 0.13 0.03
Romania-Moldova_x 0.09 0.12 0.00 0.12 –0.17 –0.07 –0.18 –0.10
Romania-Turkey –0.12 –0.25 0.29 0.12 –0.10 –0.27 –0.28 –0.45
Romania-Turkey_m –0.2 ** –0.17 * –0.18 * –0.15 –0.10 –0.01 –0.11 –0.03
Romania-Turkey_x –0.11 –0.11 –0.08 –0.01 –0.15 –0.03 –0.06 0.01
SAPTA –0.27 –0.34 ** –0.17 –0.26 –0.33 * –0.39 ** –0.40 * –0.45 **
SAPTA_m 0.38 *** 0.34 *** 0.20 *** 0.16 *** 0.24 *** 0.18 *** 0.22 *** 0.16 ***
SAPTA_x 0.48 *** 0.41 *** 0.47 *** 0.35 *** 0.72 *** 0.60 *** 0.68 *** 0.58 ***
SPARTECA –0.24 * –0.19 0.54 *** 0.60 *** 0.70 *** 0.78 *** 0.63 *** 0.82 ***
SPARTECA_m –0.10 ** –0.16 *** –0.16 *** –0.26 *** –0.05 –0.17 *** –0.05 –0.14 **
SPARTECA_x 0.28 *** 0.20 *** 0.37 *** 0.43 *** 0.14 ** 0.18 *** 0.19 *** 0.23 ***
TRIPART 1.41 1.26 * –0.29 –0.28 –0.04 –0.08 –0.08 –0.13
TRIPART_m –1.21 *** 3.55 *** –1.03 *** –3.06 *** –1.20 *** 4.17 *** –1.43 *** 1.03 **
TRIPART_x –1.25 *** –6.76 *** –1.00 *** 0.00 –0.76 *** –5.84 *** –0.73 *** 0.60
US-Israel 0.40 0.50 * 0.23 0.37 –0.02 0.11 –0.05 0.07
US-Israel_m –0.18 *** –0.24 *** –0.04 –0.09 ** 0.19 *** 0.15 *** 0.19 *** 0.15 ***
(table continues next page)
withexport

��
Total merchandise trade Trade in manufactures
Truncated (RE) Censored (RE Tobit) Truncated (RE) Censored (RE) Censored (RE Tobit)
Without With Without With Without With Without With Without With Without With
country country country country country country country country country country country country
Explanatory variable effects effects effects effects effects effects effects effects effects effects effects effects
Distance –1.03 *** –1.17 *** Censored regressions for total trade –1.12 *** –1.33 *** –1.24 *** –1.41 *** –1.38 *** –1.52 ***
Joint GDP 0.83 *** 0.92 *** not supported by dataset 0.92 *** 1.02 *** 0.95 *** 0.79 *** 1.01 *** 0.96 ***
Joint GDP per capita –0.02 ** –0.35 *** –0.09 *** –0.45 *** –0.05 *** –0.16 *** –0.13 *** –0.29 ***
Common language 0.46 *** 0.37 *** 0.53 *** 0.53 *** 0.58 *** 0.58 *** 0.65 *** 0.68 ***
Common border 0.53 *** 0.39 *** 0.55 *** 0.34 *** 0.51 *** 0.31 *** 0.49 *** 0.27 ***
Landlocked –0.42 *** –2.11 *** –0.16 *** –0.52 –0.26 *** –1.52 *** –0.34 *** 1.97 ***
Island 0.37 *** –6.80 *** 0.35 *** 1.24 *** 0.41 *** 1.46 *** 0.51 *** 3.25 ***
Land area –0.10 *** –0.86 *** –0.18 *** 0.00 –0.19 *** –0.75 *** –0.22 *** 0.44 ***
Common colonizer 0.05 0.55 *** –0.15 ** 0.52 *** –0.20 ** 0.57 *** –0.34 *** 0.60 ***
Colony 0.01 0.04 0.44 *** 0.49 *** 0.37 *** 0.41 *** 0.40 *** 0.47 ***
Ever a colony 1.53 *** 1.37 *** 1.30 *** 1.21 *** 1.54 *** 1.31 *** 1.68 *** 1.38 ***
Common country 0.37 0.74 0.19 0.43 0.27 0.48 0.28 0.34
Currency union 0.69 *** 0.55 *** 0.40 *** 0.24 ** 0.39 *** 0.26 ** 0.40 *** 0.31 **
GSP 0.06 *** 0.02 0.05 *** 0.02 0.07 *** 0.03 * 0.04 * 0.04 **
Andean Community 0.35 *** 0.36 *** 0.15 0.23 ** 0.13 0.24 ** 0.13 0.32 **
Andean Community_m –0.31 *** –0.21 *** –0.22 *** –0.35 *** –0.23 *** –0.34 *** –0.29 *** –0.37 ***
Andean Community_x –0.34 *** –0.21 *** 0.01 0.47 *** –0.02 0.40 *** 0.10 ** 0.41 ***
ANZCERTA 0.61 * 0.63 ** –0.46 –0.40 –0.03 0.04 0.04 0.07
ANZCERTA_m 0.18 *** 0.24 *** 0.44 *** 0.55 *** 0.16 *** 0.23 *** 0.14 ** 0.21 ***
ANZCERTA_x –0.31 *** –0.31 *** –0.35 *** –0.40 *** –0.23 *** –0.3 *** –0.33 *** –0.39 ***
Armenia-Russia –1.10 0.03 –1.22 0.02 –0.81 0.39 –0.64 0.44
Armenia-Russia_m 0.00 2.08 *** –0.1 –1.43 *** –0.67 *** 1.55 *** –1.04 *** –0.96 ***
Armenia-Russia_x 0.39 –6.46 *** 0.58 * 0.48 1.10 *** –6.04 *** 1.25 *** –0.53
ASEAN –0.63 *** –0.60 *** –0.54 *** –0.57 *** –0.68 *** –0.68 *** –0.91 *** –0.90 ***
ASEAN_m 0.34 *** 0.42 *** 0.41 *** 0.51 *** 0.42 *** 0.52 *** 0.51 *** 0.59 ***
ASEAN_x 0.51 *** 0.54 *** 0.79 *** 0.79 *** 1.13 *** 1.14 *** 1.12 *** 1.12 ***
BKA –0.82 *** –0.67 *** –0.57 *** –0.60 *** –0.43 ** –0.47 *** –0.39 * –0.55 ***
BKA_m 0.41 *** 0.69 *** 0.49 *** 0.86 *** 0.54 *** 0.87 *** 0.71 *** 0.98 ***
BKA_x 0.26 *** 0.37 *** 0.31 *** 0.32 *** 0.49 *** 0.51 *** 0.44 *** 0.46 ***
Bulgaria-Turkey 0.42 0.16 0.76 0.45 0.53 0.23 0.41 0.12
Bulgaria-Turkey_m 0.66 *** 0.52 *** 0.62 *** 0.50 *** 0.68 *** 0.53 *** 0.67 *** 0.56 ***
Table 9 Random effects (RE) estimates for total merchandise trade and trade in manufactures using truncated and censored data, without and and import country fixed effects, and 46 WTO-compiled PTAs, 1970–99
Censored (RE)
US-Israel_x –0.12 *** –0.20 *** –0.27 *** –0.36 *** –0.03 –0.11 ** –0.04 –0.10 **
Constant –21.45 *** (dropped) –22.66 *** –26.55 *** –24.24 *** (dropped) –24.5 *** –39.7 ***
R-squared 0.57 0.70 0.52 0.75 0.52 0.76 0.32 0.33
Observation (thousands) 200 200 176 176 200 200 200 200
Groups (thousands) 11 11 10 10 11 11 11 11
Memorandum item: Trade creating versus trade diverting PTAs under alternative criteria
Trade creating PTAs (number)
1st PTA coefficient 14 17 9 12 9 12 8 10
Sum of PTA coefficients 25 33 27 29 29 31 29 31
Trade diverting PTAs (number)
1st PTA coefficient 7 9 10 10 12 12 12 12
Sum of PTA coefficients 17 12 17 15 14 14 14 13
***,**,* indicates statistical significance at the 99, 95, and 90 percent levels, respectively.
Sources: Author's calculations based on generalized least squares estimation of the Rose (2004) gravity model with random effects, using a combined version of the Rose (2004) and the Feenstra-Lipsey (2005) datasets.
Notes: Regressand is log real trade. Distance, joint GDP, joint GDP per capita, and land area are measured in log terms. Truncated (censored) data exclude (include) zero-value trade flows. Estimated year and country effects are not reported. Pseudo R-squared values are reported for the Tobit regressions. Groups are numbers of country-pair-commodity combinations. Boldfaced estimates are preferential trading arrangements (PTAs) with significant negative 1st PTA coefficients. Shaded estimates indicate PTAs with a negative sum of significant PTA coefficients. PTA variables marked _m indicate the importing country is a PTA member; those marked _x indicate the exporting country is a PTA member; and those not marked indicate both the importing country and the exporting country are PTA members.
(continued)
Observations (thousands)
withexport

��
(table continues next page)
Using Using Using UsingSoloaga-Winters Rieder Soloaga-Winters RiederPTA indicators PTA indicators PTA indicators PTA indicators
Without With Without With Without With Without Withcountry country country country country country country country
Explanatory variable effects effects effects effects effects effects effects effects
Distance –1.0 *** –1.17 *** –1.02 *** –1.16 *** –1.12 *** –1.33 *** –1.10 *** –1.30 ***
Joint GDP 0.83 *** 0.92 *** 0.85 *** 1.08 *** 0.92 *** 1.02 *** 1.00 *** 1.84 ***
Joint GDP per capita –0.02 ** –0.35 *** –0.05 *** –0.50 *** –0.09 *** –0.45 *** –0.22 *** –1.26 ***
Common language 0.46 *** 0.37 *** 0.36 *** 0.35 *** 0.53 *** 0.53 *** 0.45 *** 0.50 ***
Common border 0.53 *** 0.39 *** 0.56 *** 0.37 *** 0.55 *** 0.34 *** 0.57 *** 0.30 ***
Landlocked –0.42 *** –2.11 *** –0.43 *** –6.19 *** –0.16 *** –0.52 –0.23 *** 2.12 ***
Island 0.37 *** –6.80 *** 0.33 *** –6.34 *** 0.35 *** 1.24 *** 0.28 *** 4.98 ***
Land area –0.10 *** –0.86 *** –0.12 *** –0.59 *** –0.18 *** 0.00 –0.25 *** –0.10 **
Common colonizer 0.05 0.55 *** –0.10 0.55 *** –0.15 ** 0.52 *** –0.30 *** 0.52 ***
Colony 0.01 0.04 0.13 0.14 0.44 *** 0.49 *** 0.64 *** 0.64 ***
Ever a colony 1.53 *** 1.37 *** 1.68 *** 1.38 *** 1.30 *** 1.21 *** 1.39 *** 1.23 ***
Common country 0.37 0.74 0.31 0.65 0.19 0.43 0.01 0.28
Currency union 0.69 *** 0.55 *** 0.74 *** 0.62 *** 0.40 *** 0.24 ** 0.48 *** 0.35 ***
GSP 0.06 *** 0.02 0.08 *** 0.01 0.05 *** 0.02 0.07 *** 0.00
Andean 0.35 *** 0.36 *** 0.01 0.12 0.15 0.23 ** 0.05 0.13
Andean_m –0.31 *** –0.21 *** –0.32 *** –0.24 *** –0.22 *** –0.35 *** –0.22 *** –0.44 ***
Andean_x –0.34 *** –0.21 *** 0.01 0.47 ***
ANZCERTA 0.61 * 0.63 ** 0.60 * 0.67 ** –0.46 –0.40 –0.26 –0.05
ANZCERTA_m 0.18 *** 0.24 *** 0.21 *** 0.25 *** 0.44 *** 0.55 *** 0.57 *** 0.70 ***
ANZCERTA_x –0.31 *** –0.31 *** –0.35 *** –0.41 ***
Armenia-Russia –1.1 0.03 –0.66 –3.62 *** –1.22 0.02 –0.71 –0.72
Armenia-Russia_m 0.00 2.08 *** –0.05 –3.69 *** –0.10 –1.43 *** –0.16 –0.76 ***
Armenia-Russia_x 0.39 –6.46 *** 0.58 * 0.48
ASEAN –0.63 *** –0.60 *** 0.15 0.26 *** –0.54 *** –0.57 *** 0.61 *** 0.64 ***
ASEAN_m 0.34 *** 0.42 *** 0.34 *** 0.39 *** 0.41 *** 0.51 *** 0.41 *** 0.48 ***
Table 10 Random effects estimates for total merchandise trade and trade in manufactures, using alternative PTA indicators, 1970–99
Trade in manufacturesTotal merchandise trade
ASEAN_x 0.51 *** 0.54 *** 0.79 *** 0.79 ***
BKA –0.82 *** –0.67 *** –0.26 * 0.24 –0.57 *** –0.60 *** 0.11 0.47 ***
BKA_m 0.41 *** 0.69 *** 0.41 *** 0.68 *** 0.49 *** 0.86 *** 0.51 *** 0.90 ***
BKA_x 0.26 *** 0.37 *** 0.31 *** 0.32 ***
Bulgaria-Turkey 0.42 0.16 2.00 *** 1.61 *** 0.76 0.45 2.39 *** 2.05 ***
Bulgaria-Turkey_m 0.66 *** 0.52 *** 0.64 *** 0.52 *** 0.62 *** 0.50 *** 0.57 *** 0.51 ***
Bulgaria-Turkey_x 0.65 *** 0.56 *** 0.62 *** 0.50 ***
Canada-Chile –0.09 –0.02 0.07 0.21 –0.39 –0.31 –0.19 –0.04
Canada-Chile_m 0.07 0.15 * 0.09 0.16 ** 0.37 *** 0.43 *** 0.42 *** 0.49 ***
Canada-Chile_x 0.06 0.14 * –0.28 *** –0.19 **
Canada-Israel –0.24 –0.17 –0.57 –0.54 –0.17 –0.07 –0.84 –0.83
Canada-Israel_m –0.24 *** –0.29 *** –0.22 ** –0.26 *** –0.41 *** –0.43 *** –0.38 *** –0.40 ***
Canada-Israel_x –0.34 *** –0.41 *** –0.21 ** –0.32 ***
CEFTA 0.98 *** 0.77 *** 1.31 *** 1.23 *** 0.32 * 0.14 0.50 *** 0.69 ***
CEFTA_m 0.35 *** 0.41 *** 0.36 *** 0.46 *** 0.29 *** 0.47 *** 0.35 *** 0.68 ***
CEFTA_x 0.05 0.02 0.03 –0.22 ***
Chile-Mexico 0.35 0.36 1.24 1.20 0.81 0.84 1.36 1.31
Chile-Mexico_m 0.53 *** 0.52 *** 0.54 *** 0.54 *** 0.48 *** 0.45 *** 0.49 *** 0.46 ***
Chile-Mexico_x 0.34 *** 0.32 *** 0.29 *** 0.24 **
CIS 2.89 *** 2.59 *** 3.13 *** 2.94 *** 2.43 *** 2.02 *** 2.96 *** 2.55 ***
CIS_m 0.04 0.34 *** 0.03 0.34 *** 0.18 ** 0.41 *** 0.17 * 0.49 ***
CIS_x –0.09 0.37 *** –0.05 0.36 **
EAEC 0.15 0.08 –0.19 –0.12 –0.20 –0.38 –0.51 –0.53
EAEC_m –0.45 *** –0.25 ** –0.44 *** –0.25 ** –0.45 *** –0.17 –0.40 *** –0.12
EAEC_x –0.01 0.05 0.03 –0.09
EFTA 0.04 0.01 0.41 *** 0.24 *** 0.18 ** 0.14 * 0.60 *** 0.39 ***
EFTA_m 0.31 *** 0.12 *** 0.23 *** 0.10 *** 0.02 0.14 *** –0.09 *** 0.06 *
EFTA_x 0.59 *** 0.45 *** 0.88 *** 0.52 ***
EFTA-Bulgaria 0.58 ** 0.55 ** –0.26 –0.25 0.20 0.21 –0.84 *** –0.73 ***
EFTA-Bulgaria_m –0.67 *** –0.63 *** –0.64 *** –0.59 *** –0.73 *** –0.73 *** –0.69 *** –0.60 ***
EFTA-Bulgaria_x –0.67 *** –0.60 *** –1.06 *** –0.87 ***
EFTA-Israel –0.52 *** –0.49 ** –0.13 0.00 –0.40 * –0.36 * –0.07 –0.01
EFTA-Israel_m 0.42 *** 0.51 *** 0.43 *** 0.49 *** 0.52 *** 0.59 *** 0.56 *** 0.58 ***
EFTA-Israel_x 0.34 *** 0.37 *** 0.22 *** 0.23 ***
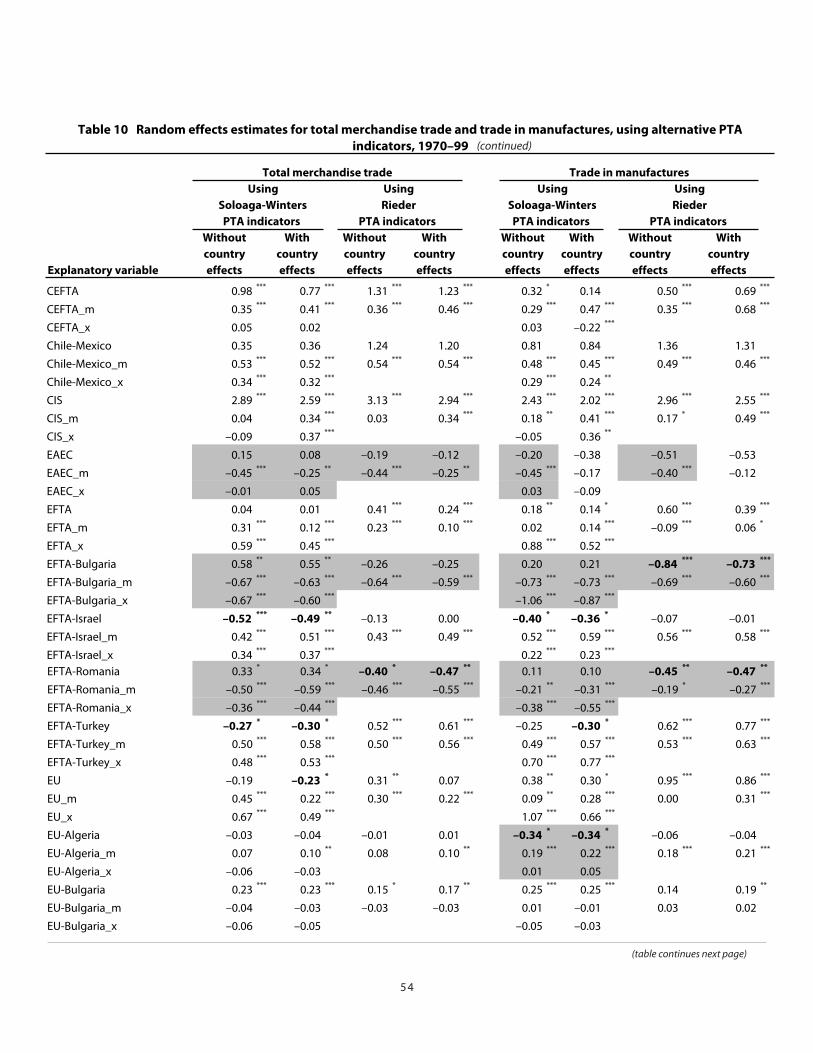
��
(table continues next page)
(continued)
Using Using Using UsingSoloaga-Winters Rieder Soloaga-Winters RiederPTA indicators PTA indicators PTA indicators PTA indicators
Without With Without With Without With Without Withcountry country country country country country country country
Explanatory variable effects effects effects effects effects effects effects effects
Distance –1.0 *** –1.17 *** –1.02 *** –1.16 *** –1.12 *** –1.33 *** –1.10 *** –1.30 ***
Joint GDP 0.83 *** 0.92 *** 0.85 *** 1.08 *** 0.92 *** 1.02 *** 1.00 *** 1.84 ***
Joint GDP per capita –0.02 ** –0.35 *** –0.05 *** –0.50 *** –0.09 *** –0.45 *** –0.22 *** –1.26 ***
Common language 0.46 *** 0.37 *** 0.36 *** 0.35 *** 0.53 *** 0.53 *** 0.45 *** 0.50 ***
Common border 0.53 *** 0.39 *** 0.56 *** 0.37 *** 0.55 *** 0.34 *** 0.57 *** 0.30 ***
Landlocked –0.42 *** –2.11 *** –0.43 *** –6.19 *** –0.16 *** –0.52 –0.23 *** 2.12 ***
Island 0.37 *** –6.80 *** 0.33 *** –6.34 *** 0.35 *** 1.24 *** 0.28 *** 4.98 ***
Land area –0.10 *** –0.86 *** –0.12 *** –0.59 *** –0.18 *** 0.00 –0.25 *** –0.10 **
Common colonizer 0.05 0.55 *** –0.10 0.55 *** –0.15 ** 0.52 *** –0.30 *** 0.52 ***
Colony 0.01 0.04 0.13 0.14 0.44 *** 0.49 *** 0.64 *** 0.64 ***
Ever a colony 1.53 *** 1.37 *** 1.68 *** 1.38 *** 1.30 *** 1.21 *** 1.39 *** 1.23 ***
Common country 0.37 0.74 0.31 0.65 0.19 0.43 0.01 0.28
Currency union 0.69 *** 0.55 *** 0.74 *** 0.62 *** 0.40 *** 0.24 ** 0.48 *** 0.35 ***
GSP 0.06 *** 0.02 0.08 *** 0.01 0.05 *** 0.02 0.07 *** 0.00
Andean 0.35 *** 0.36 *** 0.01 0.12 0.15 0.23 ** 0.05 0.13
Andean_m –0.31 *** –0.21 *** –0.32 *** –0.24 *** –0.22 *** –0.35 *** –0.22 *** –0.44 ***
Andean_x –0.34 *** –0.21 *** 0.01 0.47 ***
ANZCERTA 0.61 * 0.63 ** 0.60 * 0.67 ** –0.46 –0.40 –0.26 –0.05
ANZCERTA_m 0.18 *** 0.24 *** 0.21 *** 0.25 *** 0.44 *** 0.55 *** 0.57 *** 0.70 ***
ANZCERTA_x –0.31 *** –0.31 *** –0.35 *** –0.41 ***
Armenia-Russia –1.1 0.03 –0.66 –3.62 *** –1.22 0.02 –0.71 –0.72
Armenia-Russia_m 0.00 2.08 *** –0.05 –3.69 *** –0.10 –1.43 *** –0.16 –0.76 ***
Armenia-Russia_x 0.39 –6.46 *** 0.58 * 0.48
ASEAN –0.63 *** –0.60 *** 0.15 0.26 *** –0.54 *** –0.57 *** 0.61 *** 0.64 ***
ASEAN_m 0.34 *** 0.42 *** 0.34 *** 0.39 *** 0.41 *** 0.51 *** 0.41 *** 0.48 ***
Table 10 Random effects estimates for total merchandise trade and trade in manufactures, using alternative PTA indicators, 1970–99
Trade in manufacturesTotal merchandise trade
ASEAN_x 0.51 *** 0.54 *** 0.79 *** 0.79 ***
BKA –0.82 *** –0.67 *** –0.26 * 0.24 –0.57 *** –0.60 *** 0.11 0.47 ***
BKA_m 0.41 *** 0.69 *** 0.41 *** 0.68 *** 0.49 *** 0.86 *** 0.51 *** 0.90 ***
BKA_x 0.26 *** 0.37 *** 0.31 *** 0.32 ***
Bulgaria-Turkey 0.42 0.16 2.00 *** 1.61 *** 0.76 0.45 2.39 *** 2.05 ***
Bulgaria-Turkey_m 0.66 *** 0.52 *** 0.64 *** 0.52 *** 0.62 *** 0.50 *** 0.57 *** 0.51 ***
Bulgaria-Turkey_x 0.65 *** 0.56 *** 0.62 *** 0.50 ***
Canada-Chile –0.09 –0.02 0.07 0.21 –0.39 –0.31 –0.19 –0.04
Canada-Chile_m 0.07 0.15 * 0.09 0.16 ** 0.37 *** 0.43 *** 0.42 *** 0.49 ***
Canada-Chile_x 0.06 0.14 * –0.28 *** –0.19 **
Canada-Israel –0.24 –0.17 –0.57 –0.54 –0.17 –0.07 –0.84 –0.83
Canada-Israel_m –0.24 *** –0.29 *** –0.22 ** –0.26 *** –0.41 *** –0.43 *** –0.38 *** –0.40 ***
Canada-Israel_x –0.34 *** –0.41 *** –0.21 ** –0.32 ***
CEFTA 0.98 *** 0.77 *** 1.31 *** 1.23 *** 0.32 * 0.14 0.50 *** 0.69 ***
CEFTA_m 0.35 *** 0.41 *** 0.36 *** 0.46 *** 0.29 *** 0.47 *** 0.35 *** 0.68 ***
CEFTA_x 0.05 0.02 0.03 –0.22 ***
Chile-Mexico 0.35 0.36 1.24 1.20 0.81 0.84 1.36 1.31
Chile-Mexico_m 0.53 *** 0.52 *** 0.54 *** 0.54 *** 0.48 *** 0.45 *** 0.49 *** 0.46 ***
Chile-Mexico_x 0.34 *** 0.32 *** 0.29 *** 0.24 **
CIS 2.89 *** 2.59 *** 3.13 *** 2.94 *** 2.43 *** 2.02 *** 2.96 *** 2.55 ***
CIS_m 0.04 0.34 *** 0.03 0.34 *** 0.18 ** 0.41 *** 0.17 * 0.49 ***
CIS_x –0.09 0.37 *** –0.05 0.36 **
EAEC 0.15 0.08 –0.19 –0.12 –0.20 –0.38 –0.51 –0.53
EAEC_m –0.45 *** –0.25 ** –0.44 *** –0.25 ** –0.45 *** –0.17 –0.40 *** –0.12
EAEC_x –0.01 0.05 0.03 –0.09
EFTA 0.04 0.01 0.41 *** 0.24 *** 0.18 ** 0.14 * 0.60 *** 0.39 ***
EFTA_m 0.31 *** 0.12 *** 0.23 *** 0.10 *** 0.02 0.14 *** –0.09 *** 0.06 *
EFTA_x 0.59 *** 0.45 *** 0.88 *** 0.52 ***
EFTA-Bulgaria 0.58 ** 0.55 ** –0.26 –0.25 0.20 0.21 –0.84 *** –0.73 ***
EFTA-Bulgaria_m –0.67 *** –0.63 *** –0.64 *** –0.59 *** –0.73 *** –0.73 *** –0.69 *** –0.60 ***
EFTA-Bulgaria_x –0.67 *** –0.60 *** –1.06 *** –0.87 ***
EFTA-Israel –0.52 *** –0.49 ** –0.13 0.00 –0.40 * –0.36 * –0.07 –0.01
EFTA-Israel_m 0.42 *** 0.51 *** 0.43 *** 0.49 *** 0.52 *** 0.59 *** 0.56 *** 0.58 ***
EFTA-Israel_x 0.34 *** 0.37 *** 0.22 *** 0.23 ***
EFTA-Romania 0.33 * 0.34 * –0.40 * –0.47 ** 0.11 0.10 –0.45 ** –0.47 **
EFTA-Romania_m –0.50 *** –0.59 *** –0.46 *** –0.55 *** –0.21 ** –0.31 *** –0.19 * –0.27 ***
EFTA-Romania_x –0.36 *** –0.44 *** –0.38 *** –0.55 ***
EFTA-Turkey –0.27 * –0.30 * 0.52 *** 0.61 *** –0.25 –0.30 * 0.62 *** 0.77 ***
EFTA-Turkey_m 0.50 *** 0.58 *** 0.50 *** 0.56 *** 0.49 *** 0.57 *** 0.53 *** 0.63 ***
EFTA-Turkey_x 0.48 *** 0.53 *** 0.70 *** 0.77 ***
EU –0.19 –0.23 * 0.31 ** 0.07 0.38 ** 0.30 * 0.95 *** 0.86 ***
EU_m 0.45 *** 0.22 *** 0.30 *** 0.22 *** 0.09 ** 0.28 *** 0.00 0.31 ***
EU_x 0.67 *** 0.49 *** 1.07 *** 0.66 ***
EU-Algeria –0.03 –0.04 –0.01 0.01 –0.34 * –0.34 * –0.06 –0.04
EU-Algeria_m 0.07 0.10 ** 0.08 0.10 ** 0.19 *** 0.22 *** 0.18 *** 0.21 ***
EU-Algeria_x –0.06 –0.03 0.01 0.05
EU-Bulgaria 0.23 *** 0.23 *** 0.15 * 0.17 ** 0.25 *** 0.25 *** 0.14 0.19 **
EU-Bulgaria_m –0.04 –0.03 –0.03 –0.03 0.01 –0.01 0.03 0.02
EU-Bulgaria_x –0.06 –0.05 –0.05 –0.03
EU-Iceland 0.00 0.03 0.09 0.34 *** –0.11 –0.12 –0.17 –0.29 **
EU-Iceland_m 0.06 0.31 *** 0.15 ** 0.29 *** 0.02 –0.01 –0.02 –0.21 **
EU-Iceland_x –0.22 *** 0.14 * –0.12 0.54 ***
EU-Norway 0.18 * 0.17 * 0.07 –0.02 –0.06 –0.05 –0.08 –0.11
EU-Norway_m –0.08 –0.14 ** –0.06 –0.13 * 0.07 0.02 0.10 0.09
EU-Norway_x –0.22 *** –0.22 *** –0.26 *** –0.44 ***
EU-Romania 0.26 *** 0.31 *** –0.18 ** –0.09 0.10 0.16 ** –0.21 *** –0.04
EU-Romania_m –0.22 *** –0.20 *** –0.19 *** –0.17 *** –0.02 –0.02 0.10 ** 0.13 ***
EU-Romania_x –0.11 *** –0.10 *** –0.29 *** –0.26 ***
EU-Switzerland 0.01 –0.04 0.09 –0.16 –0.15 –0.23 ** –0.06 0.03
EU-Switzerland_m 0.07 –0.09 0.04 –0.08 0.12 ** 0.20 *** 0.12 * 0.32 ***
EU-Switzerland_x 0.33 *** –0.01 0.32 *** –0.19 ***
EU-Syria 0.31 * 0.36 ** 0.09 0.17 0.28 0.34 ** –0.04 0.13
EU-Syria_m –0.19 *** –0.19 *** –0.20 *** –0.19 *** –0.03 –0.05 0.06 0.08
EU-Syria_x 0.00 0.00 –0.31 *** –0.29 ***
EU-Tunisia –0.14 –0.09 –0.94 *** –0.69 *** –0.15 * –0.12 –0.88 *** –0.62 ***
EU-Tunisia_m –0.42 *** –0.29 *** –0.30 *** –0.20 *** –0.40 *** –0.23 *** –0.27 *** –0.14 ***
EU-Tunisia_x –0.45 *** –0.32 *** –0.46 *** –0.34 ***
EU-Turkey –0.19 ** –0.17 ** –0.08 –0.05 –0.17 ** –0.16 ** 0.01 0.06

��
(continued)
(table continues next page) (table continues next page)
(continued)
Using Using Using UsingSoloaga-Winters Rieder Soloaga-Winters RiederPTA indicators PTA indicators PTA indicators PTA indicators
Without With Without With Without With Without Withcountry country country country country country country country
Explanatory variable effects effects effects effects effects effects effects effects
Distance –1.0 *** –1.17 *** –1.02 *** –1.16 *** –1.12 *** –1.33 *** –1.10 *** –1.30 ***
Joint GDP 0.83 *** 0.92 *** 0.85 *** 1.08 *** 0.92 *** 1.02 *** 1.00 *** 1.84 ***
Joint GDP per capita –0.02 ** –0.35 *** –0.05 *** –0.50 *** –0.09 *** –0.45 *** –0.22 *** –1.26 ***
Common language 0.46 *** 0.37 *** 0.36 *** 0.35 *** 0.53 *** 0.53 *** 0.45 *** 0.50 ***
Common border 0.53 *** 0.39 *** 0.56 *** 0.37 *** 0.55 *** 0.34 *** 0.57 *** 0.30 ***
Landlocked –0.42 *** –2.11 *** –0.43 *** –6.19 *** –0.16 *** –0.52 –0.23 *** 2.12 ***
Island 0.37 *** –6.80 *** 0.33 *** –6.34 *** 0.35 *** 1.24 *** 0.28 *** 4.98 ***
Land area –0.10 *** –0.86 *** –0.12 *** –0.59 *** –0.18 *** 0.00 –0.25 *** –0.10 **
Common colonizer 0.05 0.55 *** –0.10 0.55 *** –0.15 ** 0.52 *** –0.30 *** 0.52 ***
Colony 0.01 0.04 0.13 0.14 0.44 *** 0.49 *** 0.64 *** 0.64 ***
Ever a colony 1.53 *** 1.37 *** 1.68 *** 1.38 *** 1.30 *** 1.21 *** 1.39 *** 1.23 ***
Common country 0.37 0.74 0.31 0.65 0.19 0.43 0.01 0.28
Currency union 0.69 *** 0.55 *** 0.74 *** 0.62 *** 0.40 *** 0.24 ** 0.48 *** 0.35 ***
GSP 0.06 *** 0.02 0.08 *** 0.01 0.05 *** 0.02 0.07 *** 0.00
Andean 0.35 *** 0.36 *** 0.01 0.12 0.15 0.23 ** 0.05 0.13
Andean_m –0.31 *** –0.21 *** –0.32 *** –0.24 *** –0.22 *** –0.35 *** –0.22 *** –0.44 ***
Andean_x –0.34 *** –0.21 *** 0.01 0.47 ***
ANZCERTA 0.61 * 0.63 ** 0.60 * 0.67 ** –0.46 –0.40 –0.26 –0.05
ANZCERTA_m 0.18 *** 0.24 *** 0.21 *** 0.25 *** 0.44 *** 0.55 *** 0.57 *** 0.70 ***
ANZCERTA_x –0.31 *** –0.31 *** –0.35 *** –0.41 ***
Armenia-Russia –1.1 0.03 –0.66 –3.62 *** –1.22 0.02 –0.71 –0.72
Armenia-Russia_m 0.00 2.08 *** –0.05 –3.69 *** –0.10 –1.43 *** –0.16 –0.76 ***
Armenia-Russia_x 0.39 –6.46 *** 0.58 * 0.48
ASEAN –0.63 *** –0.60 *** 0.15 0.26 *** –0.54 *** –0.57 *** 0.61 *** 0.64 ***
ASEAN_m 0.34 *** 0.42 *** 0.34 *** 0.39 *** 0.41 *** 0.51 *** 0.41 *** 0.48 ***
Table 10 Random effects estimates for total merchandise trade and trade in manufactures, using alternative PTA indicators, 1970–99
Trade in manufacturesTotal merchandise trade
EFTA-Romania 0.33 * 0.34 * –0.40 * –0.47 ** 0.11 0.10 –0.45 ** –0.47 **
EFTA-Romania_m –0.50 *** –0.59 *** –0.46 *** –0.55 *** –0.21 ** –0.31 *** –0.19 * –0.27 ***
EFTA-Romania_x –0.36 *** –0.44 *** –0.38 *** –0.55 ***
EFTA-Turkey –0.27 * –0.30 * 0.52 *** 0.61 *** –0.25 –0.30 * 0.62 *** 0.77 ***
EFTA-Turkey_m 0.50 *** 0.58 *** 0.50 *** 0.56 *** 0.49 *** 0.57 *** 0.53 *** 0.63 ***
EFTA-Turkey_x 0.48 *** 0.53 *** 0.70 *** 0.77 ***
EU –0.19 –0.23 * 0.31 ** 0.07 0.38 ** 0.30 * 0.95 *** 0.86 ***
EU_m 0.45 *** 0.22 *** 0.30 *** 0.22 *** 0.09 ** 0.28 *** 0.00 0.31 ***
EU_x 0.67 *** 0.49 *** 1.07 *** 0.66 ***
EU-Algeria –0.03 –0.04 –0.01 0.01 –0.34 * –0.34 * –0.06 –0.04
EU-Algeria_m 0.07 0.10 ** 0.08 0.10 ** 0.19 *** 0.22 *** 0.18 *** 0.21 ***
EU-Algeria_x –0.06 –0.03 0.01 0.05
EU-Bulgaria 0.23 *** 0.23 *** 0.15 * 0.17 ** 0.25 *** 0.25 *** 0.14 0.19 **
EU-Bulgaria_m –0.04 –0.03 –0.03 –0.03 0.01 –0.01 0.03 0.02
EU-Bulgaria_x –0.06 –0.05 –0.05 –0.03
EU-Iceland 0.00 0.03 0.09 0.34 *** –0.11 –0.12 –0.17 –0.29 **
EU-Iceland_m 0.06 0.31 *** 0.15 ** 0.29 *** 0.02 –0.01 –0.02 –0.21 **
EU-Iceland_x –0.22 *** 0.14 * –0.12 0.54 ***
EU-Norway 0.18 * 0.17 * 0.07 –0.02 –0.06 –0.05 –0.08 –0.11
EU-Norway_m –0.08 –0.14 ** –0.06 –0.13 * 0.07 0.02 0.10 0.09
EU-Norway_x –0.22 *** –0.22 *** –0.26 *** –0.44 ***
EU-Romania 0.26 *** 0.31 *** –0.18 ** –0.09 0.10 0.16 ** –0.21 *** –0.04
EU-Romania_m –0.22 *** –0.20 *** –0.19 *** –0.17 *** –0.02 –0.02 0.10 ** 0.13 ***
EU-Romania_x –0.11 *** –0.10 *** –0.29 *** –0.26 ***
EU-Switzerland 0.01 –0.04 0.09 –0.16 –0.15 –0.23 ** –0.06 0.03
EU-Switzerland_m 0.07 –0.09 0.04 –0.08 0.12 ** 0.20 *** 0.12 * 0.32 ***
EU-Switzerland_x 0.33 *** –0.01 0.32 *** –0.19 ***
EU-Syria 0.31 * 0.36 ** 0.09 0.17 0.28 0.34 ** –0.04 0.13
EU-Syria_m –0.19 *** –0.19 *** –0.20 *** –0.19 *** –0.03 –0.05 0.06 0.08
EU-Syria_x 0.00 0.00 –0.31 *** –0.29 ***
EU-Tunisia –0.14 –0.09 –0.94 *** –0.69 *** –0.15 * –0.12 –0.88 *** –0.62 ***
EU-Tunisia_m –0.42 *** –0.29 *** –0.30 *** –0.20 *** –0.40 *** –0.23 *** –0.27 *** –0.14 ***
EU-Tunisia_x –0.45 *** –0.32 *** –0.46 *** –0.34 ***
EU-Turkey –0.19 ** –0.17 ** –0.08 –0.05 –0.17 ** –0.16 ** 0.01 0.06
EU-Turkey_m –0.01 –0.02 –0.03 –0.04 –0.02 –0.01 –0.05 –0.03
EU-Turkey_x 0.06 * 0.04 0.13 *** 0.09 ***
GCC 0.35 *** 0.29 *** 0.61 *** 0.14 –0.98 *** –1.01 *** 0.61 *** –0.27 ***
GCC_m 0.33 *** 0.16 *** 0.32 *** 0.10 *** 0.03 -0.20 *** –0.05 * –0.57 ***
GCC_x 0.00 –0.17 *** 1.77 *** 1.84 ***
Georgia-Kazakhstan –1.05 –1.03 –0.52 –0.42 –0.15 –0.16 0.12 0.16
Georgia-Kazakhstan_m 0.29 ** 0.26 * 0.28 ** 0.25 * 0.30 ** 0.24 * 0.30 ** 0.28 *
Georgia-Kazakhstan_x 0.26 * 0.32 ** –0.09 –0.03
Georgia-Russia –1.18 –0.16 –0.83 0.47 –1.29 0.09 –0.68 1.00
Georgia-Russia_m 0.24 0.60 ** 0.23 0.56 ** 0.31 * 0.86 *** 0.29 0.82 ***
Georgia-Russia_x –0.36 * –0.42 0.16 0.35
GSTP 0.18 *** 0.15 *** 0.40 *** 0.36 *** 0.20 *** 0.16 *** 0.48 *** 0.36 ***
GSTP_m 0.06 *** 0.06 *** –0.02 –0.03 * –0.09 *** –0.10 *** –0.25 *** –0.28 ***
GSTP_x 0.06 *** 0.06 *** 0.30 *** 0.35 ***
Israel-Turkey –0.08 –0.19 0.54 0.60 0.29 0.15 0.98 * 0.87 *
Israel-Turkey_m 0.00 0.14 0.00 0.11 –0.05 0.09 –0.06 0.01
Israel-Turkey_x 0.30 *** 0.44 *** 0.34 *** 0.48 ***
Kyrgyz Republic–Kazakhstan 0.20 0.72 0.52 0.23 0.23 0.83 0.77 0.30
Kyrgyz Republic–Kazakhstan_ 0.06 –0.45 ** 0.06 –0.43 * 0.16 –0.53 ** 0.18 –0.55 **
Kyrgyz Republic–Kazakhstan_ 0.12 –0.46 * 0.38 ** –0.57 **
Kyrgyz Republic–Russia –1.78 –1.00 –0.05 –2.68 *** –1.14 –0.05 0.77 0.22
Kyrgyz Republic–Russia_m 0.91 *** 4.67 *** 0.95 *** –1.60 *** 0.87 *** –0.41 0.93 *** 0.33 *
Kyrgyz Republic–Russia_x 1.06 *** –3.10 *** 0.95 *** 1.96 ***
LAIA –0.40 *** –0.41 *** –0.05 –0.11 ** –0.61 *** –0.58 *** –0.26 *** –0.37 ***
LAIA_m 0.06 ** 0.05 ** 0.03 0.03 0.09 *** 0.02 0.04 –0.03
LAIA_x 0.42 *** 0.38 *** 0.42 *** 0.43 ***
Laos-Thailand –0.27 –0.17 1.03 *** 1.32 *** –1.26 *** –1.10 *** 0.40 0.67
Laos-Thailand_m 0.48 *** 0.60 *** 0.46 *** 0.59 *** 0.36 *** 0.50 *** 0.36 *** 0.53 ***
Laos-Thailand_x 0.53 *** 0.64 *** 0.76 *** 0.88 ***
Mercosur 0.23 0.23 0.67 *** 0.69 *** 0.42 *** 0.42 *** 0.73 *** 0.82 ***
Mercosur_m 0.52 *** 0.55 *** 0.53 *** 0.57 *** 0.57 *** 0.64 *** 0.60 *** 0.71 ***
Mercosur_x –0.11 *** –0.13 *** –0.41 *** –0.49 ***
NAFTA 0.50 ** 0.56 *** 0.65 *** 0.66 *** 0.40 * 0.47 ** 0.63 *** 0.71 ***
NAFTA_m 0.24 *** 0.23 *** 0.24 *** 0.23 *** 0.46 *** 0.47 *** 0.51 *** 0.56 ***

��
Using Using Using UsingSoloaga-Winters Rieder Soloaga-Winters RiederPTA indicators PTA indicators PTA indicators PTA indicators
Without With Without With Without With Without Withcountry country country country country country country country
Explanatory variable effects effects effects effects effects effects effects effects
Distance –1.0 *** –1.17 *** –1.02 *** –1.16 *** –1.12 *** –1.33 *** –1.10 *** –1.30 ***
Joint GDP 0.83 *** 0.92 *** 0.85 *** 1.08 *** 0.92 *** 1.02 *** 1.00 *** 1.84 ***
Joint GDP per capita –0.02 ** –0.35 *** –0.05 *** –0.50 *** –0.09 *** –0.45 *** –0.22 *** –1.26 ***
Common language 0.46 *** 0.37 *** 0.36 *** 0.35 *** 0.53 *** 0.53 *** 0.45 *** 0.50 ***
Common border 0.53 *** 0.39 *** 0.56 *** 0.37 *** 0.55 *** 0.34 *** 0.57 *** 0.30 ***
Landlocked –0.42 *** –2.11 *** –0.43 *** –6.19 *** –0.16 *** –0.52 –0.23 *** 2.12 ***
Island 0.37 *** –6.80 *** 0.33 *** –6.34 *** 0.35 *** 1.24 *** 0.28 *** 4.98 ***
Land area –0.10 *** –0.86 *** –0.12 *** –0.59 *** –0.18 *** 0.00 –0.25 *** –0.10 **
Common colonizer 0.05 0.55 *** –0.10 0.55 *** –0.15 ** 0.52 *** –0.30 *** 0.52 ***
Colony 0.01 0.04 0.13 0.14 0.44 *** 0.49 *** 0.64 *** 0.64 ***
Ever a colony 1.53 *** 1.37 *** 1.68 *** 1.38 *** 1.30 *** 1.21 *** 1.39 *** 1.23 ***
Common country 0.37 0.74 0.31 0.65 0.19 0.43 0.01 0.28
Currency union 0.69 *** 0.55 *** 0.74 *** 0.62 *** 0.40 *** 0.24 ** 0.48 *** 0.35 ***
GSP 0.06 *** 0.02 0.08 *** 0.01 0.05 *** 0.02 0.07 *** 0.00
Andean 0.35 *** 0.36 *** 0.01 0.12 0.15 0.23 ** 0.05 0.13
Andean_m –0.31 *** –0.21 *** –0.32 *** –0.24 *** –0.22 *** –0.35 *** –0.22 *** –0.44 ***
Andean_x –0.34 *** –0.21 *** 0.01 0.47 ***
ANZCERTA 0.61 * 0.63 ** 0.60 * 0.67 ** –0.46 –0.40 –0.26 –0.05
ANZCERTA_m 0.18 *** 0.24 *** 0.21 *** 0.25 *** 0.44 *** 0.55 *** 0.57 *** 0.70 ***
ANZCERTA_x –0.31 *** –0.31 *** –0.35 *** –0.41 ***
Armenia-Russia –1.1 0.03 –0.66 –3.62 *** –1.22 0.02 –0.71 –0.72
Armenia-Russia_m 0.00 2.08 *** –0.05 –3.69 *** –0.10 –1.43 *** –0.16 –0.76 ***
Armenia-Russia_x 0.39 –6.46 *** 0.58 * 0.48
ASEAN –0.63 *** –0.60 *** 0.15 0.26 *** –0.54 *** –0.57 *** 0.61 *** 0.64 ***
ASEAN_m 0.34 *** 0.42 *** 0.34 *** 0.39 *** 0.41 *** 0.51 *** 0.41 *** 0.48 ***
Table 10 Random effects estimates for total merchandise trade and trade in manufactures, using alternative PTA indicators, 1970–99
Trade in manufacturesTotal merchandise trade
(continued)
(table continues next page)
EU-Turkey_m –0.01 –0.02 –0.03 –0.04 –0.02 –0.01 –0.05 –0.03
EU-Turkey_x 0.06 * 0.04 0.13 *** 0.09 ***
GCC 0.35 *** 0.29 *** 0.61 *** 0.14 –0.98 *** –1.01 *** 0.61 *** –0.27 ***
GCC_m 0.33 *** 0.16 *** 0.32 *** 0.10 *** 0.03 -0.20 *** –0.05 * –0.57 ***
GCC_x 0.00 –0.17 *** 1.77 *** 1.84 ***
Georgia-Kazakhstan –1.05 –1.03 –0.52 –0.42 –0.15 –0.16 0.12 0.16
Georgia-Kazakhstan_m 0.29 ** 0.26 * 0.28 ** 0.25 * 0.30 ** 0.24 * 0.30 ** 0.28 *
Georgia-Kazakhstan_x 0.26 * 0.32 ** –0.09 –0.03
Georgia-Russia –1.18 –0.16 –0.83 0.47 –1.29 0.09 –0.68 1.00
Georgia-Russia_m 0.24 0.60 ** 0.23 0.56 ** 0.31 * 0.86 *** 0.29 0.82 ***
Georgia-Russia_x –0.36 * –0.42 0.16 0.35
GSTP 0.18 *** 0.15 *** 0.40 *** 0.36 *** 0.20 *** 0.16 *** 0.48 *** 0.36 ***
GSTP_m 0.06 *** 0.06 *** –0.02 –0.03 * –0.09 *** –0.10 *** –0.25 *** –0.28 ***
GSTP_x 0.06 *** 0.06 *** 0.30 *** 0.35 ***
Israel-Turkey –0.08 –0.19 0.54 0.60 0.29 0.15 0.98 * 0.87 *
Israel-Turkey_m 0.00 0.14 0.00 0.11 –0.05 0.09 –0.06 0.01
Israel-Turkey_x 0.30 *** 0.44 *** 0.34 *** 0.48 ***
Kyrgyz Republic–Kazakhstan 0.20 0.72 0.52 0.23 0.23 0.83 0.77 0.30
Kyrgyz Republic–Kazakhstan_ 0.06 –0.45 ** 0.06 –0.43 * 0.16 –0.53 ** 0.18 –0.55 **
Kyrgyz Republic–Kazakhstan_ 0.12 –0.46 * 0.38 ** –0.57 **
Kyrgyz Republic–Russia –1.78 –1.00 –0.05 –2.68 *** –1.14 –0.05 0.77 0.22
Kyrgyz Republic–Russia_m 0.91 *** 4.67 *** 0.95 *** –1.60 *** 0.87 *** –0.41 0.93 *** 0.33 *
Kyrgyz Republic–Russia_x 1.06 *** –3.10 *** 0.95 *** 1.96 ***
LAIA –0.40 *** –0.41 *** –0.05 –0.11 ** –0.61 *** –0.58 *** –0.26 *** –0.37 ***
LAIA_m 0.06 ** 0.05 ** 0.03 0.03 0.09 *** 0.02 0.04 –0.03
LAIA_x 0.42 *** 0.38 *** 0.42 *** 0.43 ***
Laos-Thailand –0.27 –0.17 1.03 *** 1.32 *** –1.26 *** –1.10 *** 0.40 0.67
Laos-Thailand_m 0.48 *** 0.60 *** 0.46 *** 0.59 *** 0.36 *** 0.50 *** 0.36 *** 0.53 ***
Laos-Thailand_x 0.53 *** 0.64 *** 0.76 *** 0.88 ***
Mercosur 0.23 0.23 0.67 *** 0.69 *** 0.42 *** 0.42 *** 0.73 *** 0.82 ***
Mercosur_m 0.52 *** 0.55 *** 0.53 *** 0.57 *** 0.57 *** 0.64 *** 0.60 *** 0.71 ***
Mercosur_x –0.11 *** –0.13 *** –0.41 *** –0.49 ***
NAFTA 0.50 ** 0.56 *** 0.65 *** 0.66 *** 0.40 * 0.47 ** 0.63 *** 0.71 ***
NAFTA_m 0.24 *** 0.23 *** 0.24 *** 0.23 *** 0.46 *** 0.47 *** 0.51 *** 0.56 ***
NAFTA_x –0.06 ** –0.10 *** –0.17 *** –0.26 ***
PATCRA 0.55 0.64 * 0.39 0.46 –0.82 ** –0.60 –1.17 *** –1.09 ***
PATCRA_m –0.02 –0.03 –0.01 –0.03 0.05 0.03 0.10 * 0.05
PATCRA_x –0.20 *** –0.25 *** –0.63 *** –0.77 ***
PTN –0.04 –0.10 * 0.16 *** 0.47 *** 0.01 –0.06 0.24 *** 0.37 ***
PTN_m 0.11 *** 0.38 *** 0.10 *** 0.35 *** –0.01 0.22 *** –0.04 0.20 ***
PTN_x 0.03 0.27 *** 0.25 *** 0.40 ***
Romania-Moldova 2.12 ** 2.28 *** 1.84 * 2.45 *** 1.56 1.78 ** 1.08 1.97 **
Romania-Moldova_m 0.14 0.18 * 0.13 0.18 * 0.09 0.13 0.04 0.11
Romania-Moldova_x 0.09 0.12 0.00 0.12
Romania-Turkey –0.12 –0.25 0.17 0.07 0.29 0.12 0.72 0.60
Romania-Turkey_m –0.20 ** –0.17 * –0.18 * –0.15 –0.18 * –0.15 –0.16 –0.13
Romania-Turkey_x –0.11 –0.11 –0.08 –0.01
SAPTA –0.27 –0.34 ** 0.53 *** 0.35 ** –0.17 –0.26 0.44 ** 0.22
SAPTA_m 0.38 *** 0.34 *** 0.37 *** 0.34 *** 0.20 *** 0.16 *** 0.21 *** 0.19 ***
SAPTA_x 0.48 *** 0.41 *** 0.47 *** 0.35 ***
SPARTECA –0.24 * –0.19 –0.40 ** –0.39 *** 0.54 *** 0.60 *** 0.28 * 0.34 **
SPARTECA_m –0.09 ** –0.16 *** –0.10 ** –0.15 *** –0.16 *** –0.26 *** –0.20 *** –0.26 ***
SPARTECA_x 0.28 *** 0.20 *** 0.37 *** 0.43 ***
TRIPART 1.41 1.26 * –1.01 (dropped) –0.29 –0.28 –2.61 ** (dropped)
TRIPART_m –1.20 *** 3.55 *** –1.20 *** –1.24 * –1.03 *** –3.06 *** –1.19 *** 0.34
TRIPART_x –1.25 *** –6.76 *** –1.00 *** 0.00
US-Israel 0.40 0.50 * 0.08 0.09 0.23 0.37 –0.22 –0.16
US-Israel_m –0.18 *** –0.24 *** –0.18 *** –0.23 *** –0.05 –0.09 ** –0.04 –0.06
US-Israel_x –0.12 *** –0.20 *** –0.27 *** –0.36 ***
Constant –21.45 *** (dropped) –21.03 *** (dropped) –22.66 *** –26.55 *** –23.03 *** –53.62 ***
R-squared 0.57 0.70 0.55 0.69 0.52 0.75 0.49 0.75Observations (thousands) 200 200 200 200 176 176 176 176Groups (thousands) 11 11 11 11 10 10 10 10
Memorandum item: Trade creating versus trade diverting PTAs under alternative criteriaTrade creating PTAs (number) 1st PTA coefficient 14 17 16 16 9 12 14 15 Sum of PTA coefficients 25 33 22 24 27 29 25 28
_m_x

��
Using Using Using UsingSoloaga-Winters Rieder Soloaga-Winters RiederPTA indicators PTA indicators PTA indicators PTA indicators
Without With Without With Without With Without Withcountry country country country country country country country
Explanatory variable effects effects effects effects effects effects effects effects
Distance –1.0 *** –1.17 *** –1.02 *** –1.16 *** –1.12 *** –1.33 *** –1.10 *** –1.30 ***
Joint GDP 0.83 *** 0.92 *** 0.85 *** 1.08 *** 0.92 *** 1.02 *** 1.00 *** 1.84 ***
Joint GDP per capita –0.02 ** –0.35 *** –0.05 *** –0.50 *** –0.09 *** –0.45 *** –0.22 *** –1.26 ***
Common language 0.46 *** 0.37 *** 0.36 *** 0.35 *** 0.53 *** 0.53 *** 0.45 *** 0.50 ***
Common border 0.53 *** 0.39 *** 0.56 *** 0.37 *** 0.55 *** 0.34 *** 0.57 *** 0.30 ***
Landlocked –0.42 *** –2.11 *** –0.43 *** –6.19 *** –0.16 *** –0.52 –0.23 *** 2.12 ***
Island 0.37 *** –6.80 *** 0.33 *** –6.34 *** 0.35 *** 1.24 *** 0.28 *** 4.98 ***
Land area –0.10 *** –0.86 *** –0.12 *** –0.59 *** –0.18 *** 0.00 –0.25 *** –0.10 **
Common colonizer 0.05 0.55 *** –0.10 0.55 *** –0.15 ** 0.52 *** –0.30 *** 0.52 ***
Colony 0.01 0.04 0.13 0.14 0.44 *** 0.49 *** 0.64 *** 0.64 ***
Ever a colony 1.53 *** 1.37 *** 1.68 *** 1.38 *** 1.30 *** 1.21 *** 1.39 *** 1.23 ***
Common country 0.37 0.74 0.31 0.65 0.19 0.43 0.01 0.28
Currency union 0.69 *** 0.55 *** 0.74 *** 0.62 *** 0.40 *** 0.24 ** 0.48 *** 0.35 ***
GSP 0.06 *** 0.02 0.08 *** 0.01 0.05 *** 0.02 0.07 *** 0.00
Andean 0.35 *** 0.36 *** 0.01 0.12 0.15 0.23 ** 0.05 0.13
Andean_m –0.31 *** –0.21 *** –0.32 *** –0.24 *** –0.22 *** –0.35 *** –0.22 *** –0.44 ***
Andean_x –0.34 *** –0.21 *** 0.01 0.47 ***
ANZCERTA 0.61 * 0.63 ** 0.60 * 0.67 ** –0.46 –0.40 –0.26 –0.05
ANZCERTA_m 0.18 *** 0.24 *** 0.21 *** 0.25 *** 0.44 *** 0.55 *** 0.57 *** 0.70 ***
ANZCERTA_x –0.31 *** –0.31 *** –0.35 *** –0.41 ***
Armenia-Russia –1.1 0.03 –0.66 –3.62 *** –1.22 0.02 –0.71 –0.72
Armenia-Russia_m 0.00 2.08 *** –0.05 –3.69 *** –0.10 –1.43 *** –0.16 –0.76 ***
Armenia-Russia_x 0.39 –6.46 *** 0.58 * 0.48
ASEAN –0.63 *** –0.60 *** 0.15 0.26 *** –0.54 *** –0.57 *** 0.61 *** 0.64 ***
ASEAN_m 0.34 *** 0.42 *** 0.34 *** 0.39 *** 0.41 *** 0.51 *** 0.41 *** 0.48 ***
Table 10 Random effects estimates for total merchandise trade and trade in manufactures, using alternative PTA indicators, 1970–99
Trade in manufacturesTotal merchandise trade
(continued) (continued)
NAFTA_x –0.06 ** –0.10 *** –0.17 *** –0.26 ***
PATCRA 0.55 0.64 * 0.39 0.46 –0.82 ** –0.60 –1.17 *** –1.09 ***
PATCRA_m –0.02 –0.03 –0.01 –0.03 0.05 0.03 0.10 * 0.05
PATCRA_x –0.20 *** –0.25 *** –0.63 *** –0.77 ***
PTN –0.04 –0.10 * 0.16 *** 0.47 *** 0.01 –0.06 0.24 *** 0.37 ***
PTN_m 0.11 *** 0.38 *** 0.10 *** 0.35 *** –0.01 0.22 *** –0.04 0.20 ***
PTN_x 0.03 0.27 *** 0.25 *** 0.40 ***
Romania-Moldova 2.12 ** 2.28 *** 1.84 * 2.45 *** 1.56 1.78 ** 1.08 1.97 **
Romania-Moldova_m 0.14 0.18 * 0.13 0.18 * 0.09 0.13 0.04 0.11
Romania-Moldova_x 0.09 0.12 0.00 0.12
Romania-Turkey –0.12 –0.25 0.17 0.07 0.29 0.12 0.72 0.60
Romania-Turkey_m –0.20 ** –0.17 * –0.18 * –0.15 –0.18 * –0.15 –0.16 –0.13
Romania-Turkey_x –0.11 –0.11 –0.08 –0.01
SAPTA –0.27 –0.34 ** 0.53 *** 0.35 ** –0.17 –0.26 0.44 ** 0.22
SAPTA_m 0.38 *** 0.34 *** 0.37 *** 0.34 *** 0.20 *** 0.16 *** 0.21 *** 0.19 ***
SAPTA_x 0.48 *** 0.41 *** 0.47 *** 0.35 ***
SPARTECA –0.24 * –0.19 –0.40 ** –0.39 *** 0.54 *** 0.60 *** 0.28 * 0.34 **
SPARTECA_m –0.09 ** –0.16 *** –0.10 ** –0.15 *** –0.16 *** –0.26 *** –0.20 *** –0.26 ***
SPARTECA_x 0.28 *** 0.20 *** 0.37 *** 0.43 ***
TRIPART 1.41 1.26 * –1.01 (dropped) –0.29 –0.28 –2.61 ** (dropped)
TRIPART_m –1.20 *** 3.55 *** –1.20 *** –1.24 * –1.03 *** –3.06 *** –1.19 *** 0.34
TRIPART_x –1.25 *** –6.76 *** –1.00 *** 0.00
US-Israel 0.40 0.50 * 0.08 0.09 0.23 0.37 –0.22 –0.16
US-Israel_m –0.18 *** –0.24 *** –0.18 *** –0.23 *** –0.05 –0.09 ** –0.04 –0.06
US-Israel_x –0.12 *** –0.20 *** –0.27 *** –0.36 ***
Constant –21.45 *** (dropped) –21.03 *** (dropped) –22.66 *** –26.55 *** –23.03 *** –53.62 ***
R-squared 0.57 0.70 0.55 0.69 0.52 0.75 0.49 0.75Observations (thousands) 200 200 200 200 176 176 176 176Groups (thousands) 11 11 11 11 10 10 10 10
Memorandum item: Trade creating versus trade diverting PTAs under alternative criteriaTrade creating PTAs (number) 1st PTA coefficient 14 17 16 16 9 12 14 15 Sum of PTA coefficients 25 33 22 24 27 29 25 28
Trade diverting PTAs (number) 1st PTA coefficient 7 9 5 6 10 10 7 7 Sum of PTA coefficients 17 12 12 15 17 15 10 11
Sources : Table 9 and author's calculations based on generalized least squares estimation of the Rose (2004) gravity model with random effects, using a combined version of the Rose (2004) and the Feenstra-Lipsey (2005) datasets.
Notes: Regressand is log real trade. Distance, joint GDP, joint GDP per capita, and land area are measured in log terms. Truncated (censored) data exclude (include)
zero-value trade flows. Estimated year and country effects are not reported. Pseudo R-squared values are reported for the Tobit regressions. ***, **, * indicate statistical significance at the 99, 95 , and 90 percent levels, respectively. Groups are numbers of country-pair-commodity combinations. Estimates in bold are PTAs with significant negative 1st PTA coefficients. Shaded estimates indicate PTAs with negative sum of significant PTA coefficients.

��
Overall trade
Imports Exports Imports Exports
Andean Community –5.8 –0.2 –7.9 –10.4 –18.5 a 0.0 0.0 –8.8 0.0 –8.8a
ANZCERTA 75.1 3.2 13.0 –12.7 3.4 95.4 4.0 13.6 0.0 17.6
Armenia-Russia –98.7 –0.3 276.0 –60.2 215.5 –97.3 –0.3 –38.4 0.0 –38.8a
ASEAN 43.3 5.0 23.2 31.5 59.7 29.7 3.4 21.2 0.0 24.6
BKA 47.7 1.3 42.0 24.7 67.9 0.0 0.0 41.1 0.0 41.1
Bulgaria-Turkey 194.5 1.2 40.6 29.9 71.7 400.3 2.5 40.6 0.0 43.1
Canada-Chile 33.6 0.1 7.6 8.0 15.6 0.0 0.0 8.1 0.0 8.1
Canada-Israel –50.3 –0.1 –12.0 –17.6 –29.6 a 0.0 0.0 –10.9 0.0 –10.9a
CEFTA 225.4 15.4 27.3 0.0 42.7 242.1 16.5 31.4 0.0 48.0
Chile-Mexico 131.6 0.6 35.0 18.2 53.8 0.0 0.0 36.7 0.0 36.7
CIS 2611.3 339.2 14.7 22.7 376.6 1791.6 232.7 14.7 0.0 247.4
EAEC –22.1 –1.9 –7.8 0.0 –9.7 a 0.0 0.0 –7.5 0.0 –7.5a
EFTA 76.83 3.9 6.2 26.2 36.3 27.1 1.5 4.6 0.0 6.1
EFTA-Bulgaria –49.3 –0.6 –21.9 –23.4 –45.9 a 0.0 0.0 –20.9 0.0 –20.9a
EFTA-Israel 49.2 0.6 32.0 22.7 55.3 0.0 0.0 30.4 0.0 30.4
EFTA-Romania –49.8 –0.6 –20.7 –18.6 –39.9 a –37.5 –0.5 –19.6 0.0 –20.1a
EFTA-Turkey 124.8 1.6 39.4 34.0 74.9 84.0 1.1 37.6 0.0 38.7
European Union 52.2 19.5 7.9 19.2 46.6 0.0 0.0 7.3 0.0 7.3
EU-Algeria 10.5 4.1 3.3 0.0 7.4 0.0 0.0 3.3 0.0 3.3
EU-Bulgaria 25.9 11.3 0.0 0.0 11.3 18.5 8.1 0.0 0.0 8.1
EU-Iceland 56.8 21.5 11.7 4.5 37.7 40.5 15.3 10.8 0.0 26.1
EU-Norway –17.3 –6.8 –4.1 –5.8 –16.7 a 0.0 0.0 –3.8 0.0 –3.8a
Intrabloc trade
Preferential trading arrangement
(percent change relative to overall trade)
(percent change)
(percent change relative to overall
trade)
Extrabloc trade Extrabloc tradeIntrabloc trade
(percent change
relative to overall trade)
Table 11 Impacts on total merchandise trade of 46 WTO-compiled PTAs, using different PTA indicators and coefficient estimates
Using Soloaga-Winters PTA indicators and estimates Using Rieder PTA indicators and estimates
Overall trade
(percent change
relative to overall trade) (percent change)
(percent change
relative to overall trade)
EU-Romania 1.0 0.4 –5.2 –2.7 –7.5 a 0.0 0.0 –4.5 0.0 –4.5a
EU-Switzerland 0.0 0.0 0.0 0.0 0.0 0.0 0.0 0.0 0.0 0.0
EU-Syria 18.5 7.3 –5.4 0.0 1.9 0.0 0.0 –5.0 0.0 –5.4a
EU-Tunisia –45.7 –20.8 –6.9 –7.4 –35.1 a –49.8 –22.7 –5.0 0.0 –27.7a
EU-Turkey –15.6 –7.1 0.0 0.0 –7.1 a 0.0 0.0 0.0 0.0 0.0
GCC 32.3 0.6 6.5 –9.4 –2.3 a 0.0 0.0 4.0 0.0 4.0
Georgia-Kazakhstan 78.6 0.0 10.8 23.9 34.8 0.0 0.0 10.4 0.0 10.4
Georgia-Russia 82.2 0.3 32.6 0.0 32.9 0.0 0.0 29.7 0.0 29.7
GSTP 31.0 3.7 2.7 2.7 9.1 43.3 5.1 –1.3 0.0 3.9
Israel-Turkey 55.3 0.3 0.0 22.3 22.6 0.0 0.0 0.0 0.0 0.0
Kyrgyz Republic–Kazakhstan –59.8 –0.9 –13.6 –22.6 –37.0 a 0.0 0.0 –13.1 0.0 –13.1a
Kyrgyz Republic–Russia 380.7 1.8 4,152.2 –57.5 4,096.4 –93.1 –0.4 –31.4 0.0 –31.8a
LAIA 2.0 0.2 2.1 23.2 25.5 –10.4 –0.8 0.0 0.0 –0.8a
Laos-Thailand 245.6 0.8 42.0 43.5 86.4 274.3 0.9 41.1 0.0 42.0
Mercosur 52.2 6.0 32.1 –5.4 32.7 99.4 11.4 33.7 0.0 45.1
NAFTA 99.4 24.2 11.0 –3.2 32.0 93.5 23.1 10.8 0.0 33.9
PATCRA 47.7 0.6 0.0 –11.0 –10.5 a 0.0 0.0 0.0 0.0 0.0
PTN 73.3 2.3 23.5 14.2 40.1 60.0 1.9 21.3 0.0 23.2
Romania-Moldova 1,070.5 7.7 10.6 0.0 18.4 1,058.8 7.7 10.6 0.0 18.3
Romania-Turkey –15.6 –0.1 –9.2 0.0 –9.3 a 0.0 0.0 0.0 0.0 0.0
SAPTA 50.7 1.0 20.8 23.7 45.5 41.9 0.8 20.8 0.0 21.6
SPARTECA 4.1 0.2 –7.0 10.5 3.7 –32.3 –1.8 –6.6 0.0 –8.4a
TRIPART –85.8 –0.4 1,908.1 –43.0 1,864.6 0.0 0.0 –40.1 0.0 –40.1a
US-Israel 6.2 0.0 –12.1 –7.8 –19.8 a 0.0 0.0 –11.6 0.0 –11.6a
Sources : Author's calculations based on mean levels of 1970–99 trade flows and significant coefficient estimates for the PTA indicator variables in the random effects variant of the augmented Rose gravity model in tables 9 and 12, with country fixed effects and using truncated data.
Notes: Unlike Soloaga-Winters PTA indicators, Rieder PTA indicators exclude intrabloc imports from extrabloc trade and do not consider bloc exports to nonmember
countries. a indicates PTAs that are calculated to be trade diverting on an overall net basis, holding all other factors constant.
(table continues next page)

��
Overall trade
Imports Exports Imports Exports
Andean Community –5.8 –0.2 –7.9 –10.4 –18.5 a 0.0 0.0 –8.8 0.0 –8.8a
ANZCERTA 75.1 3.2 13.0 –12.7 3.4 95.4 4.0 13.6 0.0 17.6
Armenia-Russia –98.7 –0.3 276.0 –60.2 215.5 –97.3 –0.3 –38.4 0.0 –38.8a
ASEAN 43.3 5.0 23.2 31.5 59.7 29.7 3.4 21.2 0.0 24.6
BKA 47.7 1.3 42.0 24.7 67.9 0.0 0.0 41.1 0.0 41.1
Bulgaria-Turkey 194.5 1.2 40.6 29.9 71.7 400.3 2.5 40.6 0.0 43.1
Canada-Chile 33.6 0.1 7.6 8.0 15.6 0.0 0.0 8.1 0.0 8.1
Canada-Israel –50.3 –0.1 –12.0 –17.6 –29.6 a 0.0 0.0 –10.9 0.0 –10.9a
CEFTA 225.4 15.4 27.3 0.0 42.7 242.1 16.5 31.4 0.0 48.0
Chile-Mexico 131.6 0.6 35.0 18.2 53.8 0.0 0.0 36.7 0.0 36.7
CIS 2611.3 339.2 14.7 22.7 376.6 1791.6 232.7 14.7 0.0 247.4
EAEC –22.1 –1.9 –7.8 0.0 –9.7 a 0.0 0.0 –7.5 0.0 –7.5a
EFTA 76.83 3.9 6.2 26.2 36.3 27.1 1.5 4.6 0.0 6.1
EFTA-Bulgaria –49.3 –0.6 –21.9 –23.4 –45.9 a 0.0 0.0 –20.9 0.0 –20.9a
EFTA-Israel 49.2 0.6 32.0 22.7 55.3 0.0 0.0 30.4 0.0 30.4
EFTA-Romania –49.8 –0.6 –20.7 –18.6 –39.9 a –37.5 –0.5 –19.6 0.0 –20.1a
EFTA-Turkey 124.8 1.6 39.4 34.0 74.9 84.0 1.1 37.6 0.0 38.7
European Union 52.2 19.5 7.9 19.2 46.6 0.0 0.0 7.3 0.0 7.3
EU-Algeria 10.5 4.1 3.3 0.0 7.4 0.0 0.0 3.3 0.0 3.3
EU-Bulgaria 25.9 11.3 0.0 0.0 11.3 18.5 8.1 0.0 0.0 8.1
EU-Iceland 56.8 21.5 11.7 4.5 37.7 40.5 15.3 10.8 0.0 26.1
EU-Norway –17.3 –6.8 –4.1 –5.8 –16.7 a 0.0 0.0 –3.8 0.0 –3.8a
Intrabloc trade
Preferential trading arrangement
(percent change relative to overall trade)
(percent change)
(percent change relative to overall
trade)
Extrabloc trade Extrabloc tradeIntrabloc trade
(percent change
relative to overall trade)
Table 11 Impacts on total merchandise trade of 46 WTO-compiled PTAs, using different PTA indicators and coefficient estimates
Using Soloaga-Winters PTA indicators and estimates Using Rieder PTA indicators and estimates
Overall trade
(percent change
relative to overall trade) (percent change)
(percent change
relative to overall trade)
EU-Romania 1.0 0.4 –5.2 –2.7 –7.5 a 0.0 0.0 –4.5 0.0 –4.5a
EU-Switzerland 0.0 0.0 0.0 0.0 0.0 0.0 0.0 0.0 0.0 0.0
EU-Syria 18.5 7.3 –5.4 0.0 1.9 0.0 0.0 –5.0 0.0 –5.4a
EU-Tunisia –45.7 –20.8 –6.9 –7.4 –35.1 a –49.8 –22.7 –5.0 0.0 –27.7a
EU-Turkey –15.6 –7.1 0.0 0.0 –7.1 a 0.0 0.0 0.0 0.0 0.0
GCC 32.3 0.6 6.5 –9.4 –2.3 a 0.0 0.0 4.0 0.0 4.0
Georgia-Kazakhstan 78.6 0.0 10.8 23.9 34.8 0.0 0.0 10.4 0.0 10.4
Georgia-Russia 82.2 0.3 32.6 0.0 32.9 0.0 0.0 29.7 0.0 29.7
GSTP 31.0 3.7 2.7 2.7 9.1 43.3 5.1 –1.3 0.0 3.9
Israel-Turkey 55.3 0.3 0.0 22.3 22.6 0.0 0.0 0.0 0.0 0.0
Kyrgyz Republic–Kazakhstan –59.8 –0.9 –13.6 –22.6 –37.0 a 0.0 0.0 –13.1 0.0 –13.1a
Kyrgyz Republic–Russia 380.7 1.8 4,152.2 –57.5 4,096.4 –93.1 –0.4 –31.4 0.0 –31.8a
LAIA 2.0 0.2 2.1 23.2 25.5 –10.4 –0.8 0.0 0.0 –0.8a
Laos-Thailand 245.6 0.8 42.0 43.5 86.4 274.3 0.9 41.1 0.0 42.0
Mercosur 52.2 6.0 32.1 –5.4 32.7 99.4 11.4 33.7 0.0 45.1
NAFTA 99.4 24.2 11.0 –3.2 32.0 93.5 23.1 10.8 0.0 33.9
PATCRA 47.7 0.6 0.0 –11.0 –10.5 a 0.0 0.0 0.0 0.0 0.0
PTN 73.3 2.3 23.5 14.2 40.1 60.0 1.9 21.3 0.0 23.2
Romania-Moldova 1,070.5 7.7 10.6 0.0 18.4 1,058.8 7.7 10.6 0.0 18.3
Romania-Turkey –15.6 –0.1 –9.2 0.0 –9.3 a 0.0 0.0 0.0 0.0 0.0
SAPTA 50.7 1.0 20.8 23.7 45.5 41.9 0.8 20.8 0.0 21.6
SPARTECA 4.1 0.2 –7.0 10.5 3.7 –32.3 –1.8 –6.6 0.0 –8.4a
TRIPART –85.8 –0.4 1,908.1 –43.0 1,864.6 0.0 0.0 –40.1 0.0 –40.1a
US-Israel 6.2 0.0 –12.1 –7.8 –19.8 a 0.0 0.0 –11.6 0.0 –11.6a
Sources : Author's calculations based on mean levels of 1970–99 trade flows and significant coefficient estimates for the PTA indicator variables in the random effects variant of the augmented Rose gravity model in tables 9 and 12, with country fixed effects and using truncated data.
Notes: Unlike Soloaga-Winters PTA indicators, Rieder PTA indicators exclude intrabloc imports from extrabloc trade and do not consider bloc exports to nonmember
countries. a indicates PTAs that are calculated to be trade diverting on an overall net basis, holding all other factors constant.
(cont’d)

�0
Imports Exports Imports Exports
Andean Community 41.9 1.7 –22.9 11.0 –10.2 a 0.0 0.0 –27.6 0.0 –27.6 a
ANZCERTA 16.2 0.8 54.1 –7.0 47.8 0.0 0.0 74.7 0.0 74.7
Armenia-Russia –76.0 –0.2 –37.7 0.0 –37.8 a 0.0 0.0 –26.4 0.0 –26.3 a
ASEAN 107.5 12.2 31.5 49.7 93.4 89.6 10.1 29.2 0.0 39.3
BKA 78.6 2.1 50.7 22.7 75.5 60.0 1.6 54.3 0.0 55.9
Bulgaria-Turkey 171.8 0.8 38.5 26.1 65.4 676.8 3.3 39.5 0.0 42.7
Canada-Chile 27.1 0.0 28.5 –8.1 20.4 0.0 0.0 33.6 0.0 33.6
Canada-Israel –52.8 –0.1 –18.4 –13.0 –31.4 a 0.0 0.0 –17.3 0.0 –17.3 a
CEFTA 29.7 1.8 32.1 –7.6 26.4 99.4 6.2 52.2 0.0 58.3
Chile-Mexico 99.4 0.4 30.7 12.4 43.4 0.0 0.0 31.5 0.0 31.5
CIS 1,528.1 95.7 24.5 19.6 139.9 1,180.7 73.9 30.6 0.0 104.5
EAEC 0.0 0.0 0.0 0.0 0.0 0.0 0.0 0.0 0.0 0.0
EFTA 122.6 6.5 7.6 30.2 44.3 47.7 2.8 2.8 0.0 5.57
EFTA-Bulgaria –79.8 –1.0 –28.9 –25.0 –54.9 a –51.3 –0.6 –25.2 0.0 –25.8 a
EFTA-Israel 58.4 0.6 44.1 11.4 56.1 0.0 0.0 43.1 0.0 43.1
EFTA-Romania –57.7 –0.7 –14.5 –18.9 –34.0 a –37.5 –0.5 –12.8 0.0 –13.3 a
EFTA-Turkey 182.9 2.2 43.2 49.4 94.8 116.0 1.4 49.3 0.0 50.7
European Union 245.6 96.2 8.4 32.6 137.2 136.3 55.4 8.4 0.0 63.8
EU-Algeria –11.3 –4.6 6.5 0.0 1.9 0.0 0.0 6.2 0.0 6.2
EU-Bulgaria 28.4 12.4 0.0 0.0 12.4 20.9 9.2 0.0 0.0 9.2
EU-Iceland 71.6 28.3 0.0 24.7 53.0 –25.2 –9.9 –4.9 0.0 –14.9 a
EU-Norway –35.6 –14.4 0.0 –12.0 –26.4 a 0.0 0.0 0.0 0.0 0.0
EU-Romania –9.5 –4.1 0.0 –7.0 –11.1 a 0.0 0.0 3.6 0.0 3.6
EU-Switzerland –19.8 –8.6 5.3 –5.6 –9.0 a 0.0 0.0 9.0 0.0 9.0
(percent change relative to overall
trade)
Extrabloc tradeOverall
trade Intrabloc trade Extrabloc trade
Table 12 Impacts on trade in manufactures of 46 WTO-compiled PTAs, using different PTA indicators and coefficient estimates
Overall trade
Using Soloaga-Winters PTA indicators and estimates Using Rieder PTA indicators and estimates
Intrabloc trade
Preferential trading arrangement
(percent change)
(percent change
relative to overall trade)
(percent change relative to overall
trade)
(percent change
relative to overall trade)
(percent change
relative to overall trade)
(percent change)
(percent change
relative to overall trade)
EU-Syria 5.1 2.1 0.0 –8.4 –6.3 a 0.0 0.0 0.0 0.0 0.0
EU-Tunisia –43.5 –19.7 –5.3 –8.3 –33.3 a –46.2 –20.9 –3.4 0.0 –24.3 a
EU-Turkey –6.8 –3.1 0.0 2.7 –0.4 a 0.0 0.0 0.0 0.0 0.0
GCC 87.8 3.1 –15.3 64.3 52.1 –22.9 -0.8 –36.6 0.0 –37.4 a
Georgia-Kazakhstan 27.1 0.0 14.8 0.0 14.8 0.0 0.0 17.6 0.0 17.6
Georgia-Russia 136.3 0.3 67.7 0.0 68.0 0.0 0.0 63.1 0.0 63.1
GSTP 50.7 5.5 –4.7 16.8 17.6 43.3 4.7 –11.6 0.0 –7.0 a
Israel-Turkey 61.6 0.4 0.0 25.5 25.8 138.7 0.8 0.0 0.0 0.8
Kyrgyz Republic–Kazakhstan –66.7 –0.6 –22.0 –19.8 –42.4 a 0.0 0.0 –22.6 0.0 –22.62 a
Kyrgyz Republic–Russia 609.9 3.0 0.0 304.3 307.3 0.0 0.0 19.4 0.0 19.4
LAIA –13.9 –1.17 0.0 19.8 18.7 –30.9 –2.4 0.0 0.0 –2.4 a
Laos-Thailand 32.3 0.1 35.1 64.4 99.6 0.0 0.0 37.8 0.0 37.8
Mercosur 76.8 9.0 51.0 –12.2 47.8 127.0 14.8 58.8 0.0 73.7
NAFTA 97.4 23.9 26.1 –7.3 42.7 103.4 25.7 32.1 0.0 57.8
PATCRA –53.7 –0.4 0.0 –12.6 –13.0 a –66.4 –0.4 0.0 0.0 –0.4 a
PTN 85.9 2.6 12.8 22.1 37.5 44.8 1.4 11.5 0.0 12.9
Romania-Moldova 493.0 2.1 0.0 0.0 2.1 617.1 2.7 0.0 0.0 2.7
Romania-Turkey 0.0 0.0 0.0 0.0 0.0 0.0 0.0 0.0 0.0 0.0
SAPTA 66.5 1.1 7.4 23.4 31.9 0.0 0.0 8.9 0.0 8.9
SPARTECA 116.0 6.8 –17.0 10.8 0.6 40.5 2.4 –17.0 0.0 –14.6 a
TRIPART –96.5 –0.3 –55.3 0.0 –55.6 a 0.0 0.0 0.0 0.0 0.0
US-Israel –36.2 –0.3 –4.8 –13.1 –18.2 a 0.0 0.0 0.0 0.0 0.0
Sources : Author's calculations based on mean levels of 1970–99 trade flows and significant coefficient estimates for the PTA indicator variables in the random effects variant of the augmented Rose gravity model in tables 9 and 12, with country fixed effects and using truncated data.
Notes: Unlike Soloaga-Winters PTA indicators, Rieder PTA indicators exclude intrabloc imports from extrabloc trade and do not consider bloc exports to
nonmember countries. a Indicates PTAs that are calculated to be trade diverting on an overall net basis, holding all other factors constant.
(table continues next page)
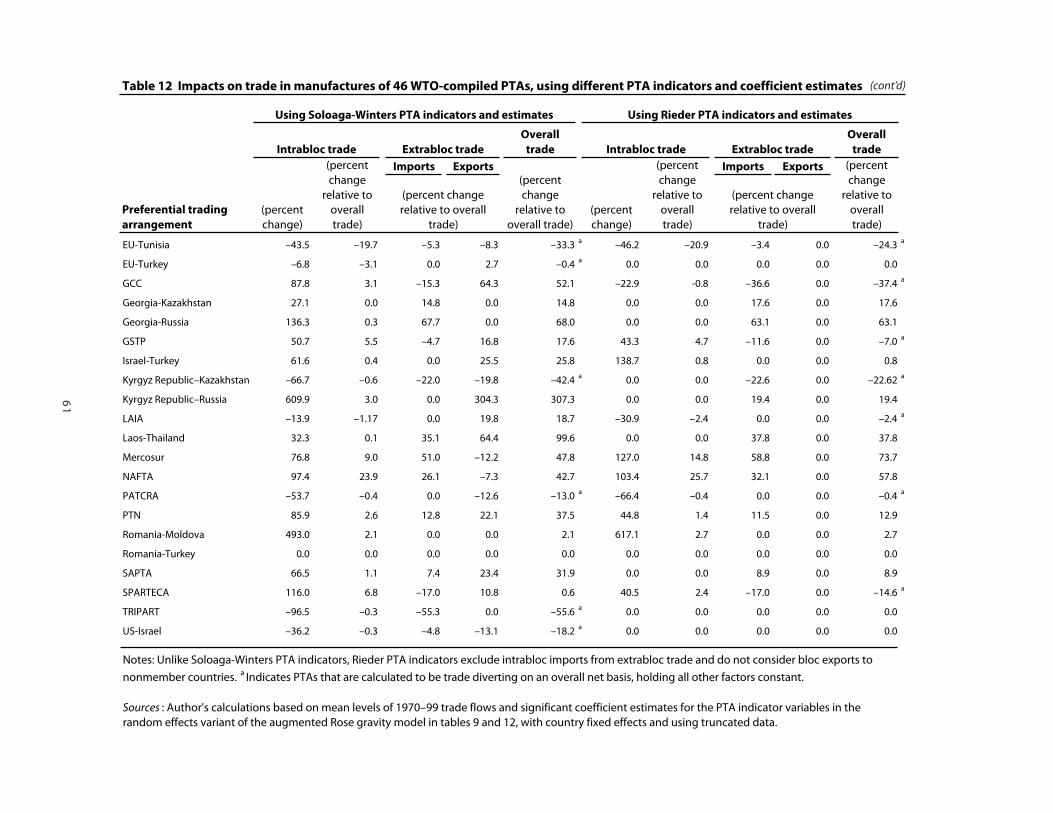
��
EU-Syria 5.1 2.1 0.0 –8.4 –6.3 a 0.0 0.0 0.0 0.0 0.0
EU-Tunisia –43.5 –19.7 –5.3 –8.3 –33.3 a –46.2 –20.9 –3.4 0.0 –24.3 a
EU-Turkey –6.8 –3.1 0.0 2.7 –0.4 a 0.0 0.0 0.0 0.0 0.0
GCC 87.8 3.1 –15.3 64.3 52.1 –22.9 -0.8 –36.6 0.0 –37.4 a
Georgia-Kazakhstan 27.1 0.0 14.8 0.0 14.8 0.0 0.0 17.6 0.0 17.6
Georgia-Russia 136.3 0.3 67.7 0.0 68.0 0.0 0.0 63.1 0.0 63.1
GSTP 50.7 5.5 –4.7 16.8 17.6 43.3 4.7 –11.6 0.0 –7.0 a
Israel-Turkey 61.6 0.4 0.0 25.5 25.8 138.7 0.8 0.0 0.0 0.8
Kyrgyz Republic–Kazakhstan –66.7 –0.6 –22.0 –19.8 –42.4 a 0.0 0.0 –22.6 0.0 –22.62 a
Kyrgyz Republic–Russia 609.9 3.0 0.0 304.3 307.3 0.0 0.0 19.4 0.0 19.4
LAIA –13.9 –1.17 0.0 19.8 18.7 –30.9 –2.4 0.0 0.0 –2.4 a
Laos-Thailand 32.3 0.1 35.1 64.4 99.6 0.0 0.0 37.8 0.0 37.8
Mercosur 76.8 9.0 51.0 –12.2 47.8 127.0 14.8 58.8 0.0 73.7
NAFTA 97.4 23.9 26.1 –7.3 42.7 103.4 25.7 32.1 0.0 57.8
PATCRA –53.7 –0.4 0.0 –12.6 –13.0 a –66.4 –0.4 0.0 0.0 –0.4 a
PTN 85.9 2.6 12.8 22.1 37.5 44.8 1.4 11.5 0.0 12.9
Romania-Moldova 493.0 2.1 0.0 0.0 2.1 617.1 2.7 0.0 0.0 2.7
Romania-Turkey 0.0 0.0 0.0 0.0 0.0 0.0 0.0 0.0 0.0 0.0
SAPTA 66.5 1.1 7.4 23.4 31.9 0.0 0.0 8.9 0.0 8.9
SPARTECA 116.0 6.8 –17.0 10.8 0.6 40.5 2.4 –17.0 0.0 –14.6 a
TRIPART –96.5 –0.3 –55.3 0.0 –55.6 a 0.0 0.0 0.0 0.0 0.0
US-Israel –36.2 –0.3 –4.8 –13.1 –18.2 a 0.0 0.0 0.0 0.0 0.0
Sources : Author's calculations based on mean levels of 1970–99 trade flows and significant coefficient estimates for the PTA indicator variables in the random effects variant of the augmented Rose gravity model in tables 9 and 12, with country fixed effects and using truncated data.
Notes: Unlike Soloaga-Winters PTA indicators, Rieder PTA indicators exclude intrabloc imports from extrabloc trade and do not consider bloc exports to
nonmember countries. a Indicates PTAs that are calculated to be trade diverting on an overall net basis, holding all other factors constant.
Imports Exports Imports Exports
Andean Community 41.9 1.7 –22.9 11.0 –10.2 a 0.0 0.0 –27.6 0.0 –27.6 a
ANZCERTA 16.2 0.8 54.1 –7.0 47.8 0.0 0.0 74.7 0.0 74.7
Armenia-Russia –76.0 –0.2 –37.7 0.0 –37.8 a 0.0 0.0 –26.4 0.0 –26.3 a
ASEAN 107.5 12.2 31.5 49.7 93.4 89.6 10.1 29.2 0.0 39.3
BKA 78.6 2.1 50.7 22.7 75.5 60.0 1.6 54.3 0.0 55.9
Bulgaria-Turkey 171.8 0.8 38.5 26.1 65.4 676.8 3.3 39.5 0.0 42.7
Canada-Chile 27.1 0.0 28.5 –8.1 20.4 0.0 0.0 33.6 0.0 33.6
Canada-Israel –52.8 –0.1 –18.4 –13.0 –31.4 a 0.0 0.0 –17.3 0.0 –17.3 a
CEFTA 29.7 1.8 32.1 –7.6 26.4 99.4 6.2 52.2 0.0 58.3
Chile-Mexico 99.4 0.4 30.7 12.4 43.4 0.0 0.0 31.5 0.0 31.5
CIS 1,528.1 95.7 24.5 19.6 139.9 1,180.7 73.9 30.6 0.0 104.5
EAEC 0.0 0.0 0.0 0.0 0.0 0.0 0.0 0.0 0.0 0.0
EFTA 122.6 6.5 7.6 30.2 44.3 47.7 2.8 2.8 0.0 5.57
EFTA-Bulgaria –79.8 –1.0 –28.9 –25.0 –54.9 a –51.3 –0.6 –25.2 0.0 –25.8 a
EFTA-Israel 58.4 0.6 44.1 11.4 56.1 0.0 0.0 43.1 0.0 43.1
EFTA-Romania –57.7 –0.7 –14.5 –18.9 –34.0 a –37.5 –0.5 –12.8 0.0 –13.3 a
EFTA-Turkey 182.9 2.2 43.2 49.4 94.8 116.0 1.4 49.3 0.0 50.7
European Union 245.6 96.2 8.4 32.6 137.2 136.3 55.4 8.4 0.0 63.8
EU-Algeria –11.3 –4.6 6.5 0.0 1.9 0.0 0.0 6.2 0.0 6.2
EU-Bulgaria 28.4 12.4 0.0 0.0 12.4 20.9 9.2 0.0 0.0 9.2
EU-Iceland 71.6 28.3 0.0 24.7 53.0 –25.2 –9.9 –4.9 0.0 –14.9 a
EU-Norway –35.6 –14.4 0.0 –12.0 –26.4 a 0.0 0.0 0.0 0.0 0.0
EU-Romania –9.5 –4.1 0.0 –7.0 –11.1 a 0.0 0.0 3.6 0.0 3.6
EU-Switzerland –19.8 –8.6 5.3 –5.6 –9.0 a 0.0 0.0 9.0 0.0 9.0
(percent change relative to overall
trade)
Extrabloc tradeOverall
trade Intrabloc trade Extrabloc trade
Table 12 Impacts on trade in manufactures of 46 WTO-compiled PTAs, using different PTA indicators and coefficient estimates
Overall trade
Using Soloaga-Winters PTA indicators and estimates Using Rieder PTA indicators and estimates
Intrabloc trade
Preferential trading arrangement
(percent change)
(percent change
relative to overall trade)
(percent change relative to overall
trade)
(percent change
relative to overall trade)
(percent change
relative to overall trade)
(percent change)
(percent change
relative to overall trade)
(cont’d)