working paper #2 needs analysis
TRANSCRIPT

Working Paper #2Needs Analysis
COA Project No. 7612.91July 2010

Table of ContentsIntroduction .............................................................................. 1
Importance of Non-motorized Transportation ...........................................1
Types of System Users ............................................................ 2Pedestrians .......................................................................................................2Cyclists ..............................................................................................................2Equestrians .......................................................................................................2
System Use ............................................................................... 2Albuquerque’s Historic Cycling Activity .....................................................2Current System Use Counts ...........................................................................3
Bicycle Crash Analysis ............................................................16Bicycle Crashes By Time of Day/Week/Year ................................................17Crashes by Street and Intersection .............................................................18
Online Survey .........................................................................23Demographics ...............................................................................................23Bicycle Habits and Travel Behavior ..............................................................24Infrastructure Preferences .............................................................................25Bicycle Parking ................................................................................................25Female Cyclists ...............................................................................................26Geographic Analysis .....................................................................................29Key Findings From the Analysis ....................................................................31Conclusions and Recommendations ..........................................................32
Appendix A – The Needs of Casual and Experienced Cyclists .................................................................................33
Appendix B – Raw 2010 Count Data .................................35Appendix C – Raw Survey Results ......................................90

1
Needs Analysis
IntroductionThis working paper presents an overview of the needs of bicyclists and trail users in Albuquerque. Adequately identifying user needs enables system planners and policy-makers to develop cost-effective solutions for improving the region’s bikeway and multi-use trail network. This report provides an overview of cyclist volumes and behaviors at many locations throughout the city discusses public input gathered through an online user survey and examines cyclist safety by analyzing reported bicycle crash data. This information will be used in conjunction with field visits, input gathered at public meetings, stakeholder interviews and analysis of the existing bikeways and multi-use trail network to inform future project recommendations.
Importance of Non-motorized TransportationBiking and trail use is important to Albuquerque’s future due to its potential to address several interrelated challenges, including traffic, air quality, and public health. By planning a metropolitan area that is more accessible to non-motorized transportation, practitioners can affect all of these areas, which collectively can have a profound influence on existing and future quality of life in Albuquerque. As the state Bicycle-Pedestrian-Equestrian Advisory Plan states, walking and bicycling are already “significant modes of transportation in New Mexico.” Significant opportunities and reasons remain to expand the non-motorized transportation network and improve the quality of the user experience.Traffic and Air QualityEach time an Albuquerque driver chooses to walk or bike, one less motor vehicle trip is made. As Albuquerque becomes more inviting to pedestrians and cyclists, increasing numbers of shopping, dining, school, and recreational trips will be made via multi-use trails and bikeways. Cumulatively, this pattern may reduce traffic in some neighbor-hoods, which can also improve air quality.Potential User BaseNearly one-third of Americans do not drive, this includes children under 16, about 20 percent of residents over 65 and other residents over 16 that cannot afford or choose not to own a motor vehicle. Also included in this user base are people that own cars but choose to walk or bike and people that would like to walk and bike but feel that signifi-cant barriers exist (e.g., physical barriers such as missing facilities or perceptual such as a lack of time). Public HealthIn recent years, public health professionals and urban planners have become increasingly aware that the impacts of motor vehicles on public health extend far beyond asthma and other respiratory conditions caused by air pollution. There is a much deeper understanding of the connection between the lack of physical activity resulting from auto-ori-ented community designs and various health-related problems such as obesity and other chronic diseases. Although diet and genetic predisposition contribute to these conditions, physical inactivity is now widely understood to play a significant role in the most common chronic diseases in the U.S., including coronary heart disease, stroke, and diabe-tes1. In response to these trends, the public health profession has begun to advocate for the creation of walkable and bikeable neighborhoods as one of the most effective ways to encourage active lifestyles. Studies show that 43 percent of people with safe places to walk within ten minutes of home meet recommended daily activity levels, compared to only 27 percent of those without safe places to walk2.
Data collected by the Center for Disease Control (CDC) between 1995 and 2007 indicates that the percentage of New Mexican residents classified as obese has increased from the 10 to 14 percent range in 1995 to the 20 to 24 percent range in 2007. As Albuquerque becomes a more friendly to non-motorized transportation, residents will have more opportunities to exercise, ideally resulting in a higher proportion of residents achieving recommended daily activity levels.
1 McKenna, M.T., Taylor, W.R., Marks, J.S., & Koplan, J.P., “Current issues and challenges in chronic disease and control” in Chronic Disease Epidemiology and Control, 2nd edi-tion, American Public Health Assn., 1988.
2 Powell, K.E., Martin, L., Chowdhury, P.P., “Places to walk: Convenience and regular physical activity” in American Journal of Public Health, 2003.

2
Needs Analysis
Types of System UsersPedestriansThis group includes all travel that is primarily foot-powered including walkers, joggers, and in-line skaters. Pedestri-ans are typically looking for user facilities that provide connections to destinations for utilitarian trips, or for longer continuous facilities for exercise related trips. Key facilities for pedestrians include travelways with a smooth travel surface and infrastructure to enhance safety at roadway crossings.
CyclistsIt is important to understand that the needs and preferences of bicyclists vary depending on skill level, equipment, and/or trip purpose. For example, bicyclists who ride for recreational purposes may prefer scenic, winding, shared-use paths, while bicyclists who ride to work or for errands may prefer more direct on-street bicycle facilities. Child cyclists, seniors, and beginning adults may prefer shared-use paths, while experienced cyclists may prefer bicycle lanes. Also included are utilitarian cyclists who choose to live without a car and people who ride due to economic reasons. More detail on the types of cyclists and their needs is contained in Appendix A.
EquestriansAs with pedestrian and bicycle users, the needs of equestrian users vary with experience and relative levels of urbaniza-tion and trail development. In areas of higher use, equestrian users prefer facilities that provide adequate separation from other user types that may spook horses (e.g., cyclists or in-line skaters) and an unpaved trail tread. In the on-line survey approximately 10 percent of respondents reported riding Albuquerque’s multi-use trails.
System UseAlbuquerque’s Historic Cycling Activity Bicycle CommutingData from the 1990 and 2000 US Census, shown in Table 1, indicates that bicycle use for commuting purposes has remained static for last 20 years. This stable trend is reflected in the percentage mode share for all journey to work trips captured by the U.S. census data. This provides one measure of bicycle usage, but does not indicated that bicycle use for other trips (e.g., social trips, exercise trips and trips for other errands has not increased over the same time period.)
Table 1: Historic Bicycle Commute Data for AlbuquerqueJourney To Work Mode Splits 1990* 2000* 2006**Drove Alone 78.0% 77.7% 78.0%Carpool 12.1% 12.5% 11.4%Transit 2.0% 1.7% 2.0%Bicycle 1.2% 1.1% 1.2%Walk 2.9% 2.7% 2.4%Other 1.1% 0.7% 1.3%Work at Home 2.7% 3.6% 3.8%*U.S. Dicennieal Census** U.S. 2006 – 2008 American Community Survey
Figure 1 shows Albuquerque’s bicycle to work mode share in comparison to the national average and several other cit-ies in the western United States. Approximately 1.1 percent of Albuquerque’s population commutes by bicycle. This is consistent with several other cities in the general vicinity including Austin, Texas and Santa Fe, New Mexico.

3
Needs Analysis
Figure 1. 2006 ACS Bicycle Commute Mode Share
0.0%0.5%1.0%1.5%2.0%2.5%3.0%3.5%4.0%4.5%5.0%
United
States
Phoen
ix, AZ
Tucso
n, AZ
Los A
ngeles
, CA
Albuqu
erque
, NM
Santa
Fe, NM
Portlan
d, OR
Austin
, TX
Dallas
, TX
El Pas
o, TX
Housto
n, TX
Additional bicycle to work statistics of note obtained from the 2006 - 2008 American Community Survey include: •About 65 percent of Albuquerque’s bicycle commuters are male. This is consistent with the male/female ratio
reported in the online survey.•The average journey to work trip for individuals traveling by taxi, motorcycle, bicycle or other means was about
23 minutes, with the most frequent travel time being 10 – 20 minutes3. This is consistent with a travel distance of two to three miles. This is slightly longer than the average 16 minute travel time reported in the 1990 census data. The aggregated mode type could account for some of the variation in reported average travel times.
•About 25 percent of people who reported traveling to work via motorcycle, bicycle, taxi or other means did not have a motor vehicle available for their use.
•The industry reporting the highest number of people commuting via motorcycle, bicycle, taxi or other means was the educational services, health care and social assistance sector, which accounted for 31 percent of tabulated response. A significant portion of this population is likely affiliated with the University of New Mexico.
College Bicycle UseCurrent enrollment reported in at the University of New Mexico is about 25,721. Estimated bicycle mode share was not available for the University, but it is estimated the rates are about 10 percent, or about 2,500 bicycle commuters, which is consistent with rates reported by other universities across the United States4.
Current System Use CountsCount DataNon-motorized user counts were conducted on the Albuquerque area streets and trails to quantify utilization on both weekdays and weekends. These counts were collected at 37 weekday locations and 14 weekend locations between April 27, 2010 and May 22, 2010, and these locations are shown in Figure 2 and listed in Table 2. The counts re-sulted in volumes at 45 weekday locations and 18 weekend sites. (A number of locations counted both trails and on-street facilities.) The weekday locations were collected for two hours during both the AM (7:00 to 9:00 am) and PM (4:00 to 6:00 pm) peak commute periods. The weekend data was gathered for three hours from 9:00 am to 12:00 pm, primarily along trails. There were 13 sites where both weekday and weekend data were gathered.
The count locations for the on-street and trails systems were selected based upon the following criteria:1. Previous count data from 1997 was available for comparison.
3 Travel time for bicycle commute to work trips is aggregated in results reported by the U.S. Census Bureau in 2006 ACS data.4 Estimate is based on 2009-2010 enrollment figures of about 25,000 students. This 10 percent mode share estimate is based on assessments of bicycle mode share at universities across the US.

4
Needs Analysis
2. On-street intersection locations that are known to have numerous cyclists. This included most access loca-tions to the University of New Mexico and Kirtland Air Force Base.
3. Intersections along key on-street commuter routes4. Trail locations along key commuter trails such as the Bosque Trail, Paseo del Nordeste/Diversion Channel
Trail, and Tramway Trail5. Intersections in developing areas that will act as baseline data for future counts6. Nodes near areas that have poor non-motorized connectivity (Coors Blvd at Eagle Ranch Rd and Montaño
Rd)

5
Needs Analysis
2ND ST4TH ST
COORS BLVD
LOM
AS B
LVD
CEN
TRAL
AV
UNSER BLVD
MEN
AUL
BLVD
PASE
O D
EL N
ORT
E
TRAMWAY BLVD
EUBANK BLVD
CAN
DEL
ARIA
RD
COAL
AV
LEAD
AV
WYOMING BLVD
MO
NTA
NO
RD
EDITH BLVD
PASEO DEL VOLCAN
RIO GRANDE BLVD
ACAD
EMY
RD
SAN MATEO BLVD
TRAM
WAY
RD
ZUN
I RDLOUISIANA BLVD
JUAN TABO BLVD
SPAI
N R
D
BROADWAY BLVD
GIB
SON
BLV
D
MO
NTG
OM
ERY
BLVD
6TH STLA
DERA
DR
EASE
MEN
T
ALAM
EDA
BLVD
12TH ST
JEFFERSON ST
98TH ST
BRID
GE
BLVD
GOLF COURSE RD
UNIVERSITY BLVD
SAN PEDRO DR
ROY
AV
YALE BLVD
PARA
DISE
BLV
D
OSUN
A R
D
UNIVERSE BLVD
IND
IAN
SCH
OOL
RD
NM 528
VENTURA ST
ATRISCO DR
8TH ST
IRVING BLVD
ELLI
SON
DR
COM
ANCH
E RD
SAN
AN
TON
IO D
R PENNSYLVANIA ST
TINGLEY DR
SOUT
HER
N A
V
LAYT
ON A
V
WES
TSID
E B
LVD
WES
TERN
TRL
LYON BLVD
ILIF
F R
D
CAN
DEL
ARIA
RD
CEN
TRAL
AV
I-40
I-40
I-25
I-25
City
of
Albu
quer
que
Albu
quer
que
Bicy
cle
Mas
ter
Plan
- U
ser
Nee
ds A
naly
sis
Map
1 -
201
0 Co
unt
Loca
tion
s
02
41
Mile
s
Cou
nt T
ype Wee
kday
Tra
il
Wee
kday
On-
stre
et
Wee
kday
Onl
y Tr
ail
Both
Tra
il
Both
On-
Stre
et

6
Needs Analysis
Table 2: 2010 Bicycle CountsNo. Locations 1997 Count Weekday Weekend1 Bear Canyon Trail @ Morris N X 2 Bear Canyon Trail @ Wyoming Y X 3 Pennsylvania @ Indian School N X 4 Pennsylvania @ Embudo Trail N X X5 UNM - Yale @ Lomas Y X 6 UNM - Campus @ Girard Y X 7 UNM - MLK @ University Y X 8 UNM - Paseo del Nordeste @ Tucker N X X9 UNM - Yale @ Central Y X 10 UNM - Stanford @ Central Y X 11 UNM - Cornell @ Central N X 12 Silver Ave @ Buena Vista Y X 13 KAFB Wyoming Gate Y X 14 KAFB Eubank Gate N X 15 KAFB Louisiana Gate N X 16 KAFB Carlisle Gate N X 17 Tramway Blvd @ Central Ave N X X18 Tramway Blvd @ Spain N X 19 Tramway Blvd @ Embudo Trail N X X20 Bosque Trail @ Central Ave Y X X21 Bosque Trail @ Montaño Y X X22 Bosque Trail @ Paseo del Norte N X X23 Bosque Trail @ Alameda N X X24 Bosque Trail @ Rio Bravo Blvd N X25 Paseo del Nordeste @ N Diversion Channel Trail N X X26 North Diversion Channel @ Paseo del Norte N X X27 Paseo del Nordeste @ East I-40 Trail N X X28 Atrisco Rd @ I-40 Overcrossing Y X X29 Unser Blvd @ I-40 Trail N X 30 Coors Blvd @ Montaño Rd N X X31 Coors Blvd @ Eagle Ranch Rd N X 32 Paradise Blvd @ Golf Course Rd N X 33 Marquette @ 2nd St N X 34 Bridge Blvd @ Isleta Blvd N X 35 Arenal Rd @ Unser Blvd N X 36 Alameda Blvd @ 4th St N X 37 Candelaria Rd West of Edith N X 38 Woodmont Ave @ Rainbow Blvd N X
The weekday counts were collected to quantify commuter cycling traffic within the Albuquerque area. That traf-fic uses both the on-street and trail systems, and a large number of count locations were selected to determine what areas of the city experience commuter cyclists. The weekend counts were primarily collected to assess the number of recreational users of the trail system, thus the major non-motorized trail users were counted. Some on-street counts

7
Needs Analysis
were gathered at strategic locations with on-street bike lanes or shoulders along common recreational routes, or at key locations with limited non-motorized facilities.
On-street facilities collected data only for cyclists, while off-street trails quantified all non-motorized users. All in-tersection counts were collected as standard turning movement counts in 15 minute increments, with each turning movement counted separately. Mid-block and trail locations were collected in 15 minute increments with directional or turning movements collected depending upon the location.
Bicycle counts included both volumes and a number of additional characteristics. Each cyclist was identified as wear-ing or not wearing helmets. For on-street locations, cyclists were also noted where they rode on sidewalks rather than in the street. Traffic violations were quantified for on-street cyclists. The traffic violations were limited to non-com-pliance with traffic signal indications, running stop signs without slowing, and riding the incorrect direction within a bicycle lane (for instance, riding eastbound in an westbound lane). Cyclists who slowed considerably and looked for oncoming traffic at stop signs without a full stop were not considered to violate the traffic control, nor were cyclists who slowed without stopping to make a right turn at a traffic signal. The violations recorded were primarily traffic control violations. Because most of the on-street locations were signalized intersections, the violations at these intersections were running red lights. Few cyclists were seen running a red signal indication without first stopping at the approach. The second most common violation was riding on the wrong side of the street in a bike lane. Complete raw count data are provided in AppendixB.
The trail system counted each user that passed the specific location or intersection. The users were categorized as:1. Bicyclists2. Runners/Joggers3. Walkers4. Roller Bladers/Skateboarders5. Equestrians
Bicyclists were identified as wearing or not wearing helmets on trails as well. Some trail users had pets, primarily dogs, and each user with a pet was noted. A few users had multiple pets, but only the number of users with pets was count-ed, not the number of actual pets. Note that no user was observed with more then two pets. All pets were observed on leashes except for a few in the Bosque walking on the opposite side of the Riverside drain from the paved trail.
A series of summary tables contain the results of the counts. The weekday data are summarized by the AM and PM peak periods, each period representing two hours of data. The weekday on-street data quantify the approach and departure volumes (two-direction) at each intersection, resulting in double counting each user (an approach and a departure). The double counting results in accurate link volumes for each leg of the intersection.
The trail volumes were summarized considering all users. Link volumes were generated for each of the trail locations and major intersecting connectors. These link volumes quantify the bi-directional traffic during each two-hour data collection period. The weekend volumes, primarily counted on trails, quantify the three-hour count periods for each link listed. The weekend intersection locations have summary data only for bicycles.
Albuquerque has a number of unique employment areas, and the data for two of these areas, the University of New Mexico (UNM) and Kirtland Air Force Base (KAFB), have been separated from the other locations in the volume tables. The reason for the segregation is that in each case, most of the primary entry/exit points for each facility were counted to quantify the overall bicycle demand for that facility. This permits summary data for these locations.

8
Needs Analysis
Table 3: University of New Mexico Access Weekday Bicycle Volumes
Intersection
West Approach
East Approach
North Approach
South Approach
HelmetSide-walk
Viola-tionEnter Exit Enter Exit Enter Exit Enter Exit
AM Peak PeriodCentral @ Yale 4 8 18 11 9 53 49 8 23 39 11Central @ Cornell 6 5 17 17 10 31 29 9 26 11 1Central @ Stanford 3 4 12 9 3 32 30 3 15 7 2Campus @ Girard 10 10 87 97 14 4 4 4 69 6 24Lomas @ Yale 2 0 2 2 44 34 32 44 49 5 2MLK @ University 27 33 12 14 2 2 9 1 34 11 2AM Subtotal 52 60 148 150 82 156 153 69 216 79 42
PM Peak PeriodCentral @ Yale 23 32 20 16 71 41 42 67 38 91 8Central @ Cornell 30 37 27 33 73 59 57 58 45 57 7Central @ Stanford 34 30 24 23 50 30 20 45 39 35 0Campus @ Girard 103 100 36 41 11 7 5 7 92 4 13Lomas @ Yale 4 7 4 6 43 70 71 39 79 17 8MLK @ University 25 29 33 31 3 2 5 4 29 17 6PM Subtotal 219 235 144 150 251 209 200 220 322 221 42
Summary Statistics: AM Peak PM Peak TotalTotal Entering Volume: 435 814 1249Percent Wearing Helmets: 49.7% 39.6% 43.1%Percent on Sidewalk: 18.2% 27.1% 24.0%Percent Committing Violations: 9.7% 5.2% 6.7%
Collectively, the UNM area has the greatest amount of cycling traffic in the Albuquerque area. The university area also experiences the highest percentage of cyclists not wearing helmets and cyclists utilizing the sidewalks, primarily along Central Ave.
The Kirtland Air Force Base access was unique in that it accounts only for entering and exiting traffic. The KAFB gates also differed in that the count periods were moved forward a half hour from the count periods throughout the rest of the study area. The KAFB counts were collected from 6:30 to 8:30 am and from 3:30 to 5:30 pm. Observa-tion at the Eubank gate began at 6:15 am and concluded at 5:45, confirming that the peaks occurred within the data collection period. There was not an issue concerning traffic violations at the gate accesses, therefore that column was deleted. The Eubank Gate has two access points for cyclists – the vehicle gate and a new pedestrian-bicycle gate located to the south. Counts were conducted for each gate to establish utilization.

9
Needs Analysis
Table 4: Kirtland Air Force Base Access Weekday Bicycle Volumes
IntersectionEast-West Approach North-South Approach
Helmet SidewalkEnter Exit Enter ExitAM Peak PeriodEubank Gate 51 3 54 0Eubank Ped/Bike Gate 40 1 40 0Wyoming Gate 16 0 16 8Louisiana Gate 2 0 1 0Carlisle Gate 8 1 8 1AM Subtotal 2 0 115 5 119 9
PM Peak PeriodEubank Gate 2 79 79Eubank Ped/Bike Gate 1 9 8 1Wyoming Gate 0 14 14 6Louisiana Gate 0 1 1 0Carlisle Gate 0 12 11 0PM Subtotal 0 1 3 114 113 7
Summary Statistics: AM Peak PM Peak TotalTotal Entering Volume: 117 4 121Total Exiting Volume: 3 115 118Percent Wearing Helmets: 97.5% 95.8% 97.1%Percent on Sidewalk: 7.4% 5.9% 6.7%
This area exhibited the highest helmet usage in the Albuquerque area. The volumes reflect the commute patterns with heavy entering AM volumes and heavy exiting PM traffic. It is interesting to note that the Eubank gates accounted for 77 percent of the bicycle traffic to/from the base.
The weekday counts at the remaining intersection locations are contained in the following two tables. The data reflect directional bicycle traffic for each intersection leg counted.

10
Needs Analysis
Table 5: Albuquerque Count Locations - Weekday On-Street Bicycle Volumes
Intersection
West Approach
East Approach
North Approach
South Approach Hel-
metSide-walk
Viola-tionEnter Exit Enter Exit Enter Exit Enter Exit
AM Peak PeriodP.d. Nordeste @ Tucker 5 8 15 2 37 27 12 32 47 0 0Silver @ Buena Vista 6 10 22 17 16 20 17 14 27 0 27Unser Bl @ I-40 - - - - 1 1 1 1 2 0 N/AUnser Bl @ Arenal Rd 1 0 0 1 0 0 0 0 0 0 0Bridge Bl @ Isleta Bl 1 8 6 4 - - 7 2 5 2 0Alameda Bl @ Bosque 11 4 4 11 - - - - 11 8 N/AAlameda Bl @ 4th St 5 2 6 4 1 1 0 5 6 6 0Coors Bl @ Montaño 9 13 2 0 2 1 3 2 15 2 0Coors Bl @ Eagle Ranch 5 0 2 2 2 5 1 3 7 3 2Golf Course @ Paradise 3 1 0 0 1 0 0 3 3 2 0Rainbow @ Woodmont 0 1 0 0 13 0 0 12 3 13 7Tramway @ Central Ave 1 6 3 4 36 9 8 29 43 14 1Tramway @ P.d. Montañas - - - - 16 8 8 16 22 N/A N/ATramway @ Spain 9 2 9 4 14 20 17 23 44 0 0Morris @ Bear Arroyo - 3 - 0 9 0 1 7 9 1 0Wyoming @ Bear Arroyo - - - - 3 3 4 4 5 7 N/APenna. @ Ind. School 1 2 5 9 18 6 7 14 27 4 1Penna. @ P.d. Montañas - - - - 19 - 13 - 30 2 32nd St @ Marquette/Tijeras 1 9 8 2 3 3 2 9 3 1Candelaria Rd @ Arno St 3 2 2 3 - - - - 2 1 0

11
Needs Analysis
Table 6: Albuquerque Count Locations - Weekday On-Street Bicycle Volumes
Intersection
West Approach
East Approach
North Approach
South Approach Hel-
metSide-walk
Viola-tionEnter Exit Enter Exit Enter Exit Enter Exit
PM Peak PeriodP.d. Nordeste @ Tucker 2 13 46 1 32 85 41 22 96 0 3Silver @ Buena Vista 11 16 17 13 44 33 31 41 46 1 21Unser Bl @ I-40 2 2 0 0 N/AUnser Bl @ Arenal Rd 0 0 0 0 0 0 0 0 0 0 0Bridge Bl @ Isleta Bl 4 6 7 5 0 0 2 2 1 10 0Alameda Bl @ Bosque 3 8 8 3 8 5 N/AAlameda Bl @ 4th St 7 2 5 8 6 7 2 3 15 5 0Coors Bl @ Montaño 4 6 15 9 4 4 0 4 14 6 0Coors Bl @ Eagle Ranch 5 2 3 15 13 7 3 0 17 15 0Golf Course @ Paradise 3 1 3 8 1 2 6 2 5 8 1Rainbow @ Woodmont 0 0 1 0 1 3 2 1 4 1 0Tramway @ Central Ave 3 1 4 7 6 34 31 2 39 10 0Tramway @ P.d. Montañas - - - - 10 9 9 10 16 N/A N/ATramway @ Spain 7 7 6 3 13 22 22 16 44 0 0Morris @ Bear Arroyo - 0 - 16 3 6 21 2 22 1 0Wyoming @ Bear Arroyo - - - - 4 8 8 4 10 11 N/APenna. @ Ind. School 3 1 2 1 12 15 13 13 22 2 0Penna. @ P.d. Montañas - - - - 16 10 10 16 23 2 62nd St @ Marquette/Tijeras 7 8 0 0 1 2 3 1 8 0 0Candelaria Rd @ Arno St 5 7 7 5 - - - - 4 4 1
A number of items are noteworthy from this data. The Silver Ave-Buena Vista Dr intersection experienced the high-est number of traffic violations. This intersection is the only count site located on the existing Bicycle Boulevard, and has all-way stop traffic control. The high violation rate, 29.3 percent of all entering vehicles, is a concern. A second concern was for the high violation and low helmet usage at the Rainbow Blvd-Woodmont Ave intersection. The AM peak reflects middle school children traveling to school and it yielded a violation rate of 53.9 percent and helmet us-age of 23.1 percent. It appears that an educational program should focus on this area and age group.

12
Needs Analysis
Table 7: Albuquerque Count Locations - Weekday Trail Volumes
Intersection BicyclesRunner/ Jogger Walker Skater
Eques-trian Helmet Pets
AM Peak PeriodBosque Tr N of Alameda Bl 16 0 13 0 0 15 2Bosque Tr S of Alameda Bl 56 6 19 2 0 51 3Bosque Tr N of Paseo del Norte 52 7 21 0 1 40 6Bosque Tr S of Paseo del Norte 63 15 22 0 1 51 3Paseo del Norte Connector 23 3 7 0 0 19 3Bosque Tr N of Montaño Rd 60 7 9 0 0 48 0Bosque Tr S of Montaño Rd 70 9 3 0 0 58 2Montaño Rd Connector 26 4 10 0 0 20 2Bosque Tr N of Central Ave 51 5 14 0 0 47 1Tramway Tr N of P.d. Montañas 17 5 17 0 0 10 7Tramway Tr S of P.d. Montañas 14 11 23 0 0 7 11P.d. Montañas W of Tramway Tr 5 2 16 0 0 3 8Tramway Tr N of Spain 25 11 11 0 0 21 0Tramway Tr S of Spain 27 9 14 1 0 23 0Bear Arroyo E of Morris 12 9 29 0 0 11 17Bear Arroyo W of Morris 16 6 13 0 0 15 10Bear Arroyo E of Wyoming 3 3 6 0 0 2 1Bear Arroyo W of Wyoming 2 1 1 0 0 1 2P.d.l. Montañas E of Penna. 13 3 9 0 0 12 1P.d.l. Montañas W of Penna. 30 3 7 0 0 29 2I-40 Trail E of Unser Blvd 4 0 0 0 0 2 0I-40/Atrisco Overcrossing 7 0 26 0 0 2 0I-40 Trail E of Atrisco 3 0 7 0 0 1 0I-40 Tr E of Paseo del Nordeste 10 0 2 0 0 8 0Paseo del Nordeste N of I-40 Tr 84 4 3 0 0 68 0Paseo del Nordeste S of I-40 Tr 82 4 3 0 0 66 0P.d. Nordeste S of Div Chan Tr 76 4 13 0 0 64 0P.d. Nordeste E of Div Chan Tr 43 4 17 1 0 43 0Div. Channel Tr N of P.d. Nord. 69 4 14 1 0 57 0Div. Channel Tr N of P.d. Norte 14 3 2 0 0 14 0Div. Channel Tr S of P.d. Norte 41 6 6 0 0 38 0Paseo del Norte Tr Connector. 35 5 4 0 0 32 0

13
Needs Analysis
Table 8: Albuquerque Count Locations - Weekday Trail Volumes
Intersection BicyclesRunner/ Jogger Walker Skater
Eques-trian Helmet Pets
PM Peak PeriodBosque Tr N of Alameda Bl 32 0 24 0 0 26 3Bosque Tr S of Alameda Bl 97 7 32 0 0 79 4Bosque Tr N of Paseo del Norte 90 26 4 0 2 64 0Bosque Tr S of Paseo del Norte 101 25 4 1 2 73 0Paseo del Norte Connector 47 1 0 1 0 35 0Bosque Tr N of Montaño Rd 100 15 7 3 1 72 2Bosque Tr S of Montaño Rd 112 17 11 2 1 81 4Montaño Rd Connector 56 16 10 1 0 41 2Bosque Tr N of Central Ave 70 1 10 1 0 54 0Tramway Tr N of P.d. Montañas 17 5 16 0 0 12 6Tramway Tr S of P.d. Montañas 18 5 16 0 0 13 5P.d. Montañas W of Tramway Tr 11 0 4 0 0 7 1Tramway Tr N of Spain 20 7 2 3 0 17 3Tramway Tr S of Spain 16 7 6 1 0 13 2Bear Arroyo E of Morris 38 9 12 0 0 36 9Bear Arroyo W of Morris 8 3 3 0 0 7 5Bear Arroyo E of Wyoming 12 3 13 0 0 7 4Bear Arroyo W of Wyoming 1 0 4 0 0 1 2P.d.l. Montañas E of Penna. 36 2 17 0 0 31 1P.d.l. Montañas W of Penna. 44 9 17 0 0 39 2I-40 Trail E of Unser Blvd 1 1 6 1 0 1 3I-40/Atrisco Overcrossing 6 0 13 1 0 3 2I-40 Trail E of Atrisco 2 0 0 0 0 1 0I-40 Tr E of Paseo del Nordeste 20 5 1 0 0 15 0Paseo del Nordeste N of I-40 Tr 80 5 3 0 0 60 0Paseo del Nordeste S of I-40 Tr 70 0 2 0 0 53 0P.d. Nordeste S of Div Chan Tr 68 4 5 0 0 58 3P.d. Nordeste E of Div Chan Tr 47 4 22 1 0 37 5Div. Channel Tr N of P.d. Nord. 57 4 21 1 0 47 6Div. Channel Tr N of P.d. Norte 25 0 2 0 0 25 1Div. Channel Tr S of P.d. Norte 41 3 4 0 0 40 1Paseo del Norte Tr Connector. 40 3 2 0 0 39 1
The weekend data in Table 8 reflect three-hour link volumes at each location. The on-street locations contain only bicycle information while the trail locations quantify all system users. Helmet usage was collected for all cyclists.

14
Needs Analysis
Table 9: Albuquerque Count Locations – Weekend Trail and On-Street Volumes
Intersection BicyclesRunner/ Jogger Walker Skater
Eques-trian Helmet Pets
Weekend Peak PeriodAlameda Bl @ Bosque - EB 14 - - - - 12 N/AAlameda Bl @ Bosque - WB 17 - - - - 14 N/ABosque Tr N of Alameda Bl 88 11 69 0 0 78 19Bosque Tr S of Alameda Bl 327 37 162 5 3 287 42Bosque Tr N of Paseo del Norte 335 53 74 3 0 274 16Bosque Tr S of Paseo del Norte 374 63 73 4 0 306 13Paseo del Norte Connector 145 14 9 1 0 118 5Bosque Tr N of Montaño Rd 345 55 19 4 0 286 2Bosque Tr S of Montaño Rd 397 63 20 4 0 329 2Montaño Rd Connector 144 22 13 4 0 119 0Bosque Tr N of Central Ave 261 42 375 5 0 190 8Bosque Tr N of Rio Bravo Bl 184 2 20 1 0 61 6Tramway Tr N of P.d. Montañas 20 14 22 0 0 19 19Tramway Tr S of P.d. Montañas 23 16 35 0 0 21 24P.d. Montañas W of Tramway Tr 11 4 13 0 0 10 5Tramway @ P.d. Montañas - NB 29 - - - - 29 N/ATramway @ P.d. Montañas - SB 46 - - - - 46 N/ATramway Bl N of Central Ave 47 - - - - 43 N/ATramway Bl S of Central Ave 29 - - - - 27 N/ACentral Ave E of Tramway Bl 31 - - - - 19 N/ACentral Ave W of Tramway Bl 5 5 N/AP.d. Montañas E of Penna. 13 1 3 0 0 12 1P.d. Montañas W of Penna. 21 7 4 0 0 20 2Penna. @ P.d. Montañas - NB. 5 - - - - 5 N/APenna. @ P.d. Montañas - SB. 3 - - - - 3 N/AI-40/Atrisco Overcrossing 11 0 6 2 0 5 0I-40 Trail E of Atrisco 5 0 1 0 0 3 0Coors Bl N of Montaño Rd 1 - - - - 1 N/ACoors Bl S of Montaño Rd 5 - - - - 5 N/AMontaño Rd E of Coors Bl 27 - - - - 15 N/AMontaño Rd W of Coors Bl 25 - - - - 13 N/APaseo del Nordeste N of Tucker 36 - - - - 29 N/AI-40 Tr E of Paseo del Nordeste 16 23 2 0 0 11 0Paseo del Nordeste N of I-40 Tr 105 21 2 0 0 75 0Paseo del Nordeste S of I-40 Tr 89 10 0 0 0 64 0P.d. Nordeste S of Div Chan Tr 110 11 13 0 0 92 0P.d. Nordeste E of Div Chan Tr 51 9 9 0 0 43 0Div. Channel Tr N of P.d. Nord. 105 2 12 0 0 88 0Div. Channel Tr N of P.d. Norte 42 7 0 0 0 40 1Div. Channel Tr S of P.d. Norte 114 6 1 0 0 107 0Paseo del Norte Tr Connector 82 9 1 0 0 77 1
The highest weekday cycling usage occurred at the University of New Mexico. The highest weekend usage was along the Rio Grande Bosque Trail with an average of more than 200 users per hour per link at three locations.

15
Needs Analysis
The Bosque Trail experiences the highest utilization in the Albuquerque area. Based upon observation, it is assumed that the majority of the Bosque Trail users were recreational users. Some cyclists during the weekday counts appeared to be commuters; however, the overwhelming majority appeared to be recreational. The Bosque trail is unique in that you can travel over 13 miles without encountering an at-grade intersection, leading to high recreational usage. The second most frequently used trail for cyclists was the combined trails Paseo del Nordeste and the Diversion Channel Trail. The original Paseo del Nordeste Trail started at UNM, and went north to the Hahn Arroyo, then east to Penn-sylvania St. The trail utilization has changed since the Diversion Channel Trail was completed and connected to Paseo del Nordeste, resulting in primarily north-south movements within the corridor. The reason for this change may be that the Diversion Channel Trail connects to the Bosque Trail via the Paseo del Norte Trail with minimal at-grade crossings. These trails carry regional cycling traffic, not just local traffic.
Cyclists were the most frequently counted trail users, who generally out numbered the second most frequent, walking and jogging. Cyclists generally outnumbered walkers and joggers by ratios ranging from 1:1 (in only a few locations) to 5:1. The least common trail use were equestrian and they were observed more frequently on weekdays than week-ends. One reason for this trend could be the need to mix with other user types in conditions that may scare or startle horses. Another possible cause is a lack of dedicated equestrian parking and suitable trail connections in the north valley area. This is consistent with feedback received during stakeholder interviews.
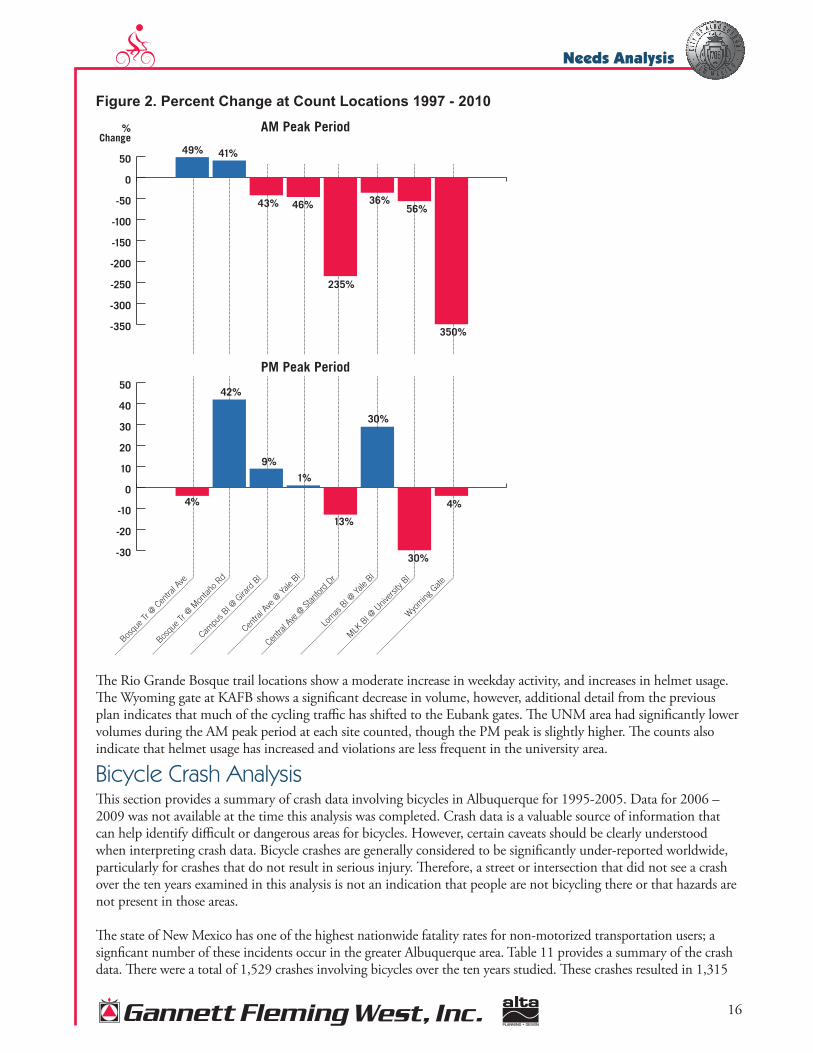
The previous on-street bicycle plan collected counts in 1997 at 11 comparable locations. The 1997 weekday counts were conducted for two hours during the AM peak period and three hours during the PM peak period, therefore adjustments were necessary to normalize the PM data. Raw data was available for 7½ of the 1997 locations, and only locations with raw 1997 data were compared. Table 10 contains the peak period entering volumes from each year, while Figure 2 shows a percentage change at each location.
Table 10: 1997 – 2010 Volume Comparison
Intersection1997 2010Bicycles Helmet Sidewalk Violation Bicycles Helmet Sidewalk Violation
AM Peak PeriodBosque Tr @ Central Ave 26 51% - - 51 92% - -Bosque Tr @ Montaño Rd 41 84% - - 70 83% - -Campus Bl @ Girard Bl 164 41% 0% 14% 115 60% 5% 21%Central Ave @ Yale Bl 117 21% 43% 15% 80 29% 49% 14%Central Ave @ Stanford Dr 161 27% 15% 26% 48 31% 15% 4%Lomas Bl @ Yale Bl 109 39% 1% 3% 80 61% 6% 3%MLK Bl @ University Bl 78 50% 18% 21% 50 68% 22% 4%Wyoming Gate 72 100% 0% - 16 100% 50% -
PM Peak PeriodBosque Tr @ Central Ave 73 50% - - 70 77% - -Bosque Tr @ Montaño Rd 65 66% - - 112 72% - -Campus Bl @ Girard Bl 141 35% 2% 11% 155 59% 3% 8%Central Ave @ Yale Bl 155 26% 58% 16% 156 24% 58% 5%Central Ave @ Stanford Dr 145 16% 28% 25% 128 30% 27% 0%Lomas Bl @ Yale Bl 86 40% 2% 0% 122 65% 14% 7%MLK Bl @ University Bl 86 44% 20% 13% 66 44% 26% 9%Wyoming Gate - - - - 14 100% 43% -
16
Needs Analysis
Figure 2. Percent Change at Count Locations 1997 - 2010
The Rio Grande Bosque trail locations show a moderate increase in weekday activity, and increases in helmet usage. The Wyoming gate at KAFB shows a significant decrease in volume, however, additional detail from the previous plan indicates that much of the cycling traffic has shifted to the Eubank gates. The UNM area had significantly lower volumes during the AM peak period at each site counted, though the PM peak is slightly higher. The counts also indicate that helmet usage has increased and violations are less frequent in the university area.
Bicycle Crash AnalysisThis section provides a summary of crash data involving bicycles in Albuquerque for 1995-2005. Data for 2006 – 2009 was not available at the time this analysis was completed. Crash data is a valuable source of information that can help identify difficult or dangerous areas for bicycles. However, certain caveats should be clearly understood when interpreting crash data. Bicycle crashes are generally considered to be significantly under-reported worldwide, particularly for crashes that do not result in serious injury. Therefore, a street or intersection that did not see a crash over the ten years examined in this analysis is not an indication that people are not bicycling there or that hazards are not present in those areas.
The state of New Mexico has one of the highest nationwide fatality rates for non-motorized transportation users; a signficant number of these incidents occur in the greater Albuquerque area. Table 11 provides a summary of the crash data. There were a total of 1,529 crashes involving bicycles over the ten years studied. These crashes resulted in 1,315
-30
-20
-10
0
10
20
30
40
50
49% 41%
43% 46%
235%
36%56%
350%
4%
30%
30%
13%
1%
9%
42%
4%
Bosqu
e Tr @
Cen
tral A
ve
Bosqu
e Tr @
Mon
taño R
d
Campu
s Bl @
Gira
rd B
l
Centra
l Ave
@ Ya
le Bl
Centra
l Ave
@ S
tanfor
d Dr
Lom
as B
l @ Ya
le Bl
MLK B
l @ U
niver
sity B
l
Wyo
ming G
ate
-350
-300
-250
-200
-150
-100
-50
0
50
%Change
AM Peak Period
PM Peak Period

17
Needs Analysis
bicycle injuries and 20 fatalities5. This extremely high injury rate highlights the importance of taking measures to im-prove safety for bicyclists in Albuquerque, but may also indicate that non-injury bicycle crashes often go unreported.
Table 11: Bicycle Crashes, 1995-2005Year Bicycle Crashes Bicycle Injuries Bicycle Fatalities1995 189 177 21996 179 160 21997 145 124 31998 144 124 11999 110 96 32000 133 116 22001 130 111 32002 126 102 32003 78 64 02004 155 128 12005 140 113 0Total 1529 1315 20
Figure 3 shows the number of bicycle crashes reported in Albuquerque over time, which display a downward trend from 1995 to 2005.
Figure 3: Bicycle Crashes by Year Figure 4: Bicycle Crashes by Month
Bicycle Crashes By Time of Day/Week/YearFigure 4 shows the number of crashes per month involving bicycles. Higher numbers of crashes involving bicycles in the summer months likely indicates that cycling is more prevalent during these good weather months. However, it should be noted that there are crashes involving bicycles throughout the year, indicating that people in Albuquerque continue to cycle during the winter months. Bicycle counts performed by the City of Portland suggest that winter bicycle ridership levels are approximately half of the summer levels6.
Figure 5 shows the number of bicycle-involved crashes by day of week. Bicycle crashes are concentrated during week-days, and on weekends crashes appear to be significantly more common on Saturdays than on Sundays. This trend may reflect the days of the week when bicycle traffic is highest. Recreational trips on off-street bicycle facilities are likely to be more common on weekends, and the lower weekend crash rate may also represent combined lower traffic volumes of both bicycles and vehicles on surface streets.
5 Note that the number of fatalities recorded in the data is likely to be under-reported, as a fatality is only recorded if a person is declared dead at the scene of the crash. Fatalities that result later in the ambulance or at the hospital are not recorded in the crash data.6 Portland Bicycle Counts 2008, Portland Bureau of Transportationhttp://www.portlandonline.com/shared/cfm/image.cfm?id=217489
Bicycle Crashes by Year(1995-2005)
020406080
100120140160180200
1995
1996
1997
1998
1999
2000
2001
2002
2003
2004
2005
Bicycle Crashes By Month
(1995-2005)
020406080
100120140160180200
Jan Feb Mar Apr May Jun Jul Aug Sep Oct Nov Dec

18
Needs Analysis
Figure 5: Bicycle Crashes by Day of Week Figure 6: Bicycle Crashes by Time of Day
Figure 6 shows the number of crashes by time of day for bicycles. Again, this data may give some indication as to the hours that people bicycle in Albuquerque and also those times when crashes are most likely. Crashes are concentrated in the afternoon and evening hours, though there are crashes during the morning peak period as well. The evening peak period is an especially common time for bicycle-involved crashes; 40 percent of all bicycle crashes happened between 3 pm and 6 pm. High numbers of crashes in the late afternoon/early evening reflect both the increased level of bicycle and vehicular traffic during the evening peak and reduced visibility during the darker hours.
Crashes by Street and IntersectionA high number of crashes do not necessarily make a street or intersection a prime candidate for bicycle improve-ments. For example, because crashes tend to be infrequent events, the intersections with multiple crashes from 1995 to 2005 may or may not present particularly difficult conditions for bicycles. Furthermore, difficult intersections not listed in the following figures and tables may serve as important connections along current or proposed bicycle routes and therefore be a higher priority for improvements. However, bicycle crash data presents an objective look at bicycle safety along different corridors, validating known issues or revealing other trends that may not be discovered by other methods such as through surveys or public meetings. With these points in mind, the following figures and tables highlighting the number of crashes on different streets serve as a useful starting point for evaluating the current and future bicycle network in Albuquerque.High Crash StreetsFigure 7 shows street corridors in Albuquerque with 20 or more bicycle-involved crashes from 1995 to 2005 (Map 2). Of these corridors, Central Avenue E had the highest number of crashes at 143, more than double the number of any other street. Table 12 shows the distribution of fatal and injury crashes on these streets. Eight fatal bicycle crashes occurred on these high crash corridors during the ten year period. Lomas Boulevard E and on San Pedro Drive NE were each the site of two fatal crashes. Many of the streets with the highest number of crashes are characterized as roadways with 4 – 6 travel lanes, a center turn lane or raised median and no dedicated bicycle facilities.
Figure 7: High Bicycle Crash Corridors
Bicycle Crashes By Day of Week(1995-2005)
0
50
100
150
200
250
300
Sun Mon Tue Wed Thu Fri Sat
High Bicycle Crash Corridors(1995-2005)
020406080
100120140160
CENTR
AL AVE E
LOM
AS BLV
D NE
WYO
MIN
G BLVD N
E
SAN M
ATEO BLV
D NE
4TH ST
NW
MONTG
OMERY B
LVD N
E
CENTR
AL AVE W
COMANCHE R
D NE
JUAN TABO BLV
D NE
EUBANK B
LVD N
E
MENAUL B
LVD N
E
RIO G
RANDE BLV
D NW
TRAM
WAY B
LVD N
E
SAN PED
RO DR N
E
COPPER
AVE N
E
CONSTITU
TION AVE N
E

19
Needs Analysis
37 crashes
59 c
rash
es
143
cras
hes
24 c
rash
es
47 crashes
33 c
rash
es
27 c
rash
es
40 crashes
20 c
rash
es
22 crashes
21 c
rash
es
24 crashes
24 crashes
24 crashes
37 c
rash
es
27 crashes
Cent
ral A
V
4th ST
Lom
as B
LVD
Men
aul B
LVD
Eubank BLVD
Tramway BLVD
Wyoming BLVD
Com
anch
e RD
Rio Grande BLVD
Mon
tgom
ery
BLVD
Juan Tabo BLVD
San Mateo BLVD
San Pedro DR
Cons
titut
ion
AV
Copp
er A
V
I-40
I-40
I-25
San Pedro DR
Cons
titut
ion
AV
Copp
er A
V
City
of
Albu
quer
que
Albu
quer
que
Bicy
cle
Mas
ter
Plan
- U
ser
Nee
ds A
naly
sis
Map
2 -
Hig
h Bi
cycl
e Cr
ash
Corr
idor
s
02
41
Mile
s
Hig
h B
icyc
le C
rash
Cor
ridor
s

20
Needs Analysis
Table 12: High Bicycle Crash Corridors, 1995-2005Street Fatal
CrashesInjury Crashes
Non-Injury Crashes
Total Crashes
Bicycle Facilities Posted Speed (MPH)
Travel Lanes
Central Ave E 1 123 19 143 None 54 4Lomas Blvd NE 2 46 11 59 None 35 4Wyoming Blvd NE 1 38 8 47 Bike lanes between
Academy Rd and Osuna Rd25 6
San Mateo Blvd NE 1 31 8 40 None 25 64Th St NW 1 25 11 37 None 25 2-4Montgomery Blvd NE 0 35 2 37 None 25-35 6Central Ave W 0 28 5 33 None 45 4Comanche Rd NE 0 22 5 27 Bike lanes/ Bike Route 25 4Juan Tabo Blvd NE 0 26 1 27 None 35 6Eubank Blvd NE 0 18 6 24 Sporadic bike lane north of
Academy Rd and south of Central Ave
35 6
Menaul Blvd NE 0 23 1 24 None 35 6Rio Grande Blvd NW 0 22 2 24 Bike lanes south of Montano
Rd and north of Chavez Rd45 2
Tramway Blvd NE 0 19 5 24 None 35 4San Pedro Dr NE 2 17 3 22 Intermittent bike lanes 25 6Copper Ave NE 0 21 0 21 Bike route 25 4Constitution Ave NE 0 18 2 20 Bike lanes 25 2

21
Needs Analysis
High Crash IntersectionsWhile bicycle crashes appear to be concentrated on certain street corridors as detailed above, crashes at individual in-tersections in Albuquerque are more evenly distributed. Table 13 lists intersections in Albuquerque that were the site of four or more bicycle crashes from 1995 to 2005 (Map 3). None of these intersections was the site of a fatal crash.
Table 13: High Bicycle Crash Intersections, 1995-2005Intersection No. CrashesCentral Ave E / Yale Blvd SE 7
Central Ave E / Dorado Pl SE 6
Central Ave E / Stanford Dr NE 6
Central Ave W / New York Ave NW 6
Central Ave E / Cornell Dr NE 5
Central Ave E / Girard Blvd NE 5
Central Ave E / Juan Tabo Blvd NE 5
Montgomery Blvd NE / Tramway Blvd NE 5
San Mateo Blvd NE / Indian School Rd NE 5
University Blvd SE / Gold Ave SE 5
Wyoming Blvd NE / Constitution Ave NE 5
Wyoming Blvd NE / Montgomery Blvd NE 5
Bridge Blvd SW / 8th St SW 4
Central Ave W / Sunset Rd SW 4
Indian School Rd NE / Constitution Ave NE 4
Lomas Blvd NE / Vassar Dr NE 4
Louisiana Blvd NE / Central Ave E 4
Montgomery Blvd NE / San Mateo Blvd NE 4
Rio Grande Blvd NW / Candelaria Rd NW 4
San Mateo Blvd NE / Pan American East Hy NE 4
Tennessee St NE / Lomas Blvd NE 4
Tramway Blvd NE / Spain Rd NE 4
Wyoming Blvd NE / Candelaria Rd NE 4
Wyoming Blvd NE / Comanche Rd NE 4
Wyoming Blvd NE / Spain Rd NE 4
The majority of these high crash intersections are located along streets that also have high numbers of bicycle crashes along their entire length, such as Central Avenue and Lomas Boulevard.

22
Needs Analysis
2ND ST4TH ST
COORS BLVD
LOM
AS B
LVD
CEN
TRAL
AV
UNSER BLVD
MEN
AUL
BLVD
PASE
O D
EL N
ORT
E
TRAMWAY BLVD
EUBANK BLVD
CAN
DEL
ARIA
RD
COAL
AV
WYOMING BLVD
MO
NTA
NO
RD
EDITH BLVD
PASEO DEL VOLCAN
RIO GRANDE BLVD
ACAD
EMY
RD
TRAM
WAY
RD
ZUN
I RD
LOUISIANA BLVD
JUAN TABO BLVD
SPAI
N R
D
BROADWAY BLVD
GIB
SON
BLV
D
MO
NTG
OM
ERY
BLVD
6TH STLA
DERA
DR
EASE
MEN
T
ALAM
EDA
BLVD
12TH ST
JEFFERSON ST
98TH ST
BRID
GE
BLVD
GOLF COURSE RD
UNIVERSITY BLVD
SAN PEDRO DR
ROY
AV
YALE BLVD
PARA
DISE
BLV
D
OSUN
A R
D
UNIVERSE BLVD
IND
IAN
SCH
OOL
RD
NM 528
VENTURA ST
ATRISCO DR
8TH ST
IRVING BLVD
ELLI
SON
DR
COM
ANCH
E RD
PENNSYLVANIA ST
LAYT
ON A
V
SUN
POR
T BL
VD
WES
TSID
E B
LVD
WES
TERN
TRL
LYON BLVD
CAN
DEL
ARIA
RD
CEN
TRAL
AV
I-40
I-40
I-25
City
of
Albu
quer
que
Albu
quer
que
Bicy
cle
Mas
ter
Plan
- U
ser
Nee
ds A
naly
sis
Map
3 -
Hig
h Bi
cycl
e Cr
ash
Inte
rsec
tion
s
02
41
Mile
s
Hig
h B
icyc
le C
rash
Inte
rsec
tions
Cra
shes
(199
5-20
05)
4 C
rash
es
5 C
rash
es
6 C
rash
es
7 C
rash
es

23
Needs Analysis
Types of Bicycle CrashesThe available data also includes some information about the geometry of the reported crashes. Figure 8 shows the number of crashes of each type.
In over half of all bicycle crashes, the vehicle struck the cyclist at an angle, implying that most bicycle crashes occur during some type of turning movement. Note that although this data shows the movement of each party during a crash, it does not indicate causation to indicate which party was at fault, or if any citations were given as a result of the crash.
Demographics As shown in Figure 9, most bicyclists involved in crashes in Albuquerque are male. This is common in other cities, and represents a number of factors including that there are more male than female bicyclists in the United States, and that males often take more risks which may also ap-ply to bicycling behavior.
Bicycle crash data also reveals that 27 percent of bicycle-involved crashes involved bicyclists under the age of 18, including approximately 10 percent of crashes where the bicyclists was age 11 or younger. Figure 10 shows the age distribution of bicyclists in bicycle crashes. This empha-sizes the importance of creating bicycle facilities that are safe for all ages and abilities of bicyclists in Albuquerque. Note that age data was not available for approximately one in eight bicycle crashes.
Online SurveyThe following section summarizes the results of the Albu-querque Bikeways and Trails Master Plan online survey. The survey gathered information on preferred facility types, current transportation and travel behavior, and concerns about traffic safety. The detailed survey results are provided in Appendix C. People who selected to take the survey displayed a strong desire for a dedicated network of off-street trails for recreation. Respondents also indicated that improved connectivity through on-street dedicated facilities (i.e. bike lanes and bicycle boulevards) would enhance the biking environment and lead to increased bike trips in Albuquerque. It should be noted however that the vast majority (91 percent) of the respondents who took this survey are current bicyclists. The views and opin-ions of people who may be interested in bicycling, but who do not currently bike for transportation or recreation, are not well-represented in this sample.
DemographicsOver 1,200 individual responses were collected between the end of April 2010 and mid-June 2010. This high response rate demonstrates that there is a significant level of interest in local bicycle infrastructure issues, as well as
Bicycle Crashes By Crash Type(1995-2005)
0100200300400500600700800900
Not stated Vehicle struckcyclist from
behind
Vehicle struckcyclist head
on
Vehicle struckcyclist at
angle
Cyclist struckvehicle
Bicycle Crashes by Sex of Bicyclist(1995-2005)
16.4%
83.6%
Female
Male
Bicycle Crashes by Age of Bicyclist(1995-2005)
0
50
100
150
200
250
300
350
11 andunder
12 to 18 19 to 29 30 to 39 40 to 49 50 to 59 60 andover
Figure 8: Bicycle Crashes by Crash Type
Figure 9: Bicycle Crashes by Gender
Figure 10: Bicycle Crashes by Age of Bicyclist

24
Needs Analysis
a large community of existing bicyclists (72 percent responded that they are members of a bicycle advocacy group). More than half of all respondents are frequent riders (ride almost daily), while another one-third are regular riders, logging one or two weekly bike trips.
Of the individuals who answered the survey, over half (55 percent) are between the ages 41 and 60 and persons under the age of 30 may be underrepresented in this sample. The results of the survey also indicate that people who choose to bicycle for both recreation and transportation are well-educated. Eighty-five percent of respondents completed college or a post graduate program.
The ratio of men to women who choose to bicycle is commonly used as a rough measure of the adequacy and per-ceived safety of a city’s bicycle network. Cities that routinely achieve 50/50 splits between both sexes for bicycle com-mute trips are often regarded as some of the best cities for bicycling. The results of the Albuquerque survey indicate a somewhat more uneven ratio between the sexes; 64 percent are men and 36 percent women.
Bicycle Habits and Travel BehaviorIn the survey, respondents were first asked how they identify themselves as a bicyclist. The survey presented three choices: an advanced, confident rider who is comfortable riding in most traffic situations, an intermediate rider who is somewhat comfortable riding in some traffic situations, and a beginner rider who prefers to stick to the bike path. The majority (53 percent) identified as advanced riders, 10 percent placed themselves in the beginner category, and the remainder (37 percent) selected intermediate (See Figure 10). Despite the high ratio of intermediate and ad-vanced riders who are comfortable riding in mixed traffic, more than half (55 percent) of the respondents prefer to ride on multi-use trails and paths over other facility types. However, this preferred facility is often unavailable—two-thirds of respondents felt that there are not enough bike lanes or multi-use trails that connect to the destinations they need to access.
Figure 10: Types of Cyclists Figure 11: Trip Purpose
When asked what kind of bicycle riding the individual chooses to do, the respondent was able to select multiple an-swers. Recreation/fitness received the largest share of response at 897, commuting to work/school received 590, and errands or other local destinations garnered 390 (Figure 11). These results indicate that bicyclists are routinely engag-ing in more than one type of bicycle riding which may include commuting some days of the week and doing some recreational riding as well. Indeed, 43 percent responded that they use multi-use trails 1-3 times per week (Figure 12).
Num
ber o
f Res
pons
es
0
100
200
300
400
500
600
10%
37%
53%
Advanced,confident rider
Intermediaterider
Beginningrider
Num
ber o
f Res
pons
es
0
200
400
600
800
1000
390
590
897
Recreationor Fitness
Commuting toWork or School
Errands or LocalDestinations

25
Needs Analysis
Infrastructure PreferencesWhen asked what kind of roads are preferred to ride on nearly half (48 percent) chose collectors that may be less direct and have medium levels of traffic. Low traffic, local and residential streets were selected by 43 percent, possibly due to the these roadways being the least direct. Finally, less than 10 percent selected major roadways, which are gen-erally high traffic but the most direct (Figure 13). A follow-up question asked respondents to select the type of road they need to ride on to reach their destination—44 percent of the responses indicated major roadways.
This finding is consistent with bicyclists’ main traffic safety concern, that motorists are not considerate of bicyclists. Major roadways are designed primarily for motorized travel, and the inclusion of bicyclists to the mix commonly in-troduces conflicts between the two users. This holds especially true when there are insufficient or inadequate bikeway facilities. For example, in a question that asked respondents to select statements regarding infrastructure problems that limit bike riding or trail use, 51 percent agreed that bike lanes are in poor condition or poorly maintained. Half or respondents also agreed that there are no direct bike lanes and/or multi-use trails that connect them to the destinations they need to access and 41 percent cited this as a reason for not using trails more frequently. Infrastruc-ture problems that were less important to respondents included: not enough lighting (19 percent), no bike parking (19 percent), and no showers or lockers (20 percent).
When asked to select the bikeway facility improvements that would most likely influence increases in on-street and off-street bicycle trips the findings show that more on-the-ground infrastructure is desired above all else. Trails, bike lanes, bike routes, and bike boulevards were all rated as highly likely to encourage additional bike trips. Less important to respondents were trail ameni-ties or additional wayfinding or other bicycle on-street bicycle signage.
Bicycle ParkingDeveloping additional bicycle parking was not rated as a high priority for most respondents. Just 19 percent felt that more bike parking would influence them to ride their bike more often. However, the results indicate
Num
ber o
f Res
pons
es
0
100
200
300
400
500
27%
43%
26%
Daily oralmost daily
1-3 timesper week
Several timesa month
4%
Rarely0%
Not at all
Num
ber o
f Res
pons
es
0
200
400
600
9%
43%48%
Collectors Local streets Major roadways
Figure 12: Frequency of Multi-Use Trail Activity
Figure 13: Preferred Roadway Type
Figure 14A: Traffic and Safety Concerns
0
20
40
60
80
100
Female respondentsMale respondents
Motoristsinconsiderate
of cyclists
Motoristsdrive
too fast
Too manycars onstreets
Don’t feelsafe on roads
(crime,personal safety)
Don’t feelsafe on paths
(crime,personal safety)
Trafficsignals
not set forcyclists

26
Needs Analysis
a bicycle parking shortage at grocery stores, shopping centers, and restaurants.
Female CyclistsResearch on men and women’s cycling preferences has become a common discussion topic. Studies estimate that in the U.S. men’s cycling trips surpass women’s by at least 2:1, the ratio reported in both online survey re-sults and the 2006-2008 American Community Survey cycling commute ratios. Studies show that women are more risk averse, and are more willing to detour out of their way to travel on lower traffic streets. Research has also state that women typically attend to more daily household chores, and would benefit from lower speed and volume routes to “practical urban destinations.” 7
The online survey included responses from nearly 390 women8. When analyzed these results create a profile that demonstrates many of Albuquerque’s female riders share characteristics common to female riders across the US. This does not imply that women are not confident, fearless cyclists simply that different facilities may appeal to different types of riders. These characteristics may offer insight into infrastructure treatments and program-matic strategies will encourage more cycling among women and other groups that have similar riding habits. It should be noted that the responses of respondents who identified as ‘intermediate’ or ‘beginner’ cyclists were very similar to results reported by the majority of women. The respondents who identified as ‘inter-mediate’ and ‘beginner’ riders were split nearly evenly between the genders.
Comparision of ‘Female Respondents’ in Relation to ‘All Surveyed Respondents’ or ‘Male Respondants’ in Albuquerque
•The majority of women characterized themselves as intermediate riders, who are “somewhat comfort-able riding in some traffic situations.”
•The majority of women prefer riding on local or residential roads. This is consistent with results from all riders who identified themselves as “intermediate riders.”
7 Baker, Linda, “How to Get More Bicyclists on the Road,” Scientific American. Accessed July 15, 2010. (www.scientificamerican.com/article.cfm?id=getting-more-bicyclists-on-the-road).8 About ½ of survey respondents did not identify themselves as either male or female.
Female respondentsMale respondents
0
20
40
60
80
100
(1)
(1) Bike lanes are in poor condition or poorly maintained (broken glass, road debris, bad pavement)(2) Multi-use trails are in poor condition or poorly maintained (broken glass, road debris, bad pavement)(3) Not enough bike lanes/multi-use trails to my destinations(4) No direct bike lanes/multi-use trails to my destinations(5) No mountain bike trails(6) Destinations are too far away(7) Not enough lighting (on road or multi-use trail or lane)(8) No bike parking(9) No showers, lockers
(2) (3) (4) (5) (6) (7) (8) (9)
Female respondentsMale respondents
0
20
40
60
80
100
(1)
(1) I am afraid of getting lost (2) I travel with small children(3) I have to carry things(4) I don’t have enough time(5) I am not physically able to bike(6) I don’t own a bicycle(7) Terrain / hills(8) Bicycling gives me helmet hair(9) I am concerned about riding in the rain(10) I have to dress up for work
(2) (3) (4) (5) (6) (7) (8) (10)(9)
Figure 14B: Infrastructure
Figure 14C: Personal Concerns

27
Needs Analysis
•There was no variation in preferred facility (multi-use trail), common ride frequency (3-4 days a week for com-muting and 1-2 days for exercise), or primary ride purpose (exercise/fitness).
•Men and women agree that grocery stores are the type of destination most in need of increased bicycle parking. Women state that other top locations in need of bike parking are shopping centers, restaurants and civic centers. Men’s top choices include shopping centers, work sites and restaurants.
•Nearly 86 percent of women reported walking or jogging as a trail use as compared to 70 percent of men. Both groups reported the same frequency of trail use, most commonly one to three times per week.
•The most frequently stated traffic safety concern for both men and women was that “Motorists are not consider-ate of cyclists.” However, there was significant variation in the second and third most popular responses.
•The only variation in concerns related to infrastructure was that nearly twice as many women as men, 25 percent of respondents, stated that destinations were too far away.
•Both men and women stated that their top three concerns for not bicycling more was the need to carry items or equipment, time constraints, or the need to dress up for work.
•A greater share of men and women commonly thought that multi-use trails more bike lanes, bike routes and bike boulevards were the improvements that would encourage them to use the system more frequently. Women response was commonly greater than men’s by about five percent (e.g., 68 percent of women and 63 percent of men felt that more paved multi-use trails was very likely to increase their system use. Women tended to express stronger support for increased education, encouragement and enforcement programs.

28
Needs Analysis
Figure 15: Men’s and Women’s Assessment of Improvements that Would Encourage More Cycling
Would the following improvements influence you to bike and/or use the multi-use trail system more often? Please rate each improvement by likelihood of influencing you to bike and use the multi-use trail system more often.
More Paved (off-street) Multi-Use Trails
More Amenities Along Multi-Use Trails (e.g., mile markers, trash receptacles and lighting)
Create Mountain Bike Trails
Increased Maintenance (sweeping/repairs to bike lanes, routes, paths, and
landscape trimming, etc.)
More Bike Lanes (Separate Lanes for bikes) on Major Streets
More Bike Routes
More Bike Boulevards (Bike Priority Streets) on Smaller Streets
Widen Outside/Curb Lanes on Major Streets (easier to share lanes with cars)
Narrow Outside/Curb Lanes on Major Streets (easier to control lane)
Implement Shared Use Lane Pavement Markings for Bicyclist Positioning in
Traffic Lanes (”Sharrow”)
More On-Road Bike Signage
Bicycle Signs Indicating Major Attractions
More Bicycle Parking
Education or Promotional Programs for Drivers
Education or Promotional Programs for Cyclists
Projects to Reduce Motor Vehicle Speed
More Recreational Programs/Events for Bicyclists
Increase Enforcement of Traffic Violations by Motor Vehicles
(e.g. speeding, red light running, parking violations)
Increase Enforcement of Traffic Violations by Bicyclists
(e.g. red light running, riding against traffic)
VERYLIKELY LIKELY
SOMEWHATLIKELY
SOMEWHATUNLIKELY UNLIKELY
VERYUNLIKELY
NOTSURE
BLUE numbers indicate female respondentsRED numbers indicate male respondents
68.0%63.4%
23.6%
41.2%
56.5%
52.8%
47.8%
40.5%
19.7%
27.2%
63.4%
18.8%
33.6%
39.5%
29.6%
32.6%
24.3%
48.9%
31.7%
18.8%
27.2%33.7%
19.7%
42.7%
62.9%
60.9%
51.9%
47.4%
31.0%
36.4%
46.1%
36.9%
38.0%
26.8%
46.9%
28.1%
19.9%
25.6%
17.5%
29
Needs Analysis
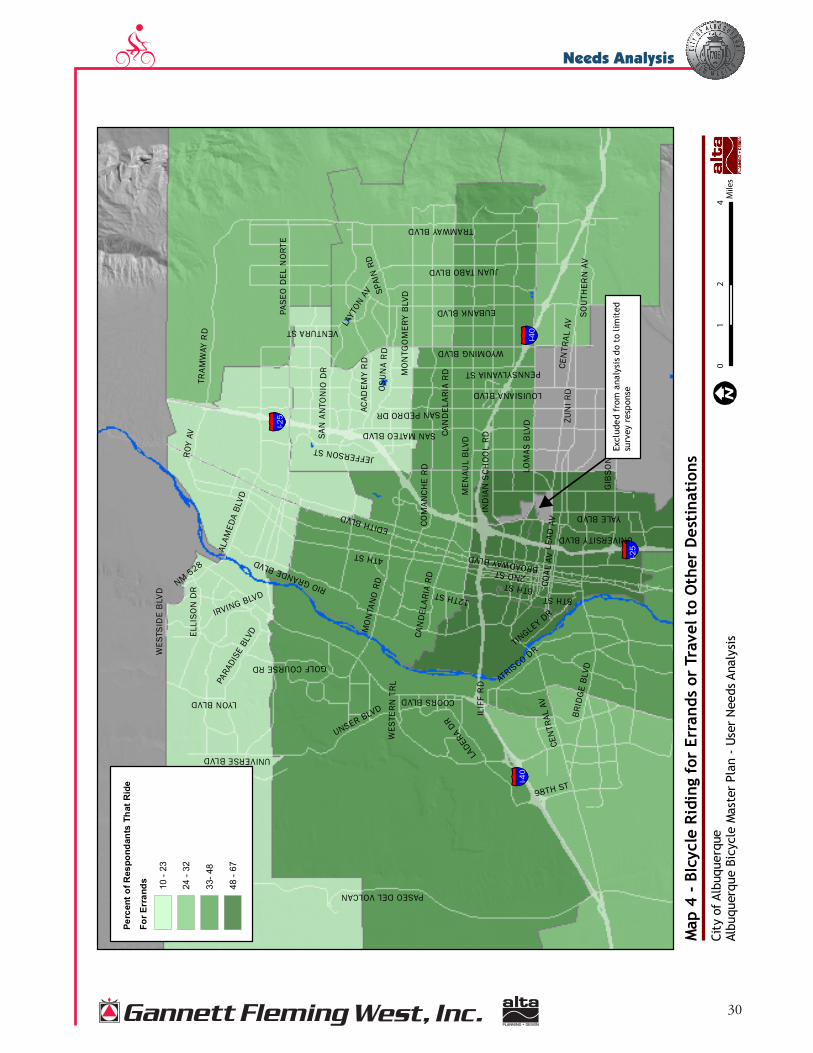
Geographic AnalysisThe following survey variables were geocoded by zip code to examine the spatial distribution of survey results:• What type of cyclist are you? (Question 2)•What type of facility do you prefer to ride on? (Question 5)•How frequently do you use trails? (Question 20)•Please check your traffic and safety concerns? (Question 24)• In general, what type of riding to you tend to do? (Question 10)
There was little variation in the spatial distribution of the majority answer for most questions. The exception was the percent of people who do errands while they bike (Question 10). The greatest percentage of respondents that report they ride to work live in the south central portion of the city where they are close to many destinations including the UNM and Kirtland Air Force Base. Areas where fewer people ride for utilitarian purposes include the north valley, the predominately residential eastern portion of the city, and areas west of the Rio Grande. It should be noted that these results are likely impacted by the relative variation in zip code size and relative number of response obtained in throughout the city.
30
Needs Analysis
2ND ST4TH ST
COORS BLVD
LOM
AS B
LVD
CEN
TRAL
AV
UNSER BLVD
MEN
AUL
BLVD
PASE
O D
EL N
ORT
E
TRAMWAY BLVD
EUBANK BLVD
CAN
DEL
ARIA
RD
COAL
AV
LEAD
AV
WYOMING BLVD
MO
NTA
NO
RD
EDITH BLVD
PASEO DEL VOLCAN
RIO GRANDE BLVD
ACAD
EMY
RD
SAN MATEO BLVD
TRAM
WAY
RD
ZUN
I RDLOUISIANA BLVD
JUAN TABO BLVD
SPAI
N R
D
BROADWAY BLVD
GIB
SON
BLV
D
MO
NTG
OM
ERY
BLVD
6TH STLA
DERA
DR
EASE
MEN
T
ALAM
EDA
BLVD
12TH ST
JEFFERSON ST
98TH ST
BRID
GE
BLVD
GOLF COURSE RD
UNIVERSITY BLVD
SAN PEDRO DR
ROY
AV
YALE BLVD
PARA
DISE
BLV
D
OSUN
A R
D
UNIVERSE BLVD
IND
IAN
SCH
OOL
RD
NM 528
VENTURA ST
ATRISCO DR
8TH ST
IRVING BLVD
ELLI
SON
DR
COM
ANCH
E RD
SAN
AN
TON
IO D
R PENNSYLVANIA ST
TINGLEY DR
SOUT
HER
N A
V
LAYT
ON A
V
WES
TSID
E B
LVD
WES
TERN
TRL
LYON BLVD
ILIF
F R
D
CAN
DEL
ARIA
RD
CEN
TRAL
AV
I-40
I-40
I-25
I-25
City
of
Albu
quer
que
Albu
quer
que
Bicy
cle
Mas
ter
Plan
- U
ser
Nee
ds A
naly
sis
Map
4 -
BIc
ycle
Rid
ing
for
Erra
nds
or T
rave
l to
Oth
er D
esti
nati
ons
02
41
Mile
s
Perc
ent o
f Res
pond
ants
Tha
t Rid
e
For E
rran
ds 10 -
23
24 -
32
33- 4
8
48 -
67
Excl
uded
fro
m a
naly
sis
do t
o lim
ited
su
rvey
res
pons
e

31
Needs Analysis
Key Findings From the Analysis•A disproportionate number of reported bicycle crashes, 83 percent involve males who make up about 65 percent
of Albuquerque’s reported bicycle population. This is consistent with findings from other U.S. cities.•The average bicycle commute trip is about 23 minutes. This is consistent with the idea of the 20-minute neigh-
borhood and idea that the average bicycle trip in the U.S. is two to three miles.•Albuquerque’s reported bicycle commute to work mode share has been static for about 20 years.•A comparison of 1997 counts to 2010 counts found the highest AM peak on-street volumes at the Central
Avenue and Yale Boulevard intersection. In 2010, 115 cyclists were counted here during the AM peak. This is a drop from the 164 cyclists observed at the same intersection in 1997. These drops in the AM counts are con-sistent with other count locations. This trend is not consistent with PM counts at the same locations where, in many cases, the numbers of cyclists increased slightly or remained the same. Potential reasons for these shifts could include a variation in the AM peak times or a shift in facility usage patterns.
•The highest on-street cyclist count volumes were found around the University of New Mexico and Kirtland Air Force Base (AFB). There was a significant shift of cycling traffic from the Wyoming gate to the new Eubank Gate. The greatest number of legal infractions (e.g., running a red light) were observed around UNM the greatest rates of compliance with roadway laws and helmet use was observed around Kirtland AFB.
•The highest weekday cycling usage occurred at the University of New Mexico. The highest weekend usage was along the Rio Grande Bosque Trail with an average of more than 200 users per hour per link at three locations. The lowest weekday cycling usage occurred along Unser Boulevard, the lowest weekend usage occurred along Coors Boulevard north of Montaño Road.
•Trail counts indicated that there is significant off-street cycling activity for recreation and utilitarian purposes that is not captured in the census commute mode share.
•Cyclists were the most commonly counted trail users; they were generally noted in ratios of 1:1 to 5:1 when compared to walkers and joggers, the second most prevalent trail users.
•Streets with the greatest number of reported crashes and highest reported crash rates per mile were 4-6 lane roads without bicycle facilities. The roadways with the greatest number of crashes per mile included East Central Av-enue, Lomas Boulevard and San Mateo Boulevard.
•The seven intersections with the greatest number of reported crashes were all located along Central Avenue. Count data was available at one intersection, Yale Boulevard, and indicated significant bicycle traffic during AM and PM peak hours.
•Nearly 2/3 of cyclists feel that bicycle lanes and multi-use trails do not connect to all the places they want to go.•There is some evidence that bicycle trips are replacing car commute trips when gasoline prices increase.•Women responding to the survey generally identified as intermediate riders who prefer to ride on low traffic
streets, while both genders indicated that bicycle routes and boulevards would ‘very likely’ increase their cycling. A greater percentage of women indicated strong support for this statement.
•Both men and women agreed that grocery stores were the land use most in need of increased bicycle park-ing. Other high-priority land uses included the work place, civic destinations (e.g., parks), shopping malls and restaurants.

32
Needs Analysis
Conclusions and RecommendationsThese conclusions and recommendations will be used to inform the development of the bikeways and multi-use trail network.
Count Related•Consider daylong counts at along key corridors to determine daily citywide use. •Consider counts along high crash corridors without existing bicycle facilities to determine current level of use.•Conduct annual or semi-annual counts at selected locations on bikeways and multi-use trails across the city.
Crash Related•The detailed crash analysis presented in this report should be repeated every few years to identify high crash
locations and solutions to improve safety for non-motorized transportation users. This could be done as a part of a periodic bikeway and multi-use trails ‘report card’ that documents relevant metrics, including new bikeway miles, new trails and crossings, major completed projects, number of bicycles and other trail users, crash analysis, user satisfaction, public perception of safety, etc. This periodic review could be used to create updates to the Albu-querque Bikeways and Trails Master Plan that can tune the Plan’s implementation strategies to respond to chang-ing safety, walking and bicycling patterns.
•The city should consider education or enforcement programs that address specific causes of crashes involving bicycles and other non-motorized transportation users. The most frequent type of crashes were instances where a car hit a bicycle at an angle.
•The City should consider a detailed analysis of conditions along top crash corridors and at top intersections. This analysis should help the city determine whether the higher numbers of crashes are related to difficult conditions or higher numbers of cyclists using the corridor.
•The majority of reported bicycle crashes have occurred on major roadways with 4 – 6 travel lanes, no dedicated bicycle facilities and posted speeds of at least 35 mph. Future roadway design and corridor retrofit of these cor-ridors should focus on increasing safety by through increased separation and enhanced crossing treatments.
Survey Related•Focus high priority network improvements on closing small bikeway and trails gaps to destinations.•Consider programs to increase bicycle parking at high priority locations across the city.•Continue and when possible expand education, encouragement and enforcement programs. Target these pro-
grams to key groups that are under represented in the city’s current cycling demographic including women and groups that would benefit from education such as school age children.
•Consider placing high priority on filling gaps in the multi-use trail network.

33
Needs Analysis
Appendix A – The Needs of Casual and Experienced CyclistsNeeds of Casual and Experienced CyclistsFor the purposes of this Plan, bicyclists are separated into two skill levels: casual and experienced. Casual bicyclists typically include youth, adults and seniors who are intermittent riders. Some casual bicyclists, such as youths under driving age, may be unfamiliar with operating a vehicle on roads and related laws. Experienced bicyclists typically include commuters, long-distance road bicyclists, racers, and those who use their bicycle as a primary means of trans-portation. Table A1 summarizes the needs of casual and experienced bicyclists.
Table A1. Characteristics of Casual and Experienced BicyclistsCasual Riders Experienced Riders
Prefer off-street shared-use paths or bike lanes along low-volume, low-speed streets
Prefer on-street or bicycle-only facilities as opposed to shared-use paths
May have difficulty gauging traffic and may be unfamiliar with the rules of the road. May walk bicycle across intersections
Comfortable riding with vehicles on streets. Negotiate streets like a motor vehicle, including “taking the lane” and using left-turn pockets
May use a less direct route to avoid Arterials with heavy traffic volumes
May prefer a more direct route
May ride on sidewalks and ride the wrong way on streets and sidewalks
Avoid riding on sidewalks or on shared-use paths. Rides with the flow of traffic on streets
May ride at speeds comparable to walking, or slightly faster than walking
Ride at speeds up to 20 MPH on flat ground, up to 40 mph on steep descents
Bicycle for shorter distances: up to 2 miles May cycle longer distances, sometimes more than 100 miles
The casual bicyclist will benefit from route markers, shared-use paths, bike lanes on lower-volume streets, traffic calm-ing, and educational programs. Casual bicyclists may also benefit from a connected network of marked routes leading to parks, schools, shopping areas, and other destinations. To encourage youth to ride, routes must be safe enough for parental permission. The experienced bicyclist will benefit from a connected network of bike lanes on higher-volume arterials, wider curb lanes and loop detectors at signals. The experienced bicyclist who is primarily interested in exer-cise will benefit from loop routes leading back to their point of origin. Due to many multi-use trails in Albuquerque such as the Paseo del Bosque, Tramway Trail and North Diversion Channel Trail there are increasing opportunities for casual bicyclists in the Albuquerque. In several locations, these multi-use trails are accessible from residential neighborhoods. Many experienced bicyclists, including those who bicycle longer distances to commute for exercise or training, also use these shared-use paths. This combination of fast-moving bicyclists on training rides with slower-moving casual bicyclists and pedestrians may result in user conflicts.
Characteristics of Recreational and Utilitarian TripsFor purposes of this Plan, bicycle trips are separated into two trip types: recreational and utilitarian. Recreational trips can range from a 50-mile weekend group ride out of the city to a short family outing to a local park, and all levels in between. Many utilitarian trips are made by commuter bicyclists, who are a primary focus of State and Federal bicycle funding, as well as bicyclists going to school, shopping or running other errands. Utilitarian cyclists include those who choose to live with one less car as well as those who have no other alternative transportation due to economic reasons.
Table A2 summarizes general characteristics of recreational and utilitarian bicycle trips.

34
Needs Analysis
Table A2. Characteristics of Recreational and Utilitarian Bicycle TripsRecreational Trips Utilitarian TripsDirectness of route not as important as visual interest, shade, protection from wind
Directness of route and connected, continuous facilities more important than visual interest, etc.
Loop trips may be preferred to backtracking Trips generally travel from residential to shopping or work areas and back
Trips may range from under a mile to over 50 miles Trips generally are 1-5 miles in lengthShort-term bicycle parking should be provided at recreational sites, parks, trailheads and other activity centers
Short-term and long-term bicycle parking should be provided at stores, transit stations, schools, workplaces
Varied topography may be desired, depending on the skill level of the cyclist
Flat topography is desired
Cyclists may be riding in a group Cyclists often ride aloneCyclists may drive with their bicycles to the starting point of a ride
Cyclists ride a bicycle as the primary transportation mode for the trip; may transfer to public transportation; may or may not have access to a car for the trip
Trips typically occur on the weekend or on weekdays before morning commute hours or after evening commute hours
Trips typically occur during morning and evening commute hours (commute to school and work); shopping trips also occur on weekends
Cyclists’ preferred type of facility varies, depending on the skill level of the cyclist
Generally use on-street facilities, may use shared-use paths if they provide easier access to destinations than on-street facilities
Recreational bicyclists’ needs vary depending on their skill level. Road bicyclists out for a 100-mile weekend ride may prefer well-maintained roads with wide shoulders and few intersections, with few stop signs or stop lights. Casual bicyclists out for a family trip may prefer a quiet shared-use path with adjacent parks, benches, and water fountains.
Utilitarian bicyclists have needs that are more straightforward. Key commuter needs are summarized below:•Commuter routes should be direct, continuous, and connected•Protected intersection crossing locations are needed for safe and efficient bicycle commuting•Bicycle commuters must have secure places to store their bicycles at their destinations•Bicycle facilities should be provided on major streets
Albuquerque is working to close the gaps in their multi-use trail system. When complete, this multi-use trail system will provide access to parks, schools, recreation areas, and downtown. Currently, some neighborhoods do not have easy bicycle access to employment centers, schools and shopping. For casual recreational riders, this may not be a serious deterrent, since they may be willing and able to drive their bicycle to the trailhead. However, this may not be an option for experienced recreational riders or commuters, as they generally would like to use their bicycle for the whole trip. Bicycle-friendly on-street connections between residential areas and shared-use paths and between resi-dential areas and shopping and commute centers would likely increase the prevalence of bicycle commuting, as well as increase the prevalence of recreational riding.

2155 Louisiana Boulevard, N.E.Suite 7000Albuquerque, NM 87110-5429Phone: 505.265.8468Fax: 505.881.2513
Alta Planning + Design711 SE Grand Ave.Portland, OR 97214Phone: 503.230.9862Fax: 503.230.9864