working paper 343 indian food and welfare schemes: scope ... food and... · scope for digitization...
TRANSCRIPT

1
Working Paper 343
Indian food and welfare schemes:
Scope for digitization towards cash
transfers
Shweta Saini
Sameedh Sharma
Ashok Gulati
Siraj Hussain
Joachim von Braun
August 2017
INDIAN COUNCIL FOR RESEARCH ON INTERNATIONAL ECONOMIC RELATIONS

Table of Contents
Definitions .................................................................................................................................. i
Acknowledgements ................................................................................................................ iii
Abstract .................................................................................................................................... iv
Executive Summary ................................................................................................................. v
Background: India’s Welfare System .................................................................................... 1
Section I: The Public Distribution System............................................................................. 4
Aadhaar-based PDS (APDS) ......................................................................................... 7
Direct Benefits Transfer System in India..................................................................... 10
Section II: Cash Transfers .................................................................................................... 14
International Experience .............................................................................................. 14
India’s experience ........................................................................................................ 17
Debate: PDS or DBT or Both?..................................................................................... 24
Section III: Analyzing State Readiness ................................................................................ 31
Section IV: Way Forward ..................................................................................................... 40
Policy Recommendations............................................................................................. 42
Bibliography ........................................................................................................................... 49
Annexure 1: International and National Cash Transfer Schemes .................................... 53
Annexure 2: Tables for NFSA/TPDS in Puducherry and Chandigarh ............................ 55
Annexure 3: Evaluation of States for readiness .................................................................. 56
List of Tables
Table 1: PDS reforms .......................................................................................................... 6
Table 2: Summary of the three types of cash transfer programs....................................... 10
Table 3: Summary of PDS Leakage estimates by several authors .................................... 29
Table 4: Summary of the implementation schedule .......................................................... 38
List of Figures
Figure 1: Welfare in India* .................................................................................................. 2
Figure 2: Trends in Food Subsidy in 2011-12 Prices (INR Lakh Crore) ............................. 3
Figure 3: PoS machine in Andhra Pradesh ........................................................................... 8
Figure 4: DBT process of fund flow................................................................................... 12
Figure 5: Progress under DBT ............................................................................................ 13
Figure 6: Estimates of grain leakages (%) from Series 1 for 2011-12 (AY) ...................... 28
Figure 7: Reduction in ration cards and increase in offtake 2004-05 and 2016-17 ........... 30
Figure 8: State-wise Banking Density per 100,000 people (as on March, 2017) ............... 34

i
Definitions
Aadhaar: Universal scheme under which a 12 digit unique ID is issued to all residents
after collection of their demographic information and biometric identification markings
(finger prints and iris scans). The Unique Identification Authority of India (UIDAI),
who stores this on an online cloud based database, collects this data.
Aadhaar Seeding: Process of linking Aadhaar with different government or non-
government commercial activities is Aadhaar seeding. In the former, Aadhaar details
are collected and stored in databases containing information on beneficiaries under
different government schemes or departments. For example: collecting Aadhaar
numbers of ration card holders under PDS, workers having job cards in MGNREGA or
PAN card holders (for income tax purposes). Non-Government commercial activities
include storing Aadhaar details by telecom service providers and banks for the
corresponding user having a bank account or mobile number. Databases collecting
Aadhaar information are connected to the UIDAI’s online database containing stored
unique IDs
Active Bank Account: Any current or savings bank account with atleast one customer
induced transaction undertaken in the last 12 months. Bank accounts with no such
transaction done for 12-24 months are termed as inactive accounts.
Automation of Supply chain Management: Computerization of the PDS supply chain
which includes online tracking in real time of the movement of food grain from storage
houses of the Food Corporation of India (FCI) to Fair Price Shops (FPS).
Bank account of entitled household or beneficiary: The account of any member of
the entitled household in any bank (that is integrated to Core Banking System (CBS)),
indicated by the head of the household in the digitized beneficiary database for
receiving cash transfer of food subsidy.
Beneficiary: A person or households identified by the State Government to receive
subsidized food grains under the normal and tide-over allocation under NFSA or food
subsidy under the DBT-food.
Fair Price Shop: A shop or a place where food grains are sold to beneficiaries at
central issue prices (CIP) under TPDS/NFSA. Against each transaction, the FPS
owner/dealer issues a sale receipt to them.
Fair Price shop owner: means a person and includes a cooperative society or a body
corporate or a company of a State Government or a gram panchayat or any other body
in whose name a shop has been licensed to distribute essential commodities under the
PDS/TPDS/NFSA.

ii
Leakage of grains: As defined in this paper, leakage is the the grain that has been off-
taken from FCI godowns (warehouses) but has not reached its final consumers (as
reported in their consumption patterns). The ratio of the leaked grain to total grain
offtake from the FCI is the leakage ratio.
POS Device or Mobile Terminal: An electronic device for undertaking Aadhar based
authentication and processing of sale transactions at FPSs and for simultaneously
uploading the transaction data on the designated server. The PDS (Control) Order 2015
states specifications of these two devices.
Public Financial Management System (PFMS): Web-based online transaction
processing system established by the Controller General of Accounts, Ministry of
Finance, Government of India for fund management, e-payment and management
information system.
Stunting and Underweight: These are indicators for malnutrition. Any child with
height-for-age or weight-for-age z scores at least 2 standard deviations below the
median for WHO growth standards is stunted or underweight respectively.

iii
Acknowledgements
ICRIER and the authors gratefully acknowledge that ZEF Bonn, with whom ICRIER
collaborates in this Project titled “Analysis and implementation of measures to reduce price
volatility at national and international markets for improving food security in developing
countries”, is the grantee of the German Federal Ministry of Economic Cooperation and
development (BMZ), which supported this research paper.
The authors would like to thank Prof. Anwarul Hoda for his continued guidance and important
suggestions during work on the paper. The authors are grateful to The Editorial Committee of
the ZEF (Discussion Papers on Development Policy) and to Ms. Vrinda Swarup for sharing
their valuable comments that have helped better this research.

iv
Abstract
The paper presents a case for a phased rolling out of direct benefits transfer (DBT) for Food in
India. By studying all states and Union Territories on three broad parameters: demographics,
performance of the existing Public Distribution System (PDS), and current state of banking
infrastructure, the paper evaluates their “readiness” for shifting away from the existing physical
grain distribution system under PDS to the ICT based DBT where a food subsidy amount (in
lieu of PDS grain entitlement) is directly transferred into the Aadhaar-linked bank account of
identified beneficiaries. The analysis reveals that all 36 states can implement DBT-food in the
next five years i.e. by the year 2022 and this should happen in four phases. The states that are
urban, have sufficient open market grain availability, are financially inclusive, and have lesser
percentage of poor and malnourished may make the shift almost immediately. For rest, an
interim phase of a reformed and IT based PDS system with identity verification of beneficiaries
is built-in. In order to make the transition to DBT feasible and successful, the paper
recommends improvements and investments by states/UTs into ensuring adequate food grains
in the open markets, inclusive banking infrastructure and diverse payment channels, sufficiency
of the food subsidy amount and display of leadership and political will to reform the PDS
through DBT. This paper argues that DBT has a potential to make way for a system of social
security or universal basic income, where every citizen receives income support – the size of
which can be adjusted based on his/her needs and vulnerability.
About the Authors: Shweta Saini is Senior Consultant [email protected] , Sameedh
Sharma is Research Assistant, [email protected] , Ashok Gulati is Infosys Chair
Professor for Agriculture [email protected] and Siraj Hussain is Senior Visiting Fellow,
ICRIER, [email protected]
__________
Key Words: National Food Security Act (NFSA), FCI, Cash Transfers, CCTs, Financial
Inclusion, direct benefit transfer (DBT), Public Distribution System (PDS),
Indian agriculture, Aadhaar, JAM, Grain Leakages
JEL Classification: Q18, Q01, I38, E64, D61, H53
Authors’ email: [email protected]; [email protected];
[email protected]; [email protected]
_________
Disclaimer: Opinions and recommendations in the report are exclusively of the author(s) and not of any other
individual or institution including ICRIER. This report has been prepared in good faith on the basis of information
available as on the date of publication. All interactions and transactions with industry sponsors and their
representatives have been transparent and conducted in an open, honest and independent manner as enshrined
in ICRIER Memorandum of Association. ICRIER does not accept any corporate funding that comes with a
mandated research area that is not in line with ICRIER’s research agenda. The corporate funding of an ICRIER
activity does not, in any way, imply ICRIER’s endorsement of the views of the sponsoring organisation or its
products or policies. ICRIER does not conduct research that is focused on any specific product or service provided
by the corporate sponsor.
This paper is also being published by Zentrum für Entwicklungsforschung (ZEF), University in Bonn, Germany.

v
Executive Summary
The Indian Government has identified a unique opportunity in using Information and
Communication Technology (ICT) based solutions to streamline its inefficient, ineffective, and
expensive subsidy operations. By bringing all subsidies, mainly food and fertilizer subsidy,
under the ICT platform, the government aims to make its subsidy operations and delivery
mechanisms- transparent, efficient, and effective.
Food subsidy is the largest component of government’s subsidy bill and is focus of the paper.
Authors evaluate the possibility of substituting the existing system of subsidized grain
distribution, i.e. Public Distribution System (PDS) with ICT-based Direct Benefit Transfer
(DBT) system. Implementing DBT for food will imply substitution of the existing physical
grain entitlement system under PDS/NFSA with a cash transfer made directly into the bank
accounts of the beneficiaries.
The ongoing policy discussions and strategies for executing DBT-food in India are observed
to be prescriptive in nature and suffer, inter alia, on two accounts. One, they view the transition
of states from existing PDS to ICT based DBT food as one-disruptive change rather than as an
incremental process that contributes to making a system gradually ready for the big transition.
Two, by prescribing a uniform timeline for implementation in all the 36 Indian states and Union
Territories (UTs), policy makers fail to acknowledge the diverse economic, social, and
financial vulnerabilities in different parts of country.
The paper attempts to address this gap in political thinking and strategy formulation and present
a case for a phased approach to roll out DBT in the Indian food sector. It proposes a scientific
way of evaluating a state/UT’s “readiness” for shifting from PDS to DBT in food. The
“readiness” analysis involves studying a state’s performance on three parameters: their
demographics, performance of existing PDS and the current state of their banking
infrastructure. Identification of these parameters draws on learning from national and
international experiences in DBT for food, in particular that of Chandigarh and Puducherry
(where it is completely rolled-out) that are detailed in the paper’s first part.
The analysis reveals that in the next five years i.e. by 2022, all Indian states and UTs can replace
their existing PDS with DBT-food. We divide the 36 states/UTs into four Phases. The states
that are most ready for DBT transition (Phase 1) are Punjab, Goa, Delhi, Daman and Diu,
Chandigarh and Puducherry and they may make this shift in the next one year i.e. by 2018. In
the second phase are six states- Haryana, Tamil Nadu, Andhra Pradesh, Telangana, Karnataka
and Kerala- who may transition to DBT by 2019. States with a very high share of nation’s poor
and malnourished and/or have high banking infrastructural deficits, are put into the Phase 3
and these 11 states are Madhya Pradesh, Chhattisgarh, Rajasthan, Jharkhand, Bihar, Odisha,
Uttar Pradesh, West Bengal, Dadra & Nagar Haveli, Maharashtra and Gujarat. These states
may take about three and half years (i.e. by 2021) for implementing DBT-food. The last phase
comprises of 13 states (Arunachal Pradesh, Assam, HP, J&K, Manipur, Meghalaya, Mizoram,
Nagaland, Sikkim, Tripura, Uttarakhand, A&N Islands and Lakshwadeep) that have been given
a special category status by Union Government and the erstwhile Planning Commission. These

vi
13 states have a low population density, or are geographically located in remote areas, and/or
are socio-politically and economically sensitive areas.
The states in Phase 3, 4, and 5 are given more time before they implement DBT-food so that
they address their existing infrastructural deficits. For these states, the paper proposes an
interim phase consisting of a reformed PDS employing IT solution for identity verification of
beneficiaries.
For cities, towns, urbanised areas in states in the last three Phases whose performance on the
three parameters is better than their respective states, the paper proposes a hybrid approach
whereby they can shift more quickly to DBT even as the rest of the State puts in place the PDS
reform package.
Overall, a phased approach with PDS reforms, maximum digitization and use of ICT and
JanDhan-Aadhaar-Mobile (JAM) technologies and a secure criteria-based preparation for a
shift to DBT in food is proposed in the paper.
In order to make the transition from PDS to DBT-food successful, specific policy
recommendations are made in the paper. Some of these recommendations are:
1. Open market grain availability: This will make or break the transition. Unless the
Centre and the states ensure availability of enough food grains in the open market, the
transition to DBT food is unlikely to be successful;
2. Inclusive financial integration: Even if we have adequate availability of food grains in
the open market, if the banking infrastructure is not inclusive, DBT food will not
deliver. Thus, simultaneous efforts are required to increase the number of bank
branches, ATMs and BCs. There is a need to include Post offices, cooperative banks
and even large PACS (which currently are not part of the core banking system) into this
system;
3. Innovations in payment channels: Apart from vertical expansion of the banking
network, we also recommend horizontal expansion of payment channels;
4. Hedge farmers’ market risks: As a consequence of DBT food when the MSP
procurement operations are scaled-down, the Centre and states should together work
towards creating and facilitating deep and wide alternative markets for farmers to sell
their surplus food grains;
a. Provision of an unconditional cash transfer to the farmer: The government may
also consider, in the longer run, substituting the existing input subsidy support for
agriculture (including fertiliser subsidy) and output price support to farmers with a
cash transfer made directly into the farmers’ bank accounts;
5. Introduction of policies to complement the system: In order to avoid diversion of the
transferred cash towards vices, government should ensure that the entire economic

vii
system grows up to meet the increased demand that is likely to result from greater
disposable incomes with a household. In particular, there is a need to ensure
commensurate increase and stable supply of high-value food, education and healthcare
services;
6. Adequacy of the food subsidy amount: If instead of MSP in the food subsidy formula
(1.25*MSP – CIP), we can have the Economic cost, then the current problem of
“inadequacy” of the food subsidy transfer amount, faced in Chandigarh and
Puducherry, may be resolved; and
7. Leadership and political will: Political motivation in the States to implement the DBT
or reforms in the PDS is a vital factor determining the future of PDS reforms.
Overall, DBT has the potential to make way for a system of social security or universal basic
income, a special income support- provided to every citizen- whose size can be adjusted to his
or her needs and vulnerability. Although the concept of basic income is still at its infancy even
in the most developed countries, the path to creating such a system has to be through the DBT.
Notwithstanding initial problems in implementation and the problems of labour markets that
DBT may trigger, a cash transfer systems has become a potent tool in the government’s
armoury of social welfare. As the country transitions from its low income position to becoming
the world’s fastest growing economy in a few years, a cash transfer system delivering a social
security transfer to all can promote a growth process that is inclusive, efficient and sustainable.
1
Indian food and welfare schemes: Scope for digitization towards cash transfers
Shweta Saini, Sameedh Sharma, Ashok Gulati, Siraj Hussain and Joachim von Braun
Background: India’s Welfare System
India is home to the largest population of poor in the world as also the largest number of
malnourished children (World Bank and Hungama 2011). The erstwhile Planning Commission
of India estimates 22 percent1 of Indians (close to 270 million persons) as poor2, which is
greater than the population of Indonesia (the 4th most populous country in the world).
Despite rapid economic growth in the last two decades with much success in the manufacturing
and services sectors, the country continues to be largely agrarian. Nearly 47 percent of the
Indian workforce is employed in Agriculture (in 2015-16 as per Labour Bureau3) and it
contributes about 17.5 percent (in 2015-16) to the country’s GDP. Low productivity,
dependence on monsoons rains for irrigation, absence of agri-extension services, lack of
markets and supporting infrastructure such as pre-cooling and cold storage facilities, value-
chains etc., and insufficient investments in research and development have gradually made
Indian farming financially non-viable.
An average Indian spends close to half (about 46 percent) of his monthly consumption
expenditure on food alone and cereals are still the most important component in the food basket.
With a large and growing number of people to feed in an economy that is agrarian and highly
vulnerable due to volatility in food prices and the role of private sector and international trade
is restricted, the burden of adjustment falls on the Government. The framing of India’s
Constitution in 1950 provided for creation of a welfare state. Article 47, included in the
Directive Principles of State Policy, stated that, “State shall regard the raising of the level of
nutrition and the standard of living of its people and the improvement of public health as among
its primary duties”. Later, when the concept of National Planning was adopted in 1955, a
socialist pattern of society and model of development was put in place. Having suffered
numerous famines, droughts, and exploitation by private players during history (Saini and
Kozicka 2015), the government adopted a paternalistic approach to welfare, regulating mostly
all aspects affecting its country’s citizens.
Current scenario
As per the Union Budget 2016-17, there are 950 welfare schemes run by the Central
Government and this number multiplies if we add state-level schemes (Economic Survey 2016-
17). In terms of budget allocation, these central schemes together account for about 5 percent
1 World Bank estimates India’s poverty to be 33 percent of the total population in 2011 i.e. higher than that of
the Planning commission. This is due to differences in the methodology for estimation and the poverty line
used. World Bank uses the international poverty line at USD 1.25/day to compute the number of poor 2 Estimated based on the Tendulkar Methodology (2012) 3 As per NSSO’s Employment and Unemployment situation in India (2011-12), this share is 49 percent and as
per Census 2011, it is 55 percent.

2
of the country’s GDP and close to half of this allocation is meant for just 11 schemes that
include Public Distribution System (PDS), sale of fertilisers at low prices, Mahatma Gandhi
National Rural Employment Guarantee Act (MGNREGA), mid-day meal scheme, LPG,
several pension schemes, National Health Mission, and Integrated Child Development
Services’ Schemes (ICDS). While some of these schemes deliver cash directly to their
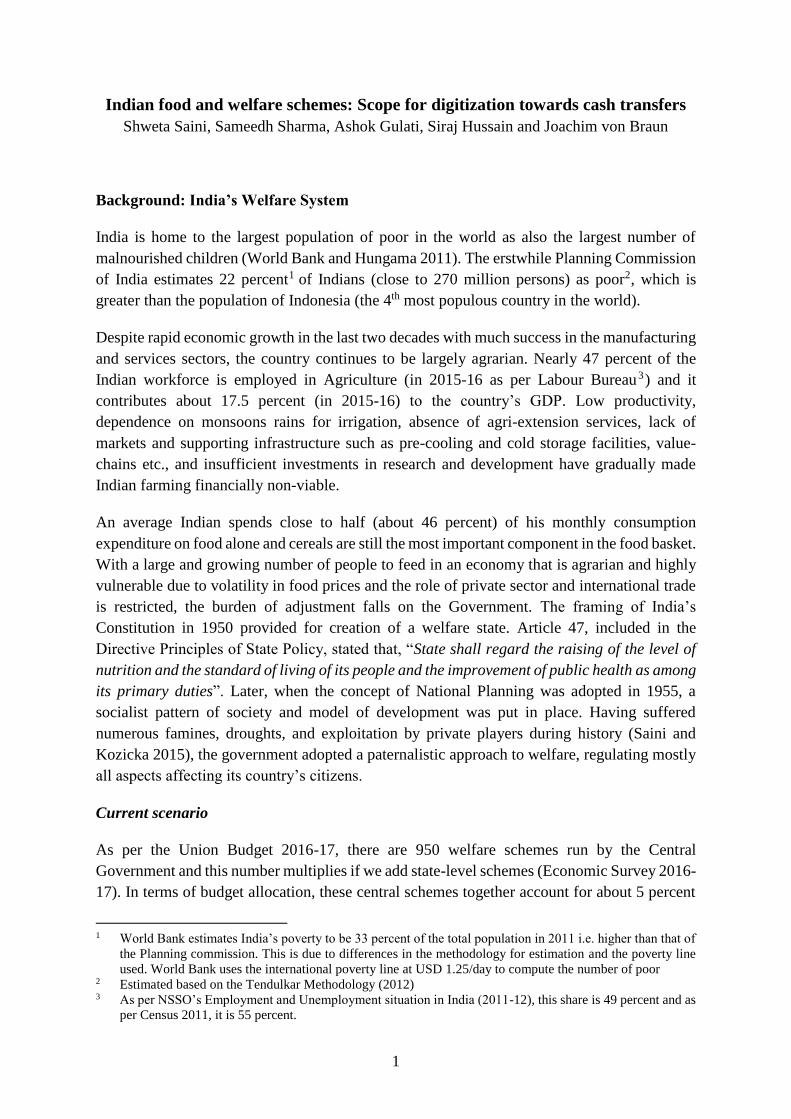
beneficiaries, others deliver subsidized goods and services for consumption (See Figure 1)
Figure 1: Welfare in India*
Note: PDS= Public Distribution System; IGMSY (CCT)= Indira Gandhi Matritva Sahyog Yojana (a
conditional cash transfer scheme); MGNREGA= Mahatma Gandhi National Rural Employment
Guarantee Act
Source: Authors’ drawing
*As on Feb, 2017
Most of these schemes operate unique delivery chains but lack effective channels monitoring
the flow of benefits to individual beneficiaries/households and for grievance redressal. For
example, payments under the Janani Suraksha Yojana 4 scheme to beneficiaries are made
through a multitude of intermediaries like ASHA workers, doctors, hospitals, primary health
centres etc. Evaluation and assessment of this scheme reveals payments being diverted in this
long supply chain (UNFPA 2009).
These inefficiencies and inefficacies have resulted in significant wastage of fiscal resources,
which has not gone unnoticed by the Government. ‘Leakages’ in welfare schemes have
consistently raised India’s expenditure on welfare. Of these schemes, the largest expenditure is
4 Cash based scheme for promoting institutional delivery under the National Rural Health Mission (Ministry
of Health, GoI)

3
for subsidies on the three Fs— food, fuel and fertilizers— which alone account for close to 2%
of the GDP5, amounting to INR 2.31 lakh crores in the financial year, 2016-17.
Of this, food subsidies were the largest component (54 percent). In rupee terms, this is
equivalent to INR 1.09 Lakh Crore6. This has been more or less the same case for the last
decade. Between 2007-08 and 2016-17, food has had the highest share in the total subsidy bill
incurred by the central government for most years (41 percent on an average).
Figure 2: Trends in Food Subsidy in 2011-12 Prices (INR Lakh Crore)
Source: Budget Documents of Central Govt
Note: Subsidy expenditure deflated using national GDP deflator with base 2011-12
Figure 2 shows that between 2007/08 and 2016/17, while the total subsidies grew about 1.5
times, food subsidies grew 1.8 times (in real terms). The most important component of food
subsidies is the subsidy given under the Public Distribution System (PDS). Thus, the key to
reforming India’s welfare system starts with the PDS and hence the focus of this paper.
The paper is divided into 4 sections. Section I briefly discusses the history and evolution of
PDS. In Section II, the concept of cash transfers, its history and national and international
experiences are presented and analysed. The DBT-food experience of the two UTs- Chandigarh
and Puducherry- is also analysed in this Section. The evaluation of the states for their readiness
for DBT-food is done in Section III and the policy recommendations emanating from all the
Sections are presented in Section IV.
5 DBT Mission (2016) 6 In 2011-12 prices
0.00
0.20
0.40
0.60
0.80
1.00
1.20
1.40
0.00
0.50
1.00
1.50
2.00
2.50
3.00
2007-08 2008-09 2009-10 2010-11 2011-12 2012-13 2013-14 2014-15 2015-16 2016-17
Ind
ivid
ual
Su
bsi
dy
he
ads
(IN
R L
akh
Cro
re)
Tota
l Su
bsi
dy
(IN
R L
akh
Cro
re)
Total Subsidies Food Subsidies Fertilizer Petroleum

4
Section I: The Public Distribution System7
The British government, in 1939, introduced the concept of food rationing in India which
eventually led to the basic principles of the public distribution system (PDS) being developed
in 1942. The death of four million people, due to starvation, during the Bengal famine of 1943
(Sen, 1981) gave political legitimacy to the PDS. Since then, it has been one of the most stable
elements of the Indian food policy, delivering food security to most poor people across India.
The System
Under the PDS, the government distributes grains (mainly rice, wheat, coarse cereals) to
beneficiaries at subsidized prices, called the central issue price (CIP), through a network of fair
price shops (FPS) spread throughout the country. The government procures the distributed
grain from the farmers at a minimum support price (MSP)8.
The PDS is run jointly by the central and state governments. The identification of beneficiaries
is based on their economic vulnerability. Using poverty estimates from the Planning
Commission, the Central Government estimates the number of poor people in the states and
Union Territories. The state governments have to identify the poor families and create the
supporting infrastructure (including FPSs, delivery trucks etc.) to ensure a timely, transparent
and effective delivery of grains to them. Upon identification, beneficiaries are issued a ration
card that is used to record the beneficiary’s entitlements and his actual grain offtake. The Food
Corporation of India (FCI), set up in 1965, is the central government’s primary agency for
procuring, storing, and distributing grain in this system. In recent years, some States have taken
up the role of procurement and they claim subsidy directly from GoI under decentralised
procurement scheme (e.g. M.P., Chhattisgarh, and Andhra Pradesh).
Evolution of PDS
In the initial years up until late 1950s, PDS delivered grains only in urban food-scarce areas.
As agricultural production grew with the Green Revolution in the mid-1960s, tribal areas and
areas with widespread poverty were included. By 1992, the PDS became universal with all
citizens having the right to receive food from it. However, the system was found to be
ineffective in hilly and desert regions as in remote villages where the large majority of India’s
poor lived. In order to streamline and strengthen the PDS, the Central Government, in
consultation with the state governments identified such areas and expanded the PDS
infrastructure to deliver subsidized food to all in these inaccessible areas. This system was
referred to as the Revamped Public Distribution System (RPDS). Later the Targeted Public
Distribution System (TPDS) replaced the RPDS in June 1997. While the RPDS targeted ‘all in
the poor areas’, the focus of the TPDS was on ‘poor in all areas’.
7 See Saini and Kozicka (2014) for a more elaborate description of the evolution of the PDS in India 8 Before the beginning of a crop’s marketing season, GoI declares its MSP. It is the price at which the
Government of Indian offers the farmer for a crop. The MSP is declared for 23 crops each year.

5
At the start of the TPDS, food grain was distributed to only the below-poverty-line (BPL) and
above-poverty-line (APL) categories. This included, 60 million poor families identified by the
Central Government and who received a total of 7.2 million metric tonnes (MMT) of grain
annually, under the scheme. In December 2000, the Antyodaya Anna Yojana (AAY) scheme
was launched by Government of India, and the beneficiaries were one crore of the poorest of
the poor, to whom the food, mainly rice and wheat, were distributed at highly subsidized prices.
The TPDS thus had three categories of beneficiaries – APL, BPL and AAY. The quantity of
grains and CIP varied across these categories.
Driven by socio-political motivations, several state/UTs have expanded the PDS system. This
has happened in largely four ways: by increasing the coverage of population, expanding the
TPDS basket of commodities, reducing CIPs below that fixed by the Central Government
(sometimes even selling it for free), and by any combination of the above three. States/UTs
like Chhattisgarh, Tamil Nadu, West Bengal, J&K, Puducherry, are some examples where such
extensions are widespread.
Current System
In 2013, the system of TPDS underwent a transformational change with the passage of the
National Food Security Act (NFSA). The Act combined existing schemes such as the TPDS,
Indira Gandhi Matrutva Sahyog Yojana9, and other welfare schemes like the mid-day meal
(distribution of a mid-day meal to school-going children in government schools) under the
umbrella of NFSA. The three types of TPDS beneficiaries were replaced by two categories of
beneficiaries, i.e. priority beneficiaries (PB), and AAY beneficiaries. Close to 67 percent of
India’s population is covered by the Act that is to deliver close to 62 MMT of grains to about
813.4 million people. Close to 100 million NFSA beneficiaries are AAY beneficiaries and the
remaining, that is priority beneficiaries, are the sum of the BPL and some APL individuals
from the TPDS10.
Unlike the practice in the TPDS, the CIPs for both categories of beneficiaries are same and
fixed at INR 3 and INR 2 per kilogram, for rice and wheat, respectively. Their entitlements,
however, differ. While a PB now received five kilograms of food grain per month (per person),
an AAY household still received his pre-NFSA entitlement of 35 kilograms per family per
month. All 36 states and Union Territories have implemented the NFSA as on date.
Reforms in the PDS
Movement from the PDS to the RPDS, and later to the TPDS, and the NFSA in 2013, have all
been part of government’s drive to target the PDS more accurately. In addition, the government
has been undertaking reforms to make the TPDS operations transparent, its targeting effective
and the resource-use more efficient.
9 A conditional cash transfer scheme for pregnant women 10 As per the accepted number of beneficiaries estimated by GoI under the scheme

6
The Central Government began a scheme of end-to-end computerization of PDS operations in
2012 aiming to modernize and improve eight major aspects of the PDS supply chain. These
were: digitization and Aadhaar seeding of ration cards, online allocation of food grains (from
Central Govt to States, States to districts and districts to FPS), computerization of supply-chain
management, creation of a transparency portal, creation of an online grievance redressal
mechanism, ensuring a 24-hour toll free helpline and using ICT based tools like the electronic
point of sale (ePoS) device to record transactions11. Later, this computerization drive was
combined with government’s nine-point action plan, which included the review of APL/BPL
beneficiary lists, taking action against those involved in leakages, ensuring display of
beneficiary lists at FPS, guaranteeing doorstep delivery of food grain, making certain the timely
availability of food grains, and also undertaking training of members of the FPS level vigilance
committee.
As per the TPDS reform agenda of the government, states and UTs had to undertake reforms
that can be clustered under three heads:
Steps to be taken to improve the efficacy of the system: the nine-point action plan,
Steps for making the system transparent and modern under computerization of operations
and
Steps that the states/UT governments had to undertake to smooth TPDS operations.
Steps under each cluster are detailed in Table (1) below.
Table 1: PDS reforms
Computerization of
Operations Nine-Point action Plan Measures to smoothen operations
Digitization of Ration
Cards
Aadhaar Seeding in
RCs
Online Allocation of
foodgrains
Computerization of
Supply-chain
Management
Transparency Portal
Online Grievance
Redressal
Toll Free Helpline
Numbers
Operational ePoS
Review of BPL / AAY list
Ensure leakage-free distribution
of foodgrains by taking action
against guilty
Involvement of PRI members
Display of BPL/AAY list on the
FPS
District and FPS-wise allocation
of foodgrains put on website for
public scrutiny
Doorstep delivery of foodgrains
Timely availability of foodgrains
at FPS
Training of members of FPS level
Vigilance Committee
Steps taken towards
Computerization of TPDS
operations
Adoption of Citizen's Charter by
State/UT Governments
Deletion of bogus/ineligible ration
cards by the State/UT
Governments
Monthly Certification by village
panchayat/ urban local bodies/
women's self-help groups on
delivery on TPDS foodgrains at
FPS
Number of FPS allotted to various
groups in the States/UTs
Action against defaulters who
issued/ possessing bogus ration
cards
Wheat flour distribution
Training program - taken up
Public awareness campaign taken
up
Source: DFPD
11 http://dfpd.nic.in/computerisation-of-tpds-pd.htm

7
The progress of implementation of these reforms is different for different states and UTs. As
on March 2017, the ration card data had been digitized in all 36 states/UTs: about 77 percent
of ration cards had been seeded with Aadhaar, with states/UTs such as Andhra Pradesh,
Chhattisgarh, Delhi, Telangana, Rajasthan reporting 100 percent seeding. Close to 30
states/UTs, are allocating PDS grains online now and 20 have computerized their supply-chain
management systems.
Because of these continuous reforms, about 6.3 crore ineligible and ghost ration cards were
identified and deleted from the list of PDS beneficiaries. Rates of grain leakage from the PDS
have reduced from 54 percent in 2004-05 (Himanshu and Sen 2013) to 40-50 percent in 2011-
12 (Gulati and Saini 2015 and Dreze and Khera 2015). The Economic Survey 2016-17 states
that 40 percent of the bottom 40 percent of the country’s population was excluded from the
PDS in 2011-12 but reforms have led to a significant increase in the share of PDS subsidy
received by the bottom 40 percent since 2011-12.
In order to give a fillip to the reform process, in 2015, the Department of Food and Public
Distribution (DFPD)12 released two notifications: Cash Transfer of Food Subsidy Rules and
Food Security (Assistance to State governments) Rules. As per these notifications, Central
Government offers the state and UT governments, two choices for reforming their respective
PDS machinery going forward:
1. Either replace the existing PDS (distributing grains) with DBT i.e. direct payment of
subsidy into the identified beneficiary’s account; or
2. Fully computerize and reform its PDS operations and distribute food grain using Aadhaar-
based biometric authentication process or ePoS. This option will be referred to as Aadhaar
enabled PDS or A-PDS going forward from here in the paper.
While both, the DBT and APDS are examples of how technology can optimize the operation
of welfare schemes, the former is more closely linked to the Centre’s digital technology
umbrella ICT initiative called JAM or Jan Dhan, Aadhaar and Mobile. Despite clear
differences, both APDS and DBT are confused to be the same. In must be understood here that
DBT is the practical exponent of income support programs using ICT whereas APDS still falls
under the category of ‘in-kind’ programs. In later sections, we will discuss the efficacy and
efficiency of DBT and how the A-PDS can serve as a bridging medium-term policy. The next
two sections look at details of these two systems.
Aadhaar-based PDS (APDS)
The APDS is an upgraded form of the existing PDS incorporating technology-based solutions
to increase the operational and cost efficiency of the system. It ensures that food grains are
released only after a family member is authenticated biometrically.
12 Under Ministry of Consumer Affairs, Food and Public Distribution, GoI

8
Last-mile delivery of food grains under the APDS is through a Point of Sale (PoS) device
(Figure 3) that is connected to a cloud-based repository containing ration card information
(operated by the state) and Aadhaar card information (operated by UIDAI13).
Figure 3: PoS machine in Andhra Pradesh
Source: Govt. of Andhra Pradesh
All PDS beneficiaries are required to seed their ration cards with Aadhaar numbers under this
system. The biometric readings on the PoS at the FPS are compared with the Aadhaar card
data and upon matching, the entitlements are released to the beneficiary. The entire process of
identification and authentication is expected to complete within a few seconds. End-to-end
computerization of the PDS thus is a necessary condition for APDS, which can check both,
ineligible individuals from obtaining food grains and corrupt FPS dealers or other stakeholders
in the PDS supply chain from diverting or pilfering food grains. The system enables both states
and the Centre to track the flow of food grains on a real-time basis.
The Central Government in the Food Security (Assistance to State governments) Rules notified
in August 2015 offered to support installation of PoS devices in FPS.
Progress of implementation of APDS
As of March 2017, ten states had automated FPSs and implemented the APDS. These are—
Andhra Pradesh, Gujarat, Daman and Diu, Madhya Pradesh, Tamil Nadu, Chhattisgarh,
Rajasthan, Jharkhand, Dadra & Nagar Haveli and Haryana. Of these states, Andhra Pradesh
has been the model state for APDS; it was the first to automate all its FPSs and has also adopted
innovative practices to improve the system, some of which are:
Use of iris scans as an alternative to finger prints
Option to send one-time passwords to registered mobile phones in case of failure to
authenticate biometrically.
13 UIDAI stands for Unique Identification Authority of India, an agency set up by the Central Government in
2009. The UIDAI is mandated to assign a 12-digit unique identification number to all citizens of the country.
This number will be based on the individual’s biometric and demographic data.

9
On-the-spot registration for beneficiaries without Aadhaar or whose authentication failed
through both biometric and OTPs
Special antennas for FPS to improve internet connectivity
Battery-charged PoS devices to allow operation during power outages.
In other states, pilot surveys are underway to identify practices that will improve the delivery
of food grains under the APDS. Gujarat, for example, has decided to optimize costs by using
laptops and tablets instead of PoS devices. In Jharkhand, a system of deferred authentication
has been introduced which enables beneficiaries biometric readings to be authenticated at a
later period if there are power outages. In Karnataka, a pilot to test Interactive Voice Response
Systems (IVRS) as ‘coupons’ has been initiated in Bengaluru to enable beneficiaries to obtain
food grains by showing a unique code sent by SMS and by voice to the registered mobile
number. Madhya Pradesh has introduced an offline mode that verifies beneficiaries on a
weekly basis (rather than in real time) in districts where internet connectivity is poor.
While the APDS is making progress, we have identified a few problems associated with the
use of ePoS machines or APDS. These are:
1. Problem with biometric authentication at FPS: This problem was highlighted in Rajasthan,
Gujarat, and Karnataka where fingerprints of the elderly and of those engaged in manual
work, could not be read by the PoS devices. This necessitated multiple visits by
beneficiaries to the FPS14 causing inconveniences and redundancies like loss of a day’s job
of a daily wage labourer, longer queues and delays in release of grains to others etc. As a
solution, many FPS dealers have started to manually register such beneficiaries to allow
quick resolution of the problem, but this re-opens doors for frauds and rent-seeking
involving the use of bogus and/or duplicate ration cards;
2. Poor internet connectivity: This disrupts the process of verification in real time and leaves
open opportunities for grain diversion and pilferage by FPS dealers since information on
PoS sales is not sent to the main PoS server operated by the state Govt. Madhya Pradesh’s
use of the ‘offline mode’ is an innovative solution that may need to be scaled up to national
level;
3. Lack of continuous power supply: The ePoS can work in the offline mode if internet access
is not available, but the absence of power stalls the system completely. Some states have
promoted installation of solar panels to circumvent this problem but the idea is still at a
nascent stage. The absence of an economic and sustainable solution, will delay adoption of
the APDS and the FPS will continue to operate in its old and ‘leaky’ ways.
4. Lack of financial and administrative resources and trained personnel: Insufficient funds
for the ePoS purchases, installation and training of personnel at the FPS for working on it
restrict the progress of the APDS. Similarly, confusion about the state’s financial
14 http://www.ndtv.com/opinion/yes-aadhaar-is-a-game-changer-in-wrecking-welfare-schemes-1434424

10
obligations towards issues such as maintenance of devices often results in damage to the
devices, without any scope for replacement.
We now look in detail at the second alternative of reform suggested by the Central Government
i.e. direct benefits transfer (DBT) for food. After understanding the DBT process, we document
learning from international and national experiences and evaluate the scope for DBT in food
in India.
Direct Benefits Transfer System in India
Globally, cash transfers are generally of three kinds – Conditional, Unconditional, or
Stamps/Vouchers. Table 2 gives the salient features of each type.
Table 2: Summary of the three types of cash transfer programs
Conditional (CCTs) Unconditional (UCTs) Stamps/Vouchers
Beneficiaries receive
cash subject to
compliance with
conditions
Used to link short-term
liquidity requirements
with long-term
development of human
capital
Conditions are mainly
related to health and
education
Beneficiaries receive cash
unconditionally
Beneficiaries are free to
spend the amount
received
Suitable for
supplementing just
consumption needs
Ideal for areas where
there is lack of resources
(e. g. health centres)
Beneficiaries are provided
with
tamps/cards/vouchers
which carry a monetary
value.
Can be redeemed for only
goods specified by the
implementing agency
Ideal for influencing the
consumption pattern of
beneficiaries
Source: World Bank (2014)
In India, cash transfers schemes are generally either conditional or unconditional as stamps or
vouchers have not generally found favour in policy actions15.
Purpose of any cash transfer could be:
To provide income support to encourage certain behaviour: For example scholarships for
studies, vaccinations in children, general health care of girls, senior citizens, pregnant and
lactating mothers etc.
To provide subsidy for supporting purchases of essential products like food, fuel,
agricultural inputs, etc.
15 Only select states have used stamps for brief periods. Andhra Pradesh, Bihar and Tamil Nadu experimented
with Food stamps/coupons. However this system failed in all three states and has been discontinued. See
Pritchard and Choithani (2015) and Virmani (2006)

11
To provide direct income in the hands of beneficiaries identified based on economic
vulnerabilities like old age people get pensions, unemployed people get unemployment
benefits
In 2013, when Government of India introduced the Direct Benefits Transfer (DBT) it was
viewed as a way to simplify the delivery chain of benefits under various welfare schemes. This
system is based on a digital platform of payments where the cash subsidy (or benefit) is to be
transferred directly into the Aadhaar-linked bank account of identified beneficiary. This system
allows implementing agencies and beneficiaries alike to track flow of funds for various
schemes through a single interface, enabling both transparency and efficiency.
The step-wise operations under DBT
This process requires identification of beneficiaries, correcting for inclusion and exclusion
errors, estimating the cash transfer amount, creating a virtual platform and physical
infrastructure for transferring cash and ensuring smooth withdrawal of money from the bank.
The process of fund flow in the DBT thus involves broadly three activities - Verification,
Preparation, and Payment. All three activities are managed by an electronic fund management
system set up by the Ministry of Finance, called the Public Financial Management System
(PFMS)16.
PFMS has been developed to enable implementing agencies such as states, the Central
Government, and local bodies to - (i) maintain information in a uniform format containing
beneficiaries (names, addresses, Aadhaar card and bank account information); (ii) initiate
payments through banks to beneficiaries, and, (iii) to allow these agencies to track the flow of
payments to each household/individual. This should improve the efficiency of implementation
across various schemes of the government (see figure 2).
For example, prior to its introduction (and of the DBT) the centrally-sponsored scheme, Janani
Suraksha Yojana, distributed benefits by cash or cheque through the long delivery chain that
we have already acknowledged and thus permitting ‘leakage’/diversion of funds away from the
system. The long delivery chain created opportunities for rent seeking and because the ministry
was unable to monitor the disbursal of funds to the beneficiary, the scheme’s welfare effects
were assessed to be diminishing overtime (UNFPA, 2009). Now, under DBT this supply chain
gets simplified and the PFMS allows for tracking these payments and ensuring that they go to
the correct beneficiaries (See Figure 4).
16 Set up specifically under the control of the Controller General of Accounts

12
Figure 4: DBT process of fund flow
Source: Author’s Interpretation
The DBT was rolled out with 27 current, cash-based schemes. Currently, 84 schemes operated
by 17 different ministries have been brought under the ambit of the DBT (Figure 5). All are
cash-based (including three conditional schemes) and one subsidy scheme i.e. the Pradhan
Mantri LPG Subsidy PAHAL Yojana (DBTL or direct benefits transfer for LPG)17.
17 PAHAL stands for Pratyaksh Hanstantarit Scheme Started in 2013, PAHAL substituted an existing LPG
cylinder subsidy scheme, with a cash transfer made directly into the beneficiary’s bank account. The scheme
made it compulsory for bank accounts to be seeded with Aadhaar allowing for subsidies to be transferred to
only the true beneficiary. This arrested the diversion of LPG subsidy to duplicate LPG connections as well
as use of LPG for commercial activities. The beneficiaries of PAHAL, however, are largely middle class
households in urban areas with better literacy levels and higher access to banks.
Implementing
Agency – States,
Districts, Other bodies
Central Ministry for relevant
scheme
PFMS Coordinates all activities under DBT
Banks Private,
Public, and Post Offices
Ben
efic
iarie
s
(1) Verification- Implementing agency sends digitized list to PFMS for verification
(2) Preparation – Central Ministry verifies payment proposal for cash transfer and sanctions release of funds
(3) Payment – Implementing agencies initiate payment through PFMS to banks
(4) Payment II – Banks transfer entitled amount to beneficiaries who can withdraw from Branches, ATMs, and BCs
13
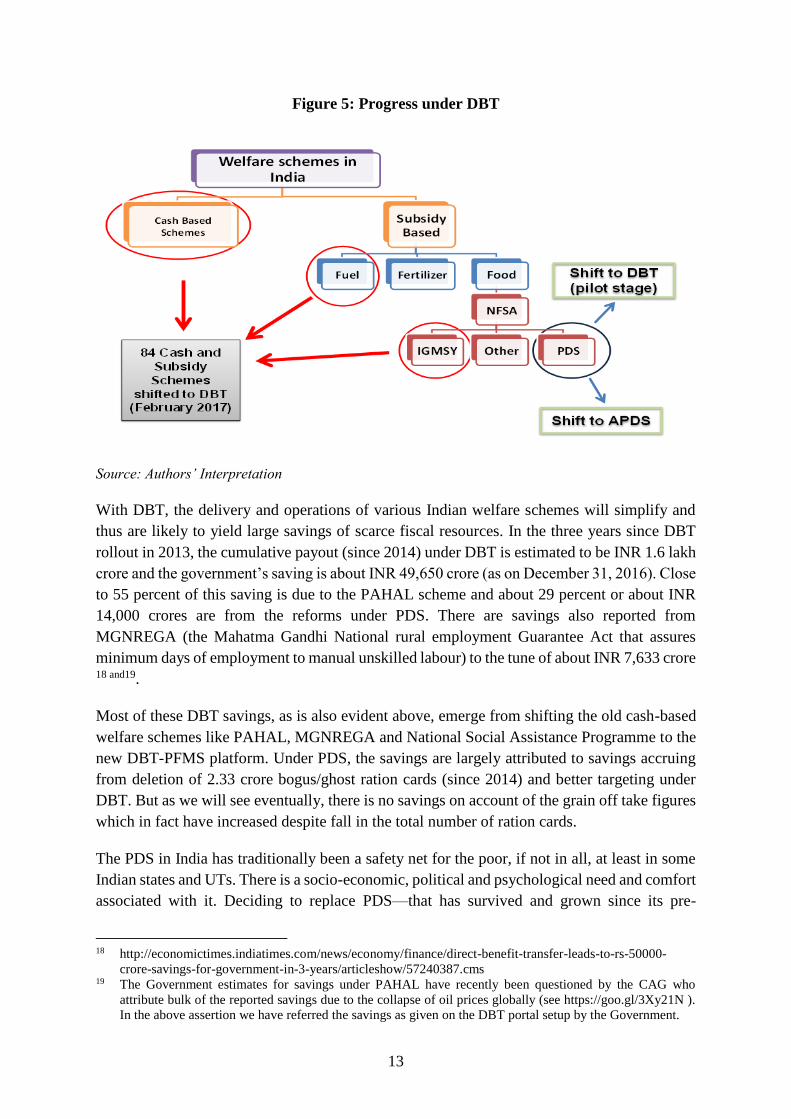
Figure 5: Progress under DBT
Source: Authors’ Interpretation
With DBT, the delivery and operations of various Indian welfare schemes will simplify and
thus are likely to yield large savings of scarce fiscal resources. In the three years since DBT
rollout in 2013, the cumulative payout (since 2014) under DBT is estimated to be INR 1.6 lakh
crore and the government’s saving is about INR 49,650 crore (as on December 31, 2016). Close
to 55 percent of this saving is due to the PAHAL scheme and about 29 percent or about INR
14,000 crores are from the reforms under PDS. There are savings also reported from
MGNREGA (the Mahatma Gandhi National rural employment Guarantee Act that assures
minimum days of employment to manual unskilled labour) to the tune of about INR 7,633 crore
18 and19.
Most of these DBT savings, as is also evident above, emerge from shifting the old cash-based
welfare schemes like PAHAL, MGNREGA and National Social Assistance Programme to the
new DBT-PFMS platform. Under PDS, the savings are largely attributed to savings accruing
from deletion of 2.33 crore bogus/ghost ration cards (since 2014) and better targeting under
DBT. But as we will see eventually, there is no savings on account of the grain off take figures
which in fact have increased despite fall in the total number of ration cards.
The PDS in India has traditionally been a safety net for the poor, if not in all, at least in some
Indian states and UTs. There is a socio-economic, political and psychological need and comfort
associated with it. Deciding to replace PDS—that has survived and grown since its pre-
18 http://economictimes.indiatimes.com/news/economy/finance/direct-benefit-transfer-leads-to-rs-50000-
crore-savings-for-government-in-3-years/articleshow/57240387.cms 19 The Government estimates for savings under PAHAL have recently been questioned by the CAG who
attribute bulk of the reported savings due to the collapse of oil prices globally (see https://goo.gl/3Xy21N ).
In the above assertion we have referred the savings as given on the DBT portal setup by the Government.

14
independence form—primarily on economic grounds may be the most unjust end to a welfare
scheme. In the following sections, we thus examine the idea of DBT in food in India. We start
by synthesising learning from experiences in cash transfer schemes, both nationally and
internationally. We then qualitatively analyse and evaluate the case for DBT in food.
Section II: Cash Transfers
International Experience
The origin of cash transfer schemes can be traced back to the ancient Roman period. In the 20th
century, these schemes took the form of social pension schemes (for example, in South Africa)
or food stamps (in the US and Sri Lanka in the 1960-70s) and in the 1990s, the Latin American
Countries (LACs) popularized them as an instrument for poverty alleviation. When decades of
expenditure on untargeted food subsidy schemes failed to arrest the level of food insecurity
and the incidence of malnutrition among the poor in these LACs (Barraclough & Utting, 1987),
alternate policies were debated and experimented-with in the 1980s. Both Mexico and Brazil
were among the first to experiment with such alternative practices and which eventually led to
the introduction of conditional cash transfer schemes aimed at tackling problems of food
insecurity and poverty and for improving health and education levels.
In order to develop a DBT-food implementation strategy for India, we undertook a review of
international cash transfer schemes and experiences and modalities of selected schemes are
presented below:
Brazil
In 2003, there was high incidence of poverty, illiteracy and failing performances in health and
nutrition in Brazil when the government decided to implement Bolsa Familia (BFP). The
program identified beneficiaries through surveys and interviews conducted by municipal
offices in each province. Based upon fulfilment of certain conditions, households received cash
benefits into their bank accounts. These conditions centred on children and included- atleast 85
percent school attendance, monitoring of child growth at designated health centres and
providing them the necessary vaccinations; and pre and post natal care for pregnant and
lactating women. Failure to comply with any of these conditions led to either temporary
suspension from the scheme, or in the case of repeat offenders, removal from the beneficiary
list.
All identified beneficiaries have a unique social identification number used for making
payments to them. The size of benefit received by each household per month varies from R$15
to R$95 depending on family size and economic well-being. The transfer is made electronically
and each beneficiary household is given an electronic debit card. Withdrawals can be made at
authorized centres such as banks, lottery offices, ATMs and post offices. There are close to 50
million participants (26% of the total population) in this program and municipal offices update
the beneficiary database every 24 months (Aline, Gazola, & Hellmann, 2015).

15
Assessments of operations reveal that the BFP has been efficient in terms of delivering cash
benefits to the very needy. Lindert et al. (2007) estimated that 80% of benefits under the BFP
went to the poorest quartile of Brazil’s population. Aside from this, its impact on health,
education and food security is visible. Soares et al. (2006) showed that the GINI index for
Brazil (which was high and sticky for many decades) dropped consistently after the program
was launched. In terms of incidence of malnutrition, children of BFP households were also
26% more likely to achieve the normal height for their age than those in non-beneficiary
households, as shown by Santos et al. (2011). Overall, Brazil witnessed a secular decline in the
share of its total population that was food inadequate (FAO, 2015).
Mexico
In 1997, the Mexican government introduced, Oportunidades (now renamed Prospera), to
tackle poverty, promote food security, and improve health and education. The Mexican federal
government identifies beneficiaries and monitors them for compliance with laid-down
conditions. Cash benefits are transferred in the name of a female member of the identified
household and the amount transferred has two components: a food grant ( fixed). and an
education grant (subject to the the number of children in a household) (Roelen & Ulrichs,
2012). Receipt of the cash benefit is subject to fulfillment of conditions associated with health
and educaton. In the case of the former, pregnant or lactating women and young children are
required to have mandatory health checkups whereas for the latter, a minimum attendance of
85% is required for children going to school.
The amount is transferred bimonthly, and the average amount transferred is equivalent to 235
pesos. Benefits are transferred through an electronic payment system allowing beneficiaries to
directly receive cash into their bank accounts and withdrawn at various designated points
including non-banking financial institutions (Masino & Niño-Zarazúa, 2014).
In terms of scheme efficacy, Coady (2003) showed that 58% of the benefits from Progresa went
to the poorest 20% of the population of Mexico and this increased to 80% when the poorest
40% of the population were studied. Oportunidades, thus, in terms of providing benefits to the
real needy has been effective (Grosh, Coady, & Hoddinott, 2004). In terms of impact on health,
nutrition and education, Skoufias’s (2005) empirical findings on the impact of Oportunidades
show a positive effect on the enrollment of children. The incidence of illness among children
was obesrved to have reduced by 12% in households enrolled under the program. Hoddinott et
al. (2000) estimated that the average level of consumption for households increased by 14.5%
along with an increase in the diversity of dietary preferences and improvement in dietary
quality.
Despite the improved human capital indicators, overall income poverty has not declined much
in Mexico since the program started. Levy (2008) points out that the interaction of social policy,
including Oportunidades, with labor markets does not create a sound incentive structure for an
efficient allocation of labor in the economy for sustained poverty reduction. A locally focused,
decentralized cash transfer program sends a powerful disincentive for labor migration. Social
protection, in combination with social security and Oportunidades, may have been leading to

16
a larger informal sector with lower wages, lower productivity and lower economic growth. In
view of these problems, Levy (2008) argues that social policy reform has to be carried out
simultaneously with fiscal and labor market reforms.
Cash transfer schemes in other countries
Although popularized by LACs, cash transfers in the last two decades have also been adopted
by many developing countries in Africa, Central Asia and South Asia. Currently, over 130
countries operate UCTs and 63 countries operate CCTs (World Bank, 2015). Outside of the
LACs, Kenya, Pakistan, Bangladesh, Indonesia and Sri Lanka are some of the countries which
have implemented cash transfer schemes with success.
In Pakistan, the Benazir Income Support Program (BISP) is an unconditional cash transfer
scheme implemented across the country. The scheme provides additional liquidity for
supporting food consumption and for raising the level of education and reducing the incidence
of diseases among its impoverished households. The Pakistan government has made the BISP
a co-responsibility cash transfer program. Unlike conditions that are required to be monitored
and invite penalties for non-compliance, co-responsibilities are non-obligatory.
In Bangladesh, a similar scheme is to be introduced called the Income Support Program for the
Poorest, which incorporates the learning from its Shombhob CCT Pilot (implemented for a
year) where instead of conditions (which were imposed in the pilot study), co-responsibilities
are imposed.
Manley, Gitter, and Slavchevska (2012) in their comprehensive literature review found that on
average cash transfer programs have positive but insignificant impact on child nutrition.
Haushofer and Shapiro (2013), based on an Randomized Control Trial (RCT) in Kenya,
conclude that unconditional cash transfers improve consumption, food security and
psychological well-being of the recipients. Hoddinott et al. (2013), who evaluate vouchers and
cash transfers in four countries (Ecuador, Uganda, Niger, and Yemen), found that effectiveness
in improving food security of different programs heavily depend on local conditions, including
severity of food insecurity or thickness of markets.
An interesting learning that emerges from our study of international cash transfer programs is
the handling of the payment systems. Most of the countries that we studied invested heavily in
improving their payment systems for the cash transfer schemes. Kenya is an interesting
example of a country that incorporated technology-based solutions to resolve its problem of
insufficient bank branches. Benefits under Kenya’s Orphan and Vulnerable Children UCT
scheme are delivered through mobile phones. Beneficiaries receive SMS alerts about the
credited amount which they can redeem from the closest telecom agent. This platform is
operated by the private telecom enterprise, Safaricom (a subsidiary of Vodafone). Seeing the
immense popularity of this platform in Kenya, other countries also followed suit. In
Bangladesh, bKash, a mobile financial services provider operated by BRAC (a microfinance
institution based in Bangladesh), was launched to increase access to financial services in the
rural parts of the country (although this has not yet been linked to any cash transfer scheme).

17
Similarly, Pakistan is also implementing pilot projects in five districts, testing to see if BISP
cash benefits can be delivered using mobile phones.
Cash and food transfer programs, such as the well-established ones in Bangladesh (Ahmed et
al., 2009) and the emerging ones in Africa (e.g. Ethiopia’s Productive Safety Nets Program),
have significant involvement by local government agencies. Large-scale CCT programs require
a broader framework of assessment beyond direct and short-term household level impacts,
including attention to the optimal division of responsibilities between local and Central
Government structures, and incentives for transparency, as these are critical for poverty
reduction in the long run. These experiences (see Annexure 1 for full list of schemes and their
modalities and impact) help us appreciate the scope and likely impact of a cash transfer scheme.
We next proceed to evaluate cash transfer experiences in India.
India’s experience
Not just internationally, DBT experiments have successfully been undertaken in India too.
Some of the bigger experiences are shared below.
Delhi’s Dilli Annashree Yojana (DAY)
To complement the existing PDS/TPDS, the Government of Delhi introduced the Dilli
Annashree Yojana (DAY) in 2012. Any household with an annual income of less than INR 1
lakh and who were not recipients of the TPDS (Niti Aayog, 2015) were included under DAY.
Under this scheme, an amount of INR 600 was transferred to the Aadhar seeded bank accounts
of the female head of the household. The size of cash entitlement was calculated as the
difference between the market prices of rice, wheat and sugar, and the issue prices at the FPS.
For ensuring that beneficiaries could access their benefits, the state government relied on the
success and outreach of business correspondents (BCs). These BCs carried micro-ATMs linked
to the UIDAI’s Aadhaar repository that could be used for withdrawal, balance enquiry and
inter-Aadhaar transfers. It was the first cash transfer scheme for food security in the country.
Upon the launch of the NFSA 2013, all the DAY beneficiaries were absorbed under the Act
and thus the scheme was withdrawn in early 2014.
Despite the short duration for which the scheme was in effect, the DAY had a positive impact
on food security among beneficiaries. Transferring the amount in the name of a woman made
the scheme gender-sensitive. The cash gave the household not just food security but also a
social security against illness, especially in occupationally vulnerable families (NITI 2015). In
particular, it was found that greater amounts of money were spent on healthier alternative food
options such as milk, eggs, and vegetables (Chowdhary 2014, Srinivasan 2016). The major
challenge in the scheme however, was coordinating the activities of the UIDAI, NPCI and
banks by the state as there was no centralized system in place. Nevertheless, the scheme made
a good case for assessing the efficacy of DBT in food and has found a place in NITI Aayog’s
“Social Sector Service Delivery: Good Practices Resource Book 2015”.

18
Delhi and Madhya Pradesh: SEWA’s UCT Pilot
SEWA in 2010 and 2011 conducted an unconditional cash transfer pilot study in selected
districts of two states, Delhi and Madhya Pradesh (Davala, Jhabvala, Mehta, & Standing,
2015). While in one the idea was to transfer cash in lieu of subsidized physical grain entitlement
under the TPDS (Delhi), in the other, cash transfers were supposed to complement the same
system (MP). Under all the three pilots (one in Delhi and two in MP), amounts were transferred
directly into the identified beneficiary households’ bank accounts that were in the name of the
woman of the household and if they did not have bank accounts, SEWA volunteers/workers
facilitated the opening of one.
In Delhi, INR 1000 were transferred to each BPL household (randomly sampled). The amount
was calculated as the difference between the market price of food commodities and issue price
of the same commodities in the FPS. In MP, SEWA conducted two pilots—one in a sample of
non-tribal villages and the other in a sample of tribal villages. In these pilots, beneficiaries were
entitled to INR 300 per adult and INR 150 per child; this was computed as 20-30% of the
monthly per household expenditure of vulnerable households at or below the poverty line (from
the 2004-05 NSS survey).
While beneficiaries in the Delhi pilot were barred from receiving food grains under the PDS,
this was not the case in the MP pilot where the transferred cash was in addition to the PDS
entitlements that the beneficiaries received. Results (Davala, Jhabvala, Mehta, & Standing,
2015) from evaluations in both, Delhi and MP are summarized below:
consumption of high value agricultural commodities such as eggs, meat, fish, fruits and
vegetables apart from staples such as rice, wheat and sugar increased significantly;
They opted for better medical treatment and because of this and increased consumption of
nutritious food, the number of people with illnesses also fell.
In both Delhi and MP there was no observed increase in consumption of alcohol and
tobacco.
In the tribal village pilot, beneficiaries who received cash used it to improve their living
conditions by installing better lighting, shifting to safer sources of drinking water and
repairing their dwellings. There was also an increase in the number of people using bank
accounts to save money pay off outstanding debts, indicating that cash serves as an
important income support for the debt-ravaged.
Based on the favourable experience with the DBT food pilot studies, the GoI in September
2015 ordered its implementation in three UTs, Puducherry, Chandigarh and Dadra and Nagar
Haveli. While both Chandigarh and Puducherry rolled it out in September 2015, Dadra and
Nagar Haveli was able to put it in place only partially in Silvassa (the capital) in March 2016,
because of local elections and opposition. An overview of the DBT food experience in the two
UTs, Chandigarh and Puducherry follows.

19
Puducherry
Profile of the UT
Of the total population of 1.25 million people, 68 per cent live in urban areas (Census 2011).
On an average, they consume about 30 kilograms of rice and wheat (about 27 kilograms of rice
and 3 kilograms of wheat) every month and close to 38 percent of this are obtained through
PDS (NSSO). Puducherry is one of the two Union Territories, Chandigarh being the other, who
have completely substituted their central grain entitlement under the PDS with cash transferred
directly into the bank accounts of the identified beneficiaries.
Brief on TPDS that existed pre-DBT20
Between 1997 and 2015, Puducherry operated TPDS that provided common or Grade A variety
of rice to its APL, BPL and AAY beneficiaries. The scale of issue as on 11 May 2015 was 35-
38 kg/month/AAY household, 23-25 kg/month/BPL household and about 13-15
kg/month/APL household. The UT government distributed these grains free of cost, bearing
the cost of the additional food subsidy from its own budget. Under the scheme, there were 0.67
million beneficiaries receiving food grains (mainly rice).
In 2013-14, the UT administration rolled out its own scheme of free-rice under which it
distributed a locally preferred rice variety, i.e. single boiled (parboiled), in addition to the rice
distributed under centrally funded TPDS. The monthly entitlement of a beneficiary household
in their scheme was 10 kg that was later increased to 20 kg. The Puducherry government
procured this rice from the open market and distributed it through the FPS network using
biometric authentication. This biometric system is separate from the e-pos system under the
APDS21.
DBT Food in Puducherry
In 2015, the Puducherry government implemented the NFSA and immediately rolled out the
DBT for food scheme. About 0.63 million beneficiaries, including BPL and AAY beneficiaries,
were eligible under the NFSA and thus under DBT. Under the new scheme, food subsidy is
credited into the bank account of these beneficiaries.
The quantum of subsidy transferred to each household’s bank account is calculated based on
the formula given in the notification issued by the DFPD (See annexure 1). Subsidy amount is
calculated, as mentioned before, based on the offtake ratio of wheat and rice in the UT under
the TPDS. As people of Puducherry prefer rice, the cash-subsidy transfer amount is estimated
based on rice prices alone. By multiplying the prevailing MSP of rice (derived from MSP of
Grade A variety) with 1.25 and subtracting its CIP (i.e. INR 3), the food-subsidy cash
equivalent is estimated. As of May 2017, the subsidy is equivalent to INR 25.17/kg, which
20 See Annexure 2 for facts on TPDS and NFSA in Puducherry and Chandigarh 21 The UT administration had created its own system of biometric offtake of food grains where ration card
details and biometric markings were collected from all ration card holders. Eventually this was merged with
the APDS where these details were linked with Aadhaar.

20
means that a priority beneficiary of NFSA who is entitled to 5 kg/month is entitled to get a
credit of INR 125.9 i.e. INR 25.17*5, and each AAY household with a monthly entitlement of
35 kg will receive INR 880.95 (i.e. INR 25.17*35). At the time of rollout, per kilogram cash
subsidy amount was INR 23.13/kg. Since then, the subsidy amount was revised twice following
changes in the MSP of paddy.
In order to address the problem of leakage and poor targeting of PDS, prior to implementing
DBT-food, the Central Government has required all states and UT governments to ensure that
DBT transfer is made only to bank accounts that have been seeded with Aadhaar and two, that
the bank accounts should be in the name of the woman-head of the family and should be
integrated with a mobile number so that timely notifications about the transfer can reach the
beneficiaries. At the time of rollout in Puducherry, the level of Aadhaar seeding of bank
accounts was low at 68 percent. The UT government issued circulars and carried out awareness
drives through FPS to encourage beneficiaries to get their bank accounts seeded with Aadhaar.
The UT however was not required to collect bank account details and mobile and ration card
numbers since this information was collected during the rollout of the UT free-rice scheme in
2013-14.
Precisely because of this reason, the UT has not delivered food subsidy in the bank account of
women alone and the same is being transferred in the accounts of men too22.
As on May 2017, about 5.89 lakh beneficiaries received the food subsidy in Puducherry in their
bank accounts (Source: Puducherry Government). The total number of persons to be covered
under NFSA is actually 6.34 lakh, which means that about 7 percent of the UT’s NFSA
beneficiaries are still not getting their subsidy in their bank accounts. We gauged that one of
the major reasons for this exclusion was delay in seeding of their bank accounts with Aadhaar23.
Chandigarh
Profile of the UT
Similar to Puducherry, Chandigarh is a geographically small UT with a population of 1.06
million, of which close to 97 percent resides in urban areas. The consumption pattern of
Chandigarh differs from that of Puducherry; unlike the latter where rice is a staple diet,
consumers in Chandigarh prefer wheat. A household in Chandigarh consumes, on an average,
33 kg of rice and wheat (about 9 kg of rice and 24 kg of wheat) per month and about 12 percent
of this consumption is met from PDS (NSSO). This difference in consumption pattern
influences the proportion of rice and wheat distributed by the two UTs under PDS. The amount
of food subsidy received through DBT in the two UTs is also affected by this.
22 This is because Puducherry’s free rice scheme (which was implemented before DBT) had no mandate on who
was required to collect the rice from the FPS. In fact, details of up to two senior household members were
collected and either of them could access rice under the scheme. 23 Based on data from PFMS and the Puducherry Civil Supplies Department

21
TPDS and NFSA in Chandigarh
In Chandigarh, the TPDS was in effect between 1997 and 2014. Unlike in Puducherry, the UT
administration sold grains at the central issue price (CIP) and did not operate a parallel state
food scheme. Until June, 2013 the total number of ration card holders in the UT was 0.1 million
of which close to 0.08 million were APL cards, 0.01 million BPL and only 291 were AAY.
In 2013, as part of its efforts to implement the scheme for end-to-end computerization, all ration
cards in Chandigarh were digitized and were replaced with smart ration cards. Introduction of
smart ration cards resulted in deletion of several bogus ration cards. Thus in January 2014, the
total number of ration cards reduced to 0.08 million (representing 0.3 million individuals) of
which 0.07 were APL, 0.01 million were BPL and 261 were AAY (the greatest reduction was
seen in APL cards hence).
Chandigarh UT administration implemented the NFSA immediately after implementing
reforms in its PDS, in February 2014. Under the new scheme, close to 0.06 million households
were issued priority ration cards and 122 households were issued AAY cards. Both PHH and
AAY households received wheat and rice in a 3:2 ratio (determined based on the consumption
pattern of the UT) at INR 2 and 3 respectively. APL households that were not included under
the scheme (0.03 million such households) were given wheat under the centre’s tide over
allocation at the pre-existing CIP under the TPDS (INR 7/kg). The scheme was in effect till
September 2015, after which the UT administration implemented DBT for food, under which
beneficiaries received the food subsidy directly to their bank accounts.
DBT Food in Chandigarh
In September 2015, Chandigarh rolled out DBT food. The food subsidy amount is calculated
as explained in case of Puducherry but there is one difference: while in case of Puducherry, the
food subsidy amount was calculated based on the MSP of only rice, in case of Chandigarh it is
calculated based on MSP of both rice and wheat. The total subsidy transferred to each
household uses the consumption ratio for wheat and rice (3:2) which was the actual ratio of
distribution of wheat and rice for NFSA and TPDS. As on May 2017, amount of subsidy
transferred to a PB (who is entitled to 5kg/month/person) is INR 105.7 and for AAY, with a
household entitlement of 35 kg/month, it is INR 736.89.
DBT in Chandigarh follows a similar model to that of Puducherry for transfer of subsidy. The
stakeholders involved are the Chandigarh UT civil supplies department, PFMS (NIC), NPCI
and Banks. However, the Chandigarh UT department has setup a separate entity called the
‘Chandigarh Society for Food Security and Consumer Awareness’24 to specifically perform
functions related to the implementation of the DBT. In Puducherry, the total subsidy was
transferred to the bank account of the UT civil supplies department by the Central Government
(after which it went to the beneficiaries); however, in Chandigarh subsidy was transferred to
the bank account of this society which was subsequently responsible for making the payments
24 Registered under the Societies Registration Act, 1860

22
to beneficiaries. In addition to creating a new entity, the Chandigarh UT administration also
integrated the implementation of the DBT with the activities of Society for Promotion of
Information Technology in Chandigarh (SPIC)25.
In order to smooth the transition from PDS to DBT, the Chandigarh UT administration set-up
special enrolment drives and camps. Through local representatives, they ensured that
beneficiaries were made aware of the transition from food to cash and that their accounts were
seeded with Aadhaar. These camps were conducted periodically. The number of households
receiving subsidy at the start of the scheme was 0.04 million (equivalent to 0.18 million
persons). Presently (March 2017), the total number of beneficiary households receiving subsidy
under DBT is 0.06 million (or 0.27 million persons).
Challenges faced by the two UTs
Based on continuous observation of the DBT as it unfolds in the two UTs and on our
discussions with the various stakeholders, we have been able to filter some challenges that are
affecting the ability of DBT-food to deliver on its set agenda in the two UTs. These are listed
below:
Inadequacy of transferred amount: It was unanimously felt by beneficiaries in both the UTs
that the transferred amount was not sufficient to maintain the pre-DBT consumption levels.
The transferred subsidy amount was not enough to buy rice or wheat in the open market as
the amount is estimated based on the prevailing MSP levels and not the retail price levels.
An analysis of this issue revealed three aspects of it:
Awareness of the beneficiaries: Most beneficiaries failed to understand that the amount
transferred to them was net of CIP. Just like under TPDS, the CIP was an expense to be
still borne by them. The right comparison of adequacy of the DBT amount and the
market price thus had to be adjusted for CIP. We acknowledge that this is a subtle point,
but awareness about it is crucial for creating social acceptance of the scheme;
In case of Puducherry, the situation is different. Under TPDS, the beneficiaries received
free rice but now under DBT their subsidy amount is net of CIP. Not surprisingly, the
UT’s beneficiaries are finding the transferred cash subsidy amount inadequate for
sustaining the pre-DBT consumption levels. But the fact that the UT scheme of free
rice continues, also gives an additional support to these beneficiaries which is not
available for beneficiaries in Chandigarh;
Hike in prices by the local kirana stores: In the absence of ration shops, there is a
perceived likelihood that kirana stores might create artificial scarcity or hike prices
leading the beneficiaries to feel the insufficiency of the transferred subsidy amount.
25 Setup under the Dept. of Information and Technology, to promote application of Information Technology in
the UT’s system of governance
23
Instances like this were not reported in Chandigarh or Puducherry. However, there are
higher chances of such price rise in net food-deficit areas.
Insufficient last-mile delivery mechanism: Compared to national averages, both the UTs
are better banked, and despite that the following challenges were glaring:
Informing beneficiaries about food subsidy transfer: As Banks fail to inform all the
beneficiaries about the fund transfer, the latter queue up in Banks to verify the
transaction. This multiplies the number and frequency of footfalls in a bank branch
apart from wasting working hours of a poor beneficiary who is possibly a daily wage
earner. In Puducherry, DBT beneficiaries were automatically enrolled for the SMS
facility; however some beneficiaries still did not receive SMS about the amount subsidy
credited to their account. In Chandigarh, different banks had different norms for
sending SMS.
There is another interesting dimension of the problem. With the telecom revolution in
the country and the sharp price wars between the telecom players, some users have been
frequently shifting mobile numbers. Because of this, the beneficiaries fail to update
their bank accounts that remain integrated to their older mobile numbers. So, in many
cases it was observed that because beneficiaries changes mobile numbers and failed to
update the Bank about the same, the messages about the food transfer were not received
by them. There is need to create awareness about this aspect among the beneficiaries.
Multiplicity of bank accounts: In Chandigarh there were some beneficiaries
complaining about not receiving their entitled food subsidy. Interestingly, most of these
were ones who had multiple aadhaar-linked bank accounts or had recently opened a
new aadhaar-linked bank account. We were informed by NIC that the database of
beneficiaries automatically updates the bank accounts to the most recently opened
aadhaar-linked bank account. Now, the government is crediting the food subsidy
amount in the beneficiary’s new account while the latter checks for it in the old account,
thus causing discontent and inefficiencies.
Entries in the Bank Passbooks: Passbooks for different banks used different
descriptions for the credited food subsidy, while some called it “Cash transfer of food
subsidy”, others called it “PFMS credit” or “CPMSSB”. This created confusion among
beneficiaries, especially for those receiving benefits under multiple schemes such as
old age pensioners, scholarship recipients etc.
Withdrawal issues: Bank ATMs disburse currency notes only in certain denominations.
This means that AAY or poorest of poor beneficiaries receiving food subsidy of INR
880. 95 or INR 736.89 cannot withdraw the entire amount at the same time. Perhaps
they have to wait for the amounts to accumulate over months so that it can round off
and can be withdrawn from the ATMs. This reduces the effective subsidy received by
these beneficiaries. Interestingly, in Puducherry we found that beneficiaries did not

24
withdraw the amounts every month and thus such a problem did not arise there.
However, this is an important issue for consideration;
Grievance redressal: Both UTs lacked a functional grievance redressal mechanism that
allowed beneficiaries to register complaints if they did not receive money or if bank
officials did not cooperate. However given the small geographical size of both UTs, some
beneficiaries could directly seek grievance redressal at the offices of the UT Dept. Of Civil
supplies. But without dedicated and established mechanisms, it is likely to be a major
problem in larger states.
Debate: PDS or DBT or Both?
After analysing international and national experiences, the question really is about the need for
DBT in India. There are about 55 cash transfer schemes in existence (both conditional and
unconditional) in India (DBT Mission, 2015). Shifting them to the more convenient and
organized PFMS platform under DBT should be easy and more an operational issue as
compared to PDS, where shifting away from existing subsidy-based or in-kind transfer schemes
entails social, political, and economic challenges.
There are two main schools of thought on the topic of this sub-section. While one school wants
the PDS to continue, strengthen, become universal and, if possible, be complemented by an
unconditional cash transfers26 and the other, favours replacing existing PDS with cash transfers
while ensuring a proper transition management for the vulnerable poor 27 . The chapter,
“Universal Basic Income (UBI): A conversation with and within the Mahatma” in the
Economic Survey 2016-17 has propelled discussion on this topic. Today the question is not so
much about the need of a cash transfer scheme (as that seems to be well established), as it is
about letting it substitute, or run it complementarily to existing in-kind transfers. The problem
of universalizing the system is also another aspect of this problem.
In this paper, we look at the possibility of DBT substituting the PDS wherever possible. The
wider discussions on the concept of a universal basic income are beyond the purview of the
current paper. We feel that if we can make a case for substituting the PDS with DBT, we can
contribute to the ongoing debate.
We do this in three steps:
1. We evaluate the importance of grains from PDS in consumption basket of the country;
2. We evaluate the extent and level of grain pilferage or leakage from the PDS
3. Evaluate progress made by states on the PDS reforms and the impact;
Importance of PDS grains in average Indian consumption basket
26 See Shah (2013); Dreze (2011); Chakrabarti (2014) 27 See Kapur et al. (2008); Economic Survey (GoI, 2016); Standing et al. (2015), Gulati and Saini(2015)

25
The relevance of the PDS in an Indian food consumption basket, especially of the poor, is low
but has been growing over the years. Since its inception in 1942, PDS has undergone several
targeting reforms, entitlements have increased and CIPs reduced, inter alia, just so to ensure
that the affordable food reaches all at all times. Impact of such reforms should reflect in the
growing importance of grains from PDS in the consumption basket of individuals.
As per NSSO (2014), an average Indian consumes about 10 kg grains per month. Another
NSSO report Public Distribution System and other sources of household consumer
expenditure’ (68th Round) tells about the sources of this consumption- whether the grains are
from own source or if they are bought from the market or under the PDS. The share of total
consumption that is met from purchases under PDS will give us an insight into the importance
PDS for an average individual.
Findings: about 21 percent of the total quantity of rice and wheat consumed in India is derived
from the PDS. For the poorest households, this dependence aptly increases to 33 percent.
However despite the twelve percentage point increase in the quantity of rice and wheat sourced
from the PDS, it is evident that poor households derive less than half of their consumption
requirement for staples like rice and wheat from the PDS. The remaining quantities either are
purchased from the open market (at market prices) or are grown by themselves.
An analysis for all states, shows that households in the seven states accounting for 70 percent
of India’s poor i.e. Bihar, Uttar Pradesh, Maharashtra, Odisha, Jharkhand, Madhya Pradesh and
West Bengal depend on the PDS to meet, on an average, about 18 percent of their grain
requirements. In states such as Tamil Nadu and Chhattisgarh, where State Governments
distribute free grains, mainly rice, to all even there the share of consumption met from the PDS
is on average 50 and 36 percent respectively. Despite footing heavy expenditures on the state
account, poor households in these states still have to rely on the open market purchases.
There is one limitation of this aspect: these numbers are for the year 2011-12. Due to
continuous ongoing reforms, particularly in states like Bihar, West Bengal, Odisha these
percentages would have improved since 2011-12 but since the latest data on the topic is only
available for 2011-12 year we have to rely on them for evaluating all states of the country.
More recently, the Economic Survey 2016-17 quoted a 3600-household survey across six states
(Chhattisgarh, Odihsa, MP, Bihar, Jharkhand and WB) that showed that about 92 percent of
the PDS grain entitlement was received by the beneficiaries in these states. This clearly reflects
the improvements in the system which is the impact of the ongoing PDS reforms. But can these
results represent the situation for the entire state? We are uncertain. Nevertheless, the fact
remains that not all beneficiaries are receiving their dues and thus their dependence on PDS is
low. Among other factors, such low reliance on PDS for meeting consumption needs is
explained by the large rates of grain pilferage and leakage from the PDS where the grain does
not reach its intended beneficiaries. We next estimate this level of grain leakage.

26
Challenge with the PDS-estimating grain leakages
Close to 40 percent of the bottom 40 percent of the country’s population are not part of the
PDS (Economic Survey, 2017) and between 40 to 50 percent of grain off-taken from
government granaries do not reach the intended consumers (Dreze and Khera 2015, Himanshu
and Sen 2013 and Gulati and Saini 2015).
Despite the 70-year long history of PDS, India is home to world’s largest number of poor and
malnourished. Obstinately high levels of these problems have led the government to evaluate
its PDS regularly. In terms of the economic and social implications, leakage of grains is one of
the biggest problems plaguing the PDS. Despite the systemic changes implemented in the PDS
in 1997 (changing coverage from general to targeted), 2002 (identifying the poorest of poor
under AAY), and 2013 (introduction of NFSA) and reforms (that have been detailed in the last
Section), there have been large-scale leakages or diversions of grain away from its intended
recipients. Leakages are estimated as excess of grains off-taken from government granaries
over what is actually consumed by the beneficiaries.
It is the responsibility of the Central Government to arrange and allocate food grains stored in
its granaries to each of its 36 states and Union Territories. It is the responsibility of the state/UT
agency to off-take28 grains from these granaries. The grain is transported to the doorstep of fair
price shops (FPS) by truck from where PDS beneficiaries collect their quotas showing a ration
card (which acts as identification, based upon economic vulnerability, and also displays the
beneficiary’s entitlement) and purchase grains at CIPs. The grain has been observed to ‘leak’
at each of these stages. A summary of some of the estimates of this grain leakage is given
below:
1. Estimates by Planning Commission for 2003-04: The Planning Commission of India
evaluated these leakages (PEO, 2005) as excess of grains off-taken from government
granaries over what was consumed by the BPL families. The report concluded that 58 per
cent of the subsidized food grains issued from the Central Pool did not reach the intended
beneficiaries (BPL families) in 2003-04. It found that to deliver one Rupee of an income
transfer to a BPL family, the government had to spend 3.65 Rupees.
2. Estimates by NCAER: A primary survey by NCAER in 2014, covered six states: three that
had implemented the NFSA provisions (Bihar, Chhattisgarh and Karnataka) and three non-
NFSA states that still followed TPDS (Assam, Uttar Pradesh and West Bengal). The
evaluation revealed that Chhattisgarh had the lowest leakage (6.96%) among the six states,
and there was an impressive decline in Bihar’s leakage (16.28%) over the past couple of
years. The study also established that the magnitude of leakage from both, the BPL and
28 The state governments have to off-take the entire amount of grain that has been allocated to them in a
stipulated time period. The amount of grain that is allocated to each state/UT each year is based on its actual
off-take in the previous three years. Many states and UTs off-take less grain than allocated. During festivals,
emergencies (floods, cyclones, etc.) a state/UT government can request the Central Government for additional
grains and such grain is allocated to them in addition to the above allocation and is referred to as ad-hoc
allocation or additional allocation.
27
APL, categories was higher for non-NFSA states as compared to the NFSA-implemented
states.
3. Estimates of leakages based on the consumption data from the National Sample Survey
Organization (NSSO) and the FCI off take data: There are several researchers who have
employed this secondary method for estimating leakages, some of these estimates are given
below:
a. Himanshu and Sen (2013) used this methodology and found the leakages to be to the
tune of 54.8 percent in 2004-05, and 35 percent in 2011-12.
b. HLC 2015 and Gulati and Saini 2015: Report of the High Level Committee (HLC) on
Reorienting the Role and Restructuring of the Food Corporation of India (GOI 2015)
cites 47% PDS leakage for 2011-12. The estimates were based on a working paper by
Gulati and Saini (2015).
c. Dreze and Khera (2015) found leakages to be around 42% in 2011-12. The Dreze and
Khera (2015) report also derived leakage estimates using data on PDS purchases from
the Institute for Human Development Studies (IHDS). With this data, the PDS leakage
was estimated to be 32%.
In light of the differences in the estimates, we revisited the methodology originally used in
estimating PDS leakages by Gulati and Saini (2015) and re-estimate grain leakages from the
PDS for the year 2011-12 (July-June).
The methodology followed is as follows:
Total Annual PDS Consumption: The TPDS household consumption numbers are obtained
from the NSSO 2011-12, Public Distribution and Household Consumption Survey 2
(NSSO Report no. 565), and from the NSSO Report no. 558 that gives information about
the state-wise monthly per capita (MPC) PDS consumption of wheat and rice in rural and
urban areas. While the former series gives data for every household, the latter gives it on a
per capita basis. Using data from the 2011 Census for the total number of people and
number of households in India, we estimate annual PDS consumption (rice and wheat) as
two price series: Series 1 estimates annual consumption from per capita numbers, and
Series 2 estimates it from the household numbers. As per the two series, Indian consumed
29.98 MMT (Series 1) and 27.34 MMT (Series 2) of PDS rice and wheat in 2011-12.
Estimating Off-take by states/UTs from central agencies: TPDS off-take figures are taken
from DFPD’s Food Grain Bulletin. The Bulletin gives annual off-take figures for the
financial year April 2011 – March 2012. As the NSS data for TPDS consumption uses
agricultural year as their reference period, the off-take of food grains has been converted
and calculated for the agricultural year July 2011 – June 2012 wherever possible. In our
calculations, three types of off-takes have been included: normal off-take, off-take from
two special ad hoc/addition allocations made for BPL households, in January and May,

28
2011, and, special ad hoc allocations made to 150 and 174 ‘poorest districts’ of the country.
For the year 2011-12, total grain off-taken was 52.9 MMT, of which 44.7 MMT was off-
taken by the normal route and the remaining in the ad hoc, additional and special categories.
Estimating leakages: In absolute terms, we estimate leakages by deducting the annual PDS
consumption from the annual PDS off-take. It is also converted as a percentage of off-take.
We find the PDS grain leakage to be about 22.9 MMT (Series 1) and 25.6 MMT (Series 2)
in the agricultural year 2011-12. In percentage terms, 43.3 percent (Series 1) and 48.3
percent (Series 2) of the total off-take from the central pool is estimated to have pilfered
from the system in the studied year.
We found that states and UTs such as Delhi, Chandigarh, and Nagaland have leakages above
70 percent. Gujarat was close to the threshold with a 69 percent leakage rate as per Series 1
and about 71 percent as per Series 2.
Figure 6: Estimates of grain leakages (%) from Series 1 for 2011-12 (AY)
Source: Authors’ estimation from NSSO and Census data;
Note/Acronyms: D&D: Daman and Diu, WB: West Bengal, UP: Uttar Pradesh, MP: Madhya Pradesh,
HP: Himachal Pradesh
These numbers are for the year 2011-12 and more than five years have passed since. While we
await NSSO data for a more recent year, we use these numbers for our analysis. For more
recent years, we cite two sources. The first is the Indian Institute of Technology’s (IITs) Public
Evaluation of the Entitlement Programs (PEEP) 2013 report, and, the second is an estimate
presented in the recently released Economic Survey (2016-17). Both numbers are close, as can
be seen from the last two columns in the table below. The PEEP survey results are estimated
from a survey of 10 Indian states and the estimates in the Survey are extrapolated from
Himanshu and Sen’s leakage estimate of 34.6 percent for year 2011-12 (2013). Here is a
summary of the all-India leakage estimates by some Indian authors. Table 2
96.2
92.1
80.870.7
69.065.9
62.2
57.8
58.7
56.6
52.5
49.7
49.9
49.1
51.5
52.2
45.9
43.3
39.2
37.5
35.1
33.4
31.2
29.4
24.4
25.3
27.515.6
13.97.8
0
20
40
60
80
100
Man
ipu
r
D&
D
Del
hi
Ch
and
igar
h
Gu
jara
t
WB
Raj
asth
an
Sikk
im UP
Pu
nja
b
Pu
du
cher
ry
Har
yan
a
Mah
aras
htr
a
Go
a
MP
Ass
am
Jhar
khan
d
IND
IA
Ker
ala
Kar
nat
aka
Utt
arak
han
d
Aru
nac
hal
Trip
ura HP
An
dh
ra
Bih
ar
Od
ish
a
Tam
il N
adu
Miz
ora
m
Ch
atti
sgar
h

29
Table 3: Summary of PDS Leakage estimates by several authors
All India Leakage Estimates
Himanshu and Sen (2013) 2004-05 54.8
Dreze and Khera (2015)
2011-12
41.7
Gulati and Saini (2015) 46.7
Himanshu and Sen (2013) 34.6
Current Study 43.3 (48.3)
PEEP Survey (10 States) 2013 20
Economic Survey 2016-17 20.8
Source: Compilation by Authors
This means that though the leakages are still high, they are falling and the continuous reforms
in the PDS are yielding these results. We next evaluate how each of these states have performed
on the set PDS reform agenda.
Evaluate progress made by states on the PDS reforms and the impact
As already discussed in our introduction of the PDS Section, states have attempted to
implement reforms in their respective PDS systems. The progress on the nine-point action, plan
has been rather slow but after NFSA the states have picked up pace on this plan. Efforts have
been augmented for end-to-end computerization too. Financial assistance from the centre has
enabled states to digitize ration cards of households, seed them with Aadhaar, commence
APDS (in some states), computerize and enable tracking of food grains from FCI to state to
FPS. As on date, the level of digitization of ration cards is 100 percent, and 77 percent of these
are cards are seeded to Aadhaar. This has resulted in the fall of the number of ration cards
(despite the transition from TPDS to NFSA). Has this fall in the ration cards resulted in savings
of the government through their impact on the allocation and offtake? We briefly evaluate that
below.
Between 2006 and 2016, the total bogus ration cards deleted by the Central Government were
63 million (GoI, 2016), as per our own calculations from the ration card data from DFPD,
MoCAPD this number is only 2 million. Nevertheless, such a reduction should result in reduced
allocation and offtake of grains as the latter should be a function ideally of the total number of
beneficiaries. As per data from DFPD, between this period the allocation decreased by 19
million tonnes while on the other hand offtake of rice and wheat increased by 18 million
tonnes29 (Figure 7) .More recently, between 2014 and 2016, while the number of ration cards
declined by 7 percent, both allocation and offtake increased by 0.3 million tonnes and 5 million
tonnes respectively.
29 Based on figures reported by the DFPD in its monthly Food Grain Bulletins

30
Figure 7: Reduction in ration cards and increase in offtake 2004-05 and 2016-17
Source: Food Grain Bulletin (DFPD)
There is some discrepancy either in the data provided by DFPD or in our understanding of the
phenomenon that expects offtake and ration cards to be positively correlated. In Madhya
Pradesh for example, in the last decade, about 2.5 million bogus ration cards were deleted.
Even though its allocation reduced by close to 1 million tonnes, its offtake increased by 1.3
million metric tonnes.
Overall, there are clear indications of the system having improved over the years when seen
from the perspective of leakages in the system. There is no dispute about the fact that the
reforms in the PDS machinery, undertaken by both, the states and the Centre, have improved
delivery and operations of the PDS, which has come under much criticism, and that large
portions of country’s malnourished people have benefitted from them
However, the question really is about the social, economic, and political efficiency and
sustainability of the system. Is there a way to truly support India’s vulnerable and also ensure
economic efficiency? Is universalizing PDS the right solution or is there a need to evaluate an
area’s vulnerability and then devise a ‘customised’ solution? Each state within India is different
and within these states, too, there are wide differences between districts, so can it be assumed
that one standard PDS-type means of distributing highly subsidized (or even free) rice and
wheat will resolve the often-unaccounted-for problem of malnutrition? Or is substituting the
grain distribution system with a cash transfer under DBT across all states at one immediate
time a viable solution? Can poor who have money but no access to affordable grains in the
open market be better off and become food secure?
We propose below a plan in which the decision to adopt DBT food or implement APDS is
based on a state’s ‘readiness’ or ‘vulnerability’ status.
294
522
2189
2300
2000
2050
2100
2150
2200
2250
2300
2350
2400
2450
150
200
250
300
350
400
450
500
550
2004-05 2006-07 2011-12 2012-13 2013-14 2015-16 2016-17
rati
on
car
ds
Off
take
Total Offtake (in Lakh Tonne) Total Ration Cards (in Lakh)
31
Section III: Analyzing State Readiness
Each state/UT in the country differs in its economic vulnerability, political motivation, and
social framework. Even within a state, it is likely that the above differences are prevalent
between districts. This means that the method to determine the future of PDS and DBT in food
in a state/UT has to be less macro and more meso- and micro-based. Therefore, there is a need
to develop a scientific method for analysing a state’s readiness that should be used to decide
the future course of action towards implementing DBT in food.
We propose below an indicative model that can be used to evaluate a state’s/UT’s readiness
for implementing the ICT-based DBT food or APDS. Based on our analysis of national and
international experiences, we evaluate this readiness based on three broad parameters - its
demographic profile, effectiveness and relevance of existing PDS, and the extent of financial
inclusion and/or situation of banking infrastructure. For each of these parameters, we next
identify a list of quantifiable indicators.
A word of caution before we proceed: We acknowledge the fact that by undertaking a state-
level analysis of a state’s readiness for DBT we fail to acknowledge the diversity among its
districts. Which means that even if a state appears to be ready for DBT, there most certainly
will be areas where the extent of infrastructural deprivation or level of vulnerability is higher
than the overall state and thus may not be fit for an immediate rollout of DBT? Likewise, by
declaring a state as less-ready for immediate rollout of DBT, we fail to appreciate districts
within that state which have superior financial infrastructure and have better levels of literacy
and nutrition than the overall state and thus are more ready than the state itself to substitute its
PDS grains with food subsidy (under DBT). However, due to paucity of resources and data at
district level, we restrict our analysis to the state level.
We next proceed with a sequential explanation of the three parameters/variables detailing our
methodology:
1. Demographic profile: We study the demography of a state/UT under four sub-heads:
Urban or rural: We identify if a state/UT is rural or urban by looking at proportion of
its population living in urban and rural areas. We used the data from Census 2011 for
this purpose. If greater than half of the population resided in rural areas, then the state/UT
is addressed as rural, else as urban. By this measure, 27 states/UTs out of the 36 are
rural. The two states of Tamil Nadu and Kerala have about similar number of people
living in urban and rural areas and thus are categorised as urban/rural. This leaves about
seven states/UTs (Delhi, Goa, Mizoram, Puducherry, Lakshwadeep, Daman and Diu,
and Chandigarh) which are categorized as urban. We associate, contingent also upon
performance on other indicators, greater readiness of a state for DBT if it is an urban
area.
Poor populations: We study the status of poor in each state both as a percentage of the
state’s total population (poverty ratio), and as a percentage of nation’s total poor. In our

32
analysis, a state with higher share of poor is taken as less ready for DBT immediately
and we feel that before it shifts to DBT in the medium to longer run, the state system of
PDS/APDS needs to be strengthened. States such as Chhattisgarh, Bihar, Odisha, MP,
Jharkhand, and UP are among those where the poverty ratio was much higher than the
national average of 21.9 percent. States/UTs like Delhi, Punjab, Kerala, Andhra, Goa
are among the ones with a poverty ratio of less than 10 percent. In terms of share of
India’s poor, six states namely, UP, MP, Odisha, Bihar, Maharashtra and West Bengal
accounted for about two-thirds of India’s poor and so these were not ranked very highly
on this parameter and thus were not advised for immediate DBT rollout;
Literacy rates: A state’s level of literacy, especially among its females, is central for the
success of any food security mission where higher levels of education (mainly female)
are associated with improved levels of food security. This may not be a sufficient
condition for alleviating food insecurity, but surely is a vital determinant of success of
schemes like DBT food where the vices associated with an unconditional cash transfer
can be offset by an educated woman of the house. We study total literacy rate and female
literacy rate (both as percent of population) for all 36 states/UTs. We associate a higher
literacy rate (also contingent upon performance in other indicators) with a greater
readiness of a state for DBT;
Proportion of malnourished children in the state/UT: We study the level of malnutrition
in a state/UT by measuring the level of stunting and underweight among its children less
than 5 years of age. We used the NFHS data for the analysis. We score the states/UTs
with higher rates of malnutrition relatively lower and mark them as being less ready for
DBT food and more in need of a reformed and more robust PDS/APDS in the short to
medium run.
By evaluating states based on these four criteria, we determine if a state should look at initiating
DBT or strengthening APDS on an immediate basis. If a state has a high proportion of poor,
where more than half its population live in rural areas, has literacy rates much lower than the
national average and has high numbers of malnourished children, then, as per our analysis, that
state should work towards strengthening its PDS by shifting to the ICT-based APDS in the
medium to short run. However, if the state has a relatively lower share of its population living
below poverty line, and the levels of education are higher and relatively fewer children are
malnourished, then that state can be looked upon favourably for introducing the ICT-based
DBT food.
Based on the assessment of performances of states on the first parameter, Uttar Pradesh, Bihar,
Madhya Pradesh and Odisha emerge as inappropriate grounds for immediate rollout of DBT
food. Given their relatively better standing with regard to malnourished children, poor
population, and literacy levels, Delhi, Punjab and Goa emerge as fit grounds for a DBT food
rollout.
In our next step, we proceed with analysis of the states on the second parameter that evaluates
the existing PDS of that state.

33
2. PDS Performance: Taking the analysis from the previous section, we study the states on
all the three aspects: i.e. importance of PDS grains in average consumption basket of that
state, level of grain leakage and progress by the state on the PDS reforms. We associate
greater level of leakage, lesser dependence on PDS for meeting consumption and good
progress on the PDS reforms as conducive for shifting away from APDS to DBT.
In terms of leakages, we found that states such as Punjab, Delhi, Uttar Pradesh, Gujarat,
and West Bengal have high PDS grain leakages much over 55 percent (Refer to section on
Leakages). In terms of dependence on PDS grains, Bihar, Uttar Pradesh, Maharashtra,
Odisha, Jharkhand, Madhya Pradesh and West Bengal emerged as lesser dependent on the
PDS (less than 18 percent of their monthly grain consumption is met through PDS) . States
where the bulk of household consumption (NSSO) is already sourced from non-PDS
sources or open market are better suited for DBT food as beneficiaries are already
accustomed to purchasing from the open market.
Lastly, the degree of PDS reforms matter in determining a states’ readiness. For states
where the FPS is automated and have achieved other aspects of the nine-point action plan
and there is greater reliance on PDS for consumption, implementation and strengthening of
APDS would be more desired in the short run.
For many states with high grain leakages and lesser dependence on PDS we did not
recommend immediate DBT rollout because these states scored low in Parameter one, i.e.
they have high rates of poverty and malnutrition (as you will see in the following
paragraphs).
Apart from the PDS performance, the readiness of a state’s banking infrastructure is critical for
success of DBT in food.
3. Banking Infrastructure and Financial Inclusion:
Bank Infrastructure: Availability of a sufficient number of bank branches, ATMs and
business correspondents (BCs) is critical to the success of implementing DBT in food.
Experiences of Puducherry and Chandigarh and of other reviewed schemes underscore
its importance. In order to evaluate and compare this aspect, we estimate a ratio between
the total number of bank branches, ATMs, Post offices and BCs in a state with its
population30. This gives us an estimate of the number of banking access points a state
has per hundred thousand people (Figure 8). The banking density of the country is about
48 branches per hundred thousand people. While Goa is at the top with a banking
density of 140 for Goa, Bihar is at the end of the spectrum with a banking density ratio
of 30, meaning that there are about 30 banking access points for every lakh people in
Bihar.
30 The data is taken from RBI, India Post, and Census 2011.
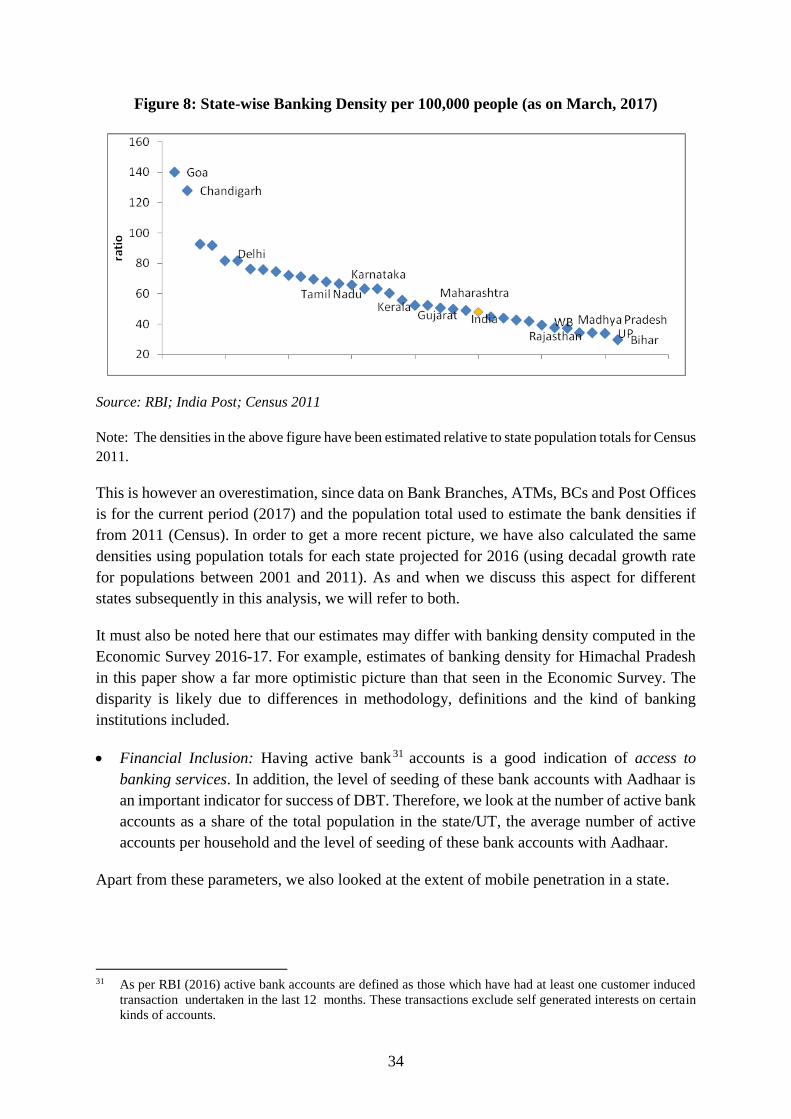
34
Figure 8: State-wise Banking Density per 100,000 people (as on March, 2017)
Source: RBI; India Post; Census 2011
Note: The densities in the above figure have been estimated relative to state population totals for Census
2011.
This is however an overestimation, since data on Bank Branches, ATMs, BCs and Post Offices
is for the current period (2017) and the population total used to estimate the bank densities if
from 2011 (Census). In order to get a more recent picture, we have also calculated the same
densities using population totals for each state projected for 2016 (using decadal growth rate
for populations between 2001 and 2011). As and when we discuss this aspect for different
states subsequently in this analysis, we will refer to both.
It must also be noted here that our estimates may differ with banking density computed in the
Economic Survey 2016-17. For example, estimates of banking density for Himachal Pradesh
in this paper show a far more optimistic picture than that seen in the Economic Survey. The
disparity is likely due to differences in methodology, definitions and the kind of banking
institutions included.
Financial Inclusion: Having active bank 31 accounts is a good indication of access to
banking services. In addition, the level of seeding of these bank accounts with Aadhaar is
an important indicator for success of DBT. Therefore, we look at the number of active bank
accounts as a share of the total population in the state/UT, the average number of active
accounts per household and the level of seeding of these bank accounts with Aadhaar.
Apart from these parameters, we also looked at the extent of mobile penetration in a state.
31 As per RBI (2016) active bank accounts are defined as those which have had at least one customer induced
transaction undertaken in the last 12 months. These transactions exclude self generated interests on certain
kinds of accounts.
35
Strategy for implementing DBT – results of state-readiness criteria
Based on the performance of each state on the above three criterions, we have developed a 4-
phase strategy for implementing DBT food in the country. By 2022, i.e. within the next four
and half years, we are recommending completion of the DBT-food transition process. Each
phase is in succession and it specifies the time by which the states listed in it have to implement
DBT food. States within each Phase are identified based on their performance on the three
parameters. Sates/UTs in the first phase are recommended for an immediate rollout of DBT
food and for ones in the last phase, we recommend a time gap so that they get time to strengthen
their banking and financial infrastructure and improve on elements they lack, before they
transition onto DBT.
For the first three phases, we have segregated states based on their performances on the
proposed readiness criteria. However, the last phase comprises of 13 states (Arunachal Pradesh,
Assam, HP, J&K, Manipur, Meghalaya, Mizoram, Nagaland, Sikkim, Tripura, Uttarakhand,
A&N Islands and Lakshwadeep) that have been given a special category status by Union
Government and the Planning Commission32 . These 13 states either have low population
density, or are geographically located in remote areas, and/or are socio-politically and
economically sensitivity areas. A brief review of the performances of states in each phase is
given below (See Annexure 5 for information on state performances).
The details are given below33:
Phase 1: DBT Food Implementation by 2018
We start the transition to DBT food with five urban states/UTs of India- Delhi, Daman and
Diu, Goa, Puducherry, Chandigarh and 1 rural state i.e. Punjab. It may be noted that DBT food
has already been rolled-out in Chandigarh and Puducherry nevertheless we present it here, as
results from our analysis reconfirm that the two UTs are infact ready for this transition and so
are the rest three.
The six states have better banking infrastructure, higher literacy levels, and higher mobile
penetration rates compared to the country as a whole.
All the five urban states have low levels of poverty (<10 percent) with Chandigarh being the
only exception (22 percent). They together account for only over 5 percent of India’s poor
population. Literacy levels in these states are relatively high with the total literacy rate being
over 80% for all states, and female literacy rate over 75 percent. The prevalence of malnutrition
32 To target the fund flow for balanced growth, the Central Government and Planning commission has identified
13 states/UTs as being in the ‘special category’. These states/UTs have common characteristics such as
strategic location along national boundaries, hilly terrains, low population density, sizable share of tribal
population, economic and infrastructural backwardness that necessitate awarding a special category status.
These 13 states are: Arunachal Pradesh, Assam, HP, J&K, Manipur, Meghalaya, Mizoram, Nagaland, Sikkim,
Tripura, Uttarakhand, A&N Islands and Lakshwadeep. 33 See annexure 3 for complete data
36
(measured in terms of underweight and stunted children) is also below 30 percent for all states
(except in the case of Delhi where the share of stunted children is little above 30 percent).
While analyzing the efficiency of existing PDS in these five states, it is observed that all have
high leakages (>50 percent). Consumers’ dependence on PDS for meeting their total
consumption needs of rice and wheat is also low, with four of the five states (except
Puducherry) relying on the PDS for less than 30 percent of their total rice and wheat
consumption needs. Puducherry’s higher dependence on the PDS for consumption is largely
explained by its local rice scheme (PDS extension) distributing locally-preferred rice. Other
states also offer extensions by way of lower issue prices; however, this hasn’t really affected
their consumption reliance on PDS.
These five states/UTs also perform the best, compared to all other states, in terms of banking
infrastructure in the country. On an average, the total number of bank branches, ATMs, BCs,
or Post Offices available per hundred thousand people is 101 (92) 34. Of these Chandigarh
(where DBT for food is currently) in operation and Goa the banking infrastructure is over 100
branches per hundred thousand (for both 2011 and 2016 populations). In terms of financial
inclusion, the number of active bank accounts in all five states/UTs exceeds the total state
population, implying multiple bank accounts in each household. Both Chandigarh and Goa are
again the best performers with the number of active bank accounts being 1.5 times of their
respective populations. However, the share of these bank accounts seeded to Aadhaar is low.
The average level of seeding is 73 percent in these five states/UTs. In addition, these states/UTs
have a strong presence of mobile phones with nearly the entire population of these states having
access to one.
In case of Punjab, despite being mostly rural, its poverty ratio is very low (below 10%) and its
share in India’s total poor population is negligible and being the food bowl of India, not
surprisingly has a low incidence of malnutrition too. The level of PDS leakage is high and they
average consumer depends on PDS for meeting only about 9 percent of his monthly rice and
wheat consumption needs. Its banking infrastructure is comparable to that in the urban states
identified for this phase, and it has a high level of Aadhaar seeding of both bank accounts and
ration cards (80 and 97 percent respectively). We thus recommend Punjab, along with Delhi,
Daman and Diu, Goa, Puducherry and Chandigarh for immediate implementation of DBT for
food.
Phase 2: DBT Food Implementation by 2019
Phase 2 states are Haryana, Tamil Nadu, Andhra Pradesh, Telangana, Karnataka and Kerala.
They have the necessary infrastructure at comparable or slightly lower levels than states in the
first phase. They have low poverty ratios (<20 percent) and account for about 13 percent of
India’s poor. Compared to the Phase 1 states, literacy levels in these states are lower (except
for Tamil Nadu, which has similar levels of literacy as Punjab) and incidence of malnutrition
34 Figures in brackets refer to banking densities using projected population for 2016. We present banking
densities in similar fashion in other phases also

37
is higher, with the share of underweight and stunted children lying between 30 and 45 percent.
Kerala however is an exception. Overall literacy rate and among females are both the highest
level in the country and incidence of malnutrition is below 20 percent.
In terms of grain leakages, the performance of these states is much better than the states in the
Phase 1. The average leakage rate in these states was about 38 percent (lower than Phase 1
states where leakage was about 67 percent on average). In terms of dependence on the PDS to
meet consumption needs, on an average, about one-third of rice and wheat monthly
consumption needs in these states were met by the PDS with the remaining being met through
the open market. In the case of Tamil Nadu despite implementing large scale extensions to the
central PDS and with low grain leakage levels (15.6 percent), surprisingly only half the
monthly consumption needs were met through the PDS..
In terms of banking infrastructure, the banking density of these six states is between 60 and 70
(55 and 65), with Tamil Nadu having the highest density at 71 (67) branches per hundred
thousand people. The number of active bank accounts in these states is close to 90 percent of
their respective population. Of these accounts, 72 percent on an average are seeded to Aadhaar
with Andhra Pradesh and Telangana leading with about 82 percent seeding and Karnataka,
Kerala and Tamil Nadu are amongst the worst performers with seeding levels of 72, 68 and 63
percent respectively. States in Phase 2 perform relatively well in terms of mobile phone
subscription. All states exhibit near or greater than 100 percent share in population with
subscriptions to a mobile service provider. Implementation of DBT after phase 1 is thus most
feasible in these states.
Phase 3 – DBT Food Implementation by 2021
We place the remaining eleven states (when 13 vulnerable states are already clustered in Phase
4) Madhya Pradesh, Chhattisgarh, Rajasthan, Jharkhand, Bihar, Odisha, Uttar Pradesh, West
Bengal, Maharashtra, Gujarat, and Dadra and Nagar Haveli, in Phase 3. By 2021, if the
necessary improvements are undertaken in their financial infrastructures and enough open
market grain is made available to all at all times, these states can successfully transition away
from PDS to DBT-food.
All states in this phase are characterized by high vulnerabilities as evidenced by their poverty
ratios, malnutrition and literacy rates. These states account for 80% of India’s poor population
with Uttar Pradesh, Bihar and Madhya Pradesh alone accounting for half of that. The level of
female literacy, in particular, is extremely poor in states such as Rajasthan, Bihar and Uttar
Pradesh with the share of literate females being just over 50%.
Leakages in the PDS of these states is high (>40%) but Chhattisgarh is an exception (only
7.8% leakage) since like Tamil Nadu, this state also has a significantly large PDS extension
program. This is also evident from the higher dependence of consumption on PDS (36%),
compared to the rest of the states whose reliance on the PDS ranges between 20 and 30%. Most
of the states have also initiated PDS reforms by fulfilling objectives under the 9-point action
plan and the scheme for computerization, and many have even completed these two schemes.

38
In terms of banking facilities, there is a high infrastructural deficit. Bihar is clearly the worst
performer in terms of bank branches followed closely by Jharkhand, Uttar Pradesh, and West
Bengal. In terms of financial inclusion, the distribution of bank accounts to total state
population is less than 60 percent with Dadra and Nagar Haveli being the outlier (98 percent).
Despite the level of seeding to Aadhaar for states like Rajasthan and Jharkhand is high (>80
percent), the low prevalence of active bank accounts is likely to create severe challenges when
implementing DBT. We thus categorize these states in Phase 3 so that they get enough time to
create and expand their financial infrastructures
Phase 4: DBT Food Implementation by 2022
In the last Phase, DBT will be rolled-out in the remaining 13 states (Arunachal Pradesh, Assam,
HP, J&K, Manipur, Meghalaya, Mizoram, Nagaland, Sikkim, Tripura, Uttarakhand, A&N
Islands and Lakshwadeep). Up until 2022, however, the governments should strengthen and
streamline PDS/APDS and simultaneously encourage focused investments for expanding
financial infrastructure and ensuring complete Aadhaar seeding of bank accounts and ration
cards.
The biggest foreseeable problem that these states will encounter will be while ensuring open
market grain availability. The geographically tough terrains, remote districts of hilly areas are
generally food-deficit areas and ensuring enough grain in the open market at all times, will
require a nuanced planning by the government. State Governments have to empower private
trade and the Central Governments should be ready to undertake sale of grains under its OMSS
scheme to ensure that enough grain is available in the open market.
Table 4: Summary of the implementation schedule
Phase States and UTs
Phase 1: DBT Implementation by 2018 Six: Punjab, Delhi, Chandigarh, D&D, Goa,
Puducherry
Phase 2: DBT Implementation by 2019 Six: Haryana, Tamil Nadu, Andhra Pradesh,
Telangana, Kerala and Karnataka
Phase 3: DBT Implementation by 2021
Eleven: Madhya Pradesh, Chhattisgarh,
Rajasthan, Jharkhand, Bihar, Odisha, Uttar
Pradesh, West Bengal, Maharashtra, Gujarat,
and Dadra and Nagar Haveli
Phase 4: DBT Implementation by 2022
Thirteen: Arunachal Pradesh, Assam, HP, J&K,
Manipur, Meghalaya, Mizoram, Nagaland,
Sikkim, Tripura, Uttarakhand, A&N Islands and
Lakshwadeep
It may be noted that certain cities like Lucknow in UP, Chennai in Tamil Nadu, Bangalore in
Karnataka, Mumbai in Maharashtra, among others, are more prosperous than their average
states or even the states in Phase 1. Thus, even though the complete state is recommended for
a later date of DBT food implementation, these cities can be taken up for its immediate
implementation.

39
Two cautionary points are raised here -
First, as we have stated before, this analysis of states may not represent the situation in
individual districts of a state. For example, even though we have put the state of Punjab in
Phase 1, there could be backward districts in Punjab that have bigger clusters of poor people,
have scattered or inadequate banking facilities as compared to the more prosperous regions of
the states and/or have less grain available in the open market for consumption. While this may
discount the analysis and its conclusions, it does not, by any measure, impact the line of
thinking that there is a need to acknowledge the socio-economic diversity among Indian
states/UTs.
Second, the evaluation of a state using the four criteria above should be looked upon as the first
step and not as a final leap that will guarantee successful implementation of DBT. Successful
implementation and the ability to sustain an efficient and effective DBT food in the longer term
will be the result of a process rather than a onetime evaluation.
We highlight below some points that we observe to be necessary for ensuring success of DBT
food in the longer run:
1. Ensuring open market grain availability: When money is given to people to buy grains
from the open market, then it becomes the responsibility of concerned authorities (like FCI
and other state agencies) to ensure that enough grain is available in the open market.
Kozicka, Kalkuhl, and Brockhaus (2017) find that implementation of cash transfer in lieu
of the PDS is likely to higher prices of rice and wheat. But more money in system should
not push up food prices, in which case the very needy will be the most hurt. Markets
vulnerable to fluctuating supplies of goods will leave beneficiaries worse off since the DBT
will bring them into the ambit of market forces.
2. Gearing up the ecosystem in its entirety: When people get money they demand more of
everything, including education and health care (as has been described in previous
sections). Unless the government ensures enough medical supplies, vaccination centres,
good schools, giving money by itself will not improve the well-being of its recipients. In
fact, unless the whole system of public services evolves, diversion of transferred cash into
vices is quite possible. .
3. Redundancies of the PDS paraphernalia: With DBT food in place, most of the expansive
infrastructure around the physical grain procurement, storage, distribution and trade may
have to be reorganized and scaled-down. This is certain to have socio-economic and
political repercussions. Winding up the existing infrastructure and/or thinking of alternate
ways to utilize this strategically located infrastructure will be an important step in this
transition from PDS to DBT.
4. Address missing food-absorption element in the current welfare schemes: Despite the
NFSA explicitly stating the role of the state and Central Government in providing
40
nutritional security, the DBT does not yet attend to this aspect35. It has been shown that
linkages with health and nutrition schemes/initiatives are significant in improving child
nutrition and women’s health36. Thus, the current perverse levels of malnutrition will need
more than rice and wheat to address and a cash amount transferred to support rice and wheat
open market purchases may not be enough to address the issue. The government should
think of ways to improve the cash transfer amount so that the recipients are able to afford
a diversified consumption basket.
Interestingly, some of our above observations find support in Khera (2014) who highlights
them as reasons37 why DBT food in India would not work and thus there was a need to
strengthen PDS. For us, these pointers are first steps that are necessary interventions for
successful implementation of DBT-food.
Another point in favour of DBT food is the existing caveat of force majeure under the NFSA.
According to this caveat, in situations of force majeure (like war, fire, drought, flood, cyclone,
and earthquake), where regular supply of food grains/meals is adversely affected, the NFSA
legal entitlement does not apply. This means that continuity of grain entitlements in the periods
it is needed the most is not assured. The DBT cash system can bypass that issue and the
government can even decide to increase that transfer amount during vulnerable times thereby
addressing one of the biggest criticism of the NFSA.
We next progress to the way forward that we suggest based on the analysis of the paper and
also to the policy recommendations.
Section IV: Way Forward
The wheels have been set in motion to find an alternative to the PDS, a system that has existed
for longer than India has been independent, and replace its grain entitlement with a cash transfer
under the system of DBT. Despite the evident problems of the PDS and its inefficiencies, which
are common knowledge, this move from food to cash will be by far the boldest and most radical
move by the government. Given the substantial value that food holds especially in policy
discourse on poverty alleviation, this policy will come under heavy public scrutiny. Fear of
rocking the sensitive socio-political balance compels states/UTs to retain and strengthen the
PDS instead of replacing it with an ICT based DBT system. However, there are compelling
arguments, as presented in this paper, on economic and social grounds in favour of substituting
the PDS with DBT in food.
Admittedly, not all states currently have the capacity to introduce such a system immediately.
With the number of people living below the poverty line still at high levels, the need for
providing food is understandable in some areas where its incidence is the highest. For the other
35 Section 31, Chapter 12, National Food Security Act (2013) http://indiacode.nic.in/acts-in-pdf/202013.pdf 36 https://blogs.unicef.org/evidence-for-action/cash-transfers-and-improved-child-nutrition-where-did-all-the-
impacts-go/ 37 As per Khera (2014), five reasons why cash transfers would not work were: (i) expenditure (diversion) of
cash on non-food items, (ii) inconsistent or irregular supply of food grains,(iii) costs involved in accessing
far away banks, (iv) delays in payments and, (iv) resultant rise in food prices.

41
states however, replacing PDS rations with a food subsidy could be a socially, economically
and fiscally wise decision.
Shifting all in-kind welfare schemes to cash in the long term will enable the convergence of all
benefits under different schemes into one consolidated amount for the beneficiary. The
advantage being that while each component of the ‘consolidated grant’ is intended for a specific
purpose, beneficiaries, in reality, are free to use it as per their needs. The administrative
synergies of running multiple transfers through the same agency and using the same beneficiary
database would create a positive externality with immense benefits from consolidating and
analyzing data on transfers. Eventually this cash transfer system can become a consolidated
income support program for the poor and eliminate multiple sources of subsidy. Such a cash
transfer system can become an important part of the country’s social safety net system.
Apart from this, a cash transfer also removes the unwanted ‘paternalism’ by the state and
encourages beneficiaries to be determinants of their own consumption needs. Many
commentators point towards the vices like increased consumption of alcohol that such
‘unconditional’ cash could trigger, particularly in the hands of men. However, from the review
of both national and international experiences, we found little evidence of such behaviour.
From the perspective of the government, transferring benefits in the form of cash directly into
the accounts of beneficiaries identified through Aadhaar has unique advantages. Firstly, the
State Government can track the flow of benefits to each beneficiary on a real-time basis.
Secondly, the process of identifying the ineligible beneficiaries is easier through this system.
However, even the DBT is fraught with challenges and it remains to be seen if the government’s
pro-active engagement with digitisation continues for next couple of years. The sustainability
of the DBT is dependent on how deep technology based products and solutions are integrated
into the system and how inclusive these solutions are of the poorest and the most illiterate
citizens of the country. Services such as mobile wallets and payment banks attempt to bypass
the problems associated with the costly brick and mortar-banking infrastructure. However, the
demonetization drive in 2016 revealed the limited outreach that these products have. Ensuring
last mile delivery of benefits under DBT requires further initiatives to be taken by the
government in confluence with private players to improve ease of use and access to financial
technology.
Another related aspect is use of Aadhaar for identifying and disbursing benefits under welfare
schemes. Despite controversy surrounding it, Aadhaar is best placed for the true and unique
verification of beneficiaries. The rapid pace at which the Government has enrolled people
(especially those living in the rural parts) into this program has made it credible Having a
database with just the Aadhaar card information is sufficient to identify every recipient of
scheme separately (subsuming the multitude of cards and documents that exist today for
identification under various schemes). However, despite the success of Aadhaar together with
its legal backing, India is still in the initial stages of creating a ‘master database’ with
information on all its citizens. To create such a master database, different databases such as
Aadhaar, the National Population Registry, and the Socio-Economic Caste Census (SECC)

42
must be merged. In addition, the SECC also needs to be updated more frequently (say every 5
years instead of the current 10 years) to truly assess the socio-economic progress being made
by the poor. The PFMS is a step in the right direction. All this also requires measures to ensure
security and safety of information contained in this database. DBT in the future thus requires
investment and monitoring not just in the merger and consolidation of data but also for retaining
privacy and protection of an individual’s personal information.
There is an undisputed need for the political and economic thinking behind DBT-food to evolve
to consider creation of a wider system of welfare that creates a social-safety net for the
vulnerable, DBT food is just the first step. It will provide a compelling platform to the
government for creation of a wider social safety system.
Based on our analysis, we present below a summary of main policy recommendations for
implementing ICT-based solutions for streamlining India’s food subsidy bills.
Policy Recommendations
For the DBT-Food
I. Revamp infrastructure
Ensure open market grain availability: Centre and the states need to ensure
adequate availability of food grains in the open market. While states that are net
producers will find this easier, the states that do not produce enough surpluses and
are in net deficit will need to initiate efforts to maintain a consistent supply of food
grains. For this, the private supplies have to be made more reliable and widely
distributed. FCI and State Governments have created storage capacity to hold stock
equivalent to three months’ PDS requirement in most districts. It will be prudent to
transport food grains to the food deficit districts and undertake OMSS operations in
selected vulnerable areas to maintain sufficient supply of wheat and rice in the open
market. There are some districts in eastern states, especially in NE region, where
storage capacity is still shorter than three months requirement. The State
Governments of these states should urgently create storage capacity in these
districts so that supply is maintained and OMSS can be continuously undertaken.
Transform (winding-up or revamping) fair price shops: This will be a major
challenge, and efforts will be needed to accommodate the existing FPS network of
over 5 lakh ration shops, possibly in other vocations. Business models that allow
FPS to be converted into general stores can be looked into and the role of the private
retail sector can be explored. In both Rajasthan and Madhya Pradesh, such models
have been adopted. In the case of Rajasthan, FPSs have tied up with a retail
enterprise, the Future Group, to sell products apart from rice, wheat and other
commodities sold under the PDS. The agreement has been structured to benefit both
the FPS dealer and the consumer (who can be non-beneficiaries also). Evaluation
of the scheme so far has shows that 20 percent of all FPS in Rajasthan have been
43
integrated into the scheme38. FPS dealers under the scheme have received additional
income between INR 5,000-10,000 due to the expansion of the number of
commodities sold (Agarwal 2017).
Promote inclusive financial integration: Simultaneous efforts are required to
increase the number of bank branches, ATMs and BCs. There is also a need to
include cooperative banks and even large PACS (which currently are not part of the
core banking system). These smaller cooperatives/banks have a better outreach in
certain areas where accessing payments will become easier if they also become part
of DBT. Integration of India Post into the DBT payment channel is a step in the
right direction. Given its wide access and outreach across the country, the postal
network can give a thrust to the system. The cause of expanding the banking
network is further supported by the RBI’s decision to allow India Post and private
enterprises (e.g. Airtel and Paytm) to set up payments banks that can further
improve the delivery channel of food subsidy through DBT. In addition, the RBI
has also shifted to on-tap licensing creating the scope for smaller institutions to open
banks in future (RBI, 2016); Digital initiatives such as BHIM, UPI are steps in the
right direction but it is only over time that they will be able to gain the stakeholder’s
trust enough to ease the common man’s reliance on banks;
Continuous drive to promote financial literacy: The challenge of last-mile
connectivity is not just related to the supply side but also to the demand side. Even
with sufficient bank branches, ATMs, and BCs, there is still a lack of demand from
the consumers (i.e. beneficiaries) for using these services. This is partly due to the
low level of financial literacy and lack of awareness and knowledge about the
benefits of formally engaging with the banking system and thus there is a need to
aggressively promote financial literacy/awareness among all;
Encourage innovations in payment channels: Apart from vertical expansion of the
banking network, we also recommend horizontal expansion of payment channels.
More agencies that are not necessarily financial institutions should be granted the
opportunity to become point of withdrawal for beneficiaries. One channel that can
be realistically explored is mobile money, given the large penetration of mobile
phones in India. Adopting a model similar to Kenya’s m-PESA, can benefit a large
number of beneficiaries who for various reasons may not necessarily have access
to institutional banking services;
Stable IT connectivity: Existing levels of IT connectivity, though improving each
day, has a long way to go. Reliable IT connectivity at all times is an essential criteria
for a State or parts of it to switch to DBT or even to draw full benefits of the PDS
reforms. Unless there is a deeper penetration of telecom (especially cellular)
services across the country, especially in rural, remote and hilly/ desert/forested
38 FPS have been selected based on fulfilling certain basic conditions regarding ownership of FPS, minimum
area of the shop, and location.
44
areas where the poorest and marginalised live, PDS reforms or DBT can never be
complete. Thus, reliable connectivity is the linchpin of these reforms in PDS;
Create a grievance redressal mechanism: An effective and responsive grievance
redressal mechanism should be established for beneficiaries to register their
complaints and queries. States should ensure that toll-free numbers exist and that
they are well-advertised.
II. Scaling down of existing grain procurement operations:
With DBT food, the existing system of procurement of food grains by the government will
need to be sequentially modified. Excessive focus on rice and wheat and on selected states
for its procurement, PDS had overtime adversely affected the ecological balance, for
example in several rice producing areas in north-west India. Diversification to other crops
will have to be undertaken on a sustained and planned basis. In order to prevent any setback
to farmers, the Centre and states should together work towards:
Hedging farmers’ market risks: The Centre and states should together work towards
creating and facilitating deep and wide alternative markets for farmers to sell their
surplus. The Central Government has already taken a step in the right direction with the
launch of National Agricultural Markets (e-NAM), an electronic portal that has the
potential to connect farmers to distant agricultural markets across the country. With
uniform taxation across country with Goods and Services’ Tax (GST), eNAM should
get a thrust going forward;
o Provision of an unconditional cash transfer to the farmer: With DBT in food, the
government may also consider, in the longer run, substituting the existing input
subsidy support (including fertiliser subsidy) and output price support to farmers
with a cash transfer made directly into the farmers’ bank accounts. China provides
budgetary support to its farmers on both the input and output side. On the input side,
in particular, the budgetary support is given in the form of one payment under the
head "agriculture support and payment protection”. This payment includes direct
payment to grain producers, compensation for any increase in price of agricultural
inputs, particularly fertilizer and fuel, and subsidies for improved seeds and for
purchases of agricultural machinery (OECD 2017). India too can introduce such a
cash transfer that can be delinked from actual production levels. Such transfer can
also be in the form of deficiency payments where farmers are compensated for the
market price-risks. But integrity of price discovery in the markets is essential for
any such system of deficiency payments and it can only be explored after ensuring
accurate and timely capture of prevailing market prices in Mandis through online
data entry in e-NAM portal which will have to be linked to Agmark price portal;.
Encourage agriculture financial commodity markets: In order to make agriculture
markets efficient, there is an almost simultaneous need to encourage deep and wide
45
agri-financial markets. Integrating e-NAM with financial markets can help give former
the right pivot making the system deeper and thus more efficient;
III. Investments and incentives
Correct Price Incentives: By creating and facilitating deep and wide markets and
ensuring right price incentives, the government can encourage production of high
value goods such as fruits, vegetables, milk, fish, eggs and meat. These are likely to
be demanded increasingly by a growing set of income secure consumers. Substantial
investment along the entire value-chains for perishables is pivotal to shield both
farmers and consumers from existing price volatility that is exacerbated by the long
chain of intermediaries ;
Financial Sector Reforms:
o Financial Inclusion: To give thrust to the financial inclusion drive under the
PMJDY, additional efforts by state and UT governments and agencies should be
made. For example, they can include assistance from civil society groups involved
in an area to ensure that all BPL and AAY households in their respective states
have bank accounts. In addition, information sessions should be set up to educate
consumers about the basic features of banking such interest rates, how to operate
ATMs, benefits of saving in a bank, etc.
o The state and UT government’s should ensure that all bank accounts be integrated
with the Core Banking System (CBS), as failing to do that will delete the
beneficiary account details from the list of beneficiaries;
Investment in awareness campaigns and camps:
o Awareness about the DBT scheme and benefits: As the success of cash transfer
schemes is dependent on public consensus, it is essential that states implementing
the DBT ensure that aggressive efforts are made to spread awareness about the
scheme and its benefits. Information campaigns, registration camps, etc., should
be set up to inform people about their entitlements, the usage of these benefits,
and the pre-requisites. Learning from Swachh Bharat Mission may be used to plan
and execute the campaign for information dissemination on DBT of food subsidy.
To ensure inclusion of all the eligible households, these camps must facilitate the
completion of the pre-requisites (such opening of bank accounts and its seeding).
o In order to avoid diversion of the transferred cash towards vices, government has
to ensure that the entire economic system grows up to meet the increasing demand
that will result from greater disposable incomes in the hands of a household. In
particular, there is a need to ensure commensurate increased and stable supply of
food, education and healthcare services.

46
o Awareness about nutrition and health: Given the NFSA’s focus on nutrition, both
the states and Central Governments must educate beneficiaries about nutritional
intake, and foods and habits that are healthy and are needed especially for infants,
children and mothers;
o Awareness about the aadhaar-seeding of bank accounts, integration of the mobile
numbers with the banking system has to be regularly shared with the beneficiaries;
IV. Leadership and political will: Political motivation in the States to implement the DBT
or reforms in the PDS is a vital factor determining the future of any reform process. While
Rajasthan in the recent past has rapidly improved its PDS, others like Telengana who
despite being at par with Andhra Pradesh (and way ahead of many others) at the time of
bifurcation of the State of Andhra Pradesh, is today slow in even introducing many of the
necessary progressive steps. Therefore, leadership and strong political will at the very top
of the State government is most vital for undertaking PDS and DBT reforms. While most
state governments are determined, the speed and close monitoring is a feature, which can
vary with their resolve.
V. Adequacy of benefit
This is among the most crucial aspects of DBT food and unless the “adequacy’ is ensured and
delivered the whole ambition of DBT will collapse.
From our analysis in the preceding sections we found that the government’s current formula
i.e. 1.25*MSP – CIP has not helped beneficiaries in Chandigarh and Puducherry to fully sustain
their pre-DBT consumption levels. This is attributable to the market price differential between
the retail prices of rice and wheat and food subsidy paid to the beneficiaries.
In view of this, the following alternative formulas for calculating the food subsidy amount are
available to Government:
1. Substitute MSP with Economic Cost: Calculate the food subsidy at full economic cost
of the commodity (which is round 40-50% over the MSP) i.e. let Subsidy = 1.4 (or
1.5)*MSP – CIP
2. Instead of using MSP, the subsidy can be calculated at retail prices of the commodity
i.e. Subsidy = Retail Price – CIP. This retail price could be a quarterly average
prevailing price in selected markets nationally. Despite this being a favoured method,
we foresee two problems immediately in its implementation:
o Prices in south Indian states are generally, on an average, higher, than the prices in
north India. By averaging prices throughout India, we may be supporting consumers
in one region more than in other region;

47
o There is a possibility of rigging of prices by traders and/or mandis in APMCs and
thus efficiencies of markets and accuracy and timeliness of price data will have to
be ensured by the state and Central Governments;
3. An alternative to the ‘retail formula’ is to index the food subsidy with the Consumer
Food Price Index (CFPI) or to Consumer Price Index-Agricultural Labourers;
4. Finally, following SEWA’s (2015) computation of benefits, the size of the cash benefit
transferred under the DBT can instead be treated as a ‘basic income’ and instead of
relying on prices of select commodities; it can be computed at the official poverty line.
According to us, the most practical and feasible solution is given in Alternative 1. If the
MSP is substituted with Economic cost, the problems of “inadequacy” of the food
subsidy transfer amount may be resolved. The government can expect to save the
difference between economic cost (i.e. cost incurred under PDS) and food subsidy
transferred under DBT. Due to this suggestion, part of saving that was likely to result
from DBT-food is likely to reduce and/or vanish. However, we should remember two
things:
Primary objective of any welfare policy is betterment and welfare of the
beneficiaries: through DBT we are just trying to find a better way to deliver to the
beneficiaries and even if it costs the same (as under PDS) to the system but the
delivery is better and targeted, the resources can still be counted as spent better;
Even if Option 1 reduces savings, the government will still save on the distribution
cost incurred by State Governments e.g. states will save on their handling, internal
freight costs, costs resulting from storage and transport losses, leakages and
pilferages.
One point of caution: it is not one-shot in arm solution that by increasing the food subsidy
amount the government can alleviate the problem of malnutrition and poverty. In fact, an
increase in the food subsidy amount will need to be accompanied by aggressive measures to
improve the banking infrastructure, financial literacy, create awareness among the beneficiaries
and address problems of exclusion and inclusion errors. In fact an entire ecosystem
encouraging better economic and physical access and absorption of food by all, needs to be
come up almost simultaneously.
Besides implementing these reforms, the government also has to undertake simultaneous fiscal
and labour market reforms to address the longer run problems associated with an unconditional
cash transfer. As stated before, in the longer run, such an unconditional cash transfer may lead
to perpetuation of informality in labour markets, slowdown of re-allocation of labour across
sectors, and hampered economic transformation (Birner and von Braun 2015, Woolard and
Leibbrandt 2010 and Levy 2008). Therefore, it becomes crucial that the list of beneficiaries
under the scheme should be periodically reviewed so that only the real needy got the benefits
in the longer run. There is also a need to ensure a continuous assessment of impacts of this
transfer on social and economic interaction of the beneficiaries. Besides this, the government

48
has to encourage formalization of labour and create more employment as that is the best way
to deliver inclusive and sustainable development in a country.
Policy Recommendations for APDS
In the short to medium run, for states in Phase 2, 3 and 4, we recommend that they continuously
reform their PDS machinery and simultaneously work towards strengthening the infrastructure
for implementing DBT (on lines as mentioned in the prior section). For reforming PDS, the
following recommendations are made below. These recommendations are clearly viewed as
creating the groundwork for eventually introducing DBT-food:
1. Review of AAY and BPL lists: Regular review will help address the existing inclusion
(including the ineligible) and exclusion (excluding the real needy) errors. PDS or DBT, this
element is a crucial aspect of the scheme. The nine-point action plan though has been
completed by nearly all states, progress on them needs to be regularly monitored;
2. Ensure continuous electricity supply and internet connectivity: As the APDS’s main
advantage is real-time verification of beneficiaries, reliable internet connectivity and fewer
power outages would be desirable;
3. Biometric authentication should not just be restricted to finger prints: States may follow
successful examples like that of Andhra Pradesh who has adopted iris scans and one-time
passwords sent as SMS to the registered mobile phone number as alternatives if
authentication through fingerprinting fails.
a. For beneficiaries without Aadhaar, or for those whose details have not been registered
in the cloud-based system, provision for on-the-spot registration at the closest Fair Price
shop is recommended. This would enable beneficiaries to self-select for the scheme.
We believe that modernization of the TPDS machinery through the APDS should be
mandatory. However, some states can use the improved system to shift to DBT in food
immediately. While others especially the ‘special category’ states (ones located along
international boundaries, with a hilly terrain, with low population density, a sizable share of
tribal population, or which are economically and infrastructural backward) should continue to
maintain and strengthen their APDS operations and delivery in the short to medium run. In the
longer run, however, they should shift to DBT food.
Overall, DBT has the potential to make way for a system of social security or universal basic
income, a special income support provided to each and every citizen whose size can be adjusted
to their needs and vulnerability. Although the concept of basic income is still at its infancy even
in the most developed countries, the path to creating such a system has to be through the DBT.
Notwithstanding initial problems in implementation and the problems of labour markets that
DBT may trigger, a cash transfer systems has become a potent tool in the government’s
armoury of social welfare. As the country transitions from its low income position to becoming
the world’s fastest growing economy in a few years, a cash transfer system delivering a social
security transfer to all can promote a growth process that is inclusive, efficient and sustainable.

49
Bibliography
Aadil, A., Singh, L. K., & Malhotra, R. (2016, March). MicroSave India Focus Note #128.
Retrieved from MicroSave:
http://www.microsave.net/files/pdf/IFN_128_Baseline_Assessment_for_DBT_in_TP
DS_Will_This_Small_Step_Become_a_Giant_Leap.pdf
Agarwal, S. (2017). Annapurna Bhandar Yojna: An initiative to revamp the Public
Distribution System in Rajasthan. Govt. Of Rajasthan.
Aline, Gazola, & Hellmann. (2015). How Does Bolsa Familia Work? Inter-American
Development Bank.
Barraclough, S., & Utting, P. (1987). Food Security Trends and Prospects in Latin America.
Working Paper No. 99, University of Notre Dame, Hellen Kellog Institute for
International Studies.
Bhattacharya, P. (2015, November 22). Cash Transfers: Miracle or Mirage. Mint .
Chakrabarti, R. (2014). Show Me the Cash: Direct Cash Transfer in India. SSRN .
Cunha, J. M., De Giorgi, G., & Jayachandran, S. (2011). The Price Effects of Cash Versus
In-Kind Transfers. NBER.
Davala, S., Jhabvala, R., Mehta, S. K., & Standing, G. (2013). Basic Income: A
Transformative Policy for India. Bloomsbury.
Davala, S., Jhabvala, R., Mehta, S. K., & Standing, G. (2015). Basic Income: A
Transformative Policy for India. Bloomsbury.
DBT Mission. (2016). Report on DBT. GoI.
de Groot, R. (2016, September 29). Cash transfers and improved child nutrition: Where did
all the impacts go? Retrieved from UNICEF : https://blogs.unicef.org/evidence-for-
action/cash-transfers-and-improved-child-nutrition-where-did-all-the-impacts-go/
Dreze, J. (2011, May 11). The Cash Mantra. Retrieved from The Indian Express:
http://archive.indianexpress.com/news/the-cash-mantra/788791/
Dreze, J., & Khera, R. (2015). A PEEP at another India. Global Action on Poverty.
Dreze, J., & Khera, R. (2015, August 31). Thought for Food. Outlook .
Dreze, J., & Khera, R. (2015, February 14). Understanding Leakages in the Public
Distribution System. Economic and Political Weekly .
FAO. (2015). FAO Food Security Indicators. FAO.
50
Ghosh, J. (2011, May 21). Cash Transfers as the Silver Bullet for Poverty Reduction: A
Sceptical Note. Economic and Political Weekly .
Glewwe, P., & Kassouf, L. (2010). What Is the Impact of the Bolsa Familia Program on
Education. International Policy Centre for Inclusive Growth .
GoI. (2016). Economic Survey 2015-16. GoI.
Grosh, M., Coady, D., & Hoddinott, J. (2004). Targeting of Transfers in Developing
Countries: Review of Lessons and Experiences. World Bank. Washington D.C.: World
Bank.
Grosh, M., Del Ninno, C., Tesliuc, E., & Ouerghi, A. (2008). For Protection and Promotion:
The Design and Implementation of Effective safety nets. World Bank.
Gulati, A., & Saini, S. (2015). Leakages from Public Distribution System (PDS) and the Way
forward. ICRIER.
Haushofer, J., & Shapiro, J. (2016). The Short Term impact of Unconditional Cash Transfers
to the Poor: Experimental Evidence from Kenya. Quarterly Journal of Economics .
Himanshu, & Sen, A. (2013, November 13). In Kind Food Transfers - I. Economic and
Political Weekly .
IDS. (2013). Scorecard Spot Check evaluation: Benazir Income Support Program. Innovative
Development Strategies.
Kapur, D., Mukhopadhyay, P., & Subramanian, A. (2008, April 12). The Case for Direct
Cash Transfers to the Poor. Economic and Political Weekly .
Khera, R. (2014). Cash vs. in-kind transfers: Indian data meets theory. Food Policy , 116-128.
Kozicka, M., Kalkuhl, M., & Brockhaus, J. (2016). Food Grain Policies in India and their
Implications for Stocks and Fiscal Costs: A Dynamic Partial Equilibrium Analysis.
Journal of Agricultural Economics , 98-122.
Levy, S. (2008). Good Intentions, Bad Outcomes: Social Policy, Informality, and Economic
Growth in Mexico. Brookings Institution Press.
Manley, J., Gitter, S., & Slavchevska, V. (2012). How Effective are Cash Transfer
Programmes at improving nutritional status? A Rapid evidence assessment of
programmes' effects on Anthropometric Outcomes. University of London.
Masino, S., & Niño-Zarazúa, M. (2014). Social Service Delivery and access to financial
innovation. World Institute for Development Economics Research.
Mishra, P. (n.d.).

51
Mishra, P. (2013, September 28). Financial and Distributional Implications of the Food
Security Law. EPW .
NITI Aayog. (2015). Report on the Sub-Group of Chief Ministers on Rationalization of
Centrally Sponsored Scheme . GoI.
Niti Aayog. (2015). Social Sector Delivery: Good Practices Resource Book. GoI.
NSSO. (2014). Report 558 - Household Consumption of various goods and services in India
2011-12 . NSSO.
OECD. (2017). Monitoring and Evaluation Report . OECD.
Planning Commission. (2013). Poverty Estimates for 2011-12. Government of India.
Pritchard, B., & Choithani, C. (2015, January 17). Assessing Bihar's Coupon Based PDS.
Economic and Political Weekly .
Puri, R. (2017). India's National Food Security Act (NFSA): Early Experiences. Leveraging
Agriculture for Nutrition in South Asia .
Reserve Bank of India. (2015). Report of the Committee on Medium Term Path on Financial
Inclusion. RBI.
Roelen, K., & Ulrichs, M. (2012). Equal Opportunities for all? A Critical Analysis of Mexico's
Oportunidades. Institute of Development Studies.
SEWA Bharat. (2012). An Experimental Pilot Cash transfer in Delhi. SEWA Bharat.
Shah, M. (2008, August 23). Direct Cash Transfers: No Magic Bullet. Economic and Political
Weekly , pp. 77-79.
Sivaraman, R. (2016, June 7). 20 kg rice, power subsidy among welfare schemes announced.
The Hindu .
Suplicy, E. M. (2007). Citizen's Basic Income . Woodrow Wilson International Center for
Scholars.
Swaminathan, M. (2004, August 3). Targeted Food Stamps. The Hindu .
The Economist. (2013, May 27). Why does Kenya lead the World in Mobile Money? The
Economist .
The Hindu. (2016, March 1). Budget 2016: Where the money comes from and where it goes.
The Hindu .
UNFPA. (2009). Concurrent Assessment of Janani Suraksha Yojana in selected states.
UNFPA.

52
UNICEF. (2014). Rapid Survey on Children 2013-14. GoI.
Virmani, A., & Rajeev, P. (2001). Excess Food Stocks, PDS and Procurement Policy.
Planning Commission.
Von Braun, J., & Birner, R. (2015). Decentralization and Poverty Reduction. In E. Ahmad,
& G. Brosio, Handbook of Multilevel Finance (pp. 471-505). Edward Elgar Publishing
Limited.
Woolard, I., & Leibbrandt, M. (2010). The evolution and impact of unconditional cash
transfers in South Africa. South Africa Labour and Development Research Unit.
World Bank. (2015, April 22). Projects and Operations. Retrieved from World Bank:
http://www.worldbank.org/en/results/2015/04/22/reaching-poorest-safety-net-pakistan
World Bank. (2015). State of Social Safety Nets 2015. World Bank.

53
Annexure 1: International and National Cash Transfer Schemes
International Cash Transfer Schemes
Country Year Modalities Impact
Brazil:
Bolsa
Familia
2003 Covers 25% of total population
Eligible beneficiaries below income level of
$60 and further identified through
Household surveys
Size of transfer – R$15-95
Access payments through banks, lottery
offices, retail stores using debit card
Conditions – Minimum 85% attendance and
compulsory attending of health checkups for
women and children
Cost of scheme – 0.5% of GDP
80% of benefits went to identified
beneficiaries
Decline in households that are food
inadequate
Decrease in Brazil’s GINI coefficient
Decrease in number of children
malnourished
Increase in food consumption
Over 60% transactions made through
non-bank agencies
Mexico:
Oportuni
dades
1997 Focus on geographically poor regions.
Households identified in these regions using
marginal index
Covers 20% of total Population
Cost of scheme – 0.4% of GDP
Size of transfer – 235 pesos (average)
Payments made bimonthly
Benefits can be withdrawn from bank
branches and authorized non-financial
agencies
Conditions – Minimum attendance
requirement and mandatory health check ups
60% of benefits went to poorest 20% of
the population
12% decrease in incidence of illnesses
Increase in enrollment of children into
schools and reduction in dropout rates
15% increase in consumption
(especially for food)
Increase in likelihood of women
deciding on how benefits to be spent
Banglad
esh:
Shombh
ob
(Pilot)
2012 Households identified using PMT score
Size of transfer – BDT 400 for households
with infants or primary school going
children, BDT 800 households with both
Payment through electronic payment system
devised by Bangladesh Post
Conditions – Growth monitoring of
children, nutrition sessions to be attended by
mothers, and 80% attendance in schools
Increase in consumption especially for
food
Dietary diversity
Increased expenditure on protein
Indonesi
a:
Program
Keluarga
Harapan
(PKH)
2007 Beneficiaries identified as those 80% below
poverty line
Unified database containing information on
beneficiaries created for scheme
Size of transfer – USD 187 paid monthly
Benefits transferred through Post office
Reduction in nutritional deficiency
Increase in school attendance
Increase in monthly per capita
expenditure on health and education
Stronger impact among beneficiaries in
urban areas
10% increase in average monthly
consumption
Benefits used to pay off debts by some
beneficiaries
Kenya:
GiveDir
ectly
UCT
(Pilot)
2011 Focus on poor households in the most
vulnerable geographical areas
Size of Transfer - $32
Benefits paid monthly or lump sum (for nine
months)
Benefits equivalent to 33% of household
expenditure
Payment made through MPESA (Mobile
platform)
Recipient of benefits either male or female
Benefit used on building household
assets, food, healthcare, education and
social expenses
Increase in total consumption by 20%
32% decrease in hunger
42% decrease in the number of days
children go hungry

54
Pakistan:
Benazir
Income
Support
Program
2008 Beneficiaries identified using PMT score
Beneficiary information collected and stored
in single registry called National Database
Registration Authority
Each beneficiary given unique identification
number
Coverage – 3% of population
Cost of scheme – PKR 70 Billion
Size of transfer – PKR 3000 paid quarterly
Payment made directly to bank accounts,
Post offices and in some cases by cheque
Government now piloting biometric ATMs
and mobile money transfer
95% of benefits spent on daily
consumption requirements (such as
food)
Linked with education and health
through introduction of co-
responsibilities
Domestic cash transfer schemes*
State Year Modalities Impact
Delhi: Annashree
Yojana
2012 Beneficiaries identified through
household survey and those excluded
from TPDS
Eventually eligibility criteria changed to
households with income less than INR 1
lakh (per annum)
Size of transfer – INR 600
Payment made directly to bank account
in the name of female head
Reliance on BCs for withdrawal
Bank accounts have to necessarily be
aadhaar seeded
Large information campaigns about the
scheme and its benefits conducted prior
to enacting scheme
Increase in food
consumption
Dietary diversity
Women empowered to
make decisions on
consumption expenditure
SEWA Delhi (Pilot)
2011 BPL households randomly selected
Size of transfer – INR 1000
Payment made directly to bank account
in the name of female head
SEWA facilitated opening of accounts
for women without accounts
Beneficiaries barred from purchasing
food grain at FPS
Significant increase in
consumption of non-cereal
foods such as milk, eggs,
fruits and vegetables
No significant increase in
consumption of alcohol
and tobacco
SEWA Madhya
Pradesh Rural and
Tribal (Pilot)
2010 Two pilots conducted in sample of non-
tribal and tribal villages
Size of transfer – INR 300 per adult and
INR 150 per child
Payment made directly into bank
accounts
Information campaigns conducted prior
to pilot study to spread awareness on
study
Beneficiaries allowed to purchase food
grains from FPS
Increase consumption of
eggs, fruits and vegetables
Many beneficiaries paid off
debt
Cash spent on repairing
household dwellings,
improving drinking water
sources etc.
Some part of benefits saved
in bank accounts
*Details about the Chandigarh and Puducherry DBT-Food rollout are given within the Paper and are
thus not mentioned here.

55
Annexure 2: Tables for NFSA/TPDS in Puducherry and Chandigarh
Table 1: Highlights of TPDS and NFSA in Chandigarh and Puducherry*
TPDS and NFSA
TPDS NFSA*
Puducherry Chandigarh Chandigarh (2014-
15)
Entitlement
(Kg/HH/Month)
AAY 35 35 35
BPL 25 35 5 (per member)
APL 15 35 -
Issue Price at FPS
(INR/Kg)
APL Rice Free 8.5 -
BPL Rice Free 6.15 3
AAY Rice Free 3 3
APL Wheat Free 7
BPL Wheat Free 4.65 2
AAY Wheat - - 2
Total Beneficiaries
(Million) 0.67 0.35 0.24**
Total Population
(Million)** 1.25 1.1 1.1
Coverage (%) 54 32 23
Source: Puducherry and Chandigarh Dept. Of Civil Supplies, Census 2001, Food Bulletin
*after implementing NFSA, Puducherry directly shifted to DBT in 2015
**Excludes APL card holders receiving tide over allocation

56
Annexure 3: Evaluation of States for readiness
Table 2A: Demographic and PDS Indicators
Phase 1
State Poverty
Ratio (%)
Share in India's
Poor (%)
Literacy
Rate (%)
Literacy Rate -
Female (%)
Underweight
(%)
Stunting
(%)
PDS Extension?
(Y/N)
PDS Leakages
(%)
PDS
Consumption (%)
Chandigarh 21.81 0.09 86 82 24.5 28.7 No 73.49 11.24
Daman & Diu 9.86 0.01 80 79 26.7 23.4 Yes 92.83 2.00
Delhi 9.91 0.63 84 81 27 32.3 No 83.62 7.78
Goa 5.09 0.03 81 77 23.8 20.1 Yes 56.13 25.53
Puducherry 9.69 0.05 83 76 22.6 23.7 Yes 59.74 37.52
Punjab 8.26 0.86 74 69 21.6 25.7 Yes 61.33 8.58
Phase 2 Andhra Pradesh* 9.2 2.92 63 55 31.9 31.4 Yes 31.35 33.44
Haryana 11.16 1.07 70 63 29.4 34 Yes 55.25 11.61
Karnataka 20.91 4.81 71 65 35.2 36.2 Yes 40.76 37.29
Kerala 7.05 0.89 88 88 16.1 19.7 Yes 41.84 34.39
Tamil Nadu 11.28 3.06 75 69 23.8 27.1 Yes 21.33 49.76
Phase 3
Bihar 33.74 13.28 60 52 43.9 48.3 No 32.96 18.60
UP 29.43 22.17 63 54 39.5 46.3 Yes 62.93 12.34
Jharkhand 36.96 4.61 64 55 47.8 45.3 Yes 52.32 14.64
Chhattisgarh 39.93 3.86 68 59 37.7 37.6 Yes 8.84 36.34
Madhya Pradesh 31.65 8.68 65 56 42.8 42 Yes 55.56 17.22
WB 19.98 6.86 73 69 31.5 32.5 Yes 69.43 12.23
Rajasthan 14.71 3.81 62 50 36.7 39.1 Yes 66.43 10.60
Maharashtra 17.35 7.34 77 71 36 34.4 Yes 53.80 21.01
Orissa 32.59 5.13 70 63 34.4 34.1 Yes 27.64 27.50
Gujarat 16.63 3.79 73 66 39.3 38.5 Yes 71.43 11.55
D&N Haveli 39.31 0.05 66 59 38.9 41.7 No 55.01 18.13
Source: Planning Commission, NSSO, NFHS – 4, Census 2011, DFPD,
*Refers to erstwhile unified Andhra Pradesh since data for Telangana is not available separately

57
Table 2B: Bank infrastructure and other aspects
Phase 1
State
Banking
Infrastructure
(per hundred
thousand)1
Active Bank
accounts (%
of Population
% of
accounts
seeded to
Aadhaar
Mobile Phones
(as % of
Population) 2
Aadhaar
Enrollment
(% of
Population)3
Aadhaar
Seeding of
Ration Card
(%)4
Chandigarh 128 (119) 152.42 73.90 121.86 101 100
Daman &
Diu 82 (68) 123.65 79.22 97.10 81 100
Delhi 82 (75) 119.10 68.09 291.87 119 100
Goa 140 (134) 157.31 65.52 109.54 101 89
Puducherry 72 (65) 115.86 77.87 108.41 98 100
Punjab 69 (65) 87.35 80.12 123.26 102 97
Phase 2 Andhra
Pradesh* 66 (55) 92.15 81.57 93.59 97 100
Haryana 63 (58) 86.94 77.48 89.94 104 91
Karnataka 67 (62) 82.20 72.49 105.72 94 100
Kerala 63 (61) 95.97 67.73 112.58 100 98
Tamil Nadu 71 (67) 89.96 62.59 112.95 92 100
Phase 3 Bihar 30 (27) 48.14 67.31 55.09 82 50
UP 34 (31) 61.22 64.33 74.62 85 75
Jharkhand 34 (31) 60.49 79.80 55.63 98 96
Chhattisgarh 38 (34) 70.60 75.00 64.16 98 97
Madhya
Pradesh 37 (34) 66.05 66.82 64.64 95 89
WB 39 (37) 64.18 67.40 88.43 92 62
Rajasthan 43 (39) 60.30 82.14 89.34 89 95
Maharashtra 49 (46) 68.41 70.03 106.54 95 87
Orissa 51 (47.6) 72.11 53.03 75.76 89 86
Gujarat 52 (48.1) 68.77 63.03 107.47 94 100
D&N
Haveli 74 (62) 98.12 77.15 96.56 99 94
Source: RBI, TRAI, UIDAI, India Post
1Estimated using 2017 estimates for Bank Branches, ATMs, BCs, POs by RBI and India Post and 2011
Census population totals. Figures in brackets are the same figures estimated using instead projected
population totals for 2016 (computed using decadal growth rate of population between 2001 and 2011)
2As on May, 2017; 3As on May, 2017; 4As on March, 2017
*Estimates for Andhra Pradesh and Telangana have been combined
Note: Banking Infrastructure, Active Bank accounts and Mobile Phones have been estimated based on
population projected for 2016 using final state-wise population totals given by Census 2011

58
LATEST ICRIER’S WORKING PAPERS
NO. TITLE AUTHOR YEAR
342 PROMOTING ORGANIC FOOD
PRODUCTS AND EXPORTS -
STATUS, ISSUES AND WAY
FORWARD
ARPITA MUKHERJEE
SOUVIK DUTTA
DISHA MENDIRATTA
AVANTIKA KAPOOR
TANU M GOYAL
JULY 2017
341 FACTORS INFLUENCING
INDIAN MANUFACTURING
FIRMS’ DECISION TO HIRE
CONTRACT LABOUR
JAIVIR SINGH
DEB KUSUM DAS
HOMAGNI CHOUDHURY
PRATEEK KUKREJA
KUMAR ABHISHEK
JULY 2017
340 ENVIRONMENT AND LABOUR
ON THE TRADE AGENDA:
LESSONS FOR INDIA FROM
THE TPP AGREEMENT
ANWARUL HODA
DURGESH K. RAI
JULY 2017
339 MAKING RAPID
STRIDESAGRICULTURE IN
MADHYA PRADESH:
SOURCES, DRIVERS, AND
POLICY LESSONS
ASHOK GULATI
PALLAVI RAJKHOWA
PRAVESH SHARMA
APRIL 2017
338 CAN ASSET
RECONSTRUCTION
COMPANIES (ARCS) BE PART
SOLUTION TO THE INDIAN
DEBT PROBLEM?
JAIMINI BHAGWATI
M. SHUHEB KHAN
RAMAKRISHNA REDDY
BOGATHI
APRIL 2017
337 TRANSFORMING
AGRICULTURE IN ODISHA:
SOURCES AND DRIVERS OF
AGRICULTURE GROWTH
ANWARUL HODA
PALLAVI RAJKHOWA
ASHOK GULATI
MARCH
2017
336 UNLEASHING BIHAR’S
AGRICULTURE POTENTIAL:
SOURCES AND DRIVERS OF
AGRICULTURE GROWTH
ANWARUL HODA
PALLAVI RAJKHOWA
ASHOK GULATI
MARCH
2017
335 DOUBLING AGRICULTURAL
GROWTH IN UTTAR PRADESH:
SOURCES AND DRIVERS OF
AGRICULTURAL GROWTH
AND POLICY LESSONS
SMRITI VERMA
ASHOK GULATI
SIRAJ HUSSAIN
MARCH
2017
334 DESTRUCTION OR
POLARIZATION: ESTIMATING
THE IMPACT OF
TECHNOLOGY ON JOBS IN
INDIAN MANUFACTURING
PANKAJ VASHISHT MARCH
2017
333 INDIA-PAKISTAN TRADE:
OPPORTUNITIES FOR
MEDICAL VALUE TRAVEL
NISHA TANEJA
SAMRIDHI BIMAL
ISHA DAYAL
TAHER NADEEM
MARCH
2017
1
About ICRIER
Established in August 1981, ICRIER is an autonomous, policy-oriented, not-for-profit,
economic policy think tank. ICRIER's main focus is to enhance the knowledge content of
policy making by undertaking analytical research that is targeted at informing India's policy
makers and also at improving the interface with the global economy. ICRIER's office is located
in the institutional complex of India Habitat Centre, New Delhi.
ICRIER's Board of Governors includes leading academicians, policymakers, and
representatives from the private sector. Dr. Isher Ahluwalia is ICRIER's chairperson. Dr. Rajat
Kathuria is Director and Chief Executive.
ICRIER conducts thematic research in the following eight thrust areas:
Macroeconomic Management Financial Liberalisation and Regulation
Global Competitiveness of the Indian Economy-Agriculture, Manufacturing and Services
Multilateral Trade Negotiations and FTAs
Challenges and Opportunities of Urbanization
Climate Change and Sustainable Development
Physical and Social Infrastructure including Telecom, Transport Energy and Health
Asian Economic Integration with focus on South Asia
Promoting Entrepreneurship and Skill Development
To effectively disseminate research findings, ICRIER organises workshops, seminars and
conferences to bring together academicians, policymakers, representatives from industry and
media to create a more informed understanding on issues of major policy interest. ICRIER
routinely invites distinguished scholars and policymakers from around the world to deliver public
lectures and give seminars on economic themes of interest to contemporary India.