working paper 375 inclusive growth in india learning from...
TRANSCRIPT

0
Working Paper 375
Inclusive Growth in India – Learning
from Best Practices of Selected
Countries
Suresh Chand Aggarwal
Divya Satija
Shuheb Khan
May 2019
INDIAN COUNCIL FOR RESEARCH ON INTERNATIONAL ECONOMIC RELATIONS

Table of Contents
Abstract ...................................................................................................................................... i
1. Introduction .......................................................................................................................... 1
2. Definition of Inclusive Growth ........................................................................................... 2
2.1 Need for Inclusive Growth ............................................................................................... 3
2.2. Challenges to Inclusive Growth ...................................................................................... 4
3. Inclusive Growth and Fiscal Policy Implications .............................................................. 5
3.1 Need for Specific Policies for Inclusive Growth ............................................................. 6
4. Methodology ......................................................................................................................... 7
5. Status and Pattern of Inclusive Growth............................................................................. 8
5.1. Status and Pattern of Inclusiveness across Selected Countries – Key Findings ............. 9
6. Inclusive Growth - Opportunities and Challenges for India ......................................... 17
6.1. Public Expenditure on Health ....................................................................................... 19
6.2. Fiscal Policy and Health ................................................................................................ 22
6.3. Fiscal Policy and Education .......................................................................................... 22
6.4. Fiscal Policy and Social Security .................................................................................. 24
6.5. Successful Government Interventions to Improve Inclusiveness ................................. 25
7. Conclusion and Policy Recommendations ....................................................................... 26
7.1. Recommendations ......................................................................................................... 26
7.1.1. Inclusive Growth Model Representing Issues Affecting Developing Countries .. 26
7.1.2. Inclusive Public Finance and Fiscal Policy for Inclusive Growth ...................... 27
7.1.3. Learning from Best Practices .............................................................................. 28
7.2. Conclusion ..................................................................................................................... 31
Bibliography ........................................................................................................................... 32
Appendices .............................................................................................................................. 36
List of Tables
Table 1: Inclusiveness Score and Rank for Selected Countries and Overall 5-Year Trend IDI
................................................................................................................................. 11
Table 2: Expenditure on Health across Selected Countries (2014) ........................................ 20
Table 3: Availability of Health Care Service Staff across Selected Countries ....................... 21
Table 4: Public Expenditure on Education across Selected Countries (2015) ........................ 23
Table 5: Pension Coverage across Selected Countries ........................................................... 24
Table 6: Government Schemes for Inclusive Growth in Selected Countries ......................... 25
Table 7: Recommendations for Policies to Achieving Inclusive Growth ............................... 29
List of Figures
Figure 1: Status of Inclusiveness across Selected Countries .................................................. 10
Figure 2: Inclusive Growth and Development Framework for India ..................................... 14
Figure 3: Key Contributors and Pillars towards achieving Inclusive Growth ........................ 16
i
Abstract
Globally, there is a clamour for creating a more inclusive world and India is also a frontrunner.
Government of India is fully committed to its resolve towards achieving inclusive growth. To
achieve this goal, efforts are being made to harmonise the national development priorities with
international efforts and a number of policies, strategies, programmes / schemes and actions
have been implemented at the national level.
In this context, this paper1 analysis India's current position in achieving inclusive growth and
sustainable development vis-a-vis 17 selected developed and developing countries including
the Turkey, South Africa, Mexico, Brazil, China, Korea, Indonesia, United States, United
Kingdom, Australia, France, Canada, Indonesia, Argentina, Russia, Italy, Germany and Japan.
The paper is based on an in-depth analysis of secondary information. A comparative analysis
of India’s inclusive growth position is done with that of the selected countries through a
comparison of scores and ranking of these countries vis-a-vis India's position, across key policy
and outcome indicators of inclusive growth. In addition, the paper presents specific policies
that have a positive impact on both growth and inequality, and that can be the focus of policy
action to achieve inclusive growth across different sectors in India. Based on this analysis, best
practices that India can adopt have been identified.
_________
Key words: Inclusive Growth, Sustainable Development, Development, Fiscal Policy, Equity
JEL classification: O15, O19, O23, O38, O40, O57, P46, Q01
Authors’ email: [email protected], [email protected], [email protected]
_____
Disclaimer: Opinions and recommendations in the paper are exclusively of the author(s) and
not of any other individual or institution including ICRIER. This paper has been prepared in
good faith on the basis of information available at the date of publication. All interactions and
transactions with industry sponsors and their representatives have been transparent and
conducted in an open, honest and independent manner as enshrined in ICRIER Memorandum
of Association. ICRIER does not accept any corporate funding that comes with a mandated
research area which is not in line with ICRIER’s research agenda. The corporate funding of
an ICRIER activity does not, in any way, imply ICRIER’s endorsement of the views of the
sponsoring organisation or its products or policies. ICRIER does not conduct research that is
focused on any specific product or service provided by the corporate sponsor.
1 The paper is based on the research undertaken by the authors at ICRIER during 2018.

1
Inclusive Growth in India – Learning from Best Practices of Selected Countries
Suresh Chand Aggarwal, Divya Satija and Shuheb Khan
1. Introduction
Globally, there is a clamour for creating a more inclusive world. Discontentment from existing
growth outcomes especially huge inequalities was evident in many protests starting with the
‘Occupy Wall Street Protests’ in 2011, which later on spread to many other countries. The rise
of protectionism and anti-globalisation leading to Brexit and similar right-wing sentiments in
few other countries is perhaps the expression of dissatisfaction towards existing growth
strategies being adopted across different countries. This is because some of these growth
strategies have resulted in high unemployment and huge disparities between countries and
within countries.
This shows that economic development requires sound foundations. Universal access to
education and health services, access to financial services, new technologies and affordable
bank loans, gender equality and more equal distribution of resources can all support economic
development. A stable and predictable operating environment is a prerequisite for public and
private sector investments. Good governance should be promoted and corruption tackled at all
levels in both private and public sectors. Hence, measuring the right issues matters.
The Sustainable Development Goals (SDGs) 2030 embody an international commitment to a
development agenda that is necessary for a peaceful world order. India along with other
countries signed the declaration on the 2030 Agenda for Sustainable Development, at the
Sustainable Development Summit of the United Nations in September 2015.2 Government of
India is fully committed to its resolve to achieve SDGs and their related targets by 2030. In
order to harmonise the national development priorities with international efforts a number of
policies, strategies, programmes / schemes and actions have been implemented at the national
level.
While India is still in the process of achieving its objectives, it is interesting to analyse how far
has it reached compared to other countries and what could be the right policy improvements
needed for achieving its target in terms of inclusive growth and sustainable development.
In this context, this paper is based on an analysis of India’s position in inclusive growth and
identification of specific policies that are expected to have a positive impact on both growth
and inequality, and can be the focus of policy action by India. The paper thus outlines the
definition, the need, and the challenges of inclusive growth in the next section. The fiscal policy
implications and need for specific policies for inclusive growth are highlighted in section 3.
The methodology to identify a host of policy and outcome indicators that could be used to
2 For details see UNGA Resolution Text, available at
http://www.un.org/ga/search/view_doc.asp?symbol=A/RES/70/1&Lang=E (last accessed November 9
2018)
2
measure status and pattern of inclusiveness in India and the selected countries3 - 9 developed
countries including Australia, Canada, France, Germany, Italy, Japan, Russia4, United
Kingdom (UK) and United States (US), and 8 developing countries including Argentina,
Brazil, China, Indonesia, Korea, Mexico, South Africa and Turkey on these indicators is
included in section 4. Analyse India’s position compared with these selected countries within
the domain of inclusive growth and sustainable development. Based on the status and pattern
of inclusive growth, section 5 presents a comparative picture of India’s position vis-à-vis the
selected countries and identify best practices from which India can learn and issues that India
might face. The opportunities and challenges which India faces in its quest for inclusive growth
are discussed in section 6. The section also spells out the successful government interventions
which have been adopted by different countries to improve inclusiveness. Finally, conclusion
and policy recommendations are part of section 7.
2. Definition of Inclusive Growth
To begin with, first important thing is to understand the meaning of inclusive growth. Globally
there is no universal definition of inclusive growth. It is defined differently by different sources
and there is no dearth of literature on inclusive growth.
The OECD defines inclusive growth as economic growth that creates opportunity for all
segments of the population and distributes the dividends of increased prosperity, both in
monetary and non-monetary terms, fairly across society.
The United Nations Development Programme’s (UNDP)5 perspective is based both an outcome
and process. Inclusive growth implies participation and benefit-sharing ensuring that while
everyone can participate in the growth process (both in decision-making and in participating in
growth) and benefits of growth are shared equally.
The UN SDGs, though do not directly mention about Inclusive growth but some of the targets
under these Goals, if achieved would help in moving towards inclusive growth. These include
- targets of removal of poverty by half by 2030 (Goal 1); ending hunger by 2030 (Goal 2);
reducing maternal mortality rates and infant mortality rates to fixed targets by 2030 (Goal 3);
completely free, equitable and quality primary and secondary education to all girls and boys
by 2030 (Goal 4); ensuring equal access for all women and men to affordable and quality
technical, vocational and tertiary education, including university by 2030 (Goal 4); sustained
per capita economic growth and reduction of youth unemployment(Goal 8); developing
quality, reliable, sustainable and resilient infrastructure, promoting inclusive and sustainable
industrialisation and, by 2030, significantly raise industry’s share of employment and gross
domestic product (GDP) (Goal 9); the promotion of shared prosperity in every society, the
latter being defined (for the purpose of statistical computation) as the promotion of growth of
3 UN (2018) 4 According to the UN (2018) classification, Russia is neither a developed nor a developing country and is
rather classified as an economy in transition. 5 For details see OECD, (2014), pp. 9
3
the per capita real income of the poorest 40 percent of each society; etc. These are some of the
targets in the direction of inclusive growth and are also some of the indicators used covered
in the Inclusive Growth index. This study also includes indicators that match with these
SDGs.
To summarise, inclusive growth is both a process and an outcome. As a process the focus is on
wider participation in the process of growth and as an outcome it concerns with benefit sharing-
removal of poverty and reducing income inequalities. Inclusive growth has become central
focal point of all policies, fiscal policy, monetary policy, trade policy, labour market policy,
price policy, etc., across the globe.
2.1 Need for Inclusive Growth
Inequalities in most part of the world have increased during the last three decades (Alvaredo
F. et. al. (2018)). Some of the plausible reasons are rapid growth in GDP, liberal and
expansionary fiscal policy, large public debt, rapid improvement in technology and the changes
in the nature of production using more capital, increasing share of services in GDP,
unfavourable policies and institutions, etc.
Beyond the rise of inequality, there have been other profound changes in labour markets over
recent decades. These arise from technological change, increased migration, ageing societies
in some countries and youth bulges in others, and shifting employment patterns. The direction
of these changes have unfortunately often drifted the economies away from inclusiveness and
social justice and these forces will also continue to evolve.
The new ‘disruptive’ technology and new global digital infrastructure has changed the face of
‘work’. Many existing jobs are vanishing and new ones are emerging. Rajan (2018) shared the
challenges of changing technology on the jobs and mentioned that robotics and automation
may impact many routine and skilled jobs. For India, Rajan cautioned that there is need to
move from routine and less productive work like agriculture and low productive industry and
services and seize the opportunity in other spaces in areas of exports, tech startups, etc.
Inequality in participation of women in the workforce is another important economic and social
issue. Overall, female labour force participation is an important driver of growth in any country
and even the SDGs have targeted to reduce this gender gap. The McKinsey Global Institute
(MGI) (2015), states that in a “full potential” scenario in which women play an identical role
in labour markets to that of men, as much as $28 trillion, or 26 per cent, could be added to
global annual GDP by 2025. India is expected to gain the maximum from parity in labour force
participation - complete parity would imply a 60 per cent increase in GDP by 20256.
6 Mckinsey and Company (2015), “The Power of Parity: How Advancing Women’s Equality can add $12
Trillion to the Global Growth” pp. 25, available at
https://www.mckinsey.com/globalthemes/employmentand-growth/how-advancing-womens-equality-can-
add-12-trillion-to-global-growth (last accessed December 15, 2017)
4
Questions have been raised about appropriate policies, which lead to ‘inclusiveness’ in an
economy and how these policies may be formulated to obtain the desired results. Some studies
have attempted to identify some approaches to inclusive growth, factors affecting inclusive
growth and possible policy options.
Anand, Tulin and Kumar (2014) examined the role of growth and distribution across Indian
States and concluded that developmental spending, in particular social sector spending are
closely linked to inclusive growth and poverty reduction. They also argued that robust
economic growth is imperative for strong government revenue growth and, as a result, for
ensuring adequate fiscal space for such expenditure.
Basu and Stiglitz (2016) brought into focus the debate about growth and poverty. They argued
that it is possible that growth may reduce poverty but the fact that despite long period of high
growth, 14.5 percent of the population in the World in 2011 still faced poverty, is a testimony
that growth has not been all inclusive and policies have to go beyond just promoting growth.
Mamgain and Verick (2017) pointed out that success of a future inclusive growth agenda would
depend on the strategy for promoting investment in employment potential sectors and ensuring
equal participation across various regions, gender and social groups and argues that public
investment on universal quality education and universal quality health care hold the key to
inclusive growth in India.
The ESCAP (2017), study highlighted that public finance – and tax policies in particular – are
vital for this purpose. Taxes provide the primary source of financing for public education,
healthcare and investment for the jobs. Taxes are also the financial backbone for social security
networks and basic welfare, providing essential support to poor people against unexpected risks
and preventing them from falling back into poverty during difficult times. Crucially,
progressive tax policies are central to fostering a fairer distribution of income and wealth. In
OECD countries, for instance, tax and transfers together bring down overall income inequality
by more than a third, on average.’
2.2. Challenges to Inclusive Growth
Some of the challenges include slow economic growth, technological development and job
displacement, etc. Since the financial crisis of 2008-09, the global economy has not fully
escaped recession. Overall, recovery has been fragile and uncertain, and this is reflected in
growing jobs deficits (deficits in terms of both the quantity and quality of new jobs) in many
countries.
With advancements of robotics and artificial intelligence, disruptions in labour markets are
likely to be huge. Workers’ skills set are likely to become obsolete at much faster pace. It is
estimated that between 400 million and 800 million individuals could be displaced by automation
and need to find new jobs by 2030 around the world (McKinsey, 2018). On the one hand, large

5
scale disruption in labour market is likely to occur; on the other hand concentration of wealth is
likely to increase.
Recent studies by International Labour Organisation7 and other international organisations
show that widening inequality is also associated with the declining share of total GDP that goes
to working people through their pay checks. In addition to unemployment and
underemployment, the significant slowdown in wage growth in most advanced and some
emerging countries is responsible for the decline in the labour share of national income, and
this feeds into overall household inequality and personal income inequality.
In the face of weak growth and disappointing employment creation, monetary policy
interventions have been extensive and even unprecedented in some cases. Of course, this has
also had spill over effects on other economies, with the emerging economies including India
benefiting from capital inflows, but now unfortunately suffering from capital outflows as the
end of monetary stimulus begins to appear on the horizon. Hence, there is a need to think of
different policy instruments to tackle the issue at hand.
3. Inclusive Growth and Fiscal Policy Implications
Fiscal tools available with government are important means to effectively improve
inclusiveness. Studies show that state fiscal policies can reduce inequality as well as aid
incomes of the poorest citizens. Evidence from OECD countries indicates that public spending
has a noticeably larger effect on inequality than taxation and other fiscal revenue policies,
although crucial resources required to spend come from revenue side. Among the different
components of public spending, transfers can significantly reduce inequality (Heshmat et al
2014).
With ever increasing role of governments in economic sphere, use of resources in efficient and
effective methods to achieve sustainable economic development has become the most
important aspect of public finance. Governments are under pressure to improve public sector
performance and at the same time contain expenditure growth. According to Tanzi (1997), to
achieve multiple objectives of stabilisation, growth and equity require not only reducing
expenditures, where necessary, but improving efficiency and composition of public
expenditures. This can be achieved by reducing unproductive expenditures while shifting
budgetary resources towards areas that support development of essential physical infrastructure
and human capital, including basic health and primary education (Tanzi, (1997)). Countries
have adopted various approaches to enhance efficiency of public sector like ‘increasing
devolution and decentralisation, strengthening competitive pressures, transforming workforce
structure, size, and human resource management arrangements, changing budget practices and
procedures, and introducing results-oriented approaches to budgeting and management’
(Curristine, (2007)).
7 For details see http://www.ilo.org/newdelhi/info/public/sp/WCMS_412430/lang--en/index.htm (last
accessed on December 20, 2017)

6
On the taxation side, widening of the tax base, plugging tax loopholes, fairly taxing rents from
natural resources, progressive taxation on income and wealth tax and property tax can be used
more effectively to generate more resources. In most of the developing countries, including
India, tax-GDP ratio is poor. In 2016-17, combined tax revenue of central and state government
in India was only 15.9 percent8. It lowers their ability to intervene effectively to improve
inclusiveness. The challenge before governments in these countries is to expand revenue
without stifling economic growth. Implementation of Goods and Services Tax (GST) is one
such example, done with the objective to collect higher tax revenue, which would give more
fiscal space to the government.
On the expenditure side, better targeting of social schemes and rationalisation of subsides is
required to make an impact. Government expenditure can be restructured and transformed into
effective instruments for reducing poverty, narrowing structural inequality, and promoting
environmentally sustainable growth (López et al., 2010). Governments are expected to use the
fiscal tools to minimise the painful adjustments and support the re-skilling programs of workers
to keep them employable.
3.1 Need for Specific Policies for Inclusive Growth
Making growth inclusive has become a global priority, by international organisations like the
OECD, the World Bank and the IMF. This change is triggered by the fact that the benefits of
growth have become concentrated in the hands of a wealthy few while the share of income
going to workers has fallen in most Western countries for more than a generation. Fewer than
10 percent of publicly traded companies account for over 80 percent of profits globally.9
However, the commonly adopted go-to policy response to the changing nature of work,
promoting skills-training and education, is increasingly becoming insufficient in today’s
changing times. In addition to educational opportunities, workers need higher minimum wages,
a strong collective voice, effective dispute-resolution mechanisms, health benefits, retirement
benefits, paid time off, and affordable, quality basic services (such as housing, child care,
transit and education). There is a need to shift the focus away from redistribution to changing
the “pre-distribution” on making the economy fairer to begin with.
Over the past the resulting geopolitical uncertainty, combined with the pressures of climate
change and population aging, has slowed growth globally. In an environment of slow growth,
the dangers of rising inequality have become more apparent. Notably, instead of democratising
the economy, the rise of new technology and the “gig economy” are threatening to worsen
8 For details see Economic Survey 2017-18, Volume I, available at
http://mofapp.nic.in:8080/economicsurvey/pdf/001-031_Chapter_01_ENGLISH_Vol_01_2017-18.pdf (last
accessed March 27, 2018) 9 For details see http://www.policynote.ca/wp-content/uploads/2017/11/Yalnizyan_RosenbluthLecture
_Nov2_2017.pdf (last accessed on December 25, 2017)

7
inequality by further increasing corporate concentration and reducing bargaining power for
workers. Hence, there is need to develop an inclusive growth model.10
4. Methodology
This paper presents policy and outcome indicators of inclusive growth across India and the
selected countries. These countries have been identified because India’s growth trajectory is
similar to some developing countries like China and India is facing challenges similar to those
faced by countries like Indonesia and Argentina. Other developed countries are included so
that India can learn from their best practices and because they have a strong presence in several
international forums like the UN and G20, etc., India can develop synergies with them. By
learning from their best practices it is expected that India can align its international agenda,
and develop policies and cooperation. Accordingly, the following methodology has been used:
1. To draw a comparative analysis of India’s position vis-à-vis these countries, an empirical
framework representing the status of inclusiveness across these countries is presented using
the following methodology:
a. A list of indicators for developing a framework for inclusive growth are identified based
on an analyses of different sources including World Economic Forum’s (WEF)
‘Inclusive Growth Index’, (WEF (2017), Inclusive Development Index framework,
Asian Development Bank Framework of Inclusive Index (ADB, 2010), Fostering
Inclusive Growth Framework (IMF, 2017), Inclusive Growth Framework (OECD,
2014), and from UN Sustainable Development Goals (SDGs) (UN (2017)).
b. The framework using indicators for inclusive growth is developed on the basis of the
WEF’s inclusive growth framework presented in the ‘Inclusive Growth Index’, (WEF
(2017)
i. These indicators are grouped into sub-pillars and pillars of inclusive growth and a
value / score and rank for each pillar and sub-pillar is calculated using the following
methodology: The value for each indicator is either a score, which is perception
based and is on a scale of 1 to 7 (worst to best) or is a quantitative value.
ii. In the case where data for a particular indicator is presented in terms of quantity,
the quantitative values are converted into scores to make them comparable across
the board. The normalisation formula is applied, which is based on a linear min-
max transformation, and preserves the order of, and the relative distance between
country scores. The equation used is:
6* (𝑐𝑜𝑢𝑛𝑡𝑟𝑦 𝑠𝑐𝑜𝑟𝑒−𝑠𝑎𝑚𝑝𝑙𝑒 𝑚𝑖𝑛𝑖𝑚𝑢𝑚)
(𝑠𝑎𝑚𝑝𝑙𝑒 𝑚𝑎𝑥 −𝑠𝑎𝑚𝑝𝑙𝑒 𝑚𝑖𝑛) +1
The sample minimum and sample maximum are, respectively, the lowest and
highest country scores of the indicator among the economies covered. For those
10 For details see http://www.policynote.ca/armine2017/ (last accessed on December 25, 2017)

8
indicators where a higher value indicates a worse outcome (1 to 7 is from best to
worst), the transformation formula used is:
- 6* (𝑐𝑜𝑢𝑛𝑡𝑟𝑦 𝑠𝑐𝑜𝑟𝑒−𝑠𝑎𝑚𝑝𝑙𝑒 𝑚𝑖𝑛𝑖𝑚𝑢𝑚)
(𝑠𝑎𝑚𝑝𝑙𝑒 𝑚𝑎𝑥 −𝑠𝑎𝑚𝑝𝑙𝑒 𝑚𝑖𝑛) +7
iii. Adjustments are made to account for extreme outliers using the Winsorisation
technique, in which the extreme values are replaced by the succeeding (for lower
values) or the preceding (for high values) value
iv. After the transformation, the average of all the indicators within a sub-pillar was
calculated to find the score of the sub-pillar,
v. Then, average of the sub-pillars is calculated to find the score of the pillar. The
overall score of the inclusive index is the average of the scores of pillars. All scores
are presented on a scale of 1-7.
vi. Finally, sub-pillars and pillars of a country within the group of selected countries
are ranked for comparability. Ranking of indicators is obtained to find the relative
status of each country on these indicators.
2. A framework for inclusive growth is developed for the selected countries including India,
based on which a strategy for inclusive growth is presented.
3. Identified challenges and common issues related to inclusive growth across these countries
and have developed policy recommendations that have both domestic and international
implications for India.
The study is based on an in-depth secondary information analysis. The indicators used for the
empirical analysis are detailed in Appendix A1. The data on these indicators has been obtained
from different sources including the World Economic Forum, World Development Indicators,
the World Bank, ILOSTAT and OECD.
5. Status and Pattern of Inclusive Growth
Inclusiveness requires that each country identifies its own areas of strength where it has a
competitive advantage. This needs to be further developed not only to boost gross domestic
product (GDP) growth but also to create more employment opportunities to absorb the labour
force by using suitable technology for reducing mass poverty and widespread inequality. In
addition, focus should be on designing effective tools for redistribution, such as fiscal policy
measures. Countries must try to achieve sustainable inclusive growth by incorporating four
points in public policy: opportunity, capability, access and security. The system of
accountability, check and balance in the delivery system must be incorporated to pave the way
for equal opportunities and shared prosperity for all irrespective of caste, class, gender and
regions.
In view of its importance and significance, attention has been paid on the question of how do
we define and measure inclusiveness and what are its determinants. There are so many
dimensions to the concept of inclusiveness; it is very difficult to identify the complete list of
all the indicators and the choice of the set of indicators may influence the overall and
9
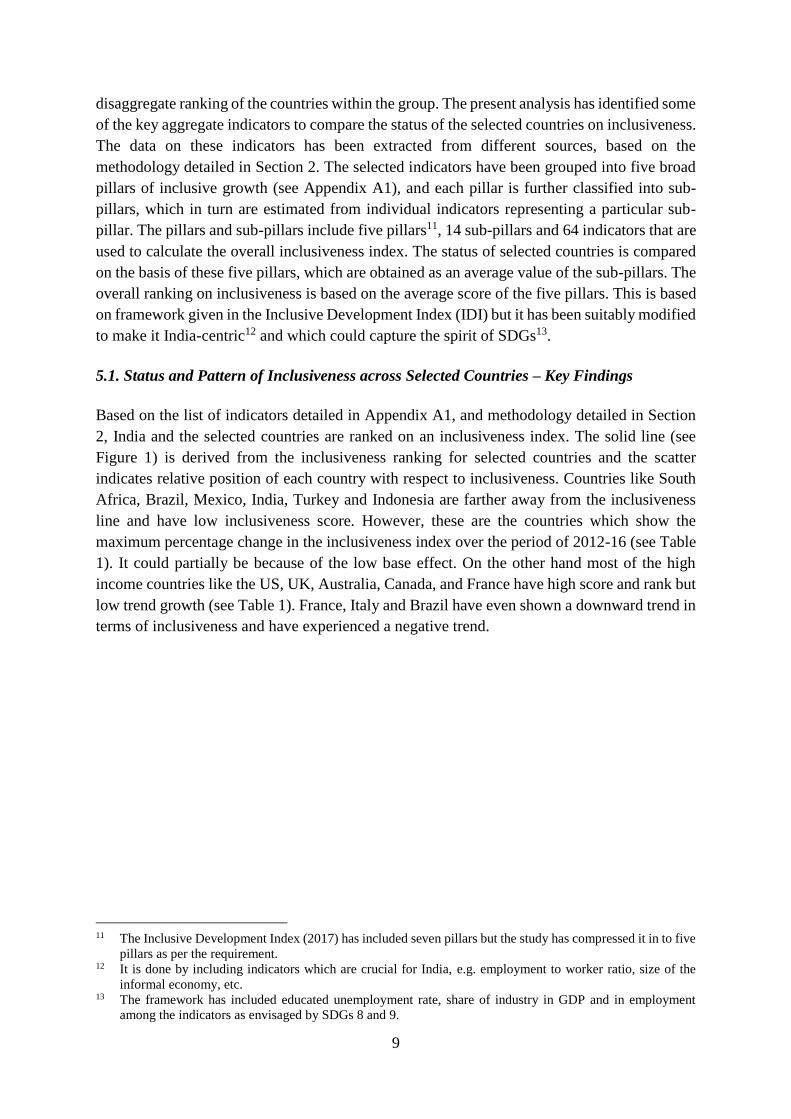
disaggregate ranking of the countries within the group. The present analysis has identified some
of the key aggregate indicators to compare the status of the selected countries on inclusiveness.
The data on these indicators has been extracted from different sources, based on the
methodology detailed in Section 2. The selected indicators have been grouped into five broad
pillars of inclusive growth (see Appendix A1), and each pillar is further classified into sub-
pillars, which in turn are estimated from individual indicators representing a particular sub-
pillar. The pillars and sub-pillars include five pillars11, 14 sub-pillars and 64 indicators that are
used to calculate the overall inclusiveness index. The status of selected countries is compared
on the basis of these five pillars, which are obtained as an average value of the sub-pillars. The
overall ranking on inclusiveness is based on the average score of the five pillars. This is based
on framework given in the Inclusive Development Index (IDI) but it has been suitably modified
to make it India-centric12 and which could capture the spirit of SDGs13.
5.1. Status and Pattern of Inclusiveness across Selected Countries – Key Findings
Based on the list of indicators detailed in Appendix A1, and methodology detailed in Section
2, India and the selected countries are ranked on an inclusiveness index. The solid line (see
Figure 1) is derived from the inclusiveness ranking for selected countries and the scatter
indicates relative position of each country with respect to inclusiveness. Countries like South
Africa, Brazil, Mexico, India, Turkey and Indonesia are farther away from the inclusiveness
line and have low inclusiveness score. However, these are the countries which show the
maximum percentage change in the inclusiveness index over the period of 2012-16 (see Table
1). It could partially be because of the low base effect. On the other hand most of the high
income countries like the US, UK, Australia, Canada, and France have high score and rank but
low trend growth (see Table 1). France, Italy and Brazil have even shown a downward trend in
terms of inclusiveness and have experienced a negative trend.
11 The Inclusive Development Index (2017) has included seven pillars but the study has compressed it in to five
pillars as per the requirement. 12 It is done by including indicators which are crucial for India, e.g. employment to worker ratio, size of the
informal economy, etc. 13 The framework has included educated unemployment rate, share of industry in GDP and in employment
among the indicators as envisaged by SDGs 8 and 9.

10
Figure 1: Status of Inclusiveness across Selected Countries
Source: Based on Authors’ calculations, using data extracted from The Inclusive Growth and
Development Report (2017), World Economic Forum, and others.
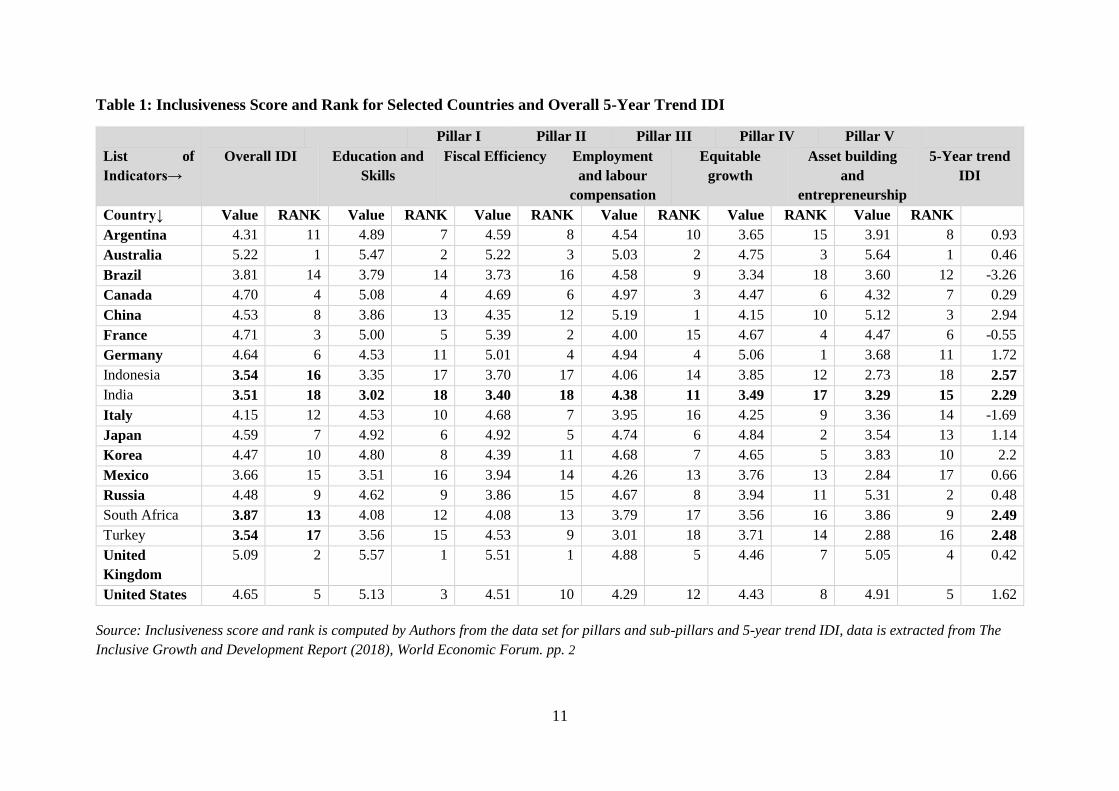
Inclusiveness rank of the selected countries across the selected pillars is shown in Table1. The
results show that overall inclusive index rank of a country is influenced by its rank on all the
five pillars and may be relatively high/low just because of high/low rank on any one or two of
the pillars (such as in the case of France, China, etc.) but it is the consistency, rather than
skewed performance which is important. While Australia, Germany, Canada, UK and Japan
are more inclusive economies on the parameters, US’s lower rank is because of low rank on
fiscal efficiency and employment and labour compensation pillars. As expected, while all
developed economies are in the top of the rankings, other emerging economies have relatively
lower ranks, with China at 8; Argentina at 11; Mexico at 15; Brazil at 14; South Africa at 13;
Turkey at 17; Indonesia at 16; and India at the bottom at 18. Even among the BRICS countries,
India is the least inclusive economy and thus is a matter of great concern. While South Africa’s
and Brazil’s performance is comparatively uniform on most of the pillars, China, because of a
different political system have done well on employment and skill pillar (mainly because of
very high worker population ratio and low dependency ratio) and on asset building pillar, and
therefore score an overall higher rank on inclusive growth.
0.00
1.00
2.00
3.00
4.00
5.00
6.000
2
4
6
8
10
12
14
16
18
20
RANK
Value
11
Table 1: Inclusiveness Score and Rank for Selected Countries and Overall 5-Year Trend IDI
Pillar I Pillar II Pillar III Pillar IV Pillar V
List of
Indicators→
Overall IDI Education and
Skills
Fiscal Efficiency Employment
and labour
compensation
Equitable
growth
Asset building
and
entrepreneurship
5-Year trend
IDI
Country↓ Value RANK Value RANK Value RANK Value RANK Value RANK Value RANK
Argentina 4.31 11 4.89 7 4.59 8 4.54 10 3.65 15 3.91 8 0.93
Australia 5.22 1 5.47 2 5.22 3 5.03 2 4.75 3 5.64 1 0.46
Brazil 3.81 14 3.79 14 3.73 16 4.58 9 3.34 18 3.60 12 -3.26
Canada 4.70 4 5.08 4 4.69 6 4.97 3 4.47 6 4.32 7 0.29
China 4.53 8 3.86 13 4.35 12 5.19 1 4.15 10 5.12 3 2.94
France 4.71 3 5.00 5 5.39 2 4.00 15 4.67 4 4.47 6 -0.55
Germany 4.64 6 4.53 11 5.01 4 4.94 4 5.06 1 3.68 11 1.72
Indonesia 3.54 16 3.35 17 3.70 17 4.06 14 3.85 12 2.73 18 2.57
India 3.51 18 3.02 18 3.40 18 4.38 11 3.49 17 3.29 15 2.29
Italy 4.15 12 4.53 10 4.68 7 3.95 16 4.25 9 3.36 14 -1.69
Japan 4.59 7 4.92 6 4.92 5 4.74 6 4.84 2 3.54 13 1.14
Korea 4.47 10 4.80 8 4.39 11 4.68 7 4.65 5 3.83 10 2.2
Mexico 3.66 15 3.51 16 3.94 14 4.26 13 3.76 13 2.84 17 0.66
Russia 4.48 9 4.62 9 3.86 15 4.67 8 3.94 11 5.31 2 0.48
South Africa 3.87 13 4.08 12 4.08 13 3.79 17 3.56 16 3.86 9 2.49
Turkey 3.54 17 3.56 15 4.53 9 3.01 18 3.71 14 2.88 16 2.48
United
Kingdom
5.09 2 5.57 1 5.51 1 4.88 5 4.46 7 5.05 4 0.42
United States 4.65 5 5.13 3 4.51 10 4.29 12 4.43 8 4.91 5 1.62
Source: Inclusiveness score and rank is computed by Authors from the data set for pillars and sub-pillars and 5-year trend IDI, data is extracted from The
Inclusive Growth and Development Report (2018), World Economic Forum. pp. 2

12
It is observed that the relationship of pillar I - education and skills with overall inclusive growth
index is strongest with the correlation being 0.91. Within the education pillar, it is access to
education, which has the highest implications for inclusive growth. It could mean that it is first
the access which is important and in its absence, the quality and digital literacy-the other two
sub-pillars may not have much meaning for inclusiveness. So a country like India which still
has limited access to education should first focus on it before it spends its limited resources on
quality and digital literacy. Equitable growth pillar also has a correlation of 0.80 with overall
inclusive growth. Pillar 5 of asset building and entrepreneurship is also important for inclusive
growth as it has a high correlation of 0.78, with the sub-pillar ‘small business ownership’ being
predominant with a correlation of 0.85. It thus indicates that promoting small business would
help in achieving the goal of inclusiveness.
For few of the selected countries it has been possible to have a relatively higher rank on
inclusiveness due to large size of the government, which made it possible and easy for these
economies to spend a higher proportion of their GDP for infrastructure and social protection
(correlation between inclusiveness and fiscal efficiency being 0.76). Both India and China
though have consistently high growth rates in GDP per capita but the level of GDP per capita
is still at the lower end of selected countries because of large population base. They also have
relatively high poverty rates despite pulling millions out of poverty in last 2-3 decades. India,
however is almost at the bottom on access to health (rank 14 out of 18 selected countries) and
education scores (18th /18 rank). It is also evident by India’s low rank on Human Capital index
(34 for China and 103 for India out of 130 countries as reported by The Global Human Capital
Report (2017). India also has lower rank than China on inequality, as revealed by the World
Inequality Report (2018) by showing that the share of top 1 percent of the population in national
income in India has witnessed a sharper increase during the period 1980 - 2015 than in China.
While in India it increased from around 7 percent to 22 percent, in China it increased from 6
percent to 14 percent only14.
In addition, to encapsulate the the progress these countries have made over a period of time in
terms of inclusiveness, a five-year (between 2012 and 2016) trend overall IDI (using indicators
available during both the years) is given in Table 1 Countries with lower inclusiveness score
including India, South Africa, Turkey and Indonesia, have reported the highest 5-year trend
averages compared to other selected countries. Hence, while overall IDI of these countrie at a
given point in time compared to other selected countries, especially the advanced economies,
is lower, but their 5-year trend average is higher indicating that these countries have been taking
substantial measures towards attaining greater inclusiveness. Particularly in the case of India,
its score is the highest for ‘employment and labour compensation’, followed by ‘equitable
growth’ (see Table 1). It thus shows that India has to do lot of catching up on other parameter.
14 World Inequality Report (2018), pp 296

13
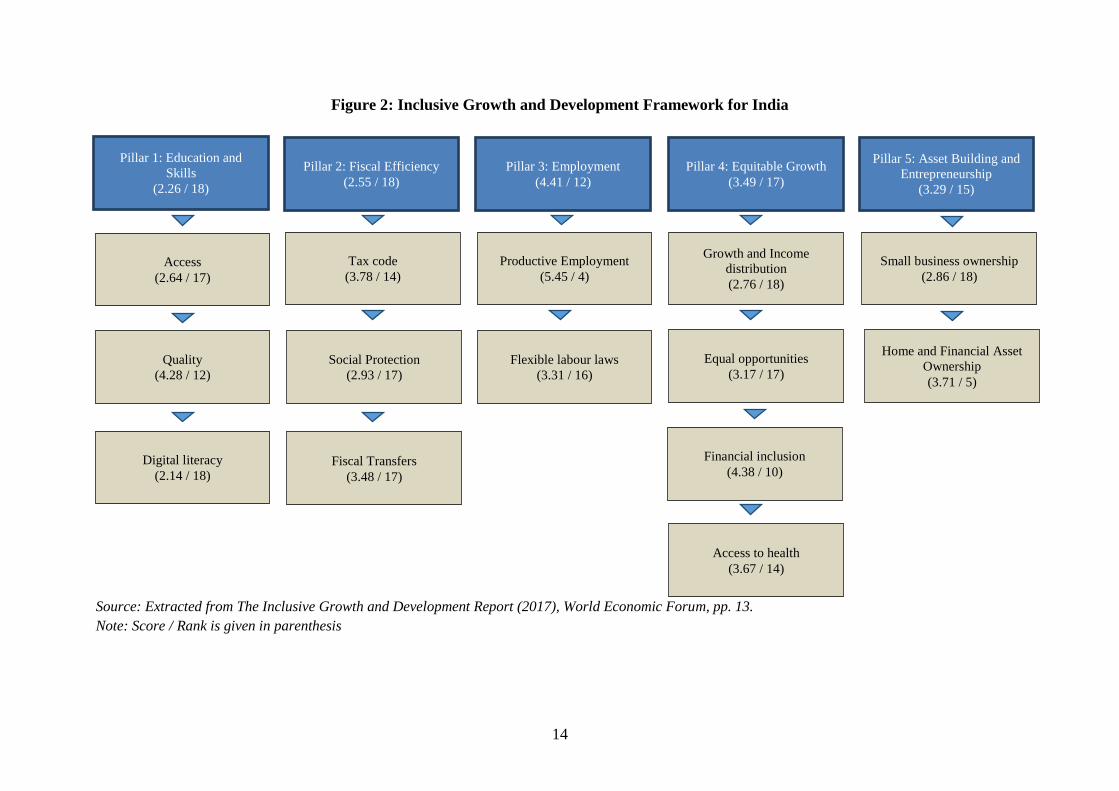
Based on the WEF framework for achieving inclusive growth, a framework has been compiled
for India (see Figure 2). The policy and institutional domains portrayed in this framework
represent the ecosystem of structural policy, incentives and institutions that together and as part
of the growth process help to diffuse the benefits of inclusive growth. Structural reforms
include measures aimed at boosting economic efficiency and macroeconomic stability by
sharpening market signals and improving the health of public finances. India has unexploited
potential to simultaneously increase economic growth and social equity and effective policy
measures and reforms can help in attaining this objective. A more detailed analysis at sub-pillar
level of disaggregation shows that (see Figure 2), India’s score is significant for sub-pillars
including productive employment, financial inclusion, quality of education, tax code and home
and financial asset ownership. But there a few indicators access to education, digital literacy,
social protection, growth and income distribution, and small business ownership where the
score is very low and lot of catching up is to be done.
Within this framework, India’s score and rank across each of the selected pillars and sub-pillars
indicates India’s position vis-à-vis other selected countries. Among them, India’s rank is
highest for ‘productive employment’ at number ‘4’ (see Figure 2). Clearly there are many areas
where India needs to up its relative score. For this concerted efforts are needed in expansion
and improving the quality of services provided.
Most countries today share similar challenges in achieving the objective of inclusive growth
and are introducing structural, fiscal and monetary policies. While developing countries are
focussing more on expansion and quality of services, developed countries’ focus is on the
delivery of services. India can learn from their best practices adopted by these countries, in
designing and implementing suitable country-specific policies. For instance, countries like
Argentina, Indonesia, Brazil and Japan, have introduced policies that promote inclusive growth
in terms of productive employment, equity, promoting innovation and entrepreneurship and
social protection. Despite low per capita income, countries like Argentina and Indonesia have
been achieving success in achieving the basic tenets of inclusive growth including growth,
participation and redistribution across the economy. They have achieved this through reforms
to create jobs and other structural reforms and fiscal policy reforms. In 2017, Argentina and
Indonesia introduced certain structural, fiscal and monetary policies as a part of their respective
growth strategy (see Boxes 1 and 2). India can possibly learn from these countries and develop
measures that will facilitate inclusive growth.
14
Figure 2: Inclusive Growth and Development Framework for India
Source: Extracted from The Inclusive Growth and Development Report (2017), World Economic Forum, pp. 13.
Note: Score / Rank is given in parenthesis
Pillar 1: Education and
Skills
(2.26 / 18)
Pillar 2: Fiscal Efficiency
(2.55 / 18)
Pillar 3: Employment
(4.41 / 12)
Pillar 4: Equitable Growth
(3.49 / 17)
Pillar 5: Asset Building and
Entrepreneurship
(3.29 / 15)
Access
(2.64 / 17)
Quality
(4.28 / 12)
Tax code
(3.78 / 14)
Productive Employment
(5.45 / 4)
Growth and Income
distribution
(2.76 / 18)
Small business ownership
(2.86 / 18)
Social Protection
(2.93 / 17)
Flexible labour laws
(3.31 / 16)
Equal opportunities
(3.17 / 17)
Home and Financial Asset
Ownership
(3.71 / 5)
Digital literacy
(2.14 / 18)
Financial inclusion
(4.38 / 10)
Access to health
(3.67 / 14)
Fiscal Transfers
(3.48 / 17)

15
Box 1: Policies adopted by Argentina
Focus is on inclusive and sustainable growth
Fiscal policy:
Greater investment in infrastructure (through
public-private partnerships (PPP)) (to reduce
primary deficit, increase productivity and
increase output, and stronger GDP
Tax amnesty programs (taxpayers to report
undeclared assets and income)
Reduction of burden on low income households
and pensioners (15% percentage point VAT
refund)
Expansion of social security schemes (social
services to account for 64% of total public
expenditure and 15% of GDP)
Structural reforms:
Enhancing transparency in public accounts
(National Open Data portal set up)
Greater awareness about public policies through
communication programs
Greater investments in sectors such as renewable
energy (to ensure long-term sustainable
development)
Education sector reforms – expansion of
universal child care allowance limit; public
systems to be offered to children of the age 3 and
above and new kindergartens to be opened
Monetary policy and Financial sector reforms
Policies to reduce inflation (absorb excess
liquidity and clearly communicate intentions
behind the monetary policy to public)
Free-floating exchange rate
Increase in level of international reserves
Encourage deposits
Ensure long-term credit supply in the market
Improve efficiency of financial and payments
system
Box 2: Policies adopted by Indonesia
Focus is on promoting growth and enhancement of
people’s welfare supported by sustainable growth,
resilient economic sector, inclusive economic
development, and macroeconomic and financial
stability.
Fiscal policy
Tax amnesty program
Tax reforms will continue in both tax
administration and tax policy
Optimizing revenue and reduce budget deficit
and debt ratio
Enhancing fiscal transparency by exempting tax
authority from bank and financial secrecy laws
Monetary policy:
Reduce inflation
mitigating systemic risks and enhancing macro-
surveillance to better assess of the potential risks
promote efficient payment transactions,
implementing clean-money policies, as well as
supporting financial inclusion
Channelling Ultra Micro Credit Program for
Small Micro Enterprises through Non-Bank
Financial Institutions
Structural reforms
Increasing competition through national logistic
improvement
Earmarking 25% of General Transfer Fund
(Dana Transfer Umum) for infrastructure
spending in the region
Source: G20 Growth Strategy Indonesia (2017) Source: G20 Growth Strategy Argentina (2017)

16
Overall a conducive environment is needed to achieve a broad-based impact on the economy.
In achieving inclusive growth, a variety of stakeholders have a role to play, but the key player
is government (see Figure 3). Governments play a key role in enabling all actors to pursue
inclusive business and operating models and integrate those at the bottom of the pyramid into
their core strategies and operations. A conducive enabling environment and a well-functioning
financial infrastructure provided by governments can help other stakeholders to effectively
contribute to inclusive growth.
Figure 3: Key Contributors and Pillars towards achieving Inclusive Growth
Source: Extracted from G20 (2015), pp. 7.
From the above discussion we can conclude that in case of India, focus has to be on all the five
pillars to achieve inclusive growth. While these are just the outcomes, it is important to devise
Asset building & Entrepreneurship
Equitable
Growth
Employment
Fiscal Efficiency
Education & Skills
Indian
Government
INCLUSIVENES
S
G20
Member
Countries
Industry
Financial
Institutions
Research
Organisations
Multilateral
Development
Banks
Individuals
Not for profit
Organisations
International
Development
Partners
Intermediaries
Contributors
Media
17
a strategy to ensure that there is growth in the economy, as that will facilitate the expansion of
services and improvement of quality of services.
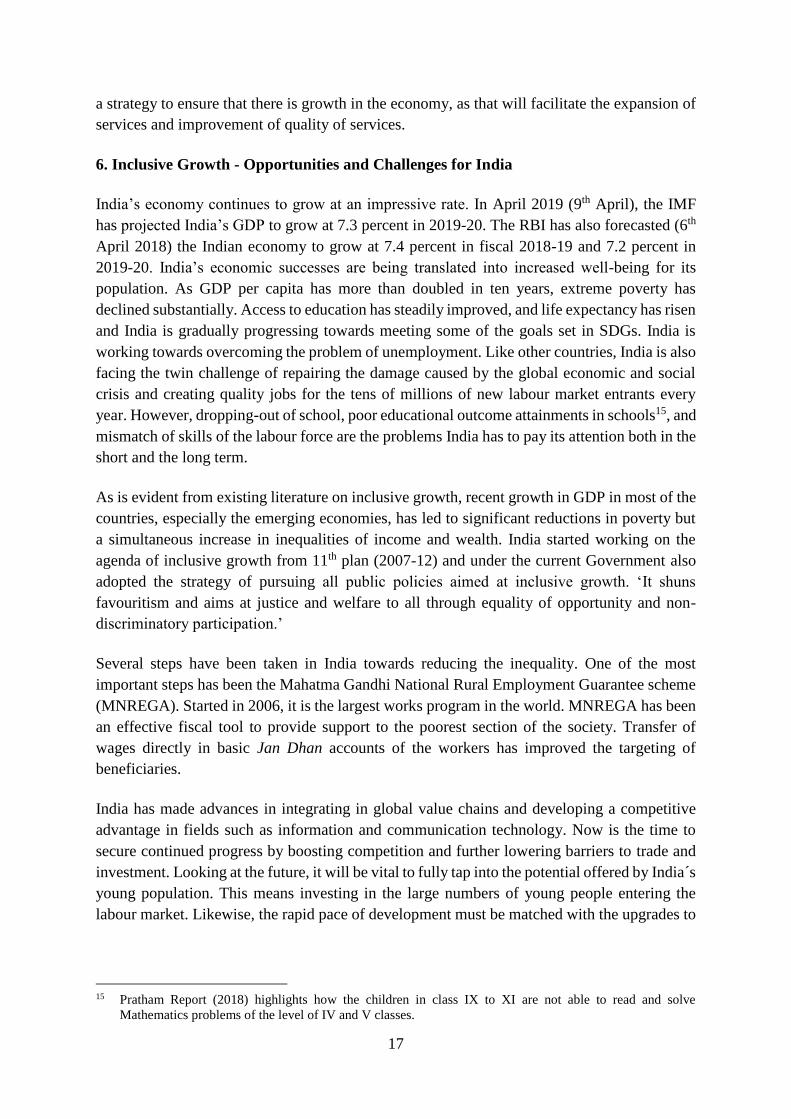
6. Inclusive Growth - Opportunities and Challenges for India
India’s economy continues to grow at an impressive rate. In April 2019 (9th April), the IMF
has projected India’s GDP to grow at 7.3 percent in 2019-20. The RBI has also forecasted (6th
April 2018) the Indian economy to grow at 7.4 percent in fiscal 2018-19 and 7.2 percent in
2019-20. India’s economic successes are being translated into increased well-being for its
population. As GDP per capita has more than doubled in ten years, extreme poverty has
declined substantially. Access to education has steadily improved, and life expectancy has risen
and India is gradually progressing towards meeting some of the goals set in SDGs. India is
working towards overcoming the problem of unemployment. Like other countries, India is also
facing the twin challenge of repairing the damage caused by the global economic and social
crisis and creating quality jobs for the tens of millions of new labour market entrants every
year. However, dropping-out of school, poor educational outcome attainments in schools15, and
mismatch of skills of the labour force are the problems India has to pay its attention both in the
short and the long term.
As is evident from existing literature on inclusive growth, recent growth in GDP in most of the
countries, especially the emerging economies, has led to significant reductions in poverty but
a simultaneous increase in inequalities of income and wealth. India started working on the
agenda of inclusive growth from 11th plan (2007-12) and under the current Government also
adopted the strategy of pursuing all public policies aimed at inclusive growth. ‘It shuns
favouritism and aims at justice and welfare to all through equality of opportunity and non-
discriminatory participation.’
Several steps have been taken in India towards reducing the inequality. One of the most
important steps has been the Mahatma Gandhi National Rural Employment Guarantee scheme
(MNREGA). Started in 2006, it is the largest works program in the world. MNREGA has been
an effective fiscal tool to provide support to the poorest section of the society. Transfer of
wages directly in basic Jan Dhan accounts of the workers has improved the targeting of
beneficiaries.
India has made advances in integrating in global value chains and developing a competitive
advantage in fields such as information and communication technology. Now is the time to
secure continued progress by boosting competition and further lowering barriers to trade and
investment. Looking at the future, it will be vital to fully tap into the potential offered by India´s
young population. This means investing in the large numbers of young people entering the
labour market. Likewise, the rapid pace of development must be matched with the upgrades to
15 Pratham Report (2018) highlights how the children in class IX to XI are not able to read and solve
Mathematics problems of the level of IV and V classes.

18
infrastructure necessary to support it. Multiple opportunities present themselves for India, and
the right mix of policies is needed to take advantage of them.
Reducing the size of the informal economy is pivotal to inclusive growth and that is one of the
focus areas of the current government. Recent reform initiatives in India are preparing the
ground for greater inclusion. The biometric-based unique identification system, Aadhaar now
ensures that the poor are no longer invisible and, therefore, more empowered. A bank account
for every adult now ensures universal access to financial services. When combined with
Aadhaar, such access will accelerate financial inclusion.
The government and private sector both have imperative roles in driving inclusive growth. In
India, governments have introduced many projects and schemes for affordable housing, skill
development, and improved access to education, financial inclusion, encouraging start-ups and
innovations, among others. Some of these include Pradhan Mantri Jan Dhan Yojna, Pradhan
Mantri Jeevan Jyoti Bima Yojana, Pradhan Mantri Suraksha Bima Yojana, Sukanya Samriddhi
Yojana, Beti Bachao-Beti Padhao Scheme, all helping to promote inclusive growth. In
addition, in 2015, the National Skill Mission was launched under the Skill India initiative. It
has been launched to empower the youth of the country with skill sets which make them more
employable and more productive in their work environment. The private sector has started
contributing with initiatives, such as the ICICI Foundation having been established with the
purpose of promoting inclusive growth.
Government’s targeted policies like the ‘Digital India’ and ‘Make in India’ campaigns have
taken the agenda for inclusive growth to a higher level. To weed out black money and
corruption from public life, Government has been leveraging digital transaction ecosystem.
Majority of government agencies have now adopted a digital infrastructure and a digital way
of transacting to ensure inclusive growth. ‘Digital India’ consists of three core components of
creation of digital infrastructure, delivery of services digitally and digital literacy. ‘Digital
India’ is not only transforming India but also helping to achieve the United Nations Sustainable
Development Goals Agenda 2030. ‘Digital India’ is giving thrust to affordable devices, internet
access and digital literacy and financial inclusion is expanding. Government is enabling fintech
innovation and is actively investing in internet infrastructure. In addition, public-private-
partnership models for infrastructure expansion, cross-sectoral knowledge sharing and
technology transfers are being encouraged. National Digital Literacy Mission also called
Digital Saksharta Abhiyan has been initiated with the vision to make at least one person in
every family digitally literate with digital literacy skills by 2020 and provide digital literacy to
60 million rural households, including Anganwadi and Asha workers and authorized ration
dealers across the country.
India is working towards a comprehensive tax reform that would promote inclusive growth.
The shock of demonetisation to curtail black money, the introduction of the new national GST
and steps taken to curb benami transactions, are expected to gradually expand India’s tax base
and eliminate incentives for businesses to operate in the shadow of the formal economy.
Besides the government is taking steps to make tax policy making more robust and have

19
established the Tax Policy Research Unit and Tax Policy Council for the same. Reforms in the
direct tax structure are also on the anvil and an expert committee has been constituted to give
its recommendations. Some of these reforms would also help India in its Ease of Doing
Business ranking.
To address the ‘twin balance sheet challenge’ faced by India’s banking sector, government has
introduced recapitalisation reforms in the banking sector and amended the Bankruptcy Law.
Recently, fixed-term employment16 has been extended to all sectors to boost ease of business.
The Cabinet has also approved the Implementation of Universal Health Coverage Plan – also
known popularly as ‘Modi Care’ to extend the benefits of health insurance to the masses of
India.
While these and more steps have been taken in the direction of inclusive growth, India needs
an inclusive growth development agenda to achieve its short term and long term goals. This
agenda should be more comprehensive and should set the tone for government’s strategies for
all sectors of the economy. Based on the experience of other countries and research by scholars,
some of the policies which India might have to adopt to further improve its inclusiveness score
and rank are summarised.
Macroeconomic stability, human capital and structural changes are found to be key
determinants of inclusive growth in emerging markets. Macro-financial stability, with
particular attention to inflation risks, is also critical for promoting inclusive growth. Targeting
inflation, through its impact on purchasing power is supposed to be helpful in reducing poverty.
Social expenditures, spending on education and skill development and educational attainment
rates are also important for fostering inclusive growth. Attention also has to be paid to the
specific policies aimed at addressing the problems of different sectors of the economy.
Among other instruments, existing literature shows that effective fiscal policy plays an
important role in promoting growth and equity. An efficient tax system should not only be
simple but equitable and should satisfy the canons of taxation. It should also provide enough
incentives for everyone to participate in the process of growth. Expenditure policy should not
only facilitate expansion of infrastructure but help in the provision of decent standard of living
to the citizens through access to health, education, social and income security, among others.
In this context, the next sub-sections discuss the status of India relative to the selected countries
on these key social infrastructure-health, education and social security.
6.1. Public Expenditure on Health
High incidence of market failures in the health sector and desire to provide health care to every
individual has motivated extensive government involvement in this sector in advanced and
16 The facility for hiring on fixed term contract was initially available only for the apparel manufacturing sector
as per the Industrial Establishment (Standing Order) 1946. According to the notification to amend the order,
words “fixed-term employment in apparel manufacturing sector” will be replaced by “fixed-term
employment” meaning that facility would be available for all sectors.

20
emerging economies17. In developed countries, public health services provided either directly
or indirectly (through insurance) have a wide coverage and out of pocket expenses are
significantly low.
Compared to other selected countries, public expenditure on health in India is quite
significantly low. India spends around one percent of its GDP on public health. Out of pocket
expenses are quite high and low public expenditure on health is one of the main reasons behind
this trend. Only 30 percent of the total health spending comes from public spending and more
than 60 percent is accounted by out of pocket expense (see Table 2). Government expenditure
on health in India is largely on providing direct health care to patients. High cost of healthcare
is a major hurdle for the poor in accessing proper healthcare. To overcome this problem
government has launched the ‘Ayushman Bharat National Health Protection Mission’ to cover
over 10 crore poor and vulnerable families (approximately 50 crore beneficiaries) providing
coverage upto 5 lakh rupees per family per year for secondary and tertiary care
hospitalisation18. This Mission is expected to have a major impact on reduction of Out of
Pocket expenditure, increased access to quality health and medication. In addition, the unmet
needs of the population which remained hidden due to lack of financial resources shall be
catered to.19
Table 2: Expenditure on Health across Selected Countries (2014)
Total Public Out of
External
Resources
Per Capita Per Capita
Country % of
GDP
% of
total
% of
total
% of
total
$ 2011 PPP
$
Argentina 4.8 55.4 30.7 0.8 605 1,137
Australia 9.4 67 18.8 .. 6,031 4,357
Brazil 8.3 46 25.5 0.1 947 1,318
Canada 10.4 70.9 13.6 .. 5,292 4,641
China 5.5 55.8 32 0 420 731
France 11.5 78.2 6.3 .. 4,959 4,508
Germany 11.3 77 13.2 .. 5,411 5,182
India 4.7 30 62.4 1 75 267
Indonesia 2.8 37.8 46.9 1.1 99 299
Italy 9.2 75.6 21.2 .. 3,258 3,239
Japan 10.2 83.6 13.9 .. 3,703 3,727
Korea, Rep. 7.4 54.1 36.1 .. 2,060 2,531
Mexico 6.3 51.8 44 0.4 677 1,122
Russian
Federation
7.1 52.2 45.8 .. 893 1,836
17 For details see https://www.imf.org/external/np/pp/eng/2010/122810.pdf (last accessed March 27, 2018) 18 For details see http://www.indiabudget.gov.in/ub2018-19/bs/bs.pdf (last accessed February 12, 2018) 19 For details see https://www.india.gov.in/spotlight/ayushman-bharat-national-health-protection-mission (last
accessed April 4, 2019)

21
Total Public Out of
External
Resources
Per Capita Per Capita
Country % of
GDP
% of
total
% of
total
% of
total
$ 2011 PPP
$
Saudi Arabia 4.7 74.5 14.3 0 1,147 2,466
South Africa 8.8 48.2 6.5 1.8 570 1,148
United Kingdom 9.1 83.1 9.7 .. 3,935 3,377
United States 17.1 48.3 11 .. 9,403 9,403
Source: World Economic Indicators Data Base available at https://data.worldbank.org/indicator
Due to low government expenditure and lax regulatory environment, healthcare service
providers in the private sector have multiplied. Privatisation of health care creates affordability
problem and is considered one of the biggest impediment in creating an inclusive society.
Government of India (2014) states that, ‘incidence of catastrophic expenditure due to health
care costs is growing and is now being estimated to be one of the major contributors to poverty.
The drain on family incomes due to health care costs can neutralise the gains of income
increases and every government scheme aimed to reduce poverty.’ Over 63 million people are
pushed towards poverty every year due to rising health related expenses20. Low public
expenditure on heath also adversely affects availability of physicians and paramedics. In terms
of availability of health care service staff, India’s position is only above Indonesia compared
to other selected countries (see Table 3).
Table 3: Availability of Health Care Service Staff across Selected Countries
Health Care Service Staff Specialist Surgical
Workforce
Physicians Nurses and
midwives
Per 1,000 people Per 1,000 people Per 100,000
population
Country 2008-15 2008-15 2009-16
Argentina 3.8 NA 10.5
Australia 3.4 12.3 72.6
Brazil 1.9 7.4 34.7
Canada 2.5 9.5 35.3
China 1.9 1.9 40.1
France 3.2 10.6 58.6
Germany 4.1 13.5 112.9
India 0.7 2 6.8
Indonesia 0.2 1.4 NA
Italy 3.9 6.5 114
Japan 2.3 10.8 37.4
20 Government of India (2014).

22
Health Care Service Staff Specialist Surgical
Workforce
Physicians Nurses and
midwives
Per 1,000 people Per 1,000 people Per 100,000
population
Country 2008-15 2008-15 2009-16
Korea, Rep. 2.2 5.7 49.6
Mexico 2.1 2.5 NA
Russian
Federation 3.3 4.6 88
Saudi Arabia 2.6 5.2 NA
South Africa 0.8 5.1 11.5
United
Kingdom 2.8 8.4 90.5
United States 2.6 NA 54.7
Source: Extracted from World Economic Indicators database available at
https://data.worldbank.org/indicator
6.2. Fiscal Policy and Health
Several health care protection programs have been developed and adopted across selected
countries. Globally, healthcare system largely falls under two main systems of service
provision either (i) delivered through insurance coverage; or (ii) government-funded
programmes. For instance, the US health care system is largely based on insurance coverage.
The Affordable Care Act (ACA), enacted in US in 2010, aims to achieve universal insurance
coverage through shared responsibility among government, individuals, and employers21. In
the UK, National Health Service (NHS) is a government-funded universal healthcare system.
Apart from such direct tools, government can also use the fiscal policy effectively to introduce
efficiencies in provision of healthcare services. Some of the government instruments include
taxes and subsidies direct provision of certain health services for free or at subsidised rates,
taxing products which are harmful for health and subsidising products that promote healthy
lifestyle. Appropriate tax policy can promote provision of health care services, discourage
consumption of harmful products and increase government revenue.
6.3. Fiscal Policy and Education
Increasing access to education enhances human capital, which is the primary asset especially
for the weaker and disadvantage sections22. Education is not only an important vehicle for
upward mobility, but also has significant positive externalities. Government support becomes
21 For details see https://www.ncbi.nlm.nih.gov/pmc/articles/PMC3001814/ (last accessed March 27, 2018) 22 For details see https://www.adb.org/sites/default/files/publication/150415/ewp-423.pdf (last accessed March
27, 2018)

23
necessary because of both these factors. In the absence of government support access to
education might get marginalised to the rich section of the population.
Studies show that government expenditure on education; particularly on primary education is
one of the most effective means of reducing inequality23. Public expenditure on education in
India is only 3.8 percent of GDP (see Table 4). To benefit from demographic dividends Indian
government needs to increase public spending on education. Compared to other selected
countries, pupil-teacher ratio at primary level in India is quite high at 31 and the trend is similar
at secondary level also (see Table 4).
Inadequate and poor quality of spending leads to higher dropouts and lower learning levels.
Only 81 percent of total students enrolled in grade 1 reach last grade of primary education in
India (see Appendix A3). For male students, ratio is only marginally better. Compared to other
selected countries, for which data is available, survival rate in India, is poorest (see see
Appendix A3).
Table 4: Public Expenditure on Education across Selected Countries (2015)
Government Expenditure on
Education
Pupil-Teacher ratio
Country
% of GDP
% of Total
Government
Expenditure
Primary Pupil-
Teacher ratio
Secondary
Pupil-Teacher
ratio
Argentina 5.3 14.7 .. ..
Australia 5.2 13.9 .. ..
Brazil 6 16 21 17
Canada .. .. .. ..
China .. .. 16 14
France 5.5 9.7 18 13
Germany 5 11.1 12 12
India 3.8 14.1 31 32
Indonesia 3.6 20.5 17 15
Italy 4.1 8 12 11
Japan 3.6 9.3 16 ..
Korea, Rep. 5.1 .. 17 15
Mexico 5.3 19.1 27 16
Saudi Arabia .. .. 11 11
South Africa 6 19.1 34 ..
Turkey 4.8 12.4 19 19
United Kingdom 5.7 13.9 17 16
United States 5.4 14.5 15 15
Source: Extracted from World Economic Indicators database available at
https://data.worldbank.org/indicator
23 For details see https://www.adb.org/sites/default/files/publication/150415/ewp-423.pdf (last accessed March
27, 2018)

24
6.4. Fiscal Policy and Social Security
Social security is one of the most important aspects of inclusive growth. Direct and indirect
support to the vulnerable sections of the population is an important responsibility of welfare
state. Unemployment benefits, food for work, old age, disability pension etc., are prime
examples of welfare activities undertaken.
With increasing old age population, pension has become most critical part of any government
spending. With increasing life expectancy and lower birth rate, old age dependency is rising
and in many advanced economies it is more than 30 percent24.
Table 5: Pension Coverage across Selected Countries
Country Recent
year
First Beneficiaries
Coverage Definition
(old-age
pensioners/pop 65+)
Second Beneficiaries
Coverage Definition
(all pensioners / tot.
pop.) (%)
Schemes
Included
General
Governme
nt Debt (%
of GDP)
Argentina 2010 139.8 14.8 ns 54.23
Brazil 2010 92.6 11.4 ns 78.32
Canada 2007 78 14.4 ns 92.40
China 2011 146.3 12.4 ns, ss 44.29
France 2010 139 27.8 ns 96.34
Germany 2010 106.2 28.7 ns 68.08
India 2010 54.4 2.6 69.58
Indonesia 2010 8.2 0.2 cs 27.86
Italy 2010 108.1 27.4 ns 132.62
Japan 2003 127.6 24.1 ns 239.27
Korea, Rep. 2011 60.9 7 ns, cs, ss 38.32
Mexico 2010 25 1.6 ns 58.43
Russian
Federation 2007 154.6 25.3 ns 15.65
Saudi
Arabia NA NA NA NA 13.06
South Africa 2010 122 5 ns, cs 51.70
Turkey 2008 137.1 11.1 ns 28.13
United
Kingdom 2010 118.8 22.4 - 89.26
United
States 2008 82.6 14.9 ns 107.11
Source: Extracted from World Economic Outlook Database, 2018, available at
https://data.worldbank.org/indicator/SP.POP.DPND.OL (last accessed March 27, 2018)
Note: ns: National Scheme; cs: Civil Servants scheme; ss: Special scheme
Both advanced and developing countries are fiscally constrained to manage old age pensions.
In several countries, debt-GDP ratio is more than 75 percent (see Table 5). In developing
countries, low tax-GDP ratio hampers the ability of state to provide adequate pension coverage
24 For details see https://data.worldbank.org/indicator/SP.POP.DPND.OL (last accessed March 27, 2018)
25
to aging population. In advanced countries, higher old age dependency creates fiscal
sustainability problems.
As shown in Table 5, pension coverage in India is only 2.6 percent and is quite low compared
to other selected countries. For instance, pension coverage in Russian Federation, France,
Germany, Italy, Japan and UK is more than 20 percent. Similarly, compared to other countries,
public spending on pension in India is very poor. India spends only 4.3 percent of its GDP on
pension, out of which social spending is only 0.1 percent and the remaining is from contributory
/ earnings related schemes (Appendix A2).
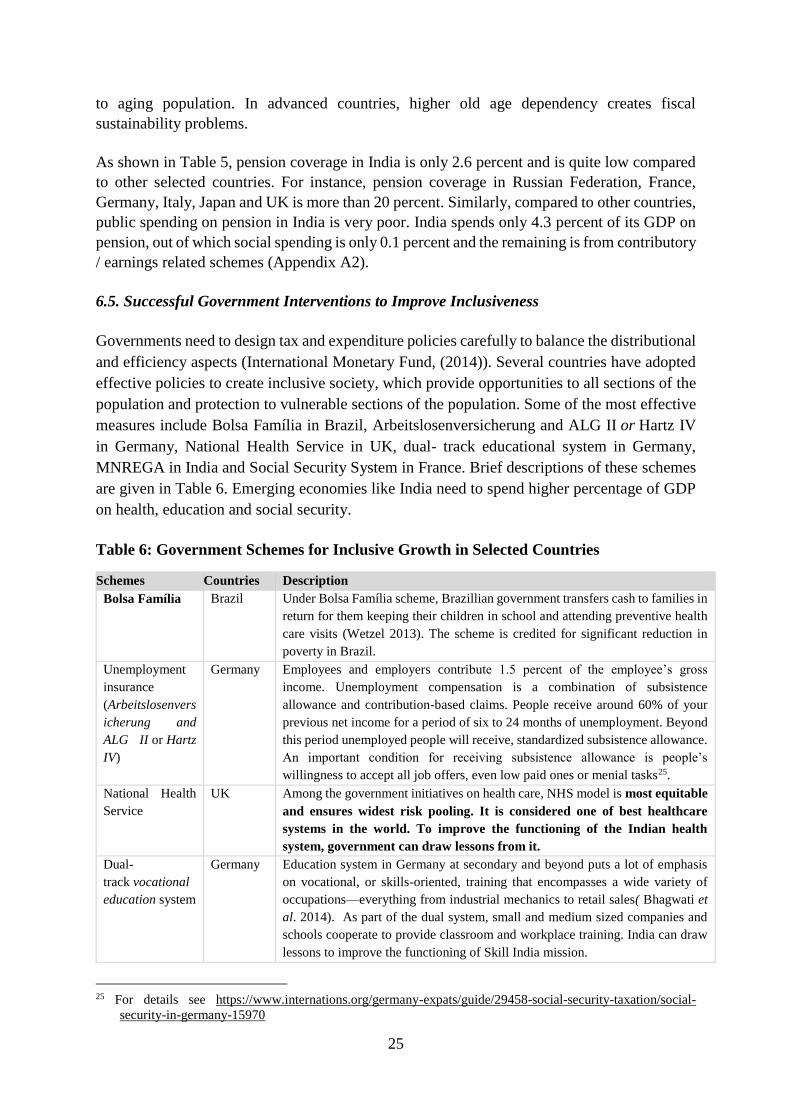
6.5. Successful Government Interventions to Improve Inclusiveness
Governments need to design tax and expenditure policies carefully to balance the distributional
and efficiency aspects (International Monetary Fund, (2014)). Several countries have adopted
effective policies to create inclusive society, which provide opportunities to all sections of the
population and protection to vulnerable sections of the population. Some of the most effective
measures include Bolsa Família in Brazil, Arbeitslosenversicherung and ALG II or Hartz IV
in Germany, National Health Service in UK, dual- track educational system in Germany,
MNREGA in India and Social Security System in France. Brief descriptions of these schemes
are given in Table 6. Emerging economies like India need to spend higher percentage of GDP
on health, education and social security.
Table 6: Government Schemes for Inclusive Growth in Selected Countries
Schemes Countries Description
Bolsa Família Brazil Under Bolsa Família scheme, Brazillian government transfers cash to families in
return for them keeping their children in school and attending preventive health
care visits (Wetzel 2013). The scheme is credited for significant reduction in
poverty in Brazil.
Unemployment
insurance
(Arbeitslosenvers
icherung and
ALG II or Hartz
IV)
Germany Employees and employers contribute 1.5 percent of the employee’s gross
income. Unemployment compensation is a combination of subsistence
allowance and contribution-based claims. People receive around 60% of your
previous net income for a period of six to 24 months of unemployment. Beyond
this period unemployed people will receive, standardized subsistence allowance.
An important condition for receiving subsistence allowance is people’s
willingness to accept all job offers, even low paid ones or menial tasks25.
National Health
Service
UK Among the government initiatives on health care, NHS model is most equitable
and ensures widest risk pooling. It is considered one of best healthcare
systems in the world. To improve the functioning of the Indian health
system, government can draw lessons from it.
Dual-
track vocational
education system
Germany Education system in Germany at secondary and beyond puts a lot of emphasis
on vocational, or skills-oriented, training that encompasses a wide variety of
occupations—everything from industrial mechanics to retail sales( Bhagwati et
al. 2014). As part of the dual system, small and medium sized companies and
schools cooperate to provide classroom and workplace training. India can draw
lessons to improve the functioning of Skill India mission.
25 For details see https://www.internations.org/germany-expats/guide/29458-social-security-taxation/social-
security-in-germany-15970

26
Schemes Countries Description
Mahatma Gandhi
National
Employment
Guarantee
Scheme
India It is an Indian social security measure to provide guaranteed 100 days work to
marginalised sections of the population. Given large scale unemployment and
seasonal employment, India launched this scheme to provide relief to vulnerable
population. Countries at similar levels of development can learn from Indian
experience.
Social Security
System
France France has an extensive statutory social security system, which is based on the
principles of universality and unity (PWC 2014). Comprehensive social sector
schemes have five components; general scheme, covering the majority of
employees and other categories of people (students, recipients of certain benefits,
residents), the special employee schemes, the agricultural scheme, schemes for
non-agricultural self-employed persons and unemployment schemes (EC 2013).
General scheme accounts for about three quarters of total expenditure (Ministry
for the Economy and Finance 2013). Revenue of general scheme comes from
national insurance contributions paid by employers and workers and from
taxation and earmarked charges (EC 2013). Schemes cover covers health
insurance, compensation for occupational injuries and illnesses, pensions and
family benefits (Ministry for the Economy and Finance 2013).
Source: Compiled by authors from different sources
Thus, India’s relative status on health, education and social protection which are all integral to
inclusive growth is very low and learning from selected countries could help to improve the
access and the quality of these services.
7. Conclusion and Policy Recommendations
Against the backdrop of the discussions presented in the preceding sections, some
recommendations are given in the following sub-sections.
7.1. Recommendations
7.1.1. Inclusive Growth Model Representing Issues Affecting Developing Countries
A number of studies have been examined to analyse the pattern of inclusiveness across India
and the selected countries. This paper presents what other studies highlight and findings on
pattern and status are mainly based on the WEF 'Inclusive Growth and Development Report’.
The paper finds that existing literature focuses on using indicators for inclusive growth that are
largely developed-country centric and do not completely reflect the priorities and policy
initiatives taken recently by developing countries like India and hence their ranking remains
quite low. Their empirical findings, scientific evidence and data is more aligned to developed
countries priorities and state of development. For instance, the existing inclusive index does
not give sufficient weightage to indicators such as governance and corruption while measuring
inclusiveness for different countries, even though these have cross effects and are emerging as
important indicators. Another shortcoming of the existing indicators is that these indicators do
not give due weightage to new and emerging tools such as public finance and fiscal policy that
are emerging to be important from the inclusive growth perspective.

27
Each country is different and hence will have different focus sectors for achieving inclusive
and sustainable growth. While developing countries are focussing more on expansion and
quality of services, developed countries’ focus is on the delivery of services. Therefore, this
study recommends that there is a need to develop an inclusive growth index which equally
reflects priorities and growth indicators of developing countries as well. This index will
measure the overall inclusiveness of selected countries and will cover issues by way of
indicators that affect both developing and developed countries. The index may also include
some of the recent concerns of the new ‘Global Order’ affecting both developed and developing
countries. It may include the following additional indicators:
i. Regional economic growth indicator- how is the growth contributed and shared by
different economic regions (or States) within an economy- an indicator of regional
inequality and inclusive growth;
ii. Ratio of GDP per capita of general population to OBC/SC/ST- an indicator of how the
marginalised sections of population are benefited from growth;
iii. Relative growth rate of GDP per capita between general population to OBC/SC/ST- an
indicator of how the marginalised sections of population are sharing the benefits of
growth,
iv. Quality of delivery of services- educational outcomes (quality), health outcomes,
personal physical security-effectiveness of policing system- an indicator of quality of
Governance;
v. Relative share of tax paid by different income groups at a time and over time within an
economy- an indicator of participation in the process of growth;
vi. The progressivity of tax –both direct and indirect- an indicator of participation in the
process of growth by rich and poor;
vii. Sustainability of growth- environmental concerns- carbon footprint, etc.
It may also identify indicators which have cross linkages and could be given higher attention
and weight in the index- e.g. the Governance indicators have bearing on the access and the
capacity of the people to earn income and hence can be given more weightage.
7.1.2. Inclusive Public Finance and Fiscal Policy for Inclusive Growth
Fiscal policy can act as a powerful instrument for tackling inequality and creating a more
equitable economy. Experiences of advanced countries show that targeted cash transfers,
progressive taxes and different components of public spending can significantly reduce
inequality. In developing countries, fiscal policy through spread of education and employment
could bring in economic growth and reduction in inequality. A similar trend is evident in the
case of India. Post the implementation of the recommendations of the fourteenth finance
commission, components and objectives of the central government schemes and programmes
are targeted and implementation of these schemes and programmes is effectively and timely
monitored by the government. For instance, under the Direct Cash Transfer scheme, transfers
made to the beneficiaries under different central or state government schemes like MNREGA,
Social Security pension, Handicapped Old Age Pension etc., are directly transferred to

28
beneficiaries’ bank accounts. In addition, schemes and programmes are closely monitored. For
instance, under the Pradhan Mantri Awas Yojna scheme, all houses to be constructed under the
scheme are tagged and their construction progress can be mapped and viewed on smart phones.
This helps in monitoring the release of funds to the beneficiaries. It is basically tagging
geographical view of the extent of construction to the release of funds.
7.1.3. Learning from Best Practices
In view of the huge challenge before the Indian economy to bridge the gap across all pillars of
inclusiveness with other selected countries, it will be useful if India learns from the best
practices of these countries (for details see Table 7). For instance, in terms of ‘education and
skills’, India can learn from the experience of countries like Argentina, China, South Africa
and Japan; besides its old partners US, UK, Canada and Australia (see Table 7 for policy
details). On ‘fiscal efficiency’, there are lessons to be learnt from policy initiatives adopted by
SELECTED countries like France, Germany and South Africa. Australia, Indonesia, Korea and
Germany have adopted ‘employment’ policies’ some of which could be replicated in India.
India can collaborate with countries like Korea, Turkey, Japan, Germany and Canada on
policies related to ‘equitable growth’. On the pillar of ‘asset building’ India can learn best
practices from Australia, China and Turkey.

29
Table 7: Recommendations for Policies to Achieving Inclusive Growth
S. No. Pillars Recommendations Country
1 Education and
Skills
Improve educational outcomes by reducing the prevalence of school dropouts
Continue improving access to education at the secondary and college level and improve the quality of education
Build human capital through massive interventions to improve nutrition, early childhood education, and improved
quality of basic education
Establish a countrywide workplace training-based vocational education system; enhance career guidance and better
disseminate information on jobs
Develop digital skills at all levels of education and training
Promote digital literacy - Develop skilled, and trained manpower, and engaging people who can create, sustain, and
maintain infrastructure and online content and services is critical to development of the Internet. Local entrepreneurs
are important to develop local content and services, while also enabling income and jobs growth
Target the low skilled in lifelong learning by facilitating integration into formal education through part-time
programmes in post-secondary education and vocational training
Increase and incentivize expenditure on R&D, both by Government as well as by private sector
Argentina
China
South Africa
Japan
2 Fiscal efficiency Invest more in rural infrastructure, such as roads connecting villages to market towns, crop storage infrastructure
and access to sustainable irrigation technologies such as drip irrigation
Take further steps towards sustainable and inclusive urbanization by: (i) improving urban infrastructure, especially
housing, transport and sanitation; and (ii) increasing the resources and capacity of municipal governments, including
through increased collections of property taxes
Introduce regional infrastructure projects and introduce regional jobs and investment package
Increasing economic transparency to build investor confidence
Develop a robust, fiscally sustainable, and coherent social protection system
Lower social security contributions further by shifting the financing of benefits that accrue to society at large, such
as those for families, to less distortive taxes
Streamline social assistance and integrate social security payments with the income tax system
Boost funding for the most efficient measures, such as conditional cash transfers.
Strengthen expenditures on eradicating extreme poverty and simplify the administrative procedure for accessing
cash transfers.
Continue efforts to create a unified database of beneficiaries
Target transfers more effectively, improve the effectiveness of the anti-poverty programmes
France
Argentina
Germany
South Africa
Japan
3 Employment Reduce barriers to formal employment further by introducing a simpler and more flexible labour law which does
not discriminate by size of enterprise and by gender
Australia
Indonesia
Korea
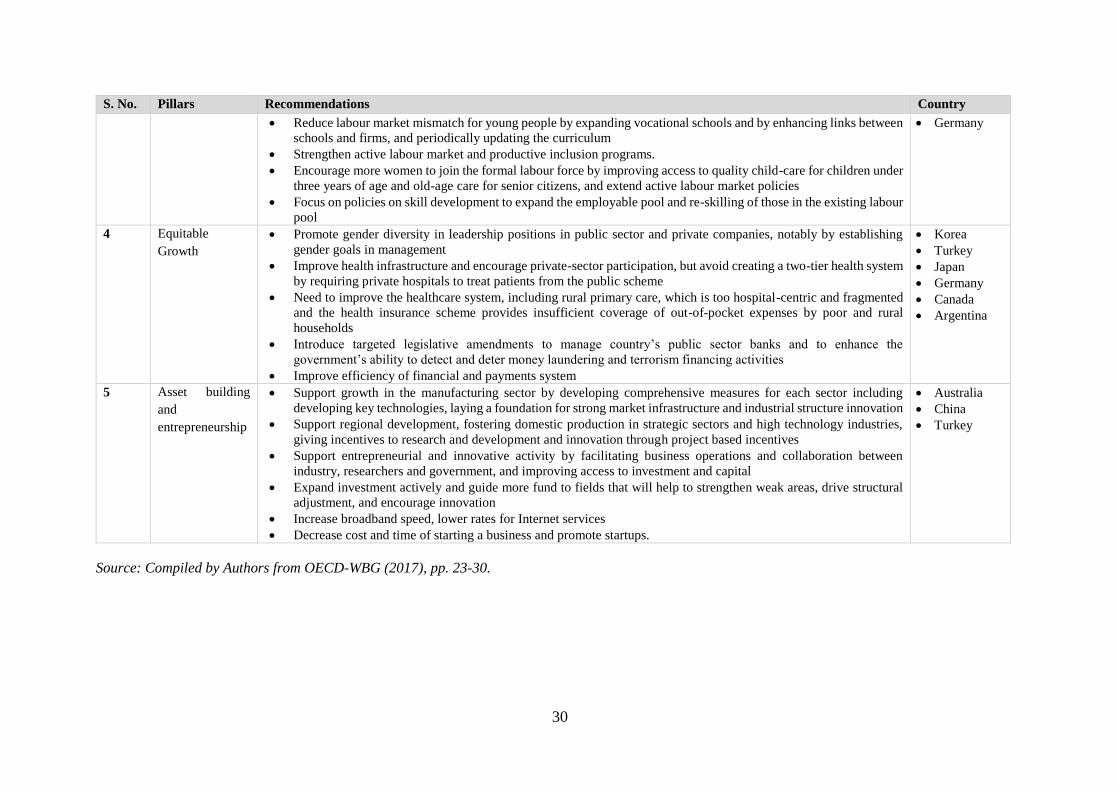
30
S. No. Pillars Recommendations Country
Reduce labour market mismatch for young people by expanding vocational schools and by enhancing links between
schools and firms, and periodically updating the curriculum
Strengthen active labour market and productive inclusion programs.
Encourage more women to join the formal labour force by improving access to quality child-care for children under
three years of age and old-age care for senior citizens, and extend active labour market policies
Focus on policies on skill development to expand the employable pool and re-skilling of those in the existing labour
pool
Germany
4 Equitable
Growth
Promote gender diversity in leadership positions in public sector and private companies, notably by establishing
gender goals in management
Improve health infrastructure and encourage private-sector participation, but avoid creating a two-tier health system
by requiring private hospitals to treat patients from the public scheme
Need to improve the healthcare system, including rural primary care, which is too hospital-centric and fragmented
and the health insurance scheme provides insufficient coverage of out-of-pocket expenses by poor and rural
households
Introduce targeted legislative amendments to manage country’s public sector banks and to enhance the
government’s ability to detect and deter money laundering and terrorism financing activities
Improve efficiency of financial and payments system
Korea
Turkey
Japan
Germany
Canada
Argentina
5 Asset building
and
entrepreneurship
Support growth in the manufacturing sector by developing comprehensive measures for each sector including
developing key technologies, laying a foundation for strong market infrastructure and industrial structure innovation
Support regional development, fostering domestic production in strategic sectors and high technology industries,
giving incentives to research and development and innovation through project based incentives
Support entrepreneurial and innovative activity by facilitating business operations and collaboration between
industry, researchers and government, and improving access to investment and capital
Expand investment actively and guide more fund to fields that will help to strengthen weak areas, drive structural
adjustment, and encourage innovation
Increase broadband speed, lower rates for Internet services
Decrease cost and time of starting a business and promote startups.
Australia
China
Turkey
Source: Compiled by Authors from OECD-WBG (2017), pp. 23-30.

31
7.2. Conclusion
Due to the wave of anti-globalisation, anti-migration and clouds of trade war between US and
China, which may spread to the entire World; advanced economies especially of Europe, are
now divided over the future policy agenda. India has also been hit hard by the protectionist
policies adopted by the advanced countries during last few years. India has to choose its options
carefully, which serve the interest of the Indian economy and its people.
Since many countries today are facing a lot of resistance on the domestic front, it is a challenge
for all of them to adopt policies, which are perceived to be friendly not only to their domestic
audience but also to their international friends. As a result there is a lot of competition for the
same limited space. Since there is a lot of gap on the indicators of education, health,
infrastructure, corruption, governance, etc., between India and other countries, it is a challenge
to find and get suitable support-financial and technological from these countries.
Despite the challenges India can collaborate with some of the selected countries. It could be
able to attract the right kind of support for the expansion of quality education and health in the
country. Since large infrastructure of roads, railways, housing, urban infrastructure, etc., is still
to be developed in the country, India could draw the financial and technological support of the
developed countries. With proper coordination and agreements with advanced countries and
by curbing its own protectionist tendencies, India could boost its exports and achieve faster
growth.
32
Bibliography
Afonso A., Schuknecht L., Tanzi V (2006), “Public sector efficiency: An international
comparison”, Public Choice, 2005, vol. 123, issue 3, 321-347
Alvaredo F., Chancel L., Piketty T., Saez E. and Zucman G., (2018), ‘World Inequality
Report, 2018’, WID.World, available at
http://wir2018.wid.world/files/download/wir2018-full-report-english.pdf (last
accessed February 5, 2018)
Aoyagi, C., and G. Ganelli (2015), ‘Asia’s Quest for Inclusive Growth Revisited’, IMF
Working Paper 2015
Atkinson, B. Anthony. (2015), ‘Inequality: What can be done?’ May 2015, Harvard
University Press, London, England.
Azhykulova, A. (2015), “Efficient and Effective Public Spending for Sustainable Economic
Growth”, International Conference on Eurasian Economies 2015
Banerjee, A. et.al. (2017). Poverty and Income Distribution in India. Juggernaut Books, New
Delhi.
Barbosa, Alexander De F. et.al. (2017). ‘Growth and Inequality: The Contrasting Trajectories
of India and Brazil’, Cambridge University Press.
Basu, Kaushik and Joseph E. Stiglitz. (2016). ‘Inequality and Growth: Patterns and Policy’,
Volume 1: Concepts and Analysis. Palgrave Macmillan, United States
Basu, Kaushik and Stiglitz, J. (ed.) (2016). ‘Inequality and Growth: Patterns and Policy’.
Volumes I and II
Bhagwati, Jaimini, Abheek Barua and M. Shuheb Khan (2014), “Macroeconomic reforms:
Risks, flash points and the way forward”, ICRIER Working Paper 290
Boushey, H. et. Al. (ed) (2017). ‘After Piketty: The Agenda for Economics and Inequality’,
Harvard University Press, Cambridge, Massachusetts.
Curristine, T., Lentil, Z., and Joumard, I. (2007), “Improving public sector efficiency:
challenges and opportunities”, OECD Journal on Budgeting, Vol. 7, pp. 1-41.
Dev, S. Mahendra (ed) (2017), 'India Development Report 2017', Dev M. S. (ed) (2017),
Oxford University Press, New Delhi.
ESCAP (2017), “Taxing for Shared Prosperity”, Policy Briefs No. 46, April 2017, United
Nations, Economic and Social Commission for Asia and The Pacific, available at
https://www.unescap.org/sites/default/files/PB%20No.46%20Taxing%20for%20Shar
ed%20Prosperity.pdf (last accessed March 29, 2018)
Estrada, G., Lee, S., & Park, D. (2014), “Fiscal Policy for Inclusive Growth: An Overview”,
ADB Economics Working Paper Series
European Commission (2013), “Your social security rights in France”, European
Commission
G20 Growth Strategy Argentina (2017) ‘2017 Growth Strategy Argentina’ G20 Germany
2017, available at
https://www.bundesfinanzministerium.de/Content/DE/Downloads/G20-
Dokumente/Hamburg_Wachstumsstrategien/ARG-Growth-
Strategy.pdf?__blob=publicationFile&v=3 (last accessed on April 3, 2018)

33
G20 Growth Strategy Indonesia (2017) ‘2017 Growth Strategy Indonesia G20 Germany
2017, available at
http://www.bundesfinanzministerium.de/Content/DE/Downloads/G20-
Dokumente/Hamburg_Wachstumsstrategien/IDN-Growth-
Strategy.pdf?__blob=publicationFile&v=3 (last accessed on April 3, 2018)
Government of India (2014), “National Health Policy 2015- Draft”, Prepared by Ministry of
Health & Family Welfare December, 2014, available at
https://www.nhp.gov.in/sites/default/files/pdf/draft_national_health_policy_2015.pdf
(last accessed March 27, 2018)
Heshmati, A., J. Kim, & D. Park (2014), ‘Fiscal Policy and Inclusive Growth in Advanced
Countries: Their Experience and Implications for Asia’, ADB Economics Working
Paper Series No. 422. Manila: Asian Development Bank
International Monetary Fund (2010), “Macro-Fiscal Implications of Health Care Reform in
Advanced and Emerging Economies”, Prepared by the Fiscal Affairs Department, IMF
International Monetary Fund (2014), ‘Fiscal Policy and Income Inequality’, IMF Policy
Paper 2014
Kanbur, R. et. al. (ed) (2014). ‘Inequality in Asia and the Pacific’, Asian Development Bank
and Routledge.
Kannan, K.P. (2014). ‘Interrogating Inclusive Growth: Poverty and Inequality in India’,
Routledge, New Delhi.
Lopez R. E., Thomas V. & Wang Y (2010), ‘The Effect of Fiscal Policies on the Quality of
Growth’, World Bank Evaluation Brief 9
Mamgain Rajendra P. and Sher Verick. (2018). ‘The State of Employment in Uttar Pradesh:
Unleashing the potential for inclusive growth, ILO, New Delhi, India.
Mandl U., Dierx A., Ilzkovitz F., (2008), “The effectiveness and efficiency of public
spending”, European Commission, Directorate General for Economic and Financial
Affairs, pp. 3-4
Matteo, Livio Di (2014), “Measuring government in the 21st century: An International
Overview of the Size and Efficiency of Public Spending”, Fraser Institute
Mckinsey (2016), “Technology, Jobs, and The Future Of Work”, Mckinsey Global Institute,
Mckinsey &Company, December 2016
McKinsey (2017), “Jobs Lost, Jobs Gained: Workforce Transitions in a Time of Automation”,
McKinsey Global Institute
Mckinsey (2017), “A Future That Works: Automation, Employment, and Productivity”,
Mckinsey Global Institute, Mckinsey & Company, January 2017.
Mckinsey (2017), “Jobs Lost, Jobs Gained: Workforce Transitions in a Time of Automation”,
Mckinsey Global Institute, Mckinsey & Company, December 2017
Milanovic, Branko. (2016). ‘Global Inequality: A New Approach for the Age of
Globalization’, The Bellnap Press of Harvard University Press.
Ministry for the Economy and Finance (2013), “Key French Social Security Figures 2012”,
Ministry for the Economy and Finance, Government of France
Ministry of Finance (2018), “Union Budget Speech 2018-19”, Ministry of Finance,
Government of India

34
Ministry of Health and Family Welfare December (2014), National Health Policy 2015
Draft
Mitra A. (2013), “Insights into Inclusive Growth, Employment and Well-being in India”,
Springer, India, 2013.
Nathan, Dev and Sharma, A.N. (2017). “Employment, Social Protection and Inclusive
Growth in South Asia’, South Asia Press and IHD.
Nayyar, Deepak. (2017). ‘Employment, Growth and Development: Essays in a Changing
World Economy’. South Asia Edition, Routledge, London.
Niti Aayog (2017), 'India Three Year Action Agenda 2017-18 to 2019-20', Niti Aayog, New
Delhi, available at http://niti.gov.in/writereaddata/files/coop/IndiaActionPlan.pdf (last
accessed on February 25, 2018)
OECD (2014), “Inclusive Growth: Report on the OECD Framework for Meeting of the OECD
Council at Ministerial Level”, Paris 6-7 May 2014.
OECD-WBG (2014), ‘A policy framework to help guide the G20 in its development of policy
options to foster more inclusive growth’, July 2017, available at
https://www.oecd.org/g20/topics/framework-strong-sustainable-balanced-
growth/OECD-WBG-Policy-Framework-to-help-Gguide-the-G20-in-its-
development.pdf (last accessed on January 15, 2018)
OECD (2016), ‘Boosting Productivity and Inclusive Growth in Latin America’, OECD Latin
America and Caribbean, Regional Programme, available at http://www.oecd.org/latin-
america/Boosting_Productivity_Inclusive_Growth.pdf (last accessed on April 3, 2018)
Piketty, Thomas. (2014). Capital in the 21st Century. The Bellnap Press of Harvard University
Press, London.
Planning Commission (2008), 'Eleventh Five Year Plan 2007-12' Volume I, Planning
Commission, Government of India, Oxford University Press, New Delhi, available at
http://planningcommission.nic.in/plans/planrel/fiveyr/11th/11_v1/11th_vol1.pdf (last
accessed on January 15, 2018)
PriceWaterhouseCoopers (2014), “Social security systems around the globe” PWC report
Rosenbaum, Sara (2011), “The Patient Protection and Affordable Care Act: Implications for
Public Health Policy and Practice” Public Health Rep. 2011 Jan-Feb; 126(1): 130–135
Spence, A Michael. (2008), ‘The Growth Report: Strategies for Sustained Growth and
Inclusive Development’. IPS Nobel Laureate Lecture Series, 10th September.
Stiglitz, J.E. (2016). “An agenda for sustainable and inclusive growth for emerging markets”.
Journal of Policy Modelling, 38 (2016) 693–710.
Tanzi, Vito (1997), “The Changing Role of Fiscal Policy in Fund Policy Advice”, IMF
Seminar Paper, September 19, 1997
UN (2017), “The Sustainable Development Goals Report", UN, New York.
UN (2018), “Country Classifications”, UN, New York. Available at
https://www.un.org/development/desa/dpad/wp-
content/uploads/sites/45/WESP2018_Annex.pdf
Wetzel, Deborah (2013), “Bolsa Família: Brazil’s Quiet Revolution” World Bank Blog
World Bank Group (2017), 'World Development Report', 2017, A World Bank Group
Flagship Project.

35
World Economic Forum (2017), ‘The Inclusive Growth and Development Report’, January
2017, available at http://www3.weforum.org/docs/WEF_Forum_IncGrwth_2017.pdf
(last accessed on January 15, 2018)
World Economic Forum (2018), ‘The Inclusive Growth and Development Index 2018,
available at http://www3.weforum.org/docs/WEF_Forum_IncGrwth_2018.pdf (last
accessed on March 25, 2018)
World Bank (2018), “Doing Business 2018: Reforming to Create Jobs”. A World Bank Group
Flagship Report, World Bank, Washington DC.

36
Appendices

1
Appendix A1: Complete List of Pillars; sub-pillars and indicators
Overall IDI
Pillar I Pillar II Pillar III Pillar IV Pillar V
Education and Skills Fiscal Efficiency Employment and
labour compensation
Equitable growth Asset building and
entrepreneurship
Access to education
(Score / Rank)
Tax Code Productive employment Growth and Income
distribution
Small business
ownership
Net primary enrolment
(% of population of primary age)
Total tax revenue (% GDP) Unemployment rate (%
of labour force)
GDP Per Capita ($) New businesses
registered (per 1,000 working age
individuals)
Gross secondary enrolment (% of
population of secondary
age)
Tax on goods and services (% of total tax revenue)
Youth unemployment rate (% of labour force)
Labour productivity ($) Time to start a business (total number of days)
Gross tertiary enrolment (% of population of
tertiary age)
Total tax on capital (% GDP) Share in Temporary Employment (% of
employed persons)
Poverty rate (%) Cost required of starting a business (% GNI per
capita)
Availability of high
quality training services
(1-7 scale)
Time spent paying taxes for
small businesses (total number
of hours per year)
Employment by
education (advanced
education - as a % of
total education)
Net Income Inequality
GINI
Time required to
enforce a contract (total
number of days)
Quality Social Protection Educated Unemployment rate
Wealth Inequality GINI Home and financial
asset ownership
Quality of education
system (1-7 scale)
Efficiency in public goods and
services provision (1-7 scale)
Employment to
population ratio (%)
Share of Industry in GDP
(% of GDP) - 5 year average
Home ownership rate
(% of population)
Expenditure on
education (% of GDP)
Social safety net protection (1-7
scale)
Dependency ratio Share of Employment in
Industry - 5 year average (%
of total employment)
Housing Loan
Penetration (% of adult
population)
Ease of finding skilled employees (1-7 scale)
Total spending on social protection (% GDP)
Flexible labour laws Equal opportunities Affordability Gap, Urban housing
Digital Literacy Progressivity of pensions (0 to
100 scale)
Pay linked to
productivity (1-7 scale)
Gender gap in education
Internet access in schools (1-7 scale)
Fiscal Transfers Wage dispersion (minimum relative to
median wage)
Female labour force participation female to male
ratio)
Internet users (% of population)
Governance Cooperation in labour-employer relations (1-7
scale)
Gender Gap in Estimated Earned Income (female to
male ratio)
Mobile cellular
subscription (per 100 people)
Corruption Workers' Rights
(violations)
Paid maternity leave (total
number of days)
Quality of overall infrastructure Strictness of
employment protection (0-6 scale)
Gender Gap in Financial
Access (female to male ratio)
Access to electricity (%
population)
Trade Union density (%
of employment) Financial inclusion
Extent of Informal economy (1-7 scale)
Affordability of financial services for businesses (1-7
scale)
Ease of Access to Loans
(1-7 scale)
Financing of SMEs (1-7
scale)
Account at a formal financial institution (% of
respondents in bottom 40%)
Access to Health
Healthy Life Expectancy
Quality of healthcare
services (1-7 scale)
Accessibility of healthcare services (1-7 scale)
Out of pocket (% of total
health expenditure)
Note: Rows highlighted in yellow are for Main Pillars, in grey are sub-pillars and the others are
indicators.

2
Appendix A2: Total Public Pension Spending in G20 countries
Contributory / Earnings related schemes:
National
Scheme
Civil Servants Social Pensions Total Spending
Recent
Year (% GDP) (% GDP)
Recent
Year (% GDP)
Recent
Year (% GDP)
Argentina 2015 12 2013 0.035 2011 12.035
Australia 2014 1.38 2013 2.12 2014 3.5
Brazil 2015 6.8 1.6 2013 1.246 2013-2015 9.646
Canada 2013-2014 1.85 0.9 2011 1.55 2014 4.3
China 2014 0.3 0.2 2014 3.1 2014 3.6
France 2013-2014 11.397 2.15 2012 0.253 2014 13.8
Germany 2014 9.1 1.5 2014 10.6
India 2011 0.4 3.8 2011 0.1 2011 4.3
Indonesia 2015 0 1 2015 0 2015 1
Italy 2014 15.8 2014 15.8
Japan 2013-2014 9.95 0.25 2014 10.2
Korea, Rep. 2014 1.73 0.15 2011 0.32 2014 2.2
Mexico 2015 0.7 0.8 2015 0.2 2015 1.7
Russian
Federation 2014 8.5 - 2014 8.5
Saudi
Arabia 2013 0.32 - - 0.32
South Africa 2015 2.1 2015 1.31 2014/5 3.41
Turkey 2014 7.5 - 2014 7.5
United
Kingdom 2013-2014 4.85 2.28 2011 0.47 2014 7.6
United
States 2013-2014 5.87 0.83 2014 6.7
Source: Extracted from World Bank Pension Data available at
http://www.worldbank.org/en/topic/socialprotection/brief/pensions-data (last accessed March 27,
2018)

3
Appendix A3: Glossary of Abbreviations
ESCAP Economic and Social Commission for Asia and the Pacific
FDI Foreign Direct Investment
GDP Gross Domestic Product
GNI Gross National Income
GST Goods and Services Tax
IDI Inclusive Development Index
IMF International Monetary Fund
MGI McKinsey Global Institute
MNREGA Mahatma Gandhi National Rural Employment Guarantee Act
NHS National Health Service
SDGs Sustainable Development Goals
SMEs Small and Medium-Sized Enterprises
UK United Kingdom
UNDP United Nations Development Programme
US United States
WEF World Economic Forum

4
LATEST ICRIER’S WORKING PAPERS
NO. TITLE AUTHOR YEAR
374 STRATEGY FOR FINANCIAL
INCLUSION OF INFORMAL
ECONOMY WORKERS
SEEMA SHARMA
ARNAB BOSE
HIMANSHU SHEKHAR
ROHIT PATHANIA
MAY 2019
373 BURDEN OF DISEASE AND
CLIMATE INTERACTIONS: AN
ILLUSTRATIVE STUDY OF
SURAT CITY, INDIA
AMRITA GOLDAR
MEENU TEWARI
FLAVY SEN
APRIL 2019
372 TRADE EFFECTS OF
STANDARDS
HARMONIZATION IN THE EU:
IMPROVED ACCESS FOR NON-
EU PARTNERS
ANIRUDH SHINGAL
MALTE EHRICH
APRIL 2019
371 CLIMBING UP INDIA’S
MANUFACTURING EXPORT
LADDER: HOW COMPETITIVE
ARE INTERMEDIATE GOODS?
DEB KUSUM DAS
NEHA GUPTA
APRIL 2019
370 THE PROBABILITY OF
GETTING A LOAN: EVIDENCE
FROM INDIAN CITIES
SAON RAY
SMITA MIGLANI
SANDEEP PAUL
FEBRUARY 2019
369 EXPLAINING THE
CONTRACTUALISATION OF
INDIA’S WORKFORCE
RADHICKA KAPOOR
P. P. KRISHNAPRIYA
JANUARY 2019
368 THE ANOMALY OF WOMEN’S
WORK AND EDUCATION IN
INDIA
SURBHI GHAI DECEMBER 2018
367 THE GROWING IMPORTANCE
OF CONSUMER FINANCE FOR
FINANCIAL INCLUSION IN
INDIA
SAON RAY
SMITA MIGLANI
SANDEEP PAUL
DECEMBER 2018
366 INNOVATION, EFFICIENCY
AND INCLUSION:
INTEGRATION OF DIGITAL
TECHNOLOGIES IN THE
INDIAN MICROFINANCE
SECTOR
SAON RAY
SANDEEP PAUL
SMITA MIGLANI
OCTOBER 2018
365 TRADE, TRADE AGREEMENTS
AND SUBSIDIES: THE CASE
OF THE INDIAN APPAREL
INDUSTRY
ARPITA MUKHERJEE
ANUSREE PAUL
ANGANA PARASHAR SARMA
SOHAM SINHA
OCTOBER 2018
364 SKILL MISMATCH AND
RETURNS TO EDUCATION IN
MANUFACTURING: A CASE
OF INDIA’S TEXTILE AND
CLOTHING INDUSTRY
PRATEEK KUKREJA SEPTEMBER 2018

5
About ICRIER
ICRIER, one of India’s leading think tanks, was established in August 1981 as a not-for-profit
research organisation to provide a strong economic basis for policy making. Under the current
Chairperson, Dr. Isher Judge Ahluwalia, ICRIER has continued and reinforced the pursuit of
its original vision and in the process significantly expanded the scope of its research activities.
ICRIER is ably supported by a Board of Governors, which includes leading policy makers,
academicians, opinion makers and well-known representatives of the corporate world.
ICRIER’s success lies in the quality of its human capital. Led by Dr. Rajat Kathuria, Director
& Chief Executive, ICRIER’s research team consists of highly qualified professors, senior
fellows, fellows, research associates and assistants and consultants.
ICRIER conducts thematic research in the following eight thrust areas:
1. Macroeconomic Management, Financial Liberalisation and Regulation
2. Global Competitiveness of the Indian Economy – Agriculture, Manufacturing and Services
3. Challenges and Opportunities of Urbanisation
4. Climate Change and Sustainable Development
5. Physical and Social Infrastructure including Telecom, Transport, Energy and Health
6. Skill Development, Entrepreneurship and Jobs
7. Asian Economic Integration with focus on South Asia
8. Multilateral Trade Negotiations and FTAs
International conferences, seminars, public policy workshops, public lectures and publications
form an integral part of ICRIER’s outreach activities. ICRIER maintains a wide network of
resource persons from India and abroad. It strives to attract well-qualified researchers, provides
them a stimulating and scholarly work environment and encourages researchers to work in
teams. ICRIER’s research is widely cited by both academia and the popular press, and has over
the years provided critical inputs for policy making.