working paper - iese · 2005. 7. 27. · ditillo (2004) * this paper was funded by the center for...
TRANSCRIPT

1
Working Paper
WP No 598
July, 2005
DESIGNING MANAGEMENT CONTROL SYSTEMS IN PRODUCT DEVELOPMENT:
INITIAL CHOICES AND THE INFLUENCE OF PARTNERS
Antonio Dávila* George Foster**
Mu Li***
* Professor of Accounting and Control, IESE and Graduate School of Business, Stanford University ** Professor Gradute School of Business, Stanford University *** Applied Micro Devices
IESE Business School – University of Navarra Avda. Pearson, 21 – 08034 Barcelona, Spain. Tel.: (+34) 93 253 42 00 Fax: (+34) 93 253 43 43 Camino del Cerro del Águila, 3 (Ctra. de Castilla, km. 5,180) – 28023 Madrid, Spain. Tel.: (+34) 91 357 08 09 Fax: (+34) 91 357 29 13 Copyright © 2005 IESE Business School.
DESIGNING MANAGEMENT CONTROL SYSTEMS IN PRODUCT DEVELOPMENT:
INITIAL CHOICES AND THE INFLUENCE OF PARTNERS
Abstract Management control systems can hinder innovation. However, recent theoretical
and empirical work indicates that these systems can also enhance it. Using two sequential empirical studies, this paper investigates this question. The first uses a field research design to examine the adoption of management control systems in the product development function of entrepreneurial firms. The data comes from questionnaires and interviews with the CEOs, financial officers, and business development managers of 69 firms. Analysis of the qualitative data indicates that managers adopt these systems not so much to fulfill a particular role as to solve particular needs that they face. These needs range from external contracting and legitimizing the process with external parties to internal drivers such as managers’ background, learning by doing, need to focus, or reaction to problems. Furthermore, these reasons are associated with faster adoption of these systems and with product development performance. The objective of the second study is to extend and generalize the finding regarding the influence of external parties on management control system adoption to a population of mature firms. Using a survey design, the study finds an association between the importance of partners to product development and the level of formalization of management control systems..
Keywords: management control systems, product development, innovation
DESIGNING MANAGEMENT CONTROL SYSTEMS
IN PRODUCT DEVELOPMENT: INITIAL CHOICES AND THE INFLUENCE OF PARTNERS
Introduction The role of formal management control systems within innovation processes
remains ambiguous. Traditionally, these systems have been associated with mechanistic organizations (Burns & Stalker, 1961) that repeatedly perform the same routines with little if any changes. In contrast, their relevance to the innovation process, a process associated with organic structures, has been repeatedly questioned. Ouchi (1979) used a research department to illustrate clan control where social norms substitute formal management systems. Tushman and O’Reilly (1997) echo the same idea: “with work requirements becoming more complex, uncertain, and changing, control systems cannot be static and formal. Rather, control must come in the form of social control systems that allow directed autonomy and rely on the judgment of employees informed by clarity about the vision and objectives of the business” (page 108). The overall conclusion is that innovation processes are managed through informal mechanisms and that formal systems can only be detrimental to their performance.
However, recent work questions the validity of this relationship (Davila, 2005a). In
the theory field, the distinction between coercive and enabling bureaucracies (Adler & Borys, 1996) suggests that formal management control systems (MCS) may be required to support innovation. Gavetti and Levinthal (2000) present a learning model where companies that jointly rely on planning and learning-by-doing are predicted to perform better in uncertain environments compared to alternative learning strategies. Zollo and Winter (2002) argue that the essence of dynamic capabilities is adaptive routines. The objective of Simons’ (1995) interactive systems is to spark innovation. For the most part, recent empirical evidence also indicates that innovation processes may gain from the presence of MCS. Abernethy and Brownell (1999) use Simons’ model to examine the use of budgets “as a dialogue, learning and idea creation machine” during episodes of strategic change. However, Bisbe and Otley (2004) find that interactive systems hurt innovation in high-innovation firms. Cardinal (2001) reports that more control was associated with improved radical as well as incremental innovation in the pharmaceutical industry. Ditillo (2004)
* This paper was funded by the Center for Entrepreneurial Studies (CES), Graduate School of Business, Stanford University. We greatly appreciate the support of CES co-directors Professors Irv Grousbeck and Charles Holloway and CES program directors Mary Burnham and Linda Wells. We also thank the comments by James Hesford. We are also very grateful for the support of the people that assisted us on this project—Jennifer van Steele, Aimee Noelle Swanson, Christopher Armstrong, Jan Chong, Merle Ederhof, and Ravi Sarin.
2
describes MCS as a key element in knowledge intensive firms. Similarly, Chapman (1998) presents evidence consistent with this alternative view of the relevance of these systems in uncertain environments.
The objective of these empirical studies is to capture the association between
performance and the use of MCS. However, their research designs are less powerful to study the underlying mechanisms driving this association. This paper extends these empirical findings by further understanding the roles that MCS have in a highly innovative setting: new product development. In particular, we examine two related questions: (1) why companies adopt MCS in their product development processes, and based on the findings to the first question, (2) what is the relevance of partners in the design of these systems.
Yin (1988) proposes experiments, histories, and field research as research
strategies to address these exploratory questions. We designed a two-stage research process to address and partially generalize these questions. In the first stage, we use a field research design based on survey and interview data from 69 young high-technology firms. Guided by the literature, we develop a grounded theory (Glasser & Strauss, 1967) that identifies a typology of drivers for management systems in product development. Our findings indicate that these systems not only stimulate dialogue and idea creation; nor are they exclusively used as diagnostic systems to control execution; rather, an important objective is to stabilize an environment that, by the nature of the innovation process, is already rich in opportunities. MCS provide the infrastructure to anchor the innovation process to its objectives. We then use the typology developed to examine adoption decisions with time to adoption of MCS and product development performance.
In the second stage of the research, we use a survey-based research design to
generalize one of the findings from the first stage. In particular, we extend the argument that the presence of external partners affects the design of MCS to a larger population of firms. Consistent with this conjecture, the empirical results indicate that the presence of external partners is associated with more detailed plans, and more intense use of MCS during the project execution.
The paper brings a new perspective to the growing evidence on the relevance of
MCS to enhance the performance of organic structures (Kalagnanam & Lindsay, 1999) and in particular to innovation processes (Bisbe et al., 2004). The paper pursues this objective combining rich field-based and survey-based data in a two-stage research design. It diverges from prior research on several dimensions. First, the multi-case, multi-method field research design provides a depth and richness of data unique to this study. Second, the research design provides the quality and detailed data needed to propose a grounded theory (Glasser et al., 1967) to tentatively answer why MCS are adopted in innovation processes. Third, the study examines patterns between the drivers of MCS adoption and the organizational context in which the phenomenon happens. These insights advance our knowledge about the relevance of formal control procedures to enable innovation. Field research designs have proven to be effective in examining related research questions (Abernethy & Lillis, 1995; Ahrens & Chapman, 2004). Finally, the survey-based research design generalizes a subset of the field research findings to a larger population (Chenhall, 2003).
Conceptual framework
1. Limitations of management control systems A sizeable body of literature has examined how informal processes such as culture
(Tushman et al., 1997; Amabile, Conti, Coon, Lazenby, & Herron, 1996), communication
3
patterns (Dougherty, 1992), team composition, and leadership (Clark & Fujimoto, 1991) impact the process of innovation. The conclusions from these studies are unambiguous. Innovation processes such as product development benefit from a rich information environment built through multi-disciplinary teams that create the abrasiveness (Leonard-Barton, 1992) required for ideas to spark, intense communication inside the organization and with outside parties to nurtures ideas (Dougherty, 1992), a supportive organization that rewards experimentation (Tushman et al., 1997), and a strong leader with the authority to execute on the vision (Clark et al., 1991).
In contrast, the role of MCS has received less attention and the conclusions are
uncertain. On the one hand, these systems are viewed as stifling innovation (Tushman et al., 1997; Amabile, 1998; Ouchi, 1979). They constrain cross-functional interaction, limit communication to established patterns, penalize deviations, and diffuse leadership. Damanpour’s (1991) meta-analysis of empirical work on organizational determinants of innovation reports a negative association between innovation and formalization. The prevalence of the cybernetic control model reflected in the thermostat metaphor (Anthony, 1965) may account for this conclusion. This model views MCS as static, with the purpose of eliminating variation within organizational processes, and lacking the adaptability to fit the dynamics of innovation. They are viewed as action control mechanisms (Merchant, 1982) dictating the actions that organizational members have to follow and punishing deviations from rules and procedures. These systems reinforce the extrinsic, contractual relationships of hierarchical organizations. In high-innovation environments, they kill the intrinsic motivation and freedom that innovation requires (Amabile, 1998). According to this view, MCS are most useful when task analyzability is high and the number of exceptions is low (Perrow, 1970) such as low innovation settings. Empirical studies have confirmed these predictions. Abernethy and Lillis (1995) find that “spontaneous contact and “integrative liaison devices” which allow regular, personal and intensive contact” are more prevalent in flexible manufacturing firms while traditional performance measurement systems are de-emphasized. Abernethy and Brownell (1997) report higher reliance on personnel control in research and development departments. Rockness and Shields (1988) echo these conclusions.
2. Empirical evidence on the role of management control systems in innovative settings In spite of the previous arguments, evidence is accumulating that suggests a
positive effect of MCS in uncertain settings. Formalization is positively related to satisfaction in a variety of settings (Jackson & Schuler, 1985; Stevens, Philipsen, & Diederiks, 1992). Environmental uncertainty has repeatedly been associated with MCS (Khandwalla, 1972; Chenhall & Morris, 1986; Simons, 1987). Directly investigating the role of accounting in highly uncertain conditions, Chapman (1998) used four case studies and concluded, “the results of this exploratory study strongly support the idea that accounting does have a beneficial role in highly uncertain conditions” (page 738). Howard-Grenville (2003) used an ethnographic approach in one high-technology company to document the relevance of organizational routines to confront uncertain and complex situations.
Within product development, prescriptive recommendations to practitioners
emphasize the importance of MCS (McGrath, 1995). Several research studies have found that planning and well-coordinated project execution are associated with product success (Cooper, 1995; Zirger & Maidique, 1990). These studies hint to a relevant role of MCS although they fail to provide a theoretical justification for their findings (Brown & Eisenhardt, 1995). Using a control framework, Cardinal (2001) found that the three types of control systems—input, behavior, and output control—enhance radical innovation—
4
arguably the most uncertain type of innovation. Dávila (2000) reports a positive association between the use of management accounting information and product development performance. Brown and Eisenhardt (1997) describe successful product innovation as blending “limited structure around responsibilities and priorities with extensive communication and design freedom” so that “this combination is neither so structured that change cannot occur nor so unstructured that chaos ensues” (page 1).
These studies give several instances where innovation settings rely on MCS to
succeed. While they do not attempt to explain this association, their descriptions suggest a very different interpretation than the traditional cybernetic model.
3. Theoretical justifications for the role of MCS in innovative settings The empirical evidence in the previous sub-section hints at potential explanations
as to why MCS may be relevant to innovation. Conceptual work has elaborated these explanations and developed concepts to capture them.
Fiol (1996) in her summary of the innovation literature uses the sponge as an
analogy of the innovation process. The capability of an organization to innovate depends on its ability to assimilate, accumulate and exploit knowledge. This ability depends not only on its informal processes, but also on the formal mechanisms that support them, such as MCS. Simons’ typology (Simons, 1995) identifies interactive systems as information-based routines to identify knowledge required to address strategic uncertainties. They provide the infrastructure to engage organizational members in the communication pattern required to nurture Fiol’s first stage of innovation. One of the attractive features of the concept of interactive systems is that it allows top management to guide the search stage of the innovation process, without falling into the cybernetic model. Thus, the concept provides one of the first rationales to explain the relevance of MCS to innovation. Recent empirical studies (Abernethy et al., 1997; Bisbe et al., 2004) rely on interactive systems to examine MCS in uncertain environments, reflecting the relevance of the concept.
However, interactive systems only address the front end of the innovation process.
The concept of enabling bureaucracy (Adler et al., 1996) addresses the role of MCS throughout the stages of assimilation and exploitation of knowledge in Fiol’s analogy. Enabling bureaucracy is designed to “enhance the users’ capabilities and to leverage their skills and intelligence” (page 68) rather than with “a fool-proofing and deskilling rationale” typical of a cybernetic model. Thus, organizations assimilate and exploit the knowledge accumulated in the first stage through flexible, transparent, user-friendly routines. Ahrens and Chapman (2004) apply the concept of enabling bureaucracy to analyze the role of MCS in a field study setting. They describe how managers rely on an enabling use of these systems to cope with the uncertainty of day-to-day operations.
Another line of research offers additional arguments through the concept of
adaptive routines. Weick, Sutcliffe, & Obstfeld (1999) describe routines as resilient because of their capacity to adapt to unexpected events. This concept portrays routines as flexible to absorb novelty rather than rigid to suppress it. They offer organizational members a stable framework to interpret and communicate when facing unexpected events. They “usefully constrain the direction of subsequent experiential search” (Gavetti et al., 2000) (page 113). Reliability rather than replicability identifies routines in uncertain settings.
Feldman and Rafaeli (2002) extend this argument to include routines as drivers of
key patterns of communication among organizational members. Miner, Bassoff, & Moorman (2001) describe the constant interaction between routine activities and
5
improvisation in new product development. Routines provide the substrate for improvisation to happen and learning to accumulate. Zollo and Winter (2002) argue that dynamic capabilities are “routinized activities directed to the development and adaptation of operating routines” that organizations can purposefully manage through experience accumulation, knowledge articulation, and knowledge codification.
These concepts highlight the positive effect that MCS may have on innovation.
They contrast with the command-and-control view of the cybernetic model. Rather than viewed as a rigid mold that rejects the unexpected, MCS are flexible and dynamic frames adapting and evolving to the unpredictability of innovation, but stable to frame cognitive models, communication patterns, and actions.
4. Roles and adoption of MCS in product development In addition to the theoretical concepts supporting the relevance of MCS, the
literature also offers various roles of MCS in innovative settings: 1. Amabile (1998) indicates that innovation thrives when people are granted
freedom to achieve goals that are clear and stable for a sufficiently long period of time. She states “it is far more important that whoever sets the goals also makes them clear to the organization and that these goals remain stable for a meaningful period of time” (page 80). Uncertainty provokes a constant shift of priorities that may undermine the innovation process. MCS explicitly state goals, thus increasing their stability and visibility, facilitating convergence in meaning across organizational actors, and providing the steadiness and clarity that creativity requires.
2. Lundberg (1995) indicates that procedures help innovation by coding learning
from past experience (Levitt & March, 1988). Coded routines facilitate the diffusion of organizational capabilities across the organization and over time (Nelson & Winter, 1982; Powell, 1998). Coded learning also avoids incurring mistakes that have been experienced in the past and increases organizational efficiency. Information-based routines allow comparisons across sequential enactments of the routine and gauge progress over time. Benchmarking progress has been identified as a key element in the learning process (Gavetti et al., 2000).
3. Lundberg (1995) also points out the importance of coordinating different
innovation efforts across the organization. MCS decouple the efforts of organizational actors and reduce coordination cost through the explicit negotiation of local goals.
4. Similarly, process planning clarifies the sequence of steps to achieve certain
organizational goals and provides a blueprint for coordinating the innovation effort over time (Cohen et al., 1996).
5. MCS facilitate control by exception (Simons, 1995) where managerial
attention is required only if innovation results deviate from expectations.
6. MCS may also respond to external demands. External constituencies, such as partners, may impose these systems to enhance their monitoring within the firm. These intermediate milestones also facilitate contracting with outside

6
partners (Powell, 1998). Pfeffer and Salancik (1978) highlight the relevance of the external context in explaining how firms are organized.
7. Finally, new institutionalism (Powell & DiMaggio, 1991; Carruthers, 1995)
views cognitive processes as relevant to explain management systems. It identifies formal processes as symbolic to externally legitimize the organization through an appearance of competency. Innovation processes may require the rational symbol associated with formal systems to legitimize the work of the organization. Management systems do not fulfill as much a technical need as conforming to external demands decoupled from technical needs.
The previous list (summarized in Table 1 and illustrated with quotes from this
study) details the roles that the literature identifies for MCS. However, current knowledge or evidence on why these systems are adopted is limited. Moores and Yuen (2001) find that, as they expected, management systems are adopted in the growth stage of the firm. Davila (2005b) finds that, within the human resource function, the adoption of these systems is associated with the presence of external funding, size, age of the firm, and the replacement of the founder as CEO. These results suggest that external constituencies may affect adoption (to fulfill the last two roles identified); moreover the significance of size and CEO turnover might be related to failures in meeting the goals associated with the first six roles identified (Flamholtz, 2000).
Research method This study comprises two stages. In the first stage, we use a field research design to
investigate why companies adopt MCS in their product development process. To answer this question we sample from a population of young high-technology firms with a size between 50 and 150 employees. To capture the detail needed to answer the question, our data collection combines questionnaire and interview methods. The second stage of the research adopts a survey design approach. Its objective is to generalize beyond the initial sample a novel finding from the first stage. In particular, we examine whether technology-related partnerships in product development impose more structured MCS. In this second stage, we sample from a broader population of firms to generalize the findings beyond young high-technology firms.
1. Field research design To capture the richness needed to explore the initial research question, we adopt a
cross-sectional, multi-method, multi-case field research design. The aim of the cross-sectional multi-case design is to gather a large enough variance to document our research question, to capture the detail required to answer the questions, and to link contextual variables to the adoption of MCS. The multi-method design relies on qualitative data to identify patterns of behavior and quantitative data to examine covariates that may inform the research question. Our data includes questionnaire and semi-structured interviews on the adoption and role of MCS in young technology companies. Capturing the quality, depth, and richness to understand the experience of the actors (Seidman, 1998) demands detailed descriptions of the phenomena (Marshall & Rossman, 1995; Kvale, 1996). The focus of the study on product development as a relevant aspect of innovation processes drives the decision to sample among a population of technology companies. We expect product development to be a significant enough aspect of their strategy to have received
7
management attention. The sampling of a population of young firms is intended to capture the point in time when formal systems, if any, are adopted. This transition point is likely to be a recent event in the life of these firms and thus managers are expected to be able to better articulate the reasons for the research question.
2. Data sources For each company we collected as much information from public sources as
possible—such as company web pages and press releases from Lexis-Nexis. This information was used to familiarize the research team with the characteristics and products of each company before the actual data collection. Next, each company received three questionnaires—one for the CEO, another for the CFO, and a third one for the business development manager. The purpose of the questionnaire was to collect quantifiable information about the company and its processes. Appendix A reproduces the relevant questions.
The final phase of the data collection included semi-structured interviews with each
of the three managers. The objective of these interviews was to gain detail about the company, its history, its strategy and the adoption, design, and use of MCS. Each interview lasted between forty-five and ninety minutes. The interviews relied on a detailed protocol listing the questions to be addressed. The protocol insured that the main topics of the research were systematically covered during the conversation, but the semi-structured nature of the interview gave the flexibility of follow-up questions to clarify the particular practices at each company (Marshall et al., 1995). The relevant protocol questions are reproduced in Appendix B. Interviews were conducted in person or by phone and at least two researchers were present in every interview. Interviews were taped and then transcribed. The questionnaire, sent prior to the interview, facilitated focusing the interview around the key aspects of interest. The interview was also instrumental in clarifying answers to the questionnaire.
3. Sample description The final sample includes 69 young, high technology companies. The data
collection started in September 2002 and finalized in December 2003. Periodically during the data collection, we contrasted the incremental learning. By the end of the data collection, we felt that the sample captured a large variation in the population, reaching theoretical saturation (Glasser et al., 1967), and the sample was large enough to allow preliminary generalizations of the results.
We construct the sampled population using the following selection criteria: 1) high
technology, 2) less than 10 years old, 3) between 50 and 150 employees, 4) independent, and 5) in a limited geographic area.1 These criteria identify companies where product development is likely to be the foundation of their competitive advantage. They also identify companies more likely to have recently and independently transitioned through the stage of formalizing product development processes, rather than companies that have had systems in place for a long time or systems imposed by a parent company. We did not require firms to be public or private, foreign owned, or venture funded; however the majority of firms were private, domestically owned, and venture funded. The population of firms was sourced from the CorpTech Internet directory of technology companies. We 1 The main reason for the geographic criterion was research funding (more than fifty percent of the interviews were done at the companies’ premises). This decision also reduces the potential impact of omitted variables that may vary with geography and limits the generalizability of results.
8
accessed the database in January and June 2002 and built our sample from the following industries (using CorpTech industry classification): biotech (BIO), computer hardware (COM), manufacturing (MAN), medical equipment (MED), pharmaceuticals (PHA), photonics (PHO), computer software (SOF), subassemblies (SUB), test & measuring equipment (TAM), and telecommunications (TEL).2 We also purposefully over-sampled biotechnology firms because of their potential relevance as a growth industry. This sub-sample was extended using three additional databases particular to the industry: Rich’s high-tech business guide to Silicon Valley and Northern California (2000/2002), BioScan (Oct. 2001), and the U.S. Business Browser (c. 2001).
A letter addressed to the CEO was sent to every firm in the sample. The letter
described the purpose of the research, the research process, and the benefits of participating—a half-day conference where participating companies were invited to a presentation of the managerial implications of the research project and a written document of the findings. The letter was followed up with a phone call to entice participation; a company was dropped from the sample if it had not accepted or declined participation after five phone calls. We carefully documented the sample selection process as detailed in Panel A, Table 2. Excluding companies that were acquired, went out of business or are ineligible, the response rate is 20%. Companies acquired or that went out of business were significantly younger than the eligible sample but comparable in terms of sales and number of employees. Within the eligible sample, we compared companies that participated to those that did not, in order to assess potential self-selection bias; we found no significant differences in sales, number of employees and age.3 The final sample includes eleven biotechnology companies, 48 information technology companies, and ten companies in other industries; in addition, 62 received venture capital. Panel B, Table 2 provides additional descriptive statistics on the sample.
4. Data analysis The data analysis was structured in two stages. In the first stage, interview data was
coded—to summarize, interpret, and classify the information. To limit the potential bias inherent in the analysis of qualitative data, three researchers coded each one of the interviews. To systematically proceed through the coding process, each researcher used the Nvivo qualitative coding software. This software details the analysis from the raw data to the theoretical propositions, thus providing an auditable trail of the analysis. Because of the exploratory nature, each researcher may potentially identify different constructs that explain the observed patterns. To identify common constructs, the coding was done following a structured process. The sample was divided into two groups. The three researchers independently identified the main topics covered in each interview for one of the groups. The result was the dissection and reorganization of the original transcripts into broad topics. Then, the researchers met to contrast the topics that each one identified, agree on a common set of terms to identify them, and discussed any differences in interpretation of the transcripts. Next, the second group of interviews was independently coded using the common terminology. Finally, at the end of the process the team met to contrast the results of this second coding effort and discuss differences and new topics, if any. The objective of sub-dividing the sample into two groups is to contrast the model that emerges from the first
2 We excluded from these lists any companies that were also listed as “Energy,” “Environment,” “Chemical,” “Defense”, “Transportation” or “Non”. “Non” companies are not primarily high-tech companies. The other industries are excluded because they face a different regulatory and/or institutional environment. We also excluded organizations cross-listed in these industries. 3 We compared means and medians of sales, employees, and age (variables available from the databases that we accessed) for both groups in our sample. We also use the non-parametric Mann-Whitney test on these variables with identical conclusions.
9
analysis using a hold-up sample. The same process was iteratively used to analyze with increasing detail each of the topics until a stable set of constructs were identified that explained the phenomenon examined. The process evolved in an iterative and non-linear fashion, where the topics and constructs were revised to better capture the insights of the independent analyses. The end result is a set of typologies that describe different aspects of the adoption of MCS in new product development (Marshall et al., 1995).
The second stage of the analysis is intended to establish patterns leading to a
tentative formulation of a grounded theory (Strauss & Corbin, 1990). It combines survey data with the variables identified in the coding of the qualitative data to propose relationships among these variables (King, Keohane, & Verba, 1994). The findings reported in the paper are the end process of the analysis; however the audit trail documentation allows tracking the conclusions to the raw data.
Results
1. Adoption of management control systems in new product development Panel C in Table 2 provides descriptive statistics on the percentage of companies
adopting each of the product development systems identified for this research and the time-to-adoption since the founding of the company (Appendix A reproduces the relevant questionnaire items). Panel D in Table 2 gives the frequency distribution of the types of measures used to track product development and how often they are updated. These types of measures were coded based on the open-ended question to the questionnaire item about the three most important measures. The measures were coded by two researchers independently.
The iterative analysis of interview data identified six different drivers of the
adoption of MCS as well as unique experiences not significant from a statistical perspective, but relevant to understand how MCS can be used and to grasp the richness of the phenomenon examined. Panel A in Table 3 provides descriptive statistics and illustrative quotes for each of the drivers. These drivers are not exclusive of each other, and more than one can be present at different stages or for different systems within a company. For each driver, we report the number of observations where it was the main driver and the number of observations where it was a secondary driver.4
In certain observations, systems are adopted to legitimize the company vis-à-vis
external partners (Carruthers, 1995). They are not required from a management perspective, but they are adopted as a symbol (Macintosh, 1994) (chapter 9) to enhance the credibility of the company towards external parties—usually customers, partners, and investors. This role is consistent with the theoretical role summarized in Table 1 as number seven. Establishing a framework for the interaction with external parties is another external driver of MCS. External parties require visibility into the organization’s processes to monitor, coordinate, and control them (Pfeffer et al., 1978). Intra-organizational agreements lack the constant interactions required to ground informal management and the need to formalize the interface is enhanced in these situations. We labeled this situation as contracting to indicate the relevance of formal systems to implement the contract between the players (Otley & Berry, 1994; Dekker, 2004) and consistent with the role identified as number six in Table 1.
We also found evidence consistent with internal drivers of MCS adoption.
Managers may be proactive in that the systems are implemented ahead of the company 4 For each company we identified at least one driver (except if the process was still informal) and at most two drivers (a main one and a secondary one).

10
requiring them. We distinguish two different drivers: background and focus. Background captures those systems put in place when a particular manager comes to the firm because of this person’s prior experience. It is closely associated with congenital learning, where “individuals (…) have knowledge about (…) the processes the organization can use to carry out its creator’s intentions” (Huber, 1991) (page 91). These managers, usually with significant prior experience, perceive MCS as management infrastructure required to facilitate growth. Their behavior can be interpreted as mimetic (Powell et al., 1991), where they emulate practices from other organizations to reduce the cognitive uncertainty, although the narratives suggest a strong functionalist aspect. The second driver, focus, reflects managers who implemented systems because they perceived an emergent need. In contrast to the background drivers that are implemented regardless of their immediateness, focus drivers respond to a particular need—such as to coordinate a geographically dispersed workforce, increase organizational efficiency, or improve communication.
MCS may be adopted as a reaction to unexpected events, mistakes, or recurring
problems (Simons, 1995) (we label it as reactive to chaos). Lack of skills or lack of resources may delay the adoption of systems until constant failures in the informal processes force it (Flamholtz, 2000). In most circumstances, chaos was unintended and managers were ill-prepared to deal with it; in one of our observations, however, the manager purposefully used chaos to drive the need for change.
A final category that we labeled as reactive to learning was the outcome of the
enactment process (Weick, 1995). While the outcome was a more efficient organization, this category is different from the proactive focus category in that formal systems emerged as the outcome of a learning process. It was not managers who decided to implement systems because of a particular need, but systems emerged to code existing practices. In some cases, the coding was triggered by certain events. For instance, in one of the companies the growth associated with the economic boom of the late nineties triggered the coding of processes: “we developed (the systems) over the years doing them ourselves, we know what we need to have; we have a project binder that has sections in it. (…) It came into existence in ’99 during the boom; we needed better managed projects because we had so many things going on. We were forced to execute these projects efficiently so we could get to the next one.” But in most cases, the formalization grew out of the periodic enactment of an informal routine.
Panel A in Table 3 also identifies cases where an informal management approach
was used. We limit the count to companies that explicitly mentioned this approach. The reasons for maintaining an informal approach include: (1) team has worked together for a long time and their informal interactions are well-understood but not coded, (2) management team believed that formal systems would kill creativity, (3) the organization was not considered to be large enough to grant MCS, and (4) management team did not have the knowledge to implement these systems.
In contrast to external drivers of adoption, internal drivers do not directly map into
the roles identified in Table 1. During the coding process, the categories that appeared to better describe the data were not so much the particular roles that the systems adopted were intended to fulfill as the reasons why they were adopted (the situation that led to the adoption). While this coding better reflects the underlying data, the interviews provide illustrations of MCS’ roles consistent with Table 1. Relevant quotes are included in Table 1 to exemplify each of the theory-based roles.
Once adopted, MCS remain as part of the management infrastructure and evolve.
Frequently, interviewees described the systems as “becoming more and more sophisticated.” In a few settings, MCS can be a time-bounded solution to achieve a certain objective. For
11
example, a new CEO in the sample formalized the product selection process to focus the organization and then dropped it as the organization understood the new strategy. Managers also gave instances of MCS stifling innovation (Panel B, Table 3 for illustrative quotes) and the need to adapt MCS “within the context of a company of our size (…) the minimum that we need to accomplish without putting artificial requirements, barriers, or roadblocks that slow us down.”
Panel C in Table 2 presents the descriptive statistics related to the source of
knowledge used in designing management systems. Internal managers designed MCS in the majority of cases. Typically, the design is a process of knowledge creation where tacit knowledge (Nonaka, 1990), spread over various people in the organization, is codified. In some cases, the knowledge is “hired” together with a person—a process labeled “grafting” (Huber, 1991). One of the companies in the sample hired a product development manager from one of the largest semiconductor companies in the world, who designed the systems based on “(the large company’s) way of doing things.” External designers are rarer and usually reflect the contracting process with partners or buying external technology (software) to manage processes.
2. Time to adoption of management control systems and impact on performance This section examines whether the typology is relevant in explaining management
processes in new product development. We address two issues. First, we test whether the various drivers identified as being associated with the
adoption of MCS in product development are associated with different timing of adoption. The six drivers described in Table 3 are event-driven—whether an external party demands to see the processes in place, a partnership is entered into, a new manager is hired, needs emerge, problems arise, or the informal practices are formalized. Therefore, the adoption depends on whether a particular event happens and there is no clear directional expectation. However, we expect that companies that still keep an informal approach will report adopting systems later than the rest of the companies in the sample. It is also plausible that companies adopting because of learning-by-doing will adopt later than the rest of companies, as long as any of the events that trigger the adoption of the systems are likely to happen early in the life of a company. We examine the potential effect of the various drivers on the time to adoption of MCS in product development using a Cox specification (Davila, 2005b; Hellmann & Puri, 2002). This specification models the time to an event (for instance, adopting a particular system). In this particular case, we report the time to adoption of product development milestones, which is the system adopted most often in our sample. We asked both the CEO and the business development person for the adoption date and the kappa statistic of inter-rater agreement was significant at the 1% level. Table 4 reports the results. Our dependent variable is the time to adoption of product development milestones as reported by the business development manager.5 Our independent variables are dummy variables that take the value of one for those companies where a particular driver for adoption was identified (during the interview coding), regardless of whether it is the main or secondary driver. The coefficients reported are hazard ratios. A coefficient on the independent variables greater (or less) than one means that higher values for the independent variables are associated with shorter (longer) time to adoption.6 Except for learning and contracting, the other four drivers are associated with significantly faster adoption than the reference group, which still uses an informal approach. However, we find 5 The conclusions are unchanged if we use the date of adoption reported by the CEO or we use time to adoption of product development progress or product development budgets, which are the next two systems in terms of popularity in the sample. 6 The hazard ratio is eβ. The reported standard error is the one associated with the hazard ratio.
12
no significant differences among the various groups (other than background being significantly faster than legitimize). This result suggests that the description in the interviews is consistent with informal approaches taking longer to adopt a particular system; and that no particular driver is associated with faster adoption—consistent with these drivers being associated with random events.
Our second test examines the association between product development
performance and the six drivers described in Panel A, Table 3. If MCS are relevant to performance (and assuming that the ones adopted are designed for the specific needs of the company—in other words, the MCS adopted are not dysfunctional), then we expect different drivers to be associated with performance. In particular, we expect proactive drivers (background and focus) and learning by doing to be associated with better performance. Companies in these groups adopt MCS as a way to facilitate product development management, in contrast with firms in the other groups—external drivers, chaos and informal—where firms are forced into adopting MCS. The dependent variable takes a value of 0 for companies where product development projects are late (43 observations) and 1 if they are on-time or early (21 observations). We lost five observations for companies that chose not to disclose product development performance. We chose a dummy variable because companies have very different types of projects running at the same time—large projects to develop a new platform, medium projects to develop particular functions, and shorter projects to adapt the product to a particular customer—and respondents often left blank the questionnaire item on how late projects are because, as they explained during the interview, it varied across types of projects and within particular types of projects. The dependent variables are as in Table 4. Table 5 reports the results. Background driven companies perform significantly better than companies adopting as a reaction to chaos and focus. Learning by doing companies perform better than contract and chaos. Contrary to expectations, focus companies perform worse than informal management firms (which perform better than contract, focus, and chaos) and do not perform significantly better than any of the other categories.
Partners and management control systems in new product development Among the conclusions from our field research, we identified external
constituencies—mainly customers and partners—as relevant to understand the adoption of MCS. This finding is consistent with the role of external control (Pfeffer et al., 1978), signaling (reputation and symbolism and institutionalism) (Macintosh, 1994), and economics (facilitate contracting) (van der Meer-Kooistra & Vosselman, 2000). The hypothesis that these various theories put forward is that the relevance of external constituencies leads to more structured processes (governed through MCS): “there is increased monitoring and control between organizations” (Otley et al., 1994) (page 293). While theory is clear-cut in its predictions, empirical evidence on the relevance of MCS in inter-organizational settings is limited (Dekker, 2004). Our field research findings provide initial support to theoretical predictions. However, these findings rely on extending theory to the adoption rather than the design of MCS. In an effort to generalize our conclusions beyond the original sample of small firms to a population of larger firms and from adoption to MCS design, we extend the study to a different sample of firms using a survey-based research methodology.
13
1. Design of the survey research The research design that we adopted to extend this study is a survey-based design.
While this approach sacrifices the detail that we were able to capture in our field research, it better fits the objective of this second stage of the research project. Namely, generalizing one of our findings—which is consistent with existing theory—to a larger population. In particular, the survey addresses the following research question: is the involvement of partners associated with more formalized MCS? The question extends our conclusions about the adoption of MCS in growing firms to the design of MCS in larger firms.
The population sampled is the list of contacts of a large innovation management
consulting firm. This population was selected because companies in contact with this type of consulting firm are likely to be large companies with significant innovation efforts. The survey was sent to the contact person in each firm, who was asked to forward it to the person most knowledgeable if required. Two weeks later a reminder was sent. Also, we informed the participants that they would receive a summary of the results of the survey. A total of 490 questionnaires were sent for a response rate of 18%. Table 6 describes the industry composition of the sample.
We examine three different aspects associated with the formalization of MCS: 1)
the level of detail in the product development project plan, 2) the use of the project plan during the execution of the project, and 3) the use of metrics during the execution of the project. Factor analysis identified three different factors associated with the level of detail of the project plan. The first factor is the actual level of detail in the plan (Plan detail), the second factor is the stability of project objectives as detailed in the project plan (Plan risk), and the third factor is the detail in the project plan about the future of the product being developed (Future detail). The use of the project plan during the execution loaded into one factor (Use plan). The use of metrics loaded into two factors, one consistent with an interactive use of the metric system (Simons, 1995), labeled Metric inform, and another one consistent with a diagnostic use, labeled Metric control. Each item was measured using a 5-point scale anchored between fully disagree (1) and fully agree (5) and the variables were constructed as the sum of the questionnaire items. Panel A in Table 7 presents the wording of the various questionnaire items, their descriptive statistics, and the reliability index (Cronbach alpha).
We measured involvement of partners in new product development with a seven-
item instrument (Heide & John, 1992; Zaheer, McEvily, & Perrone, 1998), using a 5-point scale anchored between fully disagree (1) and fully agree (5). The seven items are detailed in Panel B of Table 7. In addition, we controlled for four additional variables that may affect the formalization of MCS: 1) technology uncertainty, measured using six items (Dávila, 2000); 2) the logarithm of the number of projects that the organization executes each year; 3) the logarithm of the length of a typical product development project (in months); and 4) the number of functions included in cross-functional teams. Formalization may be less useful for more uncertain projects where an organic structure may be a better fit (Chenhall, 2003) and for projects managed through cross-functional teams where informal communication may replace formal systems. Conversely, formalization may be more significant for companies that develop more projects through the codification of learning and the increase in efficiency and for companies with larger projects that require more coordination.
Table 8 presents the correlation table. Higher partner involvement is positively and
significantly correlated with the various variables associated with increased formalization. As expected, the various measures of control system formalization are positively correlated among them.
14
2. Research findings To test the relevance of partner involvement in the formalization of MCS, we relied
on a cross-sectional latent variable regression model estimated using Partial Least Squares (PLS) (Wold, 1985). PLS allows the joint evaluation of the measurement and structural models. The use of a latent variable model is intended to mitigate the impact of measurement error in the structural equation coefficients, thus enhancing the power of the tests (Ittner, Larcker, & Rajan, 1997). PLS iteratively estimates the measurement and structural coefficients using OLS regressions (Anderson, Hesford, & Young, 2002). Bootstrapping (300 samples with replacement) is used to assess the significance of the model coefficients.
Our first model examines the association between partner involvement and our
various proxies of MCS—Plan detail, Plan risk, Future detail, Use plan, Metric inform, and Metric control—after controlling for additional variables that may affect the design of MCS: uncertainty, project length, use of cross-functional teams, and number of projects. Specifically, we estimate the following structural model:
Formalization of MCS = β0 + β1 Partners + β2 Technology uncertainty + β3 Ln(Project length) + β4 Cross-functional team + β5 Ln(Number of projects) + Industry controls + ε
If partners have any influence on the design of MCS, we expect β1 to be positive
and significant. We estimate a different model for each of the six MCS formalization variables. Table 9 presents the results. The coefficients in the measurement model (Panel A) are significant and in the expected direction. Panel B presents the results for the structural model. Partner involvement is significant in each of the structural models except for Metric inform. This result is broadly consistent with the expectations derived from the conclusions of the field research and theoretical predictions: A higher degree of partner involvement is associated with various constructs associated with formalization of MCS. In addition to significant industry effects (not reported), technology uncertainty is positively associated with two measures of formalization: Future detail and Metric inform. These associations suggest that formalization may be beneficial in uncertain environments, in line with the idea of enabling bureaucracies (Adler et al., 1996) and consistent with previous findings (Gordon & Narayanan, 1984; Simons, 1987). As an alternative statistical specification, we built the latent variables as the sum of the item scores and ran the structural model using an OLS specification. The results were comparable.
The previous specification treated each of the formalization variables as separate
dimensions of formalization. An alternative view suggests that these variables represent two distinct phases of the control process: planning and execution (Anthony, 1965). From this perspective, the variables Plan detail, Plan risk, and Future detail capture the formalization of the planning process—before the actual operational process is executed. The variables Use plan, Metrics inform, and Metrics control reflect the formalization of MCS during the execution of the operational process. The effectiveness of the execution variables may depend on the planning variables. In other words, the ability to control the execution of a process depends on the formalization of the planning process (Anthony, 1965; Simons, 2000). If the planning variables mediate the relationship between the exogenous variables and the execution variables, the significant effect of Partners upon Use plan and Metric control may be due to the relevance of Partners in explaining the planning variables.
We model the mediating effect of planning variables as described in Figure 1. We
model partners’ relevance as affecting both the three planning MCS variables and the execution MCS variable. To model the effect of the control variables in a parsimonious way, we rely on the results from Table 9. In particular, we include the most significant
15
exogenous variables as a path to the endogenous variables in the PLS model. Table 10 reports the results for the structural model. Panel A examines the effect on the execution MCS variable Use plan; column (1) reports the path coefficients from the exogenous and planning variables to this execution MCS variable; columns (2) to (4) report the path coefficients from planning variables to the execution variable. Panel B looks at Metrics inform and Panel C at Metrics control. The direct effect of Partners is only significant for Metrics control. Plan detail is significantly associated with all three MCS execution variables, suggesting that more detail in the plan allows this planning effort to be used during the execution of the innovation projects. This result provides evidence on the association between the levels of formalization during the planning and execution of a product development project. In contrast, Plan risk is not significant, while Future detail is significant for Use plan but negative and significant for Metric control.
Table 11 examines whether the previous findings have any relevance to the
perceived performance of the firm. To assess this relationship, we regressed each of the formalization variables, the relevance of partners and the interaction of the formalization variables with Partners to explain innovation performance. This Performance variable is the sum of three questionnaire items (reported in Appendix C) where respondents were asked to evaluate, on a 5-point scale, the gap between their company’s current position and where it should be for derivative, new and breakthrough products. This gap measure was subtracted from the maximum gap in the sample to have higher values of the variable being associated with a smaller gap and therefore better performance. If higher level of formalization leads to better relationships with partners, we expect the interaction term to be positive and significant. The first column examines the direct effects without interactions. Only Technology uncertainty and Number of projects are positive and significant, indicating that companies that see themselves as facing more technological uncertainty and those with more product development projects perceive themselves as performing better. None of the formalization variables or the MCS variables is significant. The rest of the columns report the effect of interaction terms. The presence of partners and plan detail has a negative impact upon performance. A potential explanation for this observation is that plan detail constrains the relationships with partners. However, the interaction of another planning variable—future detail—with partners is positive and significant. The interaction of two execution variables—metric inform and metric control—with partners is positive and significant. Overall, these results suggest that MCS have a positive effect on leveraging partners in product development.
Conclusions The aim of this paper is to bring detailed evidence on the enabling role that MCS
may have in innovative settings. The paper presents two sequential studies. The first one, a multi-case, multi-method field research design, examines how MCS are adopted in the product development process of young firms. Data includes detailed descriptions of the phenomenon including quantitative and qualitative information. The analysis indicates that in contrast to the theory approach—which describes MCS in innovative settings as fulfilling a set of roles—the variance in the adoption of MCS is not driven as much by certain roles that need to be fulfilled as by events that trigger the adoption. We identify external drivers of adoption when firms adopt MCS because of external pressures—consistent with the external control concept (Pfeffer et al., 1978), the concept of legitimizing (Powell et al., 1991), and the contracting process (van der Meer-Kooistra et al., 2000). We also identify internal drivers, including proactive ones, as when systems are adopted because of a manager’s background—frequently systems are brought to the firm with the hiring of a particular manager, or when a manager with systems knowledge decides to implement the

16
system because the organization has reached a certain maturity point. Internal drivers also include reactive drivers, when systems are adopted as a reaction to a mistake or failure or when systems emerge as the formalization of an ongoing informal routine. The paper also examines the impact of these drivers on the management of product development.
The second study aims at generalizing a particular finding from the first study—the
relevance of external parties to the adoption of MCS. This second study extends the argument from the influence of these parties on the adoption process to their influence on the detail of MCS in larger firms—an argument more in line with theoretical predictions. Using a survey-based design, the study finds that the presence of technological partners is associated with a higher degree of formalization and that the presence of these partners and a higher degree of formalization is associated with improved perceived performance.
17
References
Abernathy, M. & Brownell, P. 1999. The role of budgets in organizations facing strategic change: An exploratory study. Accounting, Organizations and Society, 24(3): 189-204.
Abernethy, M. A. & Lillis, A. M. 1995. The impact of manufacturing flexibility on management control system design. Accounting, Organizations and Society, 20: 241-258.
Abernethy, M. A. & Brownell, P. 1997. Management control systems in research and development organizations: The role of accounting, behavior and personnel controls. Accounting, Organizations and Society, 22: 233-249.
Adler, P. S. & Borys, B. 1996. Two types of bureaucracy: Enabling and Coercive. Administrative Science Quarterly, 41(1): 61-89.
Ahrens, T. & Chapman, C. S. 2004. Accounting for Flexibility and Efficiency: A Field Study of Management Control Systems in a Restaurant Chain. Contemporary Accounting Research, 21: 271-301.
Amabile, T. M., Conti, R., Coon, H., Lazenby, J., & Herron, M. 1996. Assessing the work environment for creativity. Academy of Management Journal, 39: 1154-1184.
Amabile, T. M. 1998. How to kill creativity, Harvard Business Review, 76: 76-81. Anderson, S. W., Hesford, J. W., & Young, S. M. 2002. Factors influencing the
performance of activity based costing teams: a field study of ABC model development time in the automobile industry. Accounting, Organizations & Society, 27: 195-239.
Anthony, R. N. 1965. The management control function. Boston, MA: Harvard Business School Press.
Bisbe, J. & Otley, D. 2004. The effects of the interactive use of management control systems on product innovation. Accounting, Organizations & Society, 29: 709-737.
Brown, S. L. & Eisenhardt, K. M. 1995. Product development: Past research, present findings, and future directions. Academy of Management Review, 20: 343-378.
Brown, S. L. & Eisenhardt, K. M. 1997. The art of continuous change: Linking complexity theory and time-paced evolution in relentlessly shifting organizations. Administrative Science Quarterly, 42: 1-34.
Burns, T. & Stalker, G. M. 1961. The management of innovation. London: Tavistock. Cardinal, L. 2001. Technological innovation in the pharmaceutical industry: The use of
organizational control in managing research and development. Organization Science, 12(1): 19-36.
Carruthers, B. G. 1995. Accounting, ambiguity, and the new institutionalism. Accounting, Organizations and Society, 20(4): 313-328.
Chapman, C. S. 1998. Accountants in organisational networks. Accounting, Organizations and Society, 23(8): 737-766.
Chenhall, R. H. & Morris, D. 1986. The impact of structure, environment, and interdependence on the perceived usefulness of management accounting systems. Accounting Review, 61(1): 16-35.
Chenhall, R. H. 2003. Management control systems design within its organizational context: findings from contingency-based research and directions for the future. Accounting, Organizations and Society, 28: 127-168.
Clark, K. & Fujimoto, T. 1991. Product development performance. Boston, MA: Harvard Business School Press.
Cohen, M. D., Burkhart, R., Dosi, G., Egidi, M., Marengo, L., Warglien, M., & Winer, S. G. 1996. Routines and other recurring action patterns of organizations: Contemporary research issues. Industrial and Corporate Change, 5: 653-698.
Cooper, R. G. 1995. Developing new products on time, in time. Research Technology Management: 49-57.
Damanpour, F. 1991. Organizational innovation: A meta-analysis of effects of determinants and moderators. Academy of Management Journal, 34(3): 555-590.
18
Dávila, T. 2000. An empirical study on the drivers of management control systems’ design in new product development. Accounting, Organizations and Society, 25(4,5): 383-409.
Dávila, A. 2005a. The promise of management control systems for innovation and strategic change. In C. S. Chapman (Ed.), Controlling Strategy: Management, Accounting, and Performance Measurement. Oxford: Oxford University Press.
Dávila, T. 2005b. An exploratory study on the emergence of management control systems: Formalizing human resources in small growing firms. Accounting, Organizations and Society, 30(3): 223-248.
Dekker, H. C. 2004. Control of inter-organizational relationships: evidence on appropriation concerns and coordination requirements. Accounting, Organizations & Society, 29: 27-50.
Ditillo, A. 2004. Dealing with uncertainty in knowledge-intensive firms: the role of management control systems as knowledge integration mechanisms. Accounting, Organizations & Society, 29: 401-422.
Dougherty, D. 1992. Interpretative barriers to successful product innovation in large firms. Organization Science, 3: 179-202.
Feldman, M. S. & Rafaeli, A. 2002. Organizational routines as sources of connections and understandings. Journal of Management Studies, 39: 309-332.
Fiol, C. M. 1996. Squeezing harder doesn’t always work: Continuing the search for consistency in innovation research. Academy of Management Review, 21(4): 1012-1021.
Flamholtz. 2000. Growing pains: transitioning from an entrepreneurship to a professionally managed firm (2nd ed.; 1st edition, 1990). San Francisco, CA: Jossey-Bass.
Gavetti, G. & Levinthal, D. 2000. Looking forward and looking backward: Cognitive and experiential search. Administrative Science Quarterly, 45: 113-137.
Glasser, B. & Strauss, A. 1967. The Discovery of Grounded Theory. Chicago, IL: Aldine. Gordon, L. A. & Narayanan, V. K. 1984. Management accounting systems, perceived
environmental uncertainty and organizational structure: an empirical investigation. Accounting Organizations and Society: 33-47.
Heide, J. B. & John, G. 1992. Do norms matter in marketing relationships? Journal of Marketing, 56: 32: American Marketing Association.
Hellmann, T. & Puri, M. 2002. Venture capital and the professionalization of start-up firms: Empirical evidence. Journal of Finance, 57(1): 169-198.
Howard-Grenville, J. A. 2003. Making it work: The resilience of organizational routines. Working paper, Boston University.
Huber, G. P. 1991. Organizational learning: The contributing processes and the literatures. Organization Science, 2(1): 88-115.
Ittner, C., Larcker, D., & Rajan, M. 1997. The choice of performance measures in annual bonus contracts. Accounting Review, 72: 231-255.
Jackson, S. E. & Schuler, R. S. 1985. A meta-analysis and conceptual critique of research on role ambiguity and role conflict in work settings. Organizational Behavior and Human Decision Process, 36: 17-78.
Kalagnanam, S. S. & Lindsay, R. M. 1999. The use of organic models of control in JIT firms: generalising Woodward’s findings to modern manufacturing practices. Accounting, Organizations & Society, 24: 1-30.
Khandwalla, P. N. 1972. The effect of different types of competition on the use of management controls. Journal of Accounting Research: 275-285.
King, G., Keohane, R. O., & Verba, S. 1994. Designing Social Inquiry: Scientific Inference in Qualitative Research. Princeton, NJ: Princeton University Press.
Kvale, S. 1996. Interviews: An Introduction to Qualitative Research Interviewing. Thousand Oaks, CA: Sage Publications.
Leonard-Barton, D. 1992. Core capabilities and core rigidities: A paradox in managing new product development. Strategic Management Journal, 13: 111-125.
19
Levitt, B. & March, J. G. 1988. Organizational learning. Annual Review of Sociology, 14: 319-340.
Lundberg, C. C. 1995. Learning in and by organizations: Three conceptual issues. International Journal of Organizational Analysis, 3: 10-24.
Macintosh, N. B. 1994. Management Accounting and Control Systems. Toronto: John Wiley & Sons.
Marshall, C. & Rossman, G. B. 1995. Designing Qualitative Research. Thousand Oaks, CA: Sage Publications Inc.
McGrath, M. D. 1995. Product strategy for high-technology companies. New York, NY: Richard Irwin, Inc.
Merchant, K. A. 1982. The control function of management. Sloan Management Review, 23(4): 43-56.
Miner, A. S., Bassoff, P., & Moorman, C. 2001. Organizational improvisation and learning: A field study. Administrative Science Quarterly, 46(304-337).
Moores, K. & Yuen, S. 2001. Management accounting systems and organizational configuration: A life-cycle perspective. Accounting, Organizations and Society, 26: 351-389.
Nelson, R. R. & Winter, S. G. 1982. An Evolutionary Theory of Economic Change. Cambridge, MA: Harvard University Press.
Nonaka, I. 1990. Redundant, overlapping organization: A Japanese approach to managing the innovation process. California Management Review, 32: 27-38.
Otley, D. T. & Berry, A. J. 1994. Case study research in management accounting and control. Management Accounting Research, 5(1): 45-65.
Ouchi, W. 1979. A conceptual framework for the design of organizational control mechanisms. Management Science, 25: 833-848.
Perrow, C. 1970. Organizational Analysis: A Sociological View. New York, NY: Tavistock Publications.
Pfeffer, J. & Salancik, G. R. 1978. The external control of organizations: A resource dependence perspective. New York, NY: Harper & Row.
Powell, W. W. & DiMaggio, P. J. 1991. The new institutionalism in organizational analysis. Chicago: University of Chicago Press.
Powell, W. W. 1998. Learning from collaboration: Knowledge and networks in the biotechnology and pharmaceutical industries. California Management Review, 40: 228-240.
Rockness, H. O. & Shields, M. D. 1988. Organizational control systems in research and development. Accounting, Organizations and Society, 9: 165-177.
Seidman, I. 1998. Interviewing as Qualitative Research: A Guide for Researchers in Education and the Social Sciences. New York: Teachers College Press.
Simons, R. 1987. Accounting control systems and business strategy: An empirical analysis. Accounting, Organizations and Society, 12(4): 357-375.
Simons, R. 1995a. Levers of control: how managers use innovative control systems to drive strategic renewal. Boston, MA: Harvard Business School Press.
Simons, R. 2000. Performance measurement and control systems for implementing strategy. Upper Saddle River, NJ: Prentice Hall.
Stevens, F., Philipsen, H., & Diederiks, J. 1992. Organizational and Professional Predictors of Physician Satisfaction. Organization Studies, 13: 35-50.
Strauss, A. & Corbin, J. 1990. Basics of Qualitative Research. Thousand Oaks, CA: Sage Publications.
Tushman, M. L. & O’Reilly III, C. A. 1997. Winning through Innovation: A practical guide to leading organizational change and renewal. Boston, MA: Harvard Business School Press.
van der Meer-Kooistra, J. & Vosselman, E. G. J. 2000. Management control of interfirm transactional relationships: the case of industrial renovation and maintenance. Accounting, Organizations & Society, 25: 51-77.
20
Weick, K. E. 1995. Sensemaking in organizations. Thousand Oaks, CA: Sage. Weick, K. E., Sutcliffe, K. M., & Obstfeld, D. 1999. Organizing for high reliability:
Processes of collective mindfulness. In R. I. Sutton & B. M. Staw (Eds.), Research in Organizational Behavior. Stamford: JAI Press.
Wold, H. 1985. Partial Least Squares. In S. Kotz & N. L. Johnson (Eds.), Encyclopedia of Statistical Sciences, Vol. 6: 581-591. New York, NY: Wiley.
Yin, R. K. 1988. Case Study Research: Design and Methods. Newbury Park, CA: Sage Publications.
Zaheer, A., McEvily, B., & Perrone, V. 1998. Does Trust Matter? Exploring the Effects of Interorganizational and Interpersonal Trust on Performance. Organization Science: A Journal of the Institute of Management Sciences, 9: 123-142.
Zirger, B. J. & Maidique, M. A. 1990. A model of new product development: An empirical test. Management Science, 36(7): 867-884.
Zollo, M. & Winter, S. G. 2002. Deliberate Learning and the Evolution of Dynamic Capabilities. Organization Science, 13: 339-352.

21
Tab
le 1
. T
heor
itic
al r
oles
of
MC
S in
inno
vati
ve s
etti
ngs
M
CS
role
s in
inno
vati
ve s
etti
ngs
Illu
stra
tion
s of
the
se r
oles
1.
Mak
e go
als
expl
icit,
st
able
an
d vi
sibl
e to
pr
ovid
e co
nver
genc
e in
mea
ning
acr
oss
acto
rs
“Mys
elf
and
a co
uple
of
the
othe
r fo
lks
here
thou
ght
we’
d be
tter
put
a s
truc
ture
in p
lace
whe
re
we
wri
te a
spe
cifi
catio
n (…
) an
d at
som
e po
int
we
free
ze i
t an
d th
en w
e de
velo
p ag
ains
t it.
(…
) A
nd it
’s a
cha
llen
ge b
ecau
se y
ou h
ave
a m
ovin
g ta
rget
mos
t of
the
tim
e, b
ut t
he r
ealit
y is
if
tha
t sp
ecif
icat
ion
chan
ges
on t
oo d
ynam
ic a
bas
is, t
here
’s n
o w
ay r
eall
y a
tech
nolo
gy t
eam
to
exe
cute
aga
inst
it.”
2.
C
ode
lear
ning
fro
m p
ast
expe
rien
ce t
o av
oid
past
mis
take
s an
d in
crea
se e
ffic
ienc
y “I
t is
very
impo
rtan
t tha
t the
pro
cess
is f
ollo
wed
bec
ause
we
have
don
e te
rrib
le w
hen
we
don’
t fo
llow
the
proc
ess,
so
we
are
now
ver
y m
etic
ulou
s ab
out f
ollo
win
g it.
”
3.
Hel
p in
coo
rdin
atin
g in
nova
tion
eff
orts
acr
oss
diff
eren
t par
ts o
f th
e or
gani
zati
on
“The
com
pany
was
som
ewha
t m
ore
cont
enti
ous
and
mor
e fr
actu
red,
and
(pu
ttin
g in
pla
ce
prod
uct
deve
lopm
ent
proc
esse
s) w
as t
he o
nly
way
to
get
ever
yone
uni
fied
on
a co
mm
on p
lan
of a
ttac
k.”
4.
Pla
n th
e se
quen
ce o
f st
eps
that
lea
d to
sta
ted
goal
s, h
elp
coor
dina
tion
ove
r ti
me
“The
foc
us i
s on
und
erst
andi
ng r
epor
ting
pro
gres
s to
war
ds a
chie
ving
an
impo
rtan
t m
ilest
one;
w
hat
the
unde
rlyi
ng c
ause
s ar
e fo
r w
hat
we’
re s
eein
g an
d w
hat
the
plan
s ar
e, n
ext
step
s th
at
are
bein
g ta
ken.
(…
) S
ched
ule
is im
port
ant,
but i
t is
only
the
star
t of
the
conv
ersa
tion.
”
5.
Fac
ilita
te
cont
rol
by
exce
ptio
n w
hen
inno
vatio
n re
sults
dev
iate
fro
m e
xpec
tatio
ns
“The
be
nefi
ts
of
(pro
duct
de
velo
pmen
t pr
oces
s)
form
aliz
atio
n is
th
at
you
get
mor
e ac
coun
tabi
lity.
I th
ink
it is
ver
y ea
sy f
rom
an
engi
neer
ing
pers
pect
ive
to s
ay I
can
do
that
. (…
) W
hat
you
get
is (
a) y
ou c
an h
it th
at e
xpec
tati
on i
n a
tim
ely
man
ner,
and
(b)
dev
elop
fea
ture
s th
at m
eet t
he m
arke
t on
tim
e. (
…)
As
the
com
pany
mat
ures
, peo
ple
get
mor
e ac
coun
tabl
e.”
6.
Coo
rdin
ate
and
cont
ract
w
ith
exte
rnal
pa
rtne
rs
“The
fi
rst
prod
uct
road
m
ap
was
on
e sp
ecif
ical
ly
that
w
e de
velo
ped
for
shar
ing
wit
h M
icro
soft
.”
7.
Sym
bols
to
legi
tim
ize
the
orga
niza
tion
in
its
envi
ronm
ent
“Wha
t (o
ur c
usto
mer
) sa
id w
as ‘
I w
ant
to s
ee w
hat
proc
esse
s ha
ve y
ou i
nstit
uted
in
your
sy
stem
? W
e ar
e go
ing
to b
uy v
ersi
on 5
.0 o
f yo
ur p
rodu
ct,
I w
ant
to s
ee w
hat
you
did
from
ve
rsio
n 3.
0, 4
.0, 5
.0. W
hat
wer
e th
e m
iles
tone
s? W
hat
bugs
did
you
fix
? W
hat
was
the
tes
ting
it
wen
t th
roug
h?’
We
had
done
all
thos
e th
ings
but
we
didn
’t h
ave
the
docu
men
tatio
n. S
o w
e ha
d to
sho
w t
hem
and
to b
e ca
ndid
(re
crea
te it
).”
22
Tabla 2. Sample descriptive statistics
Panel A: Sample construction
Companies in the initial database 624 Minus Companies that went out of business 94 Companies acquired 88 Companies ineligible in some other way1 102 Companies that did not respond2 158 Companies that declined participation 113
Final sample of companies 69
1 These companies are too small, too old, or subsidiaries of other companies. 2 These are companies that did not respond to the five telephone contacts.
Panel B: Sample descriptive statistics Mean Std. Dev. Q1 Median Q3
Number of CEOs 1.73 0.80 1 2 2 Age 7.42 2.33 5 7 9 Employees1 119 62.6 72 114 160 R&D intensity (%)2 0.39 0.26 0.16 0.38 0.61 Revenues (‘000)3 10,691 11,711 2,468 7,14 15,156 Profit (‘000)3 -10,175 15,598 -12,139 -5,4 -18 Funding4 52,441 59,865 8,963 39,3 72,75
1 Number of employees is calculated at the peak of each company’s size. 2 R&D employees are estimated as a percentage of total employees defined as the sum of R&D employees for each of the years reported divided by the sum of total employees for those same years. Only companies that reported R&D employees are included. 3 Revenues and profits are for the last year of data available. 4 Funding is the total external funding for each company.
23
Table 2 (continued) Sample descriptive statistics
Panel C: Descriptive statistics on product development systems
Companies adopting Time-to-adoption
Project milestones 80% 2.65 Reports comparing progress to plan 70% 2.88 Budget for development projects 66% 3.00 Project selection process 63% 3.42 Product portfolio roadmap 59% 3.33 Product concept testing process 44% 2.71 Product team composition guidelines 39% 3.00
Companies adopting each system are the percentage of companies that had adopted
the system at the point of data collection. Time-to-adoption is the mean number of years since founding to the adoption of the particular system for those companies that adopted each system. Panel D: Descriptive statistics on product development measures
Type of measures Respondents Updating frequency
Time 62 2.81 Budget/financial 30 2.36 Product functionality 30 2.08 Customer 24 1.78 Quality 15 2.90
The table reports the number of respondents that listed each type of measure
among the three top measures for managing product development and the frequency (times per month) that the measures are updated.

24
Tab
le 3
. A
dopt
ion
of M
anag
emen
t Con
trol
Sys
tem
s in
Pro
duct
Dev
elop
men
t P
anel
A:
Typ
olog
y of
dri
vers
of
adop
tion
M
ain1
driv
er
Seco
ndar
y1 dr
iver
Ext
erna
l dri
vers
Leg
itim
ize
2
9
“We’
re a
lso
find
ing
that
the
cust
omer
s ge
t a
feel
ing
of c
ontr
ol w
hen
you
give
the
m m
ore
data
(...
). N
ow,
betw
een
you
and
me,
th
ey’r
e ge
ttin
g no
mor
e co
ntro
l at
all;
but
, by
seei
ng d
ata
that
they
’ve
neve
r se
en b
efor
e, w
e lo
ok g
ood
com
pare
d to
the
inte
rnal
IT
, whi
ch is
one
of
our
stro
ng c
ompe
tito
rs.”
“Tha
t w
as a
lmos
t th
e nu
mbe
r on
e qu
esti
on (
how
do
you
go a
bout
dev
elop
ing
this
stu
ff)
from
bot
h au
dien
ces—
peop
le w
e w
ere
brin
ging
on,
and
our
cus
tom
ers
(…)
and
inve
stor
s ac
tual
ly.
Pret
ty a
lmos
t ev
eryo
ne.
If y
ou d
on’t
hav
e it
, no
body
’s c
omfo
rtab
le
wit
h it.
So
agai
n, I
thin
k it’
s ju
st l
ike
whe
n yo
u w
ant
to b
uy a
hou
se. T
he f
irst
thin
g yo
u w
ant
to d
o is
ins
pect
the
fou
ndat
ion
of
the
hous
e.”
Con
trac
t 7
8
“P
fize
r, a
s pa
rt o
f th
e ag
reem
ent,
put i
n pl
ace
mile
ston
es th
at w
e ha
d to
ach
ieve
.”
“Whe
n w
e w
on th
e M
otor
ola
cont
ract
, Mot
orol
a fo
rced
us
to g
et o
ur a
ct t
oget
her
and
so th
at w
as a
for
cing
fun
ctio
n fo
r al
l the
se
(pro
duct
dev
elop
men
t) p
roce
sses
. M
otor
ola
insi
sted
on
prop
er p
rogr
am m
anag
emen
t, pr
oper
cha
nge
cont
rol,
prop
er p
roje
ct
repo
rtin
g, m
onth
ly b
usin
ess
revi
ews,
mon
thly
pro
ject
rev
iew
s, e
tc. a
nd th
ey s
ent a
udit
team
s in
to a
udit
whe
re w
e w
ere
and
mak
e sp
ecif
ic r
ecom
men
datio
ns.”
“We
tie
mos
t of
our
paym
ents
to m
iles
tone
pay
men
ts.”
Inte
rnal
dri
vers
: P
roac
tive
Bac
kgro
unds
24
11
“B
oth
of u
s ha
d co
me
from
big
com
pany
bac
kgro
unds
whe
re w
e ha
d us
ed p
roje
ct t
rack
ing
syst
ems,
it
seem
ed n
atur
al (
…),
eve
n th
ough
it w
as a
ver
y sm
all a
mou
nt th
at w
e w
ere
trac
king
, we
wer
e ju
st u
sed
to it
. Tha
t was
the
norm
al th
ing
to d
o. I
’d h
ave
to s
ay
that
we’
ve h
ad p
roje
ct tr
acki
ng s
yste
ms,
red
-yel
low
-gre
en s
tatu
s re
port
s, a
nd s
o fo
rth,
fro
m th
e ve
ry b
egin
ning
.”
“The
fou
nder
and
the
ini
tial
engi
neer
ing
peop
le k
new
eng
inee
ring
and
kne
w t
hat
you
can'
t ju
st h
ave
a fr
ee-f
orm
, ‘l
et’s
go
be
rand
om’,
the
re h
as t
o be
som
e re
al m
iles
tone
way
of
trac
king
it.
(…)
So w
hen
I go
t th
ere,
the
eng
inee
ring
tea
m w
as a
ver
y co
mpe
tent
tea
m,
very
goo
d ar
chite
cts,
ver
y ha
rd-w
orki
ng.
The
y ha
d a
real
des
ire
for
proc
ess:
cod
e re
view
s an
d co
nfig
urat
ion
man
agem
ent a
nd th
at w
as g
ood.
”
25
Focu
s 9
10
“Now
we’
re g
etti
ng t
o th
e pl
ace
whe
re th
e re
turn
is
low
er c
ompa
red
to t
he in
vest
men
t, ri
ght?
Bec
ause
we’
ve a
lrea
dy t
aken
up
the
low
han
ging
fru
it. S
o no
w w
e’re
hav
ing
to u
se s
tepl
adde
rs t
o go
get
fru
it. A
nd n
ow i
t m
akes
mor
e se
nse
to b
e m
easu
ring
exa
ctly
ho
w m
any
grap
es a
m I
get
ting
for
how
muc
h ef
fort
mov
ing
the
step
ladd
er.”
“I d
id i
t (fo
rmal
izat
ion)
mor
e to
sha
re m
y th
inki
ng w
ith a
big
ger
team
, six
, sev
en p
eopl
e.”
“I t
hink
, loo
king
bac
k at
it, a
nd c
ompa
ring
it to
oth
er c
ompa
nies
I’v
e be
en w
orki
ng f
or, I
thin
k th
e to
ughe
st s
tep
for
a co
mpa
ny t
o go
thro
ugh
is th
e st
ep fr
om g
oing
from
a s
mal
l com
pany
whe
re p
rett
y m
uch
ever
yone
kno
ws
the
mai
n go
als,
the
mai
n fo
cus
and
the
mai
n in
itiat
ives
wit
hin
the
com
pany
, to
the
ste
ps w
here
you
hav
e to
sto
p pa
ssin
g th
e w
hole
bus
ines
s an
d so
me
peop
le w
ill
know
so
me,
som
e pe
ople
wil
l kn
ow o
ther
, bu
t no
t ev
eryo
ne s
ees
the
big
pict
ure.
And
I t
hink
it’
s a
very
cru
cial
, it
’s v
ery
easy
to
star
t ha
ving
a lo
t of
peop
le r
unni
ng in
man
y di
ffer
ent d
irec
tion
s. A
nd th
e di
ffic
ulty
at t
hat s
tage
is
to k
eep
the
who
le e
nerg
y fo
cuse
d. I
t’s
like
mov
ing
from
a t
wo-
pers
on b
oat
whe
re i
t’s
easy
to
mak
e su
re y
ou p
addl
e in
the
sam
e rh
ythm
, to
a 1
0-pe
rson
boa
t w
here
su
dden
ly y
ou h
ave
to s
pend
mor
e tim
e on
mak
ing
sure
it’s
the
sam
e rh
ythm
than
any
thin
g el
se.”
Inte
rnal
dri
vers
: R
eact
ive
To
chao
s 11
3
“The
ori
gina
l en
gine
erin
g te
am w
ould
giv
e m
e da
tes
whe
n th
ey w
ere
goin
g to
hav
e ce
rtai
n th
ings
don
e an
d ne
ver
mak
e th
e da
tes.
T
hey
didn
’t c
omm
unic
ate
amon
gst
them
selv
es,
so e
ven
whe
n th
ey r
elea
sed
som
ethi
ng, i
t di
dn't
do w
hat
they
sai
d it
was
goi
ng t
o do
. T
here
was
no
QA
pro
cess
, so
whe
n th
ey d
id r
elea
se i
t, it
con
tinue
d to
be
bugg
y, t
hey
wou
ld i
ntro
duce
mor
e bu
gs t
han
they
w
ould
fix
.”
“We
wer
e pi
ckin
g pr
ojec
ts in
suc
h a
stra
nge
way
. Wha
teve
r ca
me
in, d
ispl
acin
g so
met
hing
els
e. S
ort o
f ch
aoti
c.”
“We
wan
ted
to f
orm
aliz
e it,
but
the
ski
ll se
t w
asn’
t th
ere,
and
als
o th
e re
aliz
atio
n th
at w
e ne
eded
tha
t w
asn’
t th
ere.
So
I co
uldn
’t
push
it
too
muc
h. I
sai
d, o
kay,
for
now
let
’s f
ocus
on
the
othe
r ar
eas.
(…
) T
he r
easo
n it
’s h
appe
ning
now
, ac
tual
ly t
his
mon
th, i
s be
caus
e th
e la
st r
elea
se w
e di
d it
dra
gged
out
to a
mon
th’s
cyc
le, a
nd it
was
ver
y pa
infu
l.”
“I th
ink
gene
rall
y yo
u fi
nd th
at a
big
cha
nge
occu
rs w
hen
som
ethi
ng g
oes
wro
ng, a
nd s
omet
hing
did
, and
so
big
chan
ge o
ccur
red.
”
To
lear
ning
7
0
“It
was
aro
und
here
that
thi
ngs
beca
me
less
ad
hoc
beca
use
of e
xper
ienc
e an
d do
cum
enta
tion
of
proc
ess,
ret
aini
ng h
isto
ry o
f w
hat
wor
ked
and
didn
’t w
ork,
fin
ally
cam
e to
pla
ce. (
…)
By
that
tim
e, w
e’d
had
enou
gh e
xper
ienc
e w
ith
enou
gh p
roje
cts
to s
ay, “
Oka
y,
now
we
get
wha
t w
orks
and
doe
sn’t
wor
k. W
e ca
n es
timat
e ac
cura
tely
.” A
nd i
t ju
st t
ook
doin
g it
a nu
mbe
r of
tim
es i
n th
is n
ew
indu
stry
and
bot
h su
ccee
ding
and
fai
ling
to u
nder
stan
d ok
ay n
ow w
e ca
n ge
nera
lize,
we
can
syst
emat
ize,
we
can
com
e up
with
m
etho
dolo
gies
that
rea
lly
wor
k.”
“It w
as ju
st s
ort o
f th
e so
lidi
fica
tion
of
wha
t was
a m
ore
info
rmal
sor
t of
mile
ston
e as
sess
men
t pro
cess
.”

26
Kep
t in
form
al
appr
oach
8
“W
e ca
n st
ill a
ffor
d to
be
fair
ly f
luid
and
fle
xibl
e an
d in
form
al i
n ou
r ap
proa
ch,
beca
use
our
deve
lopm
ent
team
has
bee
n w
ith
Kev
in, e
very
one
of
them
, eig
ht to
15
year
s.”
“I t
hink
we’
re n
ot a
t th
at s
tage
yet
. I
thin
k w
e ar
e a
smal
l co
mpa
ny,
whe
re o
n th
e re
sour
ces
side
, it
’s p
rett
y cl
ear
from
the
ons
et,
whe
n w
e go
int
o a
prod
uct,
we
pret
ty m
uch
know
how
lon
g it
’s g
oing
to t
ake
and
how
muc
h it
’s g
oing
to
cost
us.
And
the
bigg
est
cost
is u
sual
ly in
term
s of
res
ourc
es in
volv
ed, m
ore
than
act
ual d
olla
rs.”
“We
thou
ght
we
wer
e go
ing
to h
ave
to f
ire
him
bec
ause
he
was
suc
h a
crea
tive
guy
and
wou
ld a
lway
s w
ork
on s
omet
hing
new
. (…
) S
ome
peop
le a
re p
rim
a do
nnas
. And
you
hav
e to
put
up
wit
h th
at, b
ut th
ey h
ave
to b
e ab
le to
sin
g. A
nd s
o th
e w
orst
thin
g th
at
can
happ
en in
a c
ompa
ny i
s pr
ima
donn
as th
at d
on’t
del
iver
. But
if
you
have
peo
ple
who
del
iver
, it h
appe
ns e
very
yea
r, w
hat t
hey
do i
n be
twee
n do
esn’
t m
atte
r. A
nd I
kno
w w
e’ve
had
man
ager
s th
at w
ill
fire
tha
t ki
nd o
f pe
rson
, be
caus
e th
ey c
ome
in l
ate,
and
th
ey d
o w
eird
thi
ngs,
and
the
y do
n’t
mak
e th
e bu
dget
. B
ut i
f yo
u’ve
bee
n ar
ound
lon
g en
ough
you
kno
w t
hat
80%
of
your
in
nova
tion
will
com
e fr
om c
razy
peo
ple.
”
“We
trie
d to
for
mal
ize
it i
n ’9
7, i
n ’9
8, i
n ’9
9, b
ut w
e sa
id i
t w
as n
ot p
ossi
ble.
So
we
left
it
at a
n in
form
al l
evel
. Pa
rt o
f m
y jo
b th
roug
h m
ost
of m
y li
fe h
as b
een
doin
g st
unt
wor
k th
ings
in
bigg
er o
rgan
izat
ions
. In
a s
ense
, th
at w
as k
ind
of t
he f
lavo
r of
wha
t w
as g
oing
to w
ork
in th
e co
mpa
ny.”
1
Mai
n dr
iver
indi
cate
s nu
mbe
r of
com
pani
es w
here
the
part
icul
ar d
rive
r w
as i
dent
ifie
d as
the
mai
n on
e; s
econ
dary
dri
ver
indi
cate
s if
it
was
als
o id
entif
ied.
For
eac
h co
mpa
ny, w
e id
enti
fied
at
leas
t on
e dr
iver
(ex
cept
if
the
proc
ess
was
sti
ll in
form
al)
and
at m
ost
two
driv
ers
(a m
ain
one
and
a se
cond
ary
one)
. Quo
tes
are
part
icul
ar
exam
ples
of
each
of
the
driv
ers.
P
anel
B:
The
lim
itatio
ns o
f m
anag
emen
t co
ntro
l sys
tem
s
“I th
ink
to a
cer
tain
ext
ent p
roce
sses
cou
ld s
low
thin
gs d
own,
and
so
bein
g sl
ow to
mar
ket i
s w
orse
than
bei
ng f
ast t
o m
arke
t. T
he w
hole
goa
l of
a bi
otec
h fi
rm is
to
brin
g a
prod
uct t
o m
arke
t. T
hat’
s lif
e or
dea
th. A
nd a
nyth
ing
that
get
s yo
u cl
oser
to m
arke
t is
good
and
any
thin
g th
at k
eeps
you
fro
m th
e m
arke
t is
bad.
” “F
ortu
nate
ly, o
n th
e en
gine
erin
g si
de o
f it
—gi
ven
the
amou
nt o
f m
oney
we
had,
we
did
put i
n pl
ace
a ve
ry f
orm
al d
evel
opm
ent c
ycle
wit
h al
l the
tool
s in
pla
ce. S
o al
l the
rev
isio
n co
ntro
l sys
tem
s fo
r ha
rdw
are
and
soft
war
e, a
ll th
ose
tool
cha
ins
are
in p
lace
, and
hav
e be
en in
fro
m d
ay o
ne in
the
com
pany
. And
if a
nyth
ing,
that
’s
cost
me
six
mon
ths
of p
rodu
ct d
evel
opm
ent
time,
so
now
I h
ave
seco
nd t
houg
hts
abou
t th
e so
-cal
led
soph
isti
cate
d to
ol c
hain
s. B
ut,
they
’ve
alw
ays
been
in
plac
e he
re a
ctua
lly f
rom
day
one
.”
27
Pan
el C
: S
ourc
es o
f m
anag
emen
t co
ntro
l sys
tem
des
ign
Sour
ce o
f M
CS
desi
gn
Num
ber
of
com
pani
es
Illu
stra
tive
quo
tes
Inte
rnal
peo
ple
61
“Som
e of
the
sys
tem
s w
ere
driv
en b
y ke
y in
divi
dual
s w
ith—
give
n th
eir
expe
rien
ce a
nd b
ackg
roun
d, t
hey
drov
e th
ose
proc
esse
s.”
“We
have
a g
uy w
ho a
gain
bro
ught
the
expe
rien
ce w
ith
him
. Mos
t of u
s th
at h
ave
been
in b
ig c
ompa
nies
—an
d th
at’s
mos
t of
my
seni
or s
taff
—ei
ther
had
the
PL
C o
r a
gate
pro
cess
. B
ut i
n pa
rtic
ular
, ou
r pr
oduc
t lin
e m
anag
er d
irec
tor
brou
ght
the
tem
plat
e. A
nd t
he t
rick
of
brin
ging
som
ethi
ng t
hat’
s be
en u
sed
in a
dif
fere
nt c
ompa
ny i
s m
akin
g it
rel
evan
t an
d th
e st
eps
invo
lved
rel
evan
t to
the
size
of
the
com
pany
.”
“So
I ha
ve o
ne o
f m
y gu
ys w
rite
the
who
le d
ocum
ent,
it’s
abou
t an
80-p
age
docu
men
t, ab
out t
he d
evel
opm
ent p
roce
ss.”
“I g
ive
(Our
VP
of e
ngin
eeri
ng)
cred
it fo
r de
sign
ing
(the
pla
n of
rec
ord)
her
e.”
“Wor
king
with
peo
ple
who
wer
e ex
peri
ence
d, li
ke th
e sa
les
guys
wer
e ex
peri
ence
d in
pro
duct
dev
elop
men
t too
, bec
ause
it’
s th
eir
proj
ect b
eing
dev
elop
ed. (
The
fou
nder
) br
ough
t qui
te a
bit
of
the
infr
astr
uctu
re to
o. M
y su
ppor
t guy
was
an
olde
r gu
y in
hi
s 50
s an
d he
had
30
year
s of
pro
duct
dev
elop
men
t exp
erie
nce,
so
thos
e gu
ys a
ll b
roug
ht in
a lo
t to
the
tabl
e.”
“I b
roug
ht i
t fr
om m
y pr
evio
us e
xper
ienc
e. I
’ve
done
pro
duct
dev
elop
men
t fo
r ab
out
twel
ve y
ears
and
you
kin
d of
kno
w
wha
t wor
ks.”
Ext
erna
l pa
rtie
s 3
“For
exa
mpl
e, t
here
’s a
com
pany
tha
t m
akes
bac
kup
soft
war
e. A
nd I
nee
ded
back
up s
oftw
are
beca
use
if t
he w
orst
pos
sibl
e th
ing
happ
ens,
I w
ant t
o be
abl
e to
put
it b
ack
to th
e w
ay it
was
, whi
ch m
eans
I n
eed
a ba
ckup
. So
I do
n’t w
ant t
o cr
eate
my
own
back
up s
yste
m. T
his
com
pany
had
a b
acku
p sy
stem
.”
“Pfi
zer,
as
part
of
the
agre
emen
t, pu
t in
plac
e m
ilest
ones
that
we
had
to a
chie
ve.”
28
Table 4. Product development formalization
Product development milestones
Hazard ratio Robust std. error
External drivers Legitimize 2.425 *** 0.66 Contract 2.032 0.65
Internal drivers—proactive Background 3.573 ***, + 1.23 Focus 2.283 ** 0.75
Internal drivers—reactive Learning 1.589 0.98 Chaos 2.496 ** 0.90
Number of observations 388 Number of companies 69 Chi-sq. 16.89 ***
*, **, *** significantly different at 10%, 5%, and 1% respectively from reference category. + significantly different at 10% from legitimize. Table reports Cox proportional hazard model of the time to adoption of product development milestones. Dependent variables are the drivers of MCS adoption identified in the qualitative analysis. The category not included is “informal.”
29
Table 5. Product development formalization and performance
Project performance (0 = late, 1 = early or on-time)
Coefficient Standard error
External drivers Legitimize -0.203 ‡ 0.61 Contract -2486 ** 2.22
Internal drivers—proactive Background 0.767 ++, +++ 0.65 Focus -1454 ** 0.73
Internal drivers—reactive Learning 0.065 ‡ 0.99 Chaos -2.73 **, †, †† 1.12
Number of observations 64 Pseudo- R2 0.22 Chi-sq. 13.57 **
** significantly different at 5% from reference category; +++ significantly different at 1% from chaos, ++ 5% from contract and focus; † significantly different at 10% from learning, †† significantly different at 5% from legitimize; ‡ significantly different at 10% from contract. The table reports a logit model with product development performance as the dependent variable (1 if the project is early or on-time, 0 if it is late). Dependent variables are the drivers of MCS adoption identified in the qualitative analysis. The category not included is “informal.”
Table 6. Industry distribution of the sample
Number of observations
Automotive 9 Chemicals and resources 18 Consumer goods 11 Engineering and medical products 31 Information and media 9 Other 10
Total 88
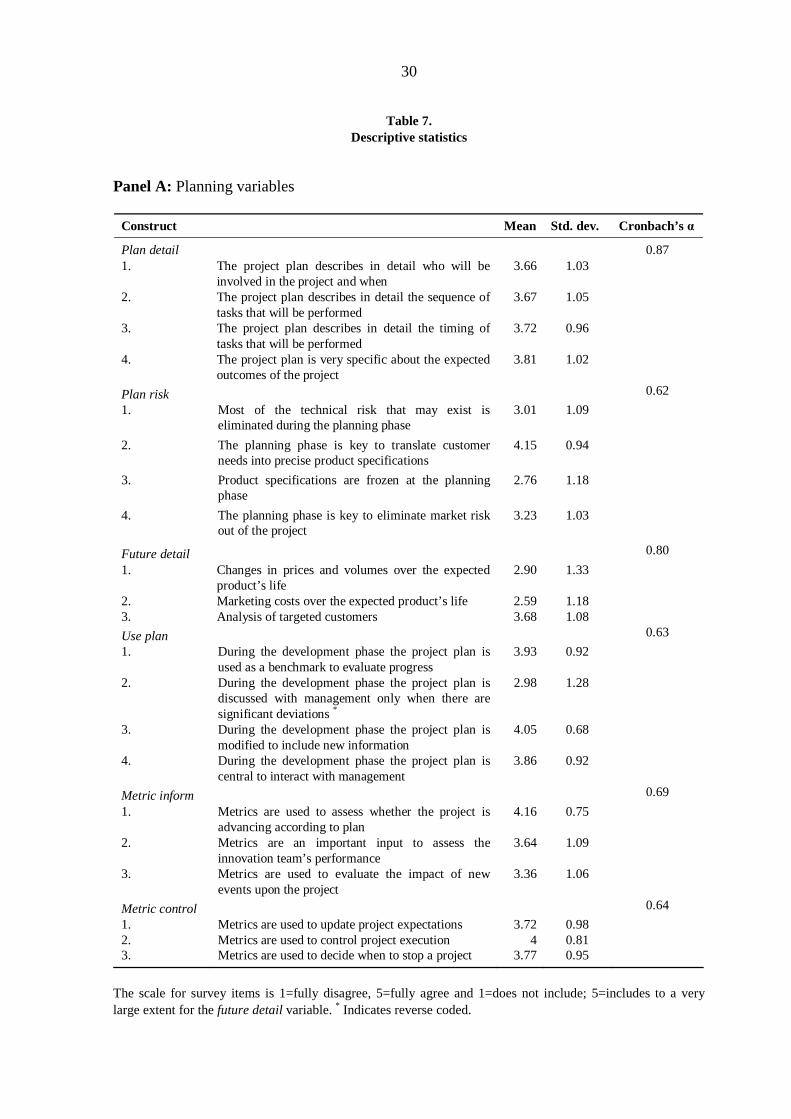
30
Table 7. Descriptive statistics
Panel A: Planning variables
The scale for survey items is 1=fully disagree, 5=fully agree and 1=does not include; 5=includes to a very large extent for the future detail variable. * Indicates reverse coded.
Construct Mean Std. dev. Cronbach’s α
Plan detail 0.87 1. The project plan describes in detail who will be
involved in the project and when 3.66 1.03
2. The project plan describes in detail the sequence of tasks that will be performed
3.67 1.05
3. The project plan describes in detail the timing of tasks that will be performed
3.72 0.96
4. The project plan is very specific about the expected outcomes of the project
3.81 1.02
Plan risk 0.62
1. Most of the technical risk that may exist is eliminated during the planning phase
3.01 1.09
2. The planning phase is key to translate customer needs into precise product specifications
4.15 0.94
3. Product specifications are frozen at the planning phase
2.76 1.18
4. The planning phase is key to eliminate market risk out of the project
3.23 1.03
Future detail 0.80
1. Changes in prices and volumes over the expected product’s life
2.90 1.33
2. Marketing costs over the expected product’s life 2.59 1.18 3. Analysis of targeted customers 3.68 1.08
Use plan 0.63
1. During the development phase the project plan is used as a benchmark to evaluate progress
3.93 0.92
2. During the development phase the project plan is discussed with management only when there are significant deviations *
2.98 1.28
3. During the development phase the project plan is modified to include new information
4.05 0.68
4. During the development phase the project plan is central to interact with management
3.86 0.92
Metric inform 0.69
1. Metrics are used to assess whether the project is advancing according to plan
4.16 0.75
2. Metrics are an important input to assess the innovation team’s performance
3.64 1.09
3. Metrics are used to evaluate the impact of new events upon the project
3.36 1.06
Metric control 0.64
1. Metrics are used to update project expectations 3.72 0.98 2. Metrics are used to control project execution 4 0.81 3. Metrics are used to decide when to stop a project 3.77 0.95
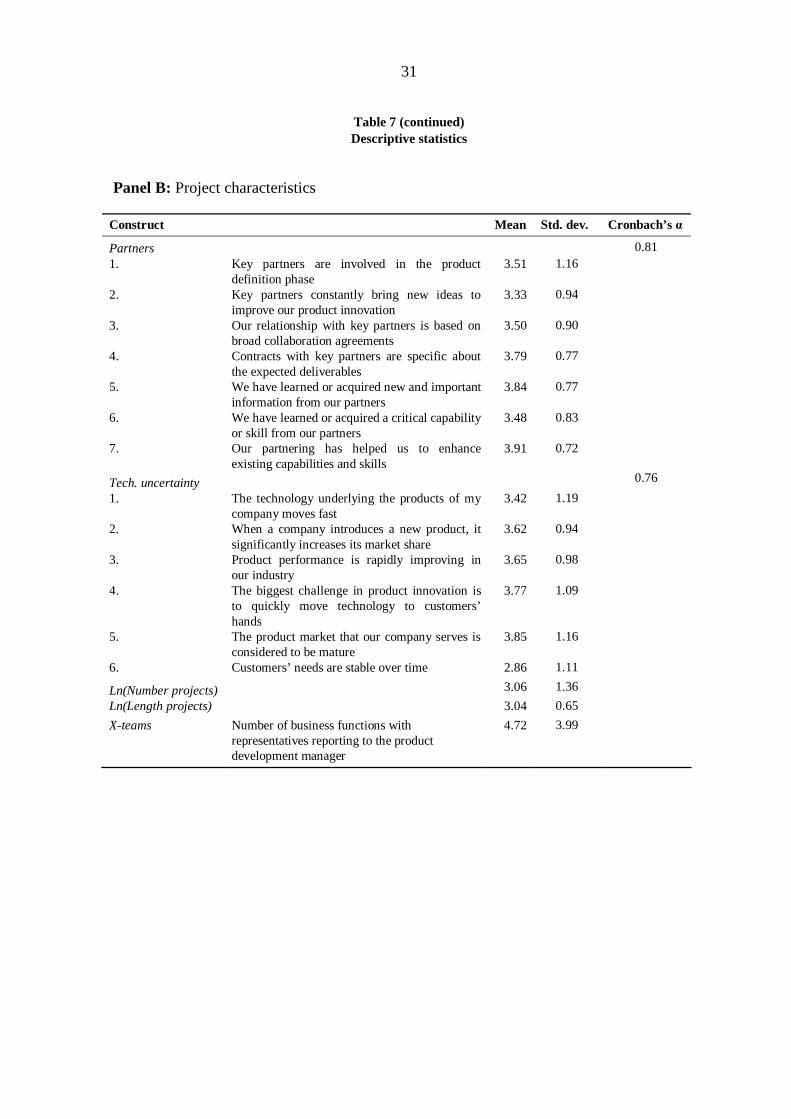
31
Table 7 (continued) Descriptive statistics
Panel B: Project characteristics
Construct Mean Std. dev. Cronbach’s α
Partners 0.81 1. Key partners are involved in the product
definition phase 3.51 1.16
2. Key partners constantly bring new ideas to improve our product innovation
3.33 0.94
3. Our relationship with key partners is based on broad collaboration agreements
3.50 0.90
4. Contracts with key partners are specific about the expected deliverables
3.79 0.77
5. We have learned or acquired new and important information from our partners
3.84 0.77
6. We have learned or acquired a critical capability or skill from our partners
3.48 0.83
7. Our partnering has helped us to enhance existing capabilities and skills
3.91 0.72
Tech. uncertainty 0.76
1. The technology underlying the products of my company moves fast
3.42 1.19
2. When a company introduces a new product, it significantly increases its market share
3.62 0.94
3. Product performance is rapidly improving in our industry
3.65 0.98
4. The biggest challenge in product innovation is to quickly move technology to customers’ hands
3.77 1.09
5. The product market that our company serves is considered to be mature
3.85 1.16
6. Customers’ needs are stable over time 2.86 1.11
Ln(Number projects) 3.06 1.36
Ln(Length projects) 3.04 0.65
X-teams Number of business functions with representatives reporting to the product development manager
4.72 3.99
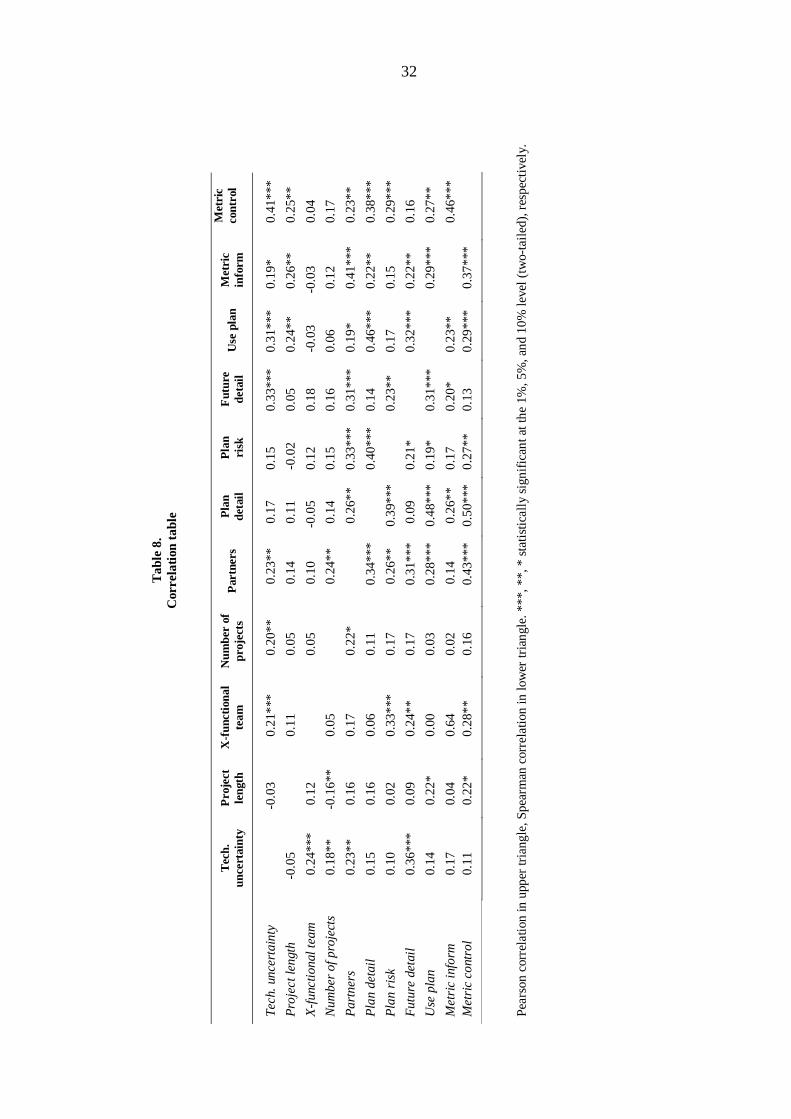
32
Tab
le 8
. C
orre
lati
on t
able
T
ech.
un
cert
aint
y P
roje
ct
leng
th
X-f
unct
iona
l te
am
Num
ber
of
proj
ects
P
artn
ers
Pla
n de
tail
P
lan
risk
F
utur
e de
tail
U
se p
lan
Met
ric
info
rm
Met
ric
cont
rol
Tech
. unc
erta
inty
-0.0
3 0.
21**
* 0.
20**
0.
23**
0.
17
0.15
0.
33**
* 0.
31**
* 0.
19*
0.41
***
Pro
ject
leng
th
-0.0
5
0.11
0.
05
0.14
0.
11
-0.0
2 0.
05
0.24
**
0.26
**
0.25
**
X-f
unct
iona
l tea
m
0.24
***
0.12
0.05
0.
10
-0.0
5 0.
12
0.18
-0
.03
-0.0
3 0.
04
Num
ber
of p
roje
cts
0.18
**
-0.1
6**
0.05
0.24
**
0.14
0.
15
0.16
0.
06
0.12
0.
17
Par
tner
s 0.
23**
0.
16
0.17
0.
22*
0.
26**
0.
33**
* 0.
31**
* 0.
19*
0.41
***
0.23
**
Pla
n de
tail
0.
15
0.16
0.
06
0.11
0.
34**
*
0.40
***
0.14
0.
46**
* 0.
22**
0.
38**
*
Pla
n ri
sk
0.10
0.
02
0.33
***
0.17
0.
26**
0.
39**
*
0.23
**
0.17
0.
15
0.29
***
Fut
ure
deta
il
0.36
***
0.09
0.
24**
0.
17
0.31
***
0.09
0.
21*
0.
32**
* 0.
22**
0.
16
Use
pla
n 0.
14
0.22
* 0.
00
0.03
0.
28**
* 0.
48**
* 0.
19*
0.31
***
0.
29**
* 0.
27**
Met
ric
info
rm
0.17
0.
04
0.64
0.
02
0.14
0.
26**
0.
17
0.20
* 0.
23**
0.46
***
Met
ric
cont
rol
0.11
0.
22*
0.28
**
0.16
0.
43**
* 0.
50**
* 0.
27**
0.
13
0.29
***
0.37
***
Pear
son
corr
elat
ion
in u
pper
tria
ngle
, Spe
arm
an c
orre
latio
n in
low
er tr
iang
le. *
**, *
*, *
sta
tist
ical
ly s
igni
fica
nt a
t the
1%
, 5%
, and
10%
leve
l (tw
o-ta
iled
), r
espe
ctiv
ely.

33
Table 9. Project planning and new product development characteristics
Panel A: Measurement model—standardized loadings
***, **, * statistically significant at the 1%, 5%, and 10% level (two-tailed), respectively (t-statistic in parenthesis). Loadings for explanatory variables are the average loading from the six models tested (as reported in Panel B).
Plan detail Item 1. Item 2. Item 3. Item 4. 0.879*** 0.920*** 0.894*** 0.755***
Plan risk Item 1. Item 2. Item 3. Item 4. 0.761*** 0.822*** 0.520*** 0.568**
Use plan Item 1. Item 2. Item 3. Item 4. 0.523*** -0.675*** 0.671*** 0.828***
Future detail Item 1. Item 2. Item 3. 0.854*** 0.877*** 0.812***
Metric information Item 1. Item 2. Item 3. 0.849*** 0.690*** 0.794***
Metric control Item 1. Item 2. Item 3. 0.745*** 0.820*** 0.719***
Technology uncertainty Item 1. Item 2. Item 3. Item 4. Item 5. Item 6. 0.734*** 0.697*** 0.770*** 0.607*** -0.566*** -0.539**
Partners Item 1. Item 2. Item 3. Item 4. Item 5. Item 6. Item 7.0.638*** 0.692*** 0.581*** 0.520*** 0.826*** 0.746*** 0.725*
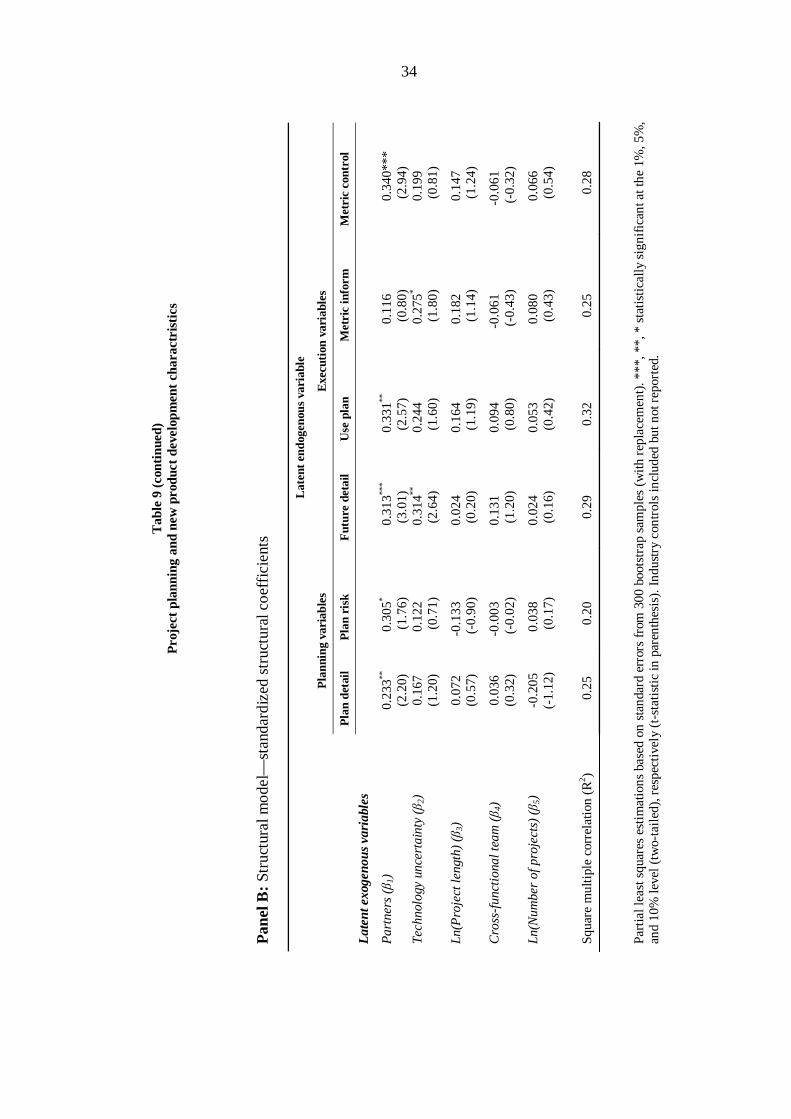
34
Tab
le 9
(con
tinu
ed)
Pro
ject
pla
nnin
g an
d ne
w p
rodu
ct d
evel
opm
ent
char
actr
isti
cs
Pan
el B
: St
ruct
ural
mod
el—
stan
dard
ized
str
uctu
ral c
oeff
icie
nts
L
aten
t en
doge
nous
var
iabl
e
P
lann
ing
vari
able
s
Exe
cuti
on v
aria
bles
P
lan
deta
il
Pla
n ri
sk
Fut
ure
deta
il U
se p
lan
Met
ric
info
rm
Met
ric
cont
rol
Lat
ent e
xoge
nous
var
iabl
es
Par
tner
s (β
1)
0.23
3**
(2.2
0)
0.30
5* (1
.76)
0.
313**
* (3
.01)
0.
331**
(2.5
7)
0.11
6 (0
.80)
0.
340*
**
(2.9
4)
Tech
nolo
gy u
ncer
tain
ty (β 2
) 0.
167
(1.2
0)
0.12
2 (0
.71)
0.
314**
(2
.64)
0.
244
(1.6
0)
0.27
5*
(1.8
0)
0.19
9 (0
.81)
Ln(P
roje
ct le
ngth
) (β
3)
0.07
2 (0
.57)
-0
.133
(-
0.90
) 0.
024
(0.2
0)
0.16
4 (1
.19)
0.
182
(1.1
4)
0.14
7 (1
.24)
Cro
ss-f
unct
iona
l tea
m (β 4
) 0.
036
(0.3
2)
-0.0
03
(-0.
02)
0.13
1 (1
.20)
0.
094
(0.8
0)
-0.0
61
(-0.
43)
-0.0
61
(-0.
32)
Ln(N
umbe
r of
pro
ject
s) (β 5
) -0
.205
(-
1.12
) 0.
038
(0.1
7)
0.02
4 (0
.16)
0.
053
(0.4
2)
0.08
0 (0
.43)
0.
066
(0.5
4)
Sq
uare
mul
tipl
e co
rrel
atio
n (R
2 ) 0.
25
0.20
0.
29
0.32
0.
25
0.28
Part
ial l
east
squ
ares
est
imat
ions
bas
ed o
n st
anda
rd e
rror
s fr
om 3
00 b
oots
trap
sam
ples
(w
ith r
epla
cem
ent)
. ***
, **,
* s
tatis
tica
lly s
igni
fica
nt a
t the
1%
, 5%
, an
d 10
% le
vel (
two-
tail
ed),
res
pect
ivel
y (t
-sta
tist
ic in
par
enth
esis
). I
ndus
try
cont
rols
incl
uded
but
not
rep
orte
d.

35
Table 10. The use of planning and metrics during product development
Panel A: Use of plan Endogenous latent variable
(1)
Use plan (2)
Plan detail (3
Plan risk (4)
Future detail Exogenous latent variables Technology uncertainty 0.032 0.131 0.322 *** (0.28) (1.13) (3.03) Project length -0.166 Cross-functional team (-0.90) 0.136 Number of projects 0.083 (1.53) Partners 0.179 (0.68) (1.43) 0.178 0.339 ** 0.289 ** Endogenous latent variables (1.40) (2.07) (2.51) Plan detail 0.378 *** (3.81) Plan risk -0.102 (0.85) Future detail 0.251 ** (2.32)
Squared multiple correlation (R2) 0.35 Panel B: Metrics for information
Endogenous latent variable
(1)
Use plan (2)
Plan detail (3
Plan risk (4)
Future detail
Exogenous latent variables Technology uncertainty Project length 0.197 0.127 0.322 *** (1.51) (1.06) (3.05) Cross-functional team -0.178
(-0.95)
0.139
Number of projects 0.090 (1.57) (0.72) Partners 0.058 0.189 0.346 ** 0.284 ** (0.37) (1.60) (2.27) (2.59) Endogenous latent variables Plan detail 0.222 * (1.90) Plan risk 0.019 (0.12) Future detail 0.052 (0.33) Squared multiple correlation (R2) 0.19
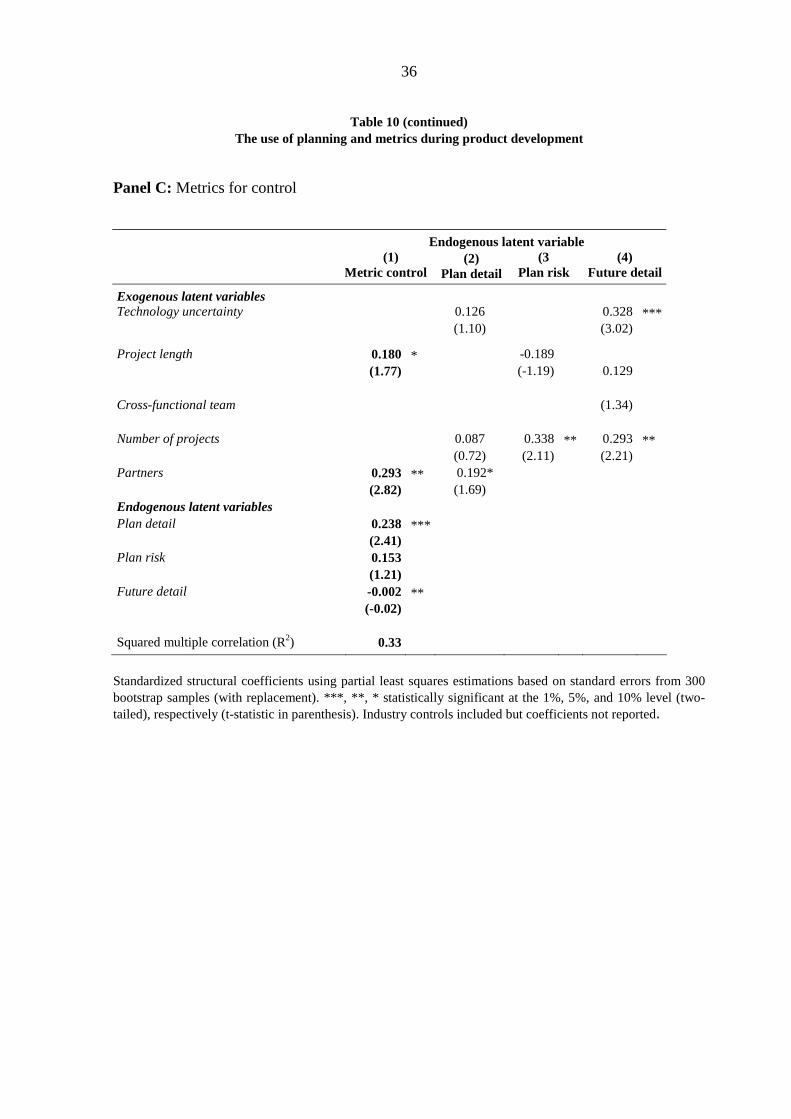
36
Table 10 (continued) The use of planning and metrics during product development
Panel C: Metrics for control Endogenous latent variable
(1)
Metric control (2)
Plan detail (3
Plan risk (4)
Future detail
Exogenous latent variables Technology uncertainty 0.126 0.328 ***
(1.10)
(3.02)
Project length 0.180 * -0.189
(1.77)
(-1.19)
0.129
Cross-functional team (1.34) Number of projects 0.087 0.338 ** 0.293 ** (0.72) (2.11) (2.21) Partners 0.293 ** 0.192* (2.82) (1.69) Endogenous latent variables Plan detail 0.238 *** (2.41) Plan risk 0.153 (1.21) Future detail -0.002 ** (-0.02) Squared multiple correlation (R2) 0.33 Standardized structural coefficients using partial least squares estimations based on standard errors from 300 bootstrap samples (with replacement). ***, **, * statistically significant at the 1%, 5%, and 10% level (two-tailed), respectively (t-statistic in parenthesis). Industry controls included but coefficients not reported.
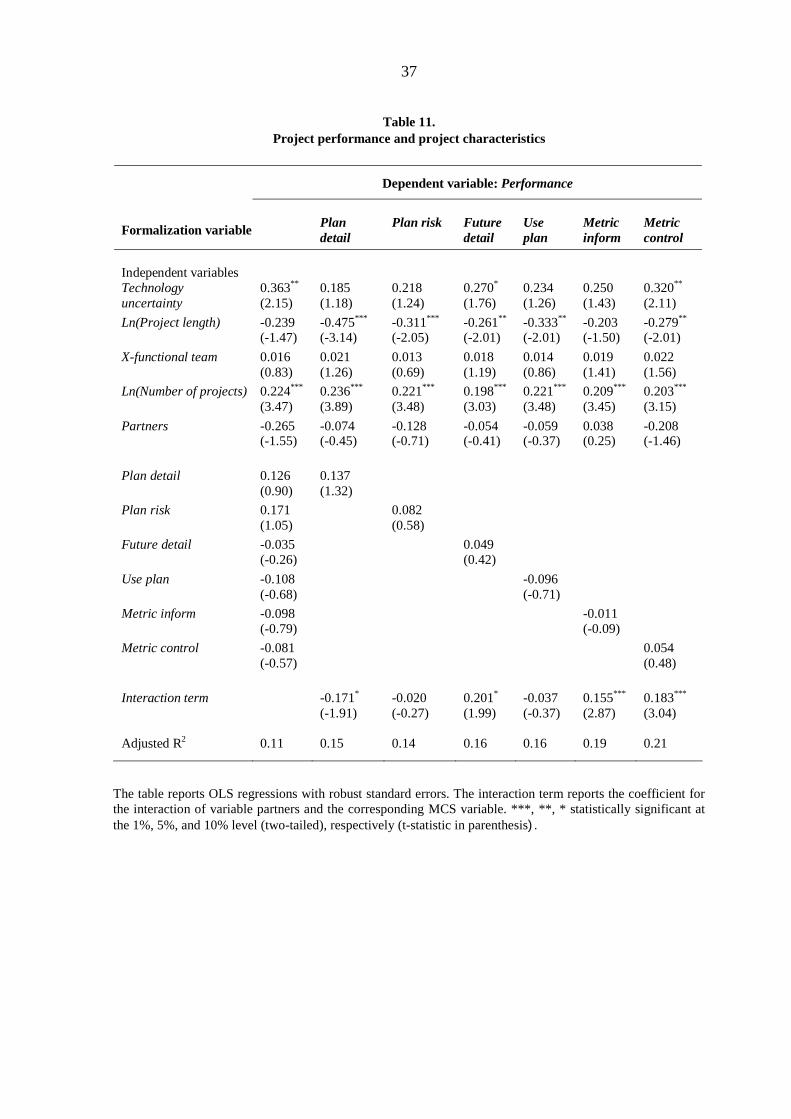
37
Table 11. Project performance and project characteristics
The table reports OLS regressions with robust standard errors. The interaction term reports the coefficient for the interaction of variable partners and the corresponding MCS variable. ***, **, * statistically significant at the 1%, 5%, and 10% level (two-tailed), respectively (t-statistic in parenthesis).
Dependent variable: Performance
Formalization variable Plan detail
Plan risk Future detail
Use plan
Metric inform
Metric control
Independent variables Technology uncertainty
0.363**
(2.15) 0.185 (1.18)
0.218 (1.24)
0.270* (1.76)
0.234 (1.26)
0.250 (1.43)
0.320** (2.11)
Ln(Project length) -0.239 (-1.47)
-0.475*** (-3.14)
-0.311*** (-2.05)
-0.261** (-2.01)
-0.333** (-2.01)
-0.203 (-1.50)
-0.279** (-2.01)
X-functional team 0.016 (0.83)
0.021 (1.26)
0.013 (0.69)
0.018 (1.19)
0.014 (0.86)
0.019 (1.41)
0.022 (1.56)
Ln(Number of projects) 0.224***
(3.47) 0.236*** (3.89)
0.221*** (3.48)
0.198*** (3.03)
0.221*** (3.48)
0.209*** (3.45)
0.203*** (3.15)
Partners -0.265 (-1.55)
-0.074 (-0.45)
-0.128 (-0.71)
-0.054 (-0.41)
-0.059 (-0.37)
0.038 (0.25)
-0.208 (-1.46)
Plan detail 0.126
(0.90) 0.137 (1.32)
Plan risk 0.171 (1.05)
0.082 (0.58)
Future detail -0.035 (-0.26)
0.049 (0.42)
Use plan -0.108 (-0.68)
-0.096 (-0.71)
Metric inform -0.098 (-0.79)
-0.011 (-0.09)
Metric control -0.081 (-0.57)
0.054 (0.48)
Interaction term -0.171*
(-1.91) -0.020 (-0.27)
0.201* (1.99)
-0.037 (-0.37)
0.155*** (2.87)
0.183*** (3.04)
Adjusted R2 0.11 0.15 0.14 0.16 0.16 0.19 0.21
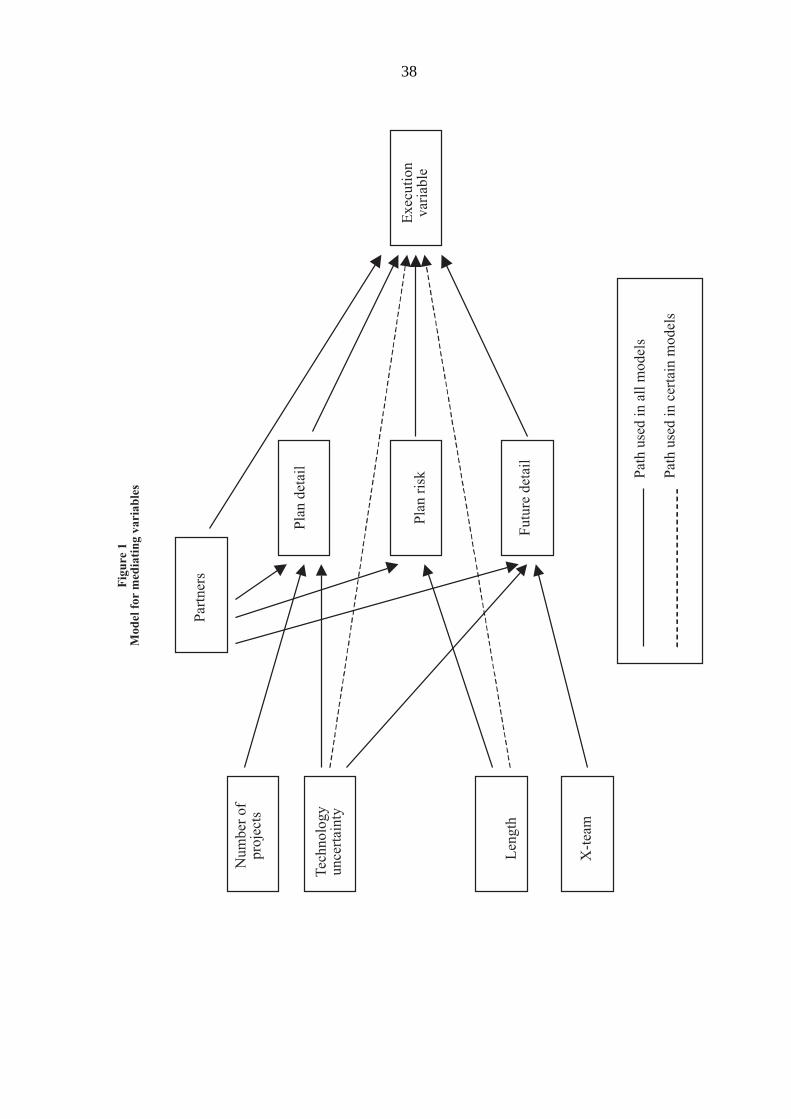
38
���
�����
����� �
����������
����� ��� �
���� �
�� ���
��� ����
������� ���
���������
�� ������ ���
����� ��
� �������
�� ��������������������
�� ������������� �����
�����
���
����
�
���
� ��
���
����
����
����
����
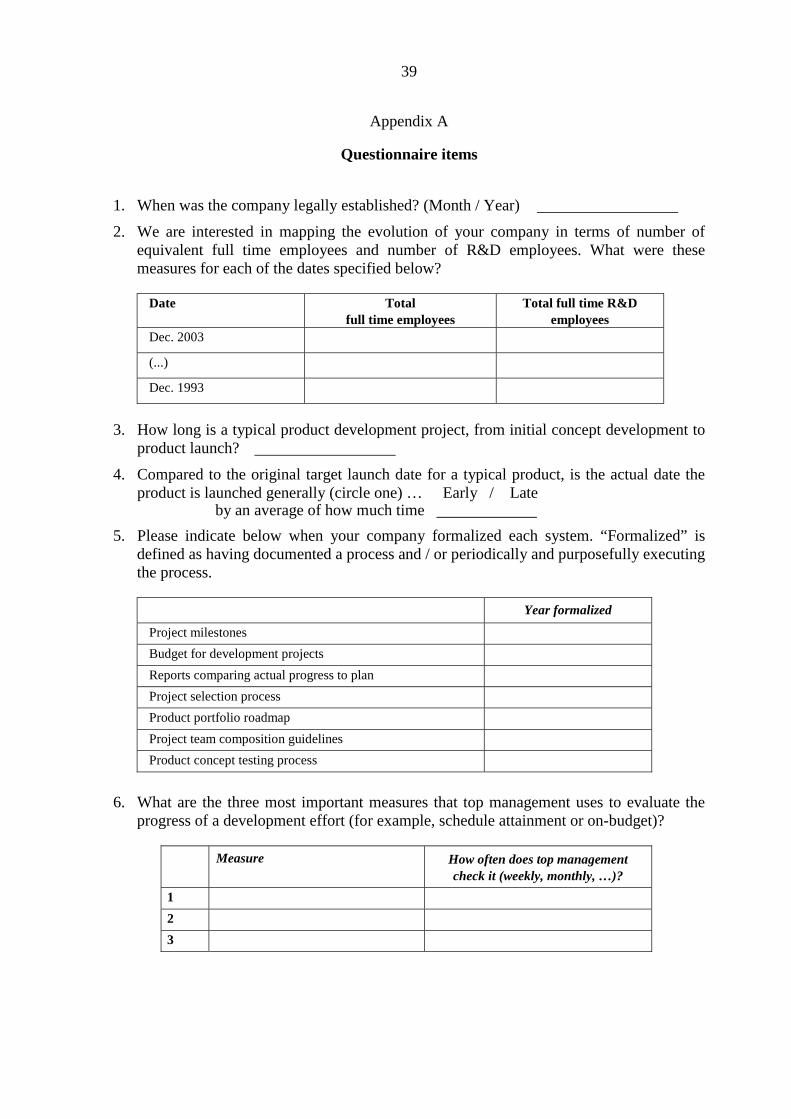
39
Appendix A
Questionnaire items
1. When was the company legally established? (Month / Year)
2. We are interested in mapping the evolution of your company in terms of number of equivalent full time employees and number of R&D employees. What were these measures for each of the dates specified below?
Date Total full time employees
Total full time R&D employees
Dec. 2003
(...)
Dec. 1993
3. How long is a typical product development project, from initial concept development to
product launch?
4. Compared to the original target launch date for a typical product, is the actual date the product is launched generally (circle one) … Early / Late
by an average of how much time
5. Please indicate below when your company formalized each system. “Formalized” is defined as having documented a process and / or periodically and purposefully executing the process.
Year formalized
Project milestones
Budget for development projects
Reports comparing actual progress to plan
Project selection process
Product portfolio roadmap
Project team composition guidelines
Product concept testing process
6. What are the three most important measures that top management uses to evaluate the progress of a development effort (for example, schedule attainment or on-budget)?
Measure How often does top management check it (weekly, monthly, …)?
1
2
3
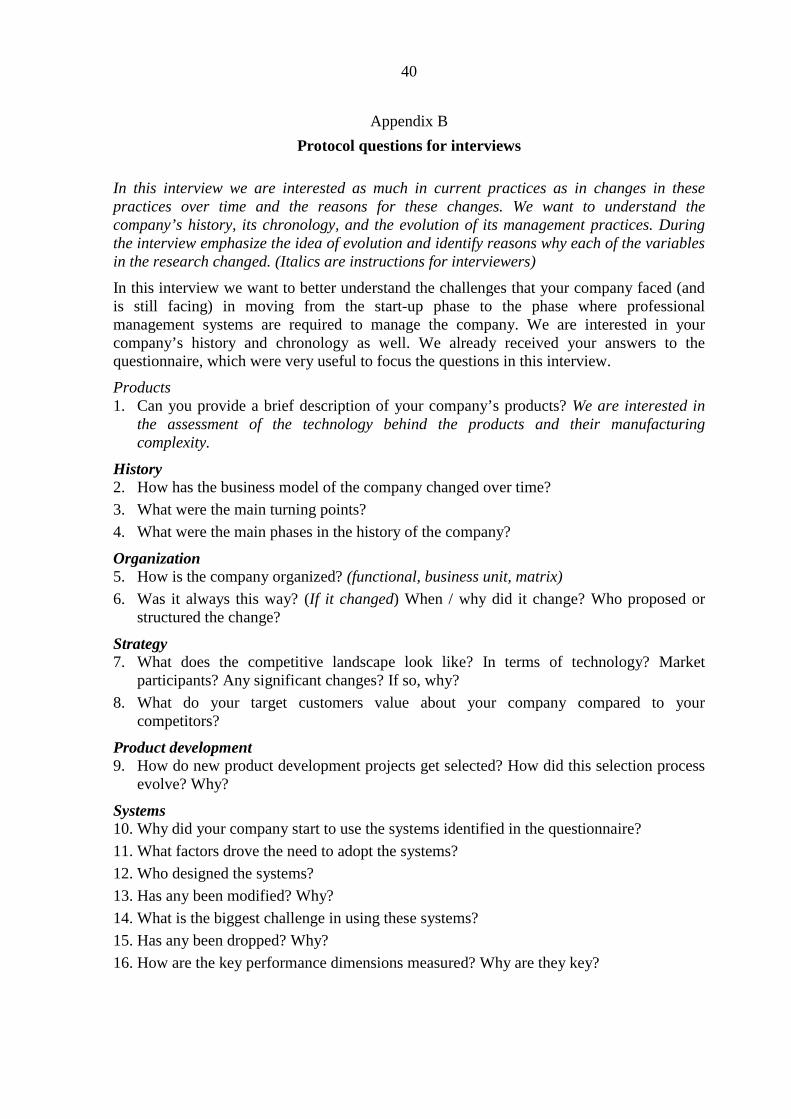
40
Appendix B
Protocol questions for interviews
In this interview we are interested as much in current practices as in changes in these practices over time and the reasons for these changes. We want to understand the company’s history, its chronology, and the evolution of its management practices. During the interview emphasize the idea of evolution and identify reasons why each of the variables in the research changed. (Italics are instructions for interviewers)
In this interview we want to better understand the challenges that your company faced (and is still facing) in moving from the start-up phase to the phase where professional management systems are required to manage the company. We are interested in your company’s history and chronology as well. We already received your answers to the questionnaire, which were very useful to focus the questions in this interview.
Products 1. Can you provide a brief description of your company’s products? We are interested in
the assessment of the technology behind the products and their manufacturing complexity.
History 2. How has the business model of the company changed over time?
3. What were the main turning points?
4. What were the main phases in the history of the company?
Organization 5. How is the company organized? (functional, business unit, matrix)
6. Was it always this way? (If it changed) When / why did it change? Who proposed or structured the change?
Strategy 7. What does the competitive landscape look like? In terms of technology? Market
participants? Any significant changes? If so, why?
8. What do your target customers value about your company compared to your competitors?
Product development 9. How do new product development projects get selected? How did this selection process
evolve? Why?
Systems 10. Why did your company start to use the systems identified in the questionnaire?
11. What factors drove the need to adopt the systems?
12. Who designed the systems?
13. Has any been modified? Why?
14. What is the biggest challenge in using these systems?
15. Has any been dropped? Why?
16. How are the key performance dimensions measured? Why are they key?
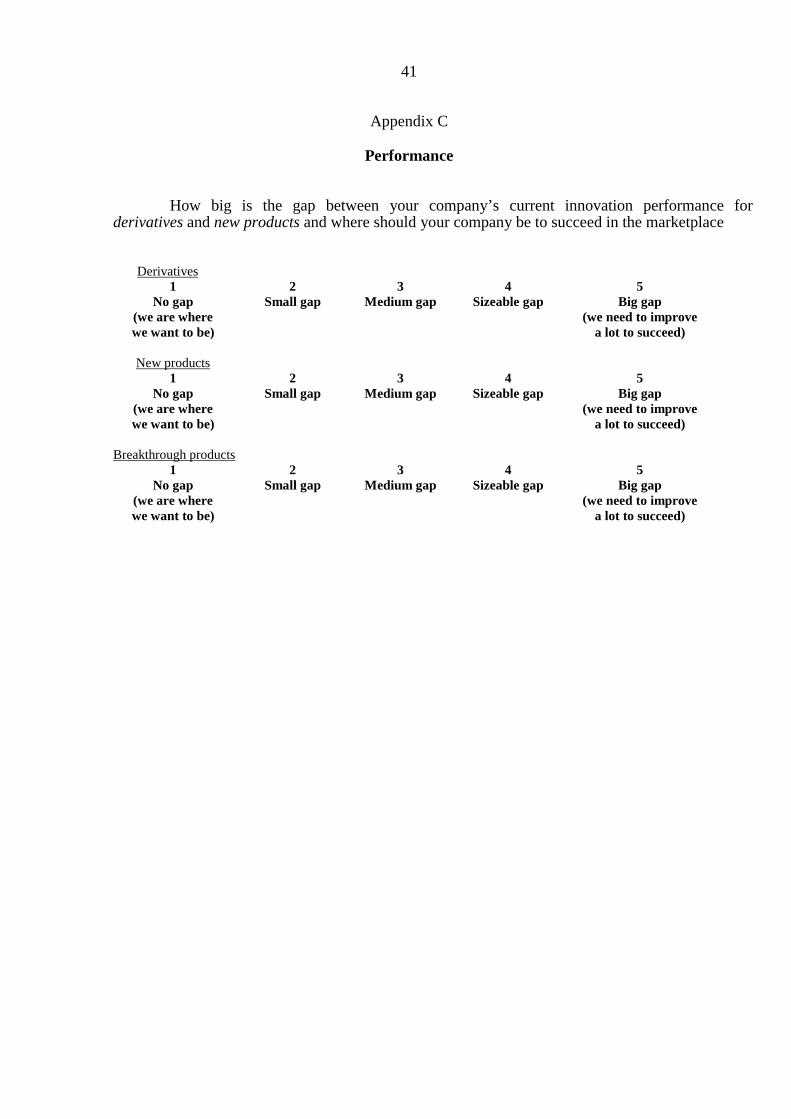
41
Appendix C
Performance
How big is the gap between your company’s current innovation performance for derivatives and new products and where should your company be to succeed in the marketplace
Derivatives 1 2 3 4 5 No gap Small gap Medium gap Sizeable gap Big gap (we are where (we need to improve we want to be) a lot to succeed) New products 1 2 3 4 5 No gap Small gap Medium gap Sizeable gap Big gap (we are where (we need to improve we want to be) a lot to succeed) Breakthrough products 1 2 3 4 5 No gap Small gap Medium gap Sizeable gap Big gap (we are where (we need to improve we want to be) a lot to succeed)