working paper itls-wp-16-16 electronic ticketing systems
TRANSCRIPT

INSTITUTE of TRANSPORT and LOGISTICS STUDIES The Australian Key Centre in
Transport and Logistics Management
The University of Sydney Established under the Australian Research Council’s Key Centre Program.
WORKING PAPER
ITLS-WP-16-16
Electronic ticketing systems as a mechanism for travel behaviour change? Evidence from Sydney’s Opal Card
By Richard B. Ellison1, Adrian B. Ellison1, Stephen P. Greaves1 and Breno Sampaio2
1 Institute of Transport and Logistics Studies, The University of Sydney, Australia 2 Department of Economics, Universidade Federal de Pernambuco, Brazil
August 2016 ISSN 1832-570X


NUMBER: Working Paper ITLS-WP-16-16
TITLE: Electronic ticketing systems as a mechanism for travel
behaviour change? Evidence from Sydney’s Opal Card
ABSTRACT: Smartcard and other forms of electronic ticketing have become
integral to modern public transport systems. While aggregate
ridership figures have generally been positive, little is known
about the drivers behind these changes because of a lack of travel
information on individuals before and after implementation of
such systems. This working paper presents analysis from a
naturalistic travel behaviour study of inner-city Sydney residents
that coincided with the phased introduction of the Opal
smartcard system.
Using a differences-in-differences methodology, results indicate
significant reductions in car use of around 10 minutes/day with
commensurate increases in train use and incidental walking. This
trend holds across income groups and is more pronounced for
older residents. Results add further weight to the merits of
simplifying ticket purchasing as part of a package of policy
measures designed to increase public transport usage.
KEY WORDS: Smartcard ticketing; Public Transport; Travel Behaviour
Change
AUTHORS: Ellison, Ellison, Greaves and Sampaio
CONTACT: INSTITUTE OF TRANSPORT AND LOGISTICS STUDIES
(H73)
The Australian Key Centre in Transport and Logistics
Management
The University of Sydney NSW 2006 Australia
Telephone: +612 9114 1813
E-mail: [email protected]
Internet: http://sydney.edu.au/business/itls
DATE: August 2016


Electronic ticketing systems as a mechanism for travel behaviour change? Evidence from Sydney’s Opal Card Ellison, Ellison, Greaves and Sampaio
1
1. Introduction
Sydney’s smart card ticketing system, the Opal card, was introduced in a phased approach from 2013
to late 2014, replacing Sydney’s existing paper-based ticketing system as the primary ticketing system
for the public transport system. The Opal card is similar in concept to those of other systems in use in
public transport around the world including London’s Oyster card and Hong Kong’s Octopus cards but
with some differences to the fare structure. In common with other smart card ticketing systems, the
Opal card was in large part intended to improve the convenience of using public transport. This
increased convenience was primarily achieved through removing the need to physically buy a paper
ticket for every trip and by providing discounts for single fares compared to the equivalent paper tickets.
However, although these objectives are frequently seen as motivations for introducing smart card
ticketing systems, little research has been conducted to determine what effect they have on people’s
travel patterns and behaviour (as distinct from changes to aggregate patronage levels).
This paper uses data collected from residents of two inner-city areas of Sydney for one week in each
of 2013 and 2014 to assess how the introduction of the Opal card influenced residents’ use of both
public transport itself, and other modes. Uniquely in this paper, the phased approach to the
implementation of the Opal card system created the conditions for a natural experiment that coincided
with an ongoing, but largely unrelated, study collecting data on residents’ health and travel behaviour
(Greaves et al., 2015). This allowed us to use variation in Opal card coverage as a source of exogenous
variation in a differences-in-differences approach to identify the effect of interest.
After this brief introduction, the remainder of the paper is organised as follows. Section 2 describes
Sydney’s public transport ticketing system. Section 3 presents a literature review on smartcards
ticketing systems as well as problems associated with measuring its effects. Section 4 describes the data
and section 5 discusses the empirical strategy we adopt to identify the effect of Opal card on public
transport behaviour. Section 6 and 7 presents results and discussion, respectively. Finally, section 8
concludes.
2. Sydney’s public transport ticketing systems
2.1 Existing paper tickets and fare structure
Sydney’s public transport system has used some form of automated and pre-paid ticketing system since
the late 1980s (Byatt et al., 2007). The existing system in place when the initial phases of the Opal card
were implemented was a system of paper tickets with a complex fare structure with hundreds of

Electronic ticketing systems as a mechanism for travel behaviour change? Evidence from Sydney’s Opal Card
Ellison, Ellison, Greaves and Sampaio
2
combinations of fares for each mode of public transport. This included single, return (peak and off-
peak), ten-ride ("travel ten"), daily, weekly, monthly, quarterly and yearly tickets on a single mode of
transport sold either between specific locations or for trips within zones. Also available were a selection
of multi-modal tickets (known as "My Multi" tickets) that allowed for travel on multiple modes of
transport within set zones. My Multi tickets were available for daily, weekly, monthly, quarterly and
yearly durations. Sydney’s single light rail line operated a completely separate fare structure and
ticketing system although My Multi tickets have been accepted since June 2011.1
The longer duration tickets, travel ten and My Multi tickets were gradually phased out after the
introduction of the Opal card although they were widely available at the time the data for this study
were collected.
2.2 Overview of the Opal card
The initial work on a smart card ticketing system for Sydney’s public transport system began in the
mid-1990s with the intention of having an operational system by the 2000 Sydney Olympic Games.
That system, which became known as the T-Card, was eventually abandoned without ever being fully
rolled out and was replaced by the Opal card project (Mulley and Moutou, 2015).
2.2.1 Fare structure
The fare structure used for Opal is primarily based on the concept of single distance-based fares for
trips on a single mode of transport. Pricing is calculated based on the distance from the origin to the
final destination on the same mode but allowing for transferring between routes or lines within one
hour, and a 30 percent discount for off-peak train travel. There is no off-peak discount for other modes,
including buses. The discount for off-peak train travel meant that it became cheaper to take the train
during off-peak periods than buses for some routes, a reversal of the relative pricing in place with the
paper tickets. To replace the existing paper-based daily and weekly tickets, the Opal fare structure
applies maximum daily and weekly fares of $15 and $60 respectively for all trips regardless of mode.
A maximum cap of $2.50 applies for travel on Sunday.
One unique element of the Opal fare structure is that after eight “journeys” during a week2, all
remaining trips are free3. The mode-specific fares mean that in the Opal fare structure there is a
1 The Sydney Monorail, operated by the same company as the Sydney Light Rail, was dismantled in June 2013
and never accepted My Multi tickets.
2 The Opal week is a fixed week starting on Monday. 3 From September 2016 this will change to a 50% discount instead of free travel.

Electronic ticketing systems as a mechanism for travel behaviour change? Evidence from Sydney’s Opal Card Ellison, Ellison, Greaves and Sampaio
3
distinction made between a “trip” (trips made on a single mode with one hour transfer times) and a
“journey” (trips made on all modes with one hour transfer times). This means that people who commute
to and from work by public transport every weekday can travel for free from Friday, or earlier in the
week if they make additional trips. Both the daily caps and the free trips after eight journeys apply only
to paid trips where the Opal card was used.
2.2.2 Roll-out and coverage
The Opal card was trialed on one of Sydney’s ferry services in December 2012 before being introduced
to the rest of Sydney’s Ferries in mid-2013. The Opal card first became available on the train in the
Central Business District’s (CBD) City Circle line as well as the Eastern Suburbs line in June 2013
followed by a small section of the North Shore line in August 2013 (see Figure 1). By March 2014 the
Opal card was available at all of Sydney’s suburban railway stations. Although the Opal card was
available on all ferries and at a small number of railway stations by August 2013 and the majority of
railway stations by March 2014, the number of people using it remained very low with estimates of less
than five percent of all trips taken using the Opal card by March 2014 (Saulwick, 2014).
The Opal card was rolled out to Sydney’s buses in stages throughout 2014 with bus routes in the
Inner West being among the last of the suburban bus routes to have the Opal card fully implemented. It
was implemented on Sydney’s light rail line in December 2014. By the end of 2015, the Opal Card was
available on most public transport routes in the Sydney Greater Metropolitan Area, with the exception
of some private ferry and coach services. The Opal card can also be used on some intercity trains within
New South Wales (NSW).
3. Literature review
3.1 Smartcard ticketing systems
Although smart card technology has been around since the late 1960s, it was only in the late 1990s that
it began to be used in public transport operations, with Korea’s UPASS and Hong Kong’s Octopus card
in particular, leading the way. Since that time, smartcard systems have seen widespread adoption around
the globe with hundreds of operational systems. Sydney has been somewhat of a laggard in adoption of
the technology for reasons elaborated on in this paper. Most systems operate by users purchasing a
smartcard, which can be used on any compatible public transport mode. The smartcard is typically
prepaid and can be topped up automatically by linking to a credit/debit card or manually by paying
online or in person at various outlets. In some cases, such as the Octopus card, the smartcard can also
be used for a variety of other retail transactions.

Electronic ticketing systems as a mechanism for travel behaviour change? Evidence from Sydney’s Opal Card
Ellison, Ellison, Greaves and Sampaio
4
Figure 1: Opal Rollout
3.2 Benefits of smartcard systems
In a recent review of smartcard ticketing systems, Pelletier et al. 2011, summarise the purported benefits
and challenges of public transport smartcard systems drawing on a wide range of implementation
evidence. Smartcards clearly offer many potential benefits to both users and operators over paper
ticketing, which is why their usage has grown world-wide. From the user perspective, they remove the

Electronic ticketing systems as a mechanism for travel behaviour change? Evidence from Sydney’s Opal Card Ellison, Ellison, Greaves and Sampaio
5
need to physically buy a ticket and are much easier/quicker to use when boarding/alighting public
transport. For instance, London’s Oyster cards were reported to increase boarding rates in London by
four times, while Queensland’s GO card was reported to cut boarding times from 11 to 3 seconds
(Tourism and Transport Forum, 2010). In turn, this has led to greater reported passenger satisfaction;
for instance, following the introduction of the OPUS system in Montreal, overall satisfaction levels
were reported at 90% with the technology (Société de transport de Montréal, 2009).
For operators, this expedition of boardings means less delay to services and a potential increase in
service frequency. Additionally, although there is a large capital cost associated with installing card
readers at stations and on vehicles, evidence suggests that over time, the maintenance costs are
substantially less than paper-ticketing systems (Pelletier et al., 2011). These savings are likely greater
when comparing the cost of manufacturing and distributing a one-off plastic smartcard versus
disposable tickets. It is also suggested smartcard systems are better suited to deterring fare evaders
because of the link with individual information (Tourism and Transport Forum, 2010). However, this
would only appear to be the case where the smartcard is registered to a user – most systems also allow
purchase on an ad-hoc basis.
An additional benefit is the wealth of detailed electronically-captured data on usage of public
transport from a more substantial sample of the population than would typically be gathered from an
on-board or household travel survey (Munizaga et al., 2014). In turn, these data can be utilised to map
key performance indicators, patronage, travel patterns and network/service planning for operators.
3.3 Challenges of smartcard systems
Smartcard systems come with many challenges, particularly in the early stages of implementation where
significant capital investment, software/hardware glitches, and buy-in of users are particular issues
(Deakin and Kim, 2001). For instance, the much-lauded OPUS system in Montreal initially cost
CDN$100 million and experienced many technical problems with readers (Pelletier et al., 2011). Hong
Kong’s Octopus system was found to have problems with its electronic top-up service, which had
affected around 15,270 transactions dating back seven years, costing commuters more than HK$3.7
million (PriceWaterhouseCoopers, 2007). For users, while smartcard systems make travel easier once
the card is purchased, they do require people to remember to swipe on and in most cases off to get the
correct fare as well as keep their account in credit. In practice, people do forget, particularly to swipe
off, which is one reason why the London Oyster scheme moved to flat rate fare for certain services so
passengers only have to swipe on. Privacy is also an inevitable issue that arises, given the provision of
detailed travel information that can be linked to the registered owner of a card.

Electronic ticketing systems as a mechanism for travel behaviour change? Evidence from Sydney’s Opal Card
Ellison, Ellison, Greaves and Sampaio
6
3.4 Barriers to mode switching
Numerous studies have shown that certain mode characteristics are seen as barriers to switching modes,
particularly from car to public transport. These include the perceived inconvenience of public transport,
poor frequencies, the need to travel to multiple destinations (trip “chaining” our “tours”), the inability
of public transport to accommodate adhoc decisions, etc. Arguably, several of these can be alleviated
to some extent by the use of a smartcard ticketing system.
3.5 Impacts of smartcard systems on ridership and mode switching
While the general consensus appears to be that the benefits of smartcard systems outweigh the costs in
comparison to paper ticketing options, the key question of interest here is whether this translates to
increases in ridership. Evidence is largely positive, but is hampered by the fact that the smartcard
implementation is typically accompanied by various endogenous (e.g., changes in fare levels and
structures, service changes) and exogenous factors (e.g., changes in costs of other modes, economic
changes) that have often accompanied introduction (Public Transport Executive, 2009). For instance,
since the introduction of the Oyster card in London in 2003, bus patronage has risen by 56% and tube
ridership by 21% (Thomas, 2013). However, over the same period, there have been major changes in
transport operations, imposition of a congestion charge on cars, as well as significant socio-
demographic changes that have all had an impact.
3.6 Quasi-experimental studies in travel
Quasi-experimental studies have become increasingly popular for studying the dynamics of change in
a field/natural setting (Greaves et al., 2015). Such studies are based on the classical experimental design
where participants are divided into treatment/placebo and control groups and observed before and after
the treatment. In a field setting, there are clearly many more challenges around the actual measurement
of the phenomena of interest as well as identification of a clear ‘control’ group, from which the impacts
of the intervention can truly be assessed. The current study presented somewhat of a unique opportunity,
because there was a natural treatment group where Opal was introduced and a natural control group,
where it was not.
4. Data and sample
The data used for this paper were collected from 435 participants living in two areas of inner-city
Sydney as part of a large study aimed at evaluating how changes in the transport system in Inner Sydney
impact the general health, well-being and travel choices of residents. (Greaves et al., 2015). Although

Electronic ticketing systems as a mechanism for travel behaviour change? Evidence from Sydney’s Opal Card Ellison, Ellison, Greaves and Sampaio
7
both areas are fairly similar to each other, as shown in Figure 2, only one had seen widespread
implementation and adoption of the Opal card in 2014 when the second wave of data were collected.
We refer to this area as the “intervention”. The other area was among the last parts of Sydney to see the
Opal card introduced on its buses and the light rail line and for this reason can be considered a “control”.
It must be acknowledged that participants in the “control” area were able to acquire an Opal card and
use it on services in other areas (including all trains) by the second year of data collection. However, it
must be emphasised that those living in the control area would need to pay twice if they changed from
a non-Opal service (e.g., light rail) to an Opal service and would not get the benefit of free trips after
eight journeys on trips made on non-Opal services. This, coupled with the widespread availability of
multi-modal paper tickets at the time means it likely would have been more expensive for residents of
the control area to use the Opal card than not use it. This is supported by estimates of the number of
registered4 Opal cards by area during the data collection phase that showed a considerably lower
proportion of registered Opal cards sent to addresses in the control area relative to the intervention. As
such, although it is not possible to say conclusively that the participants in the control were not using
the Opal card, it is likely that few were using the Opal card during the time the second year of data were
collected.
4.1 Sample and recruitment
The sample used for this analysis includes only participants who provided usable data for all seven days
during both years of the study. Since the primary objective of the study on which the analysis in this
paper is conducted was the effect of bicycle infrastructure, the sample was limited to people aged
between 18 and 55 years old5 and who did not have health problems that would prevent them from
riding a bicycle.
The sample was recruited using a variety of methods to ensure a reasonable representation of the
population including on key demographic variables (age, gender and location). These methods included
market research panels, cold calling, leaflets and intercept events as well as specific recruitment
methods targeting specific groups (students and cyclists in particular). The final sample was composed
of a total of 435 participants across both the control and the intervention areas (Greaves et al., 2015). A
summary of the demographic characteristics of the final sample is shown in Table 1.
4 Opal cards can be ordered on the Opal website and sent to any address in Sydney. Towards the end of 2014
unregistered Opal cards became available from selected retailers.
5 Pensioner Opal cards, available to those over 60 were not available at the time.

Electronic ticketing systems as a mechanism for travel behaviour change? Evidence from Sydney’s Opal Card
Ellison, Ellison, Greaves and Sampaio
8
Figure 2: Recruitment areas and Opal network
4.2 Data
The data collected from participants included both data on health and their perception of their usual
travel, and a seven day online travel diary that provided detailed data on where, when, why and how
participants travelled to all activities during a one-week period6. Crucial for public transport, multi-
modal trips were also recorded using the travel diary including access and egress modes and the time
spent on each leg of the trip. For the purpose of this analysis, the total time and number of legs used for
6 The reader is referred to Greaves et al. 2014 for full details of the data collection.

Electronic ticketing systems as a mechanism for travel behaviour change? Evidence from Sydney’s Opal Card Ellison, Ellison, Greaves and Sampaio
9
each combination of mode, purpose and day per participant are used. The mean number of trip legs by
bus, car/motorcycle, train and walk as an access/egress mode per person per week are shown in Figure
3. Although there are differences between the control and intervention in terms of their original travel
behaviour, the interest here is in the differences between the changes in the two groups. Given their
relative proximity and similarities, notwithstanding the differences in the public transport modes
available, it would be expected that the relative changes for both areas would be similar and yet walking
as an access or egress mode increased in the intervention and went down (slightly) in the control.
Table 1: Summary of sample demographics
Frequency
Proportion
Area
Control 251 57.7%
Intervention 184 42.3%
Gender
Female 277 61.1%
Male 176 38.9%
Age
18-24 46 10.2%
25-34 93 20.5%
35-44 108 23.8%
45-55 206 45.5%
Income
Less than $80k 130 33.3%
$80k - $140k 122 31.3%
More than $140k 138 35.4%
Not stated 45
Note: Although the incomes appear high, the study area is populated by people with higher than average
incomes and these categories split the sample into roughly equal thirds.

Electronic ticketing systems as a mechanism for travel behaviour change? Evidence from Sydney’s Opal Card
Ellison, Ellison, Greaves and Sampaio
10
Co
ntro
l In
terv
en
tion
C
on
trol
Wo
rk R
ela
ted
Inte
rven
tion
Wo
rk R
ela
ted
Non−
Wo
rk R
ela
ted
Non−
Wo
rk R
ela
ted
Me
an
tri
ps
pe
r w
ee
k p
er
pe
rso
n
12.5
10.0
7.5
5.0
2.5
Bus Car+Motorcycle Train Walk to PT
10.2 9.81
0.0
12.5
10.0
7.5
5.0
2.5
0.0 12.5
10.0
7.5
5.0
2.5
0.0 12.5
10.0
7.5
5.0
2.5
0.0
1.07 0.82
0.58 0.61
1.63 1.64
1.28 1.51
6.12 5.65
3.53 3.84
2.02 2.14
0.18 0.2
0.68 0.82
0.37 0.45
2.14 2.39
1.22 1.16
1.26 1.46
2.24 2.16
3.24 3.73
2013 2014 2013 2014 2013 2014 2013 2014
Year
Figure 3: Mean number of legs per person per week by mode
5. Empirical Strategy The focus of the analysis is to identify the average effect of the Opal Card on public transport use in
inner-city Sydney. More specifically, we are interested in comparing outcomes related to car/motorcycle,
bus, train, other public transport usage and active travel modes such as cycling and walking of
individuals directly affected by the introduction of the Opal Card to what would have happened if the
Opal card had not been introduced. Given outcomes for individuals in the intervention area (i.e. treatment
group) in the absence of the Opal Card are never observed, this needs to be estimated. For this, consider
the following simple difference-in-differences regression model:
yidtm = β0m + β1mOpalidtm + δim + δdm + δtm + ϵidtm (1)
where yidtm represents the outcome variable for individual i in day of week d during period (i.e. before or
after the introduction of Opal) t for mode of transport m. Opalidtm is an indicator variable that takes a
value equal to 1 if the individual i was in the area affected by the Opal Card in period t, and 0 otherwise.
The parameters δim, δdm and δtm are, respectively, individual, day of week and year fixed effects, and ϵidt is
an error term. The parameter of interest, β1m, represents the effect of the introduction of the Opal Card on
the outcome y for a given mode of transport.

Electronic ticketing systems as a mechanism for travel behaviour change? Evidence from Sydney’s Opal Card Ellison, Ellison, Greaves and Sampaio
11
The individual fixed effects (δim) included in the model control non-parametrically for unobservable
individual-invariant characteristics, while the day of week fixed effects (δdm) and the year fixed effects
(δtm) respectively control non-parametrically for day of week fixed differences in travelling behaviour
and for yearly differences between outcome values (for example, fixed year differences within all
individuals included in the sample). We interpret therefore the parameter of interest, β1m, as the causal
effect of the Opal Card on public transport use; i.e., this coefficient represents the difference between
the average of the outcome of interest after the introduction of the Opal Card minus the average of this
outcome before the introduction of the Opal Card for the intervention and control areas:
∆E(yidtm|δim, δdm, δtm, Opal)treated − ∆E(yidtm|δim, δdm, δtm, Opal)untreated = β1m (2)
Our difference-in-differences strategy have until now used variation within time and unit of
treatment to identify the parameter of interest, using individual level fixed effects in all regressions.
However, one possible concern is that the impact of Opal on transport use may not be homogeneous
across individuals, but rather may vary as a function of the characteristics of the individuals. For
example, the impact of introducing Opal may matter more for more educated individuals or for older
individuals. In this case, simple difference-in-difference estimates that we described so far may suffer
from two additional sources of bias (Heckman et al., 1997). The first bias may arise when there are
some individuals who belong to the treated Opal region, but no comparable individual in found on the
untreated region with similar observable characteristics, to provide a reasonable comparison unit. The
second bias may arise from different distributions of the vector of observable variables that affect
transport usage within the two regions.
To account for that, we proceed in two ways. First, we estimate the models conditioning on important
covariates, such as weekdays and weekends, work and non-work related trips, income, age and baseline
self-reported main mode of transport used by the individual. Secondly, we match treated individuals
(those with Opal) with untreated individuals (those in the control region) before treatment to balance a
large set of observable attributes before implementing the differences-in-differences strategy. This is
similar to the generalized difference-in-differences matching estimator proposed by Heckman et al.
(1997) that extends conventional matching methods to longitudinal data and accounts not only for
selection into treatment based on observable variables, given matching, but also accounts for selection
into treatment on the basis of time-invariant unobservables, given individual level fixed effects.
To briefly present the matching method, let there be two potential outcome variables for individual
i, along the lines of Rubin (1974), such that after treatment period we observe:
𝑦𝑖 = {𝑦𝑖1, if 𝑂𝑝𝑎𝑙𝑖𝑑𝑡 = 1𝑦0𝑖 , if 𝑂𝑝𝑎𝑙𝑖𝑑𝑡 = 0
(3)

Electronic ticketing systems as a mechanism for travel behaviour change? Evidence from Sydney’s Opal Card
Ellison, Ellison, Greaves and Sampaio
12
where y1i is the outcome under the presence of Opal and y0i is the outcome without Opal. The causal
effect of the treatment (Opalidt = 1) relative to the control (Opalidt = 0) is defined as the difference
between the corresponding potential outcomes β1i = y1i − y0i.
Here, we focus on the average treatment effect on the treated (ATT) which is defined as
βAT T = E[β1i|Opal = 1] = E[y1i − y0i|Opal = 1] (4)
The problem in estimating equation (4) arises from the fact that comparisons of two outcomes for
the same individual, when exposed and when not exposed to the treatment, is an unfeasible task, as the
same individual can either be treated or not in the same time period (Imbens and Wooldridge, 2009).
That is, we only observe one of the two potential outcomes given treatment status, yi = y0i + (y1i −
y0i)Opalidt.
The objective of the matching procedure, therefore, is to find different individuals (some treated and
some not) such that after adjusting for differences in observed characteristics, or pretreatment variables,
comparisons can be made (Angrist and Pishcke, 2009). In other words, the procedure will construct a
control group such that observable characteristics are balanced in comparison to treated individuals
(Oliveira et al., 2015). This is precisely the intuition behind the matching that, under the conditional
independence (CIA) or unconfoundedness assumption (Rubin, 1974; Heckman and Robb Jr., 1985),
imply that treatment assignment is independent of potential outcomes conditional on a set of covariates
X or, as shown by Rosenbaum and Rubin (1983a,b), on the propensity score, p(X), defined as the
conditional probability of being treated, Prob(Opal = 1|X). In this case, the ATT is obtained by
βAT T = E[β1i|Opal = 1, p(Xi)] = E[y1i − y0i|Opal = 1, p(Xi)] (5)
We will estimate the propensity score via a logit specification with the dependent variable being 1
for the treated region and 0 otherwise. Independent variables include several personal characteristics,
such as age, income, education, and controls for transport usage before the introduction of the Opal
card. After we obtain parameter estimates, we will use them to predict treatment probabilities or
propensity scores for individual i belonging to the treated Opal region. Once propensity scores are
available, we follow the approach carried out by Deng et al. (2012) and match each treated individual
to a close untreated counterpart to obtain more reliable estimates of the effect of interest. Note that this
implies significant reductions to sample size.

Electronic ticketing systems as a mechanism for travel behaviour change? Evidence from Sydney’s Opal Card Ellison, Ellison, Greaves and Sampaio
13
6. Results
The results of the estimated models are presented in the following tables. The estimates in these tables
should be interpreted as the mean number of minutes per day that each person in the intervention group
spent travelling (on a particular mode) relative to how the same person would have travelled had the
Opal card not been introduced.
The estimates for work and non-work trips for weekdays and weekends are shown in Table 2. The
results show that there was a statistically significant reduction in car use for both work and non-work
travel on both weekdays and weekends. The reduction in car use was about 10 minutes per day per
person during weekdays for work trips, and weekends for non-work trips. These reductions are offset
by an increase of a similar magnitude to the total of both train and walking to public transport for work
trips on weekdays. The effect of the Opal card on bus use were only significant for non-work weekend
travel.

Electronic ticketing systems as a mechanism for travel behaviour change? Evidence from Sydney’s Opal Card
Ellison, Ellison, Greaves and Sampaio
14
Table 2: Estimates for Work and non-Work related trips in the intervention area
Mode of Transp. Weekdays Weekends
Work
Non-work
Work
Non-work
Car/Motorcycle
-10.156
-5.962
-1.924
-9.646
(1.997)*** (1.791)*** (0.976)** (3.256)***
Bus
-1.691
0.906
-0.286
1.643
(1.284) (0.626) (0.429) (0.965)*
Train
6.306
2.315
0.141
2.980
(1.303)*** (0.489)*** (0.240) (0.763)***
Walk to Public Transp.
4.771
2.052
0.184
3.584
(1.262)*** (0.642)*** (0.350) (1.211)***
Other Public Transp.
-0.580
1.216
-0.189
0.775
(0.421) (0.387)*** (0.165) (0.600)
Walk Only
3.295
-0.611
0.816
1.525
(1.465)** (1.335) (0.567) (2.250)
Bicycle
0.061
2.524
-0.131
5.086
(0.917) (0.748)*** (0.230) (2.237)**
Other Transp.
-0.446
1.339
-0.203
1.591
(0.441) (0.442)*** (0.171) (0.655)**
Year fixed effect
Day of week fixed effect
Individual fixed effect
Yes
Yes
Yes
Yes
Yes
Yes
Yes
Yes
Yes
Yes
Yes
Yes
Notes: Robust Standard errors in parentheses. ***, ** and * represent p<1%, p<5% and p<10% respectively.
Interpretation: Estimates represent mean number of minutes per day per person travelling on each mode
relative to the same person if the Opal Card had not been introduced.

Electronic ticketing systems as a mechanism for travel behaviour change? Evidence from Sydney’s Opal Card Ellison, Ellison, Greaves and Sampaio
15
Table 3 presents results differentiated by income category. The reduction of car use and increase in
train use and walk-access generally holds across the income groups with the largest effects on work-
trips for those with medium incomes, and on non-work trips for those with high incomes. However,
those with higher incomes were more likely to switch from car to train for work trips while those with
medium incomes were also likely to switch to walking only (as well as trains).
Table 3: Estimates for work and non-Work related trips by income
Mode of Transp.
Work
Non-work
Low Income
Med. Income
High Income
Low. Income
Med. Income
High Income
Car/Motorcycle
-7.403
-9.776
-6.914
-3.578
-5.665
-8.464
(2.809)*** (3.389)*** (2.131)*** (3.207) (3.048)* (2.925)***
Bus -0.716 -2.771 -1.518 0.904 0.875 1.154
(1.713) (1.786) (1.470) (1.167) (1.132) (0.738)
Train 3.639 3.323 6.438 2.358 2.172 2.748
(1.293)*** (1.544)** (1.852)*** (0.971)** (0.734)*** (0.626)***
Walk to Public Transp. 2.338 2.023 4.485 2.919 1.333 2.498
(1.872) (1.694) (1.474)*** (1.434)** (1.117) (0.844)***
Other Public Transp. -0.208 -0.665 -0.748 1.253 0.527 1.479
(0.521) (0.525) (0.484) (0.673)* (0.643) (0.530)***
Walk Only 0.978 5.814 1.354 -0.274 -0.596 1.432
(2.152) (2.409)** (1.610) (2.360) (2.007) (2.324)
Bicycle -0.201 -1.023 1.371 2.894 2.482 4.925
(0.793) (1.287) (1.263) (1.401)** (1.801) (1.955)**
Other Transp. -0.486 -0.304 -0.512 0.689 1.164 2.099
(0.502) (0.554) (0.553) (0.931) (0.702)* (0.559)***
Year fixed effect
Yes
Yes
Yes
Yes
Yes
Yes
Day of week fixed effect Yes Yes Yes Yes Yes Yes
Individual fixed effect Yes Yes Yes Yes Yes Yes
Notes: Robust Standard errors in parentheses. ***, ** and * represent p<1%, p<5% and p<10% respectively.

Electronic ticketing systems as a mechanism for travel behaviour change? Evidence from Sydney’s Opal Card
Ellison, Ellison, Greaves and Sampaio
16
The results of the model estimating the effects of the Opal card based on age had more significant
differences (Table 4). Because there are large similarities between adjoining age groups, the estimates
shown here are only for those younger than 25 years old and 45-55 years old. The results show that
those in the older age category had a statistically significant reduction in car use for both work and non-
work trips. Participants aged younger than 25 years old made a significant switch between buses and
trains for work trips but also an increase for train for non-work weekend trips. In contrast to age and
income, the models for gender showed no significant differences in terms of the effect of the Opal card.
Table 4: Estimates for Work and non-Work related trips by Age
Mode of Transp. Weekdays Weekends
Work Non-work Work Non-Work
18-24 yrs
45-55 yrs
18-24 yrs
45-55 yrs
18-24 yrs
45-55 yrs
18-24 yrs
45-55 yrs
Car/Motorcycle
-3.170
-10.279
-2.072
-7.587
-2.942
-2.340
3.969
-12.943
(4.462) (3.752)*** (3.503) (3.518)** (1.921) (1.377)* (7.953) (5.060)**
Bus -7.192 -1.986 -0.514 1.273 -4.715 0.167 0.223 -0.950
(3.446)** (1.752) (1.905) (1.159) (2.609)* (0.178) (2.563) (1.554)
Train 6.555 4.492 1.935 2.631 -0.230 0.329 5.165 1.674
(2.759)** (1.971)** (1.241) (0.841)*** (1.095) (0.269) (1.976)** (1.282)
Walk to Public Transp. 2.963 4.980 1.010 3.173 -1.860 0.375 4.203 2.529
(2.774) (2.562)* (1.678) (1.153)*** (1.840) (0.378) (1.907)** (2.477)
Other Public Transp. -0.649 -0.656 1.715 1.078 -1.074 0.167 0.526 -0.347
(0.894) (0.677) (0.945)* (0.706) (0.809) (0.178) (1.709) (1.012)
Walk Only 1.012 6.393 2.164 0.522 3.647 -0.100 0.776 1.023
(2.951) (2.576)** (3.273) (2.343) (3.317) (0.251) (3.341) (4.058)
Bicycle -1.143 1.962 2.569 2.331 -0.889 0.133 -0.493 4.620
(1.430) (1.876) (1.244)** (1.283)* (0.862) (0.326) (2.512) (3.821)
Other Transp. -1.041 0.157 0.915 1.003 -0.759 0.067 -0.426 0.034
(0.866) (0.735) (1.219) (0.770) (0.825) (0.197) (1.613) (0.968)
Year fixed effect
Yes
Yes
Yes
Yes
Yes
Yes
Yes
Yes
Day of week fixed effect Yes Yes Yes Yes Yes Yes Yes Yes
Individual fixed effect Yes Yes Yes Yes Yes Yes Yes Yes
Notes: Robust Standard errors in parentheses. ***, ** and * represent p<1%, p<5% and p<10% respectively.
Electronic ticketing systems as a mechanism for travel behaviour change? Evidence from Sydney’s Opal Card Ellison, Ellison, Greaves and Sampaio
17
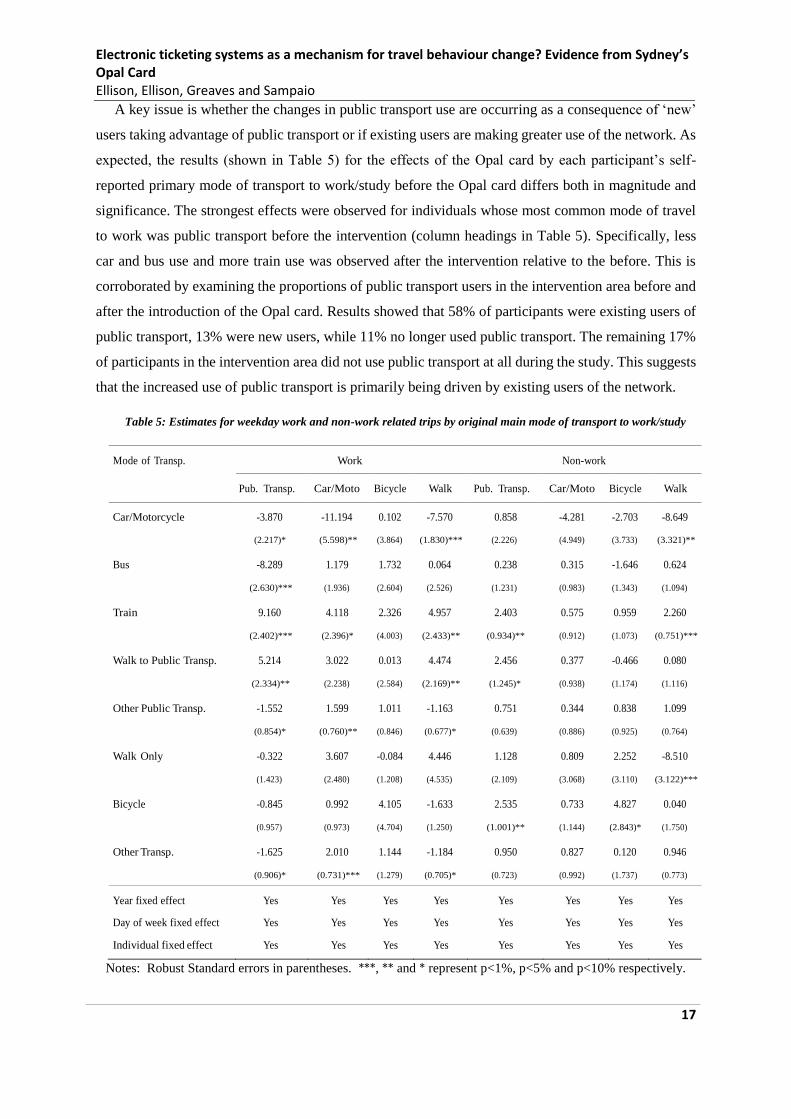
A key issue is whether the changes in public transport use are occurring as a consequence of ‘new’
users taking advantage of public transport or if existing users are making greater use of the network. As
expected, the results (shown in Table 5) for the effects of the Opal card by each participant’s self-
reported primary mode of transport to work/study before the Opal card differs both in magnitude and
significance. The strongest effects were observed for individuals whose most common mode of travel
to work was public transport before the intervention (column headings in Table 5). Specifically, less
car and bus use and more train use was observed after the intervention relative to the before. This is
corroborated by examining the proportions of public transport users in the intervention area before and
after the introduction of the Opal card. Results showed that 58% of participants were existing users of
public transport, 13% were new users, while 11% no longer used public transport. The remaining 17%
of participants in the intervention area did not use public transport at all during the study. This suggests
that the increased use of public transport is primarily being driven by existing users of the network.
Table 5: Estimates for weekday work and non-work related trips by original main mode of transport to work/study
Mode of Transp.
Work
Non-work
Pub. Transp.
Car/Moto
Bicycle
Walk
Pub. Transp.
Car/Moto
Bicycle
Walk
Car/Motorcycle
-3.870
-11.194
0.102
-7.570
0.858
-4.281
-2.703
-8.649
(2.217)* (5.598)** (3.864) (1.830)*** (2.226) (4.949) (3.733) (3.321)**
Bus -8.289 1.179 1.732 0.064 0.238 0.315 -1.646 0.624
(2.630)*** (1.936) (2.604) (2.526) (1.231) (0.983) (1.343) (1.094)
Train 9.160 4.118 2.326 4.957 2.403 0.575 0.959 2.260
(2.402)*** (2.396)* (4.003) (2.433)** (0.934)** (0.912) (1.073) (0.751)***
Walk to Public Transp. 5.214 3.022 0.013 4.474 2.456 0.377 -0.466 0.080
(2.334)** (2.238) (2.584) (2.169)** (1.245)* (0.938) (1.174) (1.116)
Other Public Transp. -1.552 1.599 1.011 -1.163 0.751 0.344 0.838 1.099
(0.854)* (0.760)** (0.846) (0.677)* (0.639) (0.886) (0.925) (0.764)
Walk Only -0.322 3.607 -0.084 4.446 1.128 0.809 2.252 -8.510
(1.423) (2.480) (1.208) (4.535) (2.109) (3.068) (3.110) (3.122)***
Bicycle -0.845 0.992 4.105 -1.633 2.535 0.733 4.827 0.040
(0.957) (0.973) (4.704) (1.250) (1.001)** (1.144) (2.843)* (1.750)
Other Transp. -1.625 2.010 1.144 -1.184 0.950 0.827 0.120 0.946
(0.906)* (0.731)*** (1.279) (0.705)* (0.723) (0.992) (1.737) (0.773)
Year fixed effect
Yes
Yes
Yes
Yes
Yes
Yes
Yes
Yes
Day of week fixed effect Yes Yes Yes Yes Yes Yes Yes Yes
Individual fixed effect Yes Yes Yes Yes Yes Yes Yes Yes
Notes: Robust Standard errors in parentheses. ***, ** and * represent p<1%, p<5% and p<10% respectively.

Electronic ticketing systems as a mechanism for travel behaviour change? Evidence from Sydney’s Opal Card
Ellison, Ellison, Greaves and Sampaio
18
6.1 Propensity Score
We now move to our estimation of the propensity score. The purpose of this exercise is to determine
how similar those in the intervention group are to the control group based on personal characteristics.
We decided to include in the vector of controls all observed characteristics that may jointly determine
both treatment (Opal) and outcome (time travelling on a particular mode). As argued in Section 5, this
strategy may help in constructing a control group that is balanced in comparison to those in the
intervention group in terms of observable characteristics.
Results for the propensity score logistic specification (logit model) are reported in table 6.
Individuals in the intervention area are evidently younger, earn higher incomes and less likely to be
students compared to those in the control area. However, they are quite similar in terms of gender,
working status and education level. Our specification also includes variables related to baseline
transport choices, to account for initial levels of public/private transport usage. Hence, we include for
each mode of transport the time spent travelling before any intervention took place. As can be observed,
coefficients are quite small, although statistically significant for a few modes. This highlights potential
gains from using the matching approach we implement here. In this case, participants in the intervention
group can be matched to similar participants in the control group thereby controlling for any remaining
differences between the composition of the intervention group relative to the control group.
Before presenting the propensity score matching (PSM) results, however, we assess whether the
implemented matching procedure has been effective in balancing observable variables. As emphasised
by Dehejia and Wahba 2002, a matching procedure will be successful if members in the selected control
group (matched sample) have similar observable characteristics (variables included in the vector of
covariates) when compared to the intervention group.
Table 6 contains statistics that summarise the quality of the PSM implementation. In the second
column of Table 7, which displays the pseudo R2 from the estimation of the conditional treatment
probability (propensity score) on both raw and matched samples
(i.e., before and after matching), we first show that the model has significantly less power to explain
treatment status after matching. Pseudo R2 presented a reduction of about 80%. This is confirmed by
the Likelihood-Ratio (LR) test of the joint insignificance of all the regressors in column 3, which also
suggests that the matched sample is well balanced in the observed variables. Finally, substantial
reduction in mean and median absolute bias (intervention versus control differences in covariate means
and medians before and after matching), as computed in Rosenbaum and Rubin 1985, is achieved
(columns 4 and 5). Both present a reduction of about 70% and 65%, respectively. This means that the
demographic characteristics of the matched sample do not predict the area (intervention or control) in

Electronic ticketing systems as a mechanism for travel behaviour change? Evidence from Sydney’s Opal Card Ellison, Ellison, Greaves and Sampaio
19
which they live. This is good because it means the sample in each area are not characteristically different
from each other and can, therefore, be reasonable compared.
We now analyse results for the propensity score matching (PSM) estimation in Table 8. As one may
observe, results are quite similar to the ones presented in table 2, although coefficient estimates are
slightly smaller and standard deviations are slightly larger (as expected, given smaller sample sizes7),
making some of our parameters statistically insignificant. Empirical implications, however, are mostly
left unchanged: car usage decreases for work related activities on weekdays and non-work related
activities on weekends; total train and walk to public transport increases; and bus usage increases for
non-work weekend travel. These results not only reinforce our conclusions regarding the policy, but
also adds credibility to our empirical findings given both strategies deliver similar implications.8
Table 6: Matching logit: regression of Opal on all other covariates for intervention relative to control
Variables Estimates stand. dev.
Age -0.050 (0.013)***
Male 0.411 (0.251)
Income less than $80k -0.734 (0.323)**
Income $80k-$140k -0.881 (0.301)***
Student -1.164 (0.530)**
Part-time Worker -0.241 (0.453)
Full-time Worker -0.135 (0.432)
Tertiary Degree -0.251 (0.730)
High School 0.015 (0.753)
Car/M oto - work related -0.004 (0.001)***
Car/M oto - non-work related -0.002 (0.001)**
Bus - work related -0.004 (0.002)**
Bus - non-work related -0.011 (0.004)***
T rain - work related 0.005 (0.002)**
T rain - non-work related 0.008 (0.006)
W alkP T - work related 0.001 (0.002)
W alkP T - non-work related 0.005 (0.004)
OtherP T - work related -0.027 (0.012)**
OtherP T - non-work related -0.028 (0.015)*
Constant 3.384 (1.051)*** N 435
Note: *** represents p<1%, ** represents p<5%, and * represents p<10%.
7 With a matched sample each person in the intervention area is matched to one similar person in the control area.
Since there were slightly fewer participants in the intervention area (see table 1), non- matched individuals in the
control area were dropped in the matched sample.
8 Results via matching were also similar for tables 2-5, which we do not report to save space. They are however
available upon request.

Electronic ticketing systems as a mechanism for travel behaviour change? Evidence from Sydney’s Opal Card
Ellison, Ellison, Greaves and Sampaio
20
Work Non-work Work Non-work
Car/Moto -5.892 -1.358 -1.270 -4.008
(2.265)*** (1.991) (1.100) (3.952)
Bus 0.150 0.022 0.234 1.898
(1.370) (0.745) (0.355) (1.090)*
Train 5.267 1.467 0.193 2.975
(1.570)*** (0.579)** (0.301) (0.860)***
Walk to Public Transp. 5.259 0.833 0.328 3.883
(1.491)*** (0.803) (0.411) (1.348)***
Other Public Transp. -0.358 0.751 -0.149 0.793
(0.483) (0.444)* (0.235) (0.703)
Walk Only 1.777 -2.549 0.874 1.501
(1.663) (1.727) (0.631) (2.724)
Bicycle -0.546 2.105 0.084 3.883
(1.146) (0.813)** (0.276) (2.595)
Other Transp. -0.676 0.600 -0.076 1.697
(0.535) (0.582) (0.238) (0.761)**
Year fixed effect
Day of week fixed effect
Individual fixed effect
Yes
Yes
Yes
Yes
Yes
Yes
Yes
Yes
Yes
Yes
Yes
Yes
Table 7: Balance quality before (Raw) and after (Match) matching
Sample Pseudo R2 LR χ2 Mean Bias Median Bias
Raw 0.235 139.45∗∗∗ 26.2 19.9
Match 0.045 22.88 8.0 6.8
Note: *** represents p<1%. The mean and median bias serve as summary indicators of the distribution of the
absolute bias and are calculated as treated versus control differences in covariate means and medians before and
after matching.
Table 8: Estimates for Work and non-Work related trips - Matched sample
Mode of Transp. Weekdays Weekends
Notes: Robust Standard errors in parentheses. ***, ** and * represent p<1%, p<5%, and p<10% respectively.

Electronic ticketing systems as a mechanism for travel behaviour change? Evidence from Sydney’s Opal Card Ellison, Ellison, Greaves and Sampaio
21
7. Discussion
The results presented in Section 6 show that the effects of the Opal card on travel behaviour varies quite
substantially by a number of different factors including the type of trip and the day of the week as well
as some (but not all) personal characteristics. However, even at the aggregate level the introduction of
the Opal system has coincided with significant changes in the use of most modes of transport. In
particular, there is a strong and significant effect of people switching from cars (and motorcycles) to
public transport, in particular to train travel. This travel is replaced with a similar amount of time spent
using public transport and walking to access public transport. Although to be expected, the link between
increases in public transport use and walking, either as an access/egress mode or as a stand-alone mode,
is particularly positive given the health benefits of even relatively short amounts of walking (Pucher
and Dijkstra, 2003).
The effects of Opal appear to be most pronounced for work trips on weekdays and non-work trips
on weekends with reductions of around 10 minutes in car trips per day per person. In part, this is likely
to be a result of the incentive of free trips after eight journeys that means those who commute to work
by public transport during the week travel for free on weekends. Although many of these weekend trips
are likely to be free for the user, there is undoubtedly a societal benefit from reducing car use for
discretionary trips particularly since these trips have had relatively high car mode share in Sydney
relative to commuting trips (Greaves et al., 2015).
For people whose stated main mode of travel to work (or study) was public transport, there was a
significant shift in mode from bus to train for work trips. This was coupled with an increase in walking
to public transport suggesting that people chose to walk further to access the train. There are two
possible reasons for this effect. The first is that the Opal fare structure meant that for some trips in off-
peak periods, the train became cheaper than the bus. However, since this effect was primarily for work
trips, for which travel is largely during peak periods, this cannot fully explain the effect. Likely a more
important reason for this effect is the removal of multi-modal tickets (the “My Multi” tickets). This
means commuters who change modes pay two fares but these count for only one “journey” towards the
eight required for free travel. This appears to have had the effect of commuters choosing to walk (on
average further) to a railway station rather than first taking a bus then transferring to a train.
Nonetheless, even for commuters whose primary mode of travel to work was public transport before
the Opal card, the number of trips by car reduced (albeit only at the 0.1 significance level).
The differences in the effects of the Opal card between people of different ages and incomes provides
further insights into the switching from car to public transport and from bus to train. The reduction in
car use for those older than 44 years old in contrast to those younger than 25 who do not reduce their

Electronic ticketing systems as a mechanism for travel behaviour change? Evidence from Sydney’s Opal Card
Ellison, Ellison, Greaves and Sampaio
22
use of car suggests that the Opal card was successful in encouraging people who were previously less
likely to use public transport to commute by train. Those older than 44 were as likely to switch to
walking only as to the train. However, the switching from bus to train travel by those younger than 25
suggests that the effect of the Opal card on younger people (who are less likely to own a car) is one of
switching between modes of public transport. That it is primarily age (rather than income) that is driving
the effect of the Opal card on commuting trips is supported by the relative consistency of the effect by
income for work trips (in contrast to the larger changes for those with high incomes for non-work trips).
It must be acknowledged that it is not possible in the context of this study to differentiate between
the effect of the Opal card itself from the effect of the fare structure. However, it can be argued that a
new (and frequently simpler) fare structure is an inherent feature of smartcard ticketing systems for
public transport. Few, if any, major public transport systems retained the original fare structure (and
pricing) of the system when the smartcard ticketing system was introduced. Nonetheless, the results in
Section 6 and this discussion should be interpreted as the effects of the Opal card system as a whole
including both the method of payment (i.e., the Opal card) and the accompanying fare structure.
Furthermore, although the results presented here provide some evidence that the fare structure
influences the exact effect of the smartcard ticketing system (e.g., by promoting or discouraging multi-
modal trips), it is unlikely that changes to the fare structure would result in as large a switch from car
to public transport for those who did not use public transport previously.
Placing these results in a wider context, this analysis adds to the generally positive view of Smartcard
systems from cities that have implemented them. While much of the policy focus has been on improving
service levels and coverage, reducing the barriers associated with complicated, cumbersome ticketing
systems appears to be integral to encouraging ridership. It is true that despite the positives, Smartcard
systems such as Opal still present many barriers particularly to the millions of annual visitors to Sydney.
One obvious evolution is to provide greater flexibility in the use of personal credit cards (now
operational in London) and mobile phone apps. A trial with contactless payment with credit and debit
cards has been announced for 2017 (Transport for NSW, 2016). This may also make it easier to convert
some non-users to incidental users meaning that someone may use public transport on an ad-hoc basis
if it is more convenient than waiting for a lift or a taxi.
8. Conclusions
Smartcard and other forms of electronic ticketing have become integral to modern public transport
systems around the globe testament to their touted benefits outweighing the challenges of
implementation. However, while aggregate ridership figures have generally been positive, little is
known about the drivers behind these changes because of a lack of travel information on individuals

Electronic ticketing systems as a mechanism for travel behaviour change? Evidence from Sydney’s Opal Card Ellison, Ellison, Greaves and Sampaio
23
before and after implementation of such systems. Utilising a panel survey of inner-city residents that
coincided with the phased introduction of the Opal smartcard system and associated changes in fare
structures in Sydney, the current paper uses a differences-in-differences methodology to provide
evidence of significant changes in mode choice. Of most note, is the changes appear to have encouraged
people from private cars to public transport, although this is primarily towards the train as opposed to
bus. In turn this has led to other positive outcomes, including an increase in (incidental) walking to
access/egress public transport. That this switching is observed across income groups is particularly
encouraging, because it suggests the changes have also spread to higher income groups, who are
generally the most resistant to switch to public transport.
As with any study of this nature, there are acknowledged limitations. First, naturalistic field
experiments such as this, invariably suffer from endogenous (fare structure, system changes) and
exogenous (economic changes) effects over and above the intervention as identified in Section 3. The
incorporation of a control area and the methodology employed attempted to deal to with the exogenous
effects, while the endogenous effects are (arguably) an inherent component of smartcard introductions
as discussed in the previous section. Second, it must be stressed, the sample were drawn from inner-
Sydney, where multi-modal transport options are generally available – the situation is quite different in
the auto-dominated middle and outer suburbs of the city, where significant public transport is needed
above and beyond the improvement of the ticketing system. Finally, the extent to which the changes
are sustained over time is clearly crucial, particularly in view of other planned system or fare changes.

Electronic ticketing systems as a mechanism for travel behaviour change? Evidence from Sydney’s Opal Card
Ellison, Ellison, Greaves and Sampaio
24
References
Angrist, J., Pishcke, J.-S., 2009. Mostly Harmless Econometrics. Princeton University Press,
Cambridge, USA.
Byatt, M., Oscuro, G., Rookes, M., 2007. Improving Efficiency: An Evaluation of Sydney Buses "Bondi
Bendy" Prepay Service. In: 10th International Conference on Competition and Ownership in Land
Passenger Transport (Thredbo 10). Hamilton Island.
Dehejia, R., Wahba, S., 2002. Propensity score-matching methods for nonexperimental causal studies.
The Review of Economics and Statistics 84, 151–161.
Deng, Y., McMillen, D. P., Sing, T. F., 2012. Private residential price indices in Singapore: A matching
approach. Regional Science and Urban Economics 42, 485–494.
Greaves, S. P., Ellison, A. B., Ellison, R. B., Rance, D., Standen, C., Rissel, C., Crane, M., 2014. A
Web-Based Diary and Companion Smartphone app for Travel/Activity Surveys. Transportation
Research Procedia 11, 297–310. URL http://dx.doi.org/10.1016/j.trpro.2015.12.026
Greaves, S. P., Ellison, R. B., Ellison, A. B., Standen, C., Rissel, C., Crane, M., 2015. Changes in
cycling following an infrastructure investment. In: Proceedings of the 37th Australasian Transport
Research Forum. Sydney.
Heckman, J. J., Ichimura, H., Todd, P., 1997. Matching as an Econometric Evaluation Estimator:
Evidence from Evaluating a Job Training Programme. Review of Economic Studies 64 (3), 605–
654.
Heckman, J. J., Robb Jr., R., 1985. Alternative methods for evaluating the impact of interventions: an
overview. Journal of Econometrics 30 (1–2), 239–267.
Imbens, G., Wooldridge, J., 2009. Recent Developments in the Econometrics of Program Evaluation.
Journal of Economic Literature 47 (1), 5–86.
Mulley, C., Moutou, C. J., 2015. Not too late to learn from the sydney olympics experience:
Opportunities offered by multimodality in current transport policy. Cities 45, 117–122.
Munizaga, M., Devillaine, F., Navarrete, C., Silva, D., 2014. Validating travel behavior estimated from
smartcard data. Transportation Research Part C: Emerging Technologies 44, 70–79.
URL http://www.sciencedirect.com/science/article/pii/S0968090X14000801
Oliveira, R., Moura, K., Viana, J., Tigre, R., Sampaio, B., 2015. Commute duration and health:
Empirical evidence from Brazil. Transportation Research Part A: Policy and Practice 80, 62–75.

Electronic ticketing systems as a mechanism for travel behaviour change? Evidence from Sydney’s Opal Card Ellison, Ellison, Greaves and Sampaio
25
Pelletier, M.-P., Trépanier, M., Morency, C., 2011. Smart card data use in public transit: A literature
review. Tech. Rep. 4.
PriceWaterhouseCoopers, 2007. Octopus Cards Limited: Report on the Independent Review Under
Section 59(2) of the Hong Kong Banking Ordinance. Tech. rep., Legislative Council of the Hong
Kong SAR, Hong Kong. URL http://www.legco.gov.hk/yr06-07/english/panels/fa/papers/
fa0302cb1-2285-2-e.pdf
Public Transport Executive, 2009. The Benefits of Simplified and Integrated Ticketing in Public
Transport. Tech. Rep. October.
Pucher, J., Dijkstra, L., 2003. Promoting Safe Walking and Cycling to Improve Public Health: Lessons
from The Netherlands and Germany. American Journal of Public Health 93 (9), 1509–1516.
Rosenbaum, P., Rubin, D., 1983a. Assessing sensitivity to an unobserved binary covariate in an
observational study with binary outcome. Journal of the Royal Statistical Society B 45, 212–218.
Rosenbaum, P., Rubin, D., 1983b. The central role of the propensity score in observational studies for
causal effects. Biometrika 70, 41–55.
Rosenbaum, P., Rubin, D., 1985. Constructing a Control Group Using Multivariate Matched Sampling
Methods That Incorporate the Propensity Score. The American Statistician 39 (1), 33–38.
Rubin, D. B., 1974. Estimating causal effects of treatments in randomized and nonrandomized studies.
Journal of Educational Psychology 66 (5), 688–701.
Saulwick, J., mar 2014. Take-up of Opal card low as site shows trips are more expensive.
URL http://www.smh.com.au/nsw/takeup-of-opal-card-low-as-site-shows-trips-are-more html
Société de transport de Montréal, 2009. On the Move: 2009 Activity Report. Tech. rep., Société de
transport de Montréal, Montreal, Canada. URL https://www.stm.info/sites/default/files/a-ra2009.pdf
Thomas, R., 2013. Urban Mobility Innovation / Nextcity. In: Global Technology Workshop.
International Bridge, Tunnel and Turnpike Association, Normandy, France.
URLhttp://www.ibtta.org/sites/default/files/documents/2013/Normandy/ Thomas_Richard.pdf
Tourism and Transport Forum, 2010. Smartcard ticketing on public transport (July), 1–15.
Transport for NSW, apr 2016. The future of transport: Contactless payment with credit and debit cards.
URL https://www.opal.com.au/en/news/opalnews/news_19April2016.html