working paper no. 268 · 1 introduction affirmative action (aa) or preferential policies...
TRANSCRIPT

ISSN No. 2454 – 1427
CDE December 2016
DOMINANT OR BACKWARD? POLITICAL ECONOMY OF THE DEMAND FOR QUOTAS BY JATS, PATELS AND MARATHAS
Ashwini Deshpande Email:[email protected] Department of Economics Delhi School of Economics
Rajesh Ramachandran Email: [email protected]
Faculty of Economics and Business Administration, Goethe University, Frankfurt
Working Paper No. 268 http://www.cdedse.org/pdf/work268.pdf
CENTRE FOR DEVELOPMENT ECONOMICS DELHI SCHOOL OF ECONOMICS
DELHI 110007

Dominant or Backward? Political Economy of the
Demand for Quotas by Jats, Patels and Marathas
Ashwini Deshpande and Rajesh Ramachandran∗
December 2016
Abstract
Using data from the India Human Development Survey (IHDS), this paper examines the
claims of three communities, viz., Jats in Haryana, Patels in Gujarat and Marathas in Maha-
rashtra, to be classified as Other Backward Classes (OBC) in order to gain access to affirmative
action. Comparing these three groups to the other major caste groups - Brahmins, Other For-
ward Castes, existing OBCs and Scheduled Castes and Tribes (SC and STs) in their respective
states – on socio-economic indicators such as household consumption expenditure, poverty,
access to infrastructure, self-declared practice of untouchability, education and occupational
status, we find that that these three communities are closer to the dominant groups - Brahmins
and Other Forward Castes - than to the existing disadvantaged groups - OBCs and SC-STs.
Thus, their claim to backwardness is not justified by empirical data. We then examine the
material basis of their anxieties in the context of structural changes in the Indian economy,
particularly agriculture. We also investigate their networks and political connections that ex-
plain their success in mobilizing large numbers in support of their demands.
JEL: I24, O15; J45; J78
Keywords: Affirmative Action, Caste, Quotas, Education, India,
∗Deshpande: Delhi School of Economics, University of Delhi, [email protected]. Ra-
machandran: Faculty of Economics and Business Administration, Goethe University, Frankfurt,
We would like to thank Guilhem Cassan, Francesca Jensenius, Anirban Kar, Anirban Mitra and
Rohini Somanathan for their suggestions and comments. We are also grateful to conference partic-
ipants at Yale University, Indian Statistical Institute, New Delhi, International School of Business,
Hyderabad, World Bank-International Economic Association “Roundtable on Inequality", Jordan,
Political Economy of India Workshop, Universitè de Namur and the Centre for Development Eco-
nomics (CDE)- Centre for Competitive Advantage in Global Economy (CAGE), University of
Warwick workshop “Political Economy and Development", where earlier versions of this paper
were presented, for their suggestions and useful comments. We are responsible for all remaining
errors and omissions.
1

1 Introduction
Affirmative action (AA) or preferential policies everywhere, regardless of their form (preferences
in the USA, or quotas in India) are highly controversial.1 On the one hand these policies are under
increasing attack (witness the AA rollback in the US and demands for abolition of reservations in
India) and widely unpopular, especially among the middle-classes. On the other hand, there is visi-
ble and vocal articulation of a perception of marginalization, followed by demands of protection by
communities, such as Jats, Patels and Marathas, that may not necessarily be seen as marginalized
by those who are at the bottom of socio-economic hierarchy. How does one reconcile the fierce op-
position to affirmative action with increasing demands for it, when the same group expresses these?
Based on evidence from caste quotas in India, we argue that dominant groups, driven by anxieties
about their place in the new economy and by a perception of marginalization and relative depriva-
tion, demand preferences for themselves because preferential policies work, that is, they deliver real
benefit to those who use them.2
In a first-of-its-kind exercise, this paper provides detailed evidence on various socio-economic
status indicators of three particular castes or jatis in India - Patels or Patidars in Gujarat, Jats in
Haryana3 and Marathas in Maharashtra - in relation to other broad caste groups in their respective
states, in order to examine the validity of their claim to ‘backwardness’. We use data from India
Human Development Survey (IHDS), 2011-12 that has information on specific jatis, and find that
these three groups are closer to the socioeconomically dominant caste groups - Brahmins and other
1See references in Holzer and Neumark (2000), Weisskopf (2004) and Deshpande (2013); AA
is challenged even when these are targeted towards individuals or groups that might be genuinely
disadvantaged or stigmatized.2Deshpande and Ramachandran (2016) provide empirical evidence on positive effects of AA in
India.3Jats are spread over several north Indian states such as Haryana, Punjab, Himachal Pradesh,
Delhi and Uttar Pradesh (UP). Jats in UP have also been demanding reservations (Singh, 2011), but
we focus on the Haryana Jats because they are considered a dominant caste in that state, thus their
agitation has been very prominent recently, as well as because reservation was granted to them by
the government to be withdrawn later by the courts.
2

forward castes - in their respective states on a variety of indicators - such as per capita consump-
tion expenditure, poverty status, educational attainment and occupational status - compared to the
existing socioeconomically disadvantaged groups - OBCs and the Dalits and Adivasis (or Scheduled
Castes and Scheduled Tribes (SC-STs)).
Next, we empirically examine what factors might underlie their anxieties which led them to artic-
ulate a demand for quotas so forcefully. We propose a structural change hypothesis which suggests
that the groups might feel disempowered due to the widespread structural changes in the agrarian
sector – rise of large corporations, land fragmentation, water shortages – and their presumed inabil-
ity to take advantage of new opportunities in the non-agricultural sector, hampered by their relative
lack of fluency in English, the language of the elite non-agricultural sector. As compared to their
relatively dominant position in agriculture, we document that in the non-agricultural sector these
groups are predominantly employed in “casual" jobs that do not provide any security and insur-
ance, and are paid by a daily wage or a piece rate. However, it is important to note that though the
relative advantage of the Jats, Patels and Marathas in the agricultural sector is greater that in the
non-agricultural sector, they still do better in absolute terms than the socially disadvantaged groups
in the non-agricultural sector. Comparing changes over time on educational attainment, per capita
consumption expenditure and the probability of being classified as poor shows that the three jatis -
Jats, Patels and Marathas - have increased their relative advantage over the time period 2004-05 (the
first round of IHDS data) to 2011-12 (the second round). Thus, our analysis shows that not only do
they possess an advantage over the ‘backward’ groups, but in fact have consolidated their relative
position compared to the disadvantaged groups, and that the narrative of “the ground is slipping
beneath their feet" is largely based on perceptions and has little empirical support in the data.
This raises the interesting question about factors explaining their success in creating and sustain-
ing powerful movements that have been sufficiently large and disruptive so as to compel governments
to take notice of their demands. The support for their demands has come from the highest legislative
body in the state – the state governments of Haryana and Maharashtra, as Jats and Marathas were
3

granted access to reserved positions, a decision that was later withdrawn by the courts. The data
shows that the connectedness of the three jatis in their local political networks, both within and out-
side their communities, might be an important factor underlying this success.
Our paper contributes to the scholarly understanding of a relatively under-studied phenomenon -
factors that prompt dominant or powerful groups to view themselves as marginalized or under threat,
and ask for remedial measures. There are few international instances where the dominant group be-
comes the beneficiary of special or remedial treatment - perhaps the most egregious instance being
the apartheid system in South Africa. Other examples include Malaysia’s New Economic Policy
of affirmative action in favor of the politically dominant Malays, or reserving conscription into the
Israel army to Jews and a few minorities, but excluding Arab citizens of Israel. Commentaries an-
alyzing recent political events, such as Brexit and Donald Trump’s election as the President of the
USA, have emphasized anxieties of white men, a group that includes poor and working class white
men, but would ordinarily be seen as dominant in comparison to women and racial, ethnic or sex-
ual minorities. Our results suggest that socially powerful groups might be successful in powerfully
articulating their demands and being heeded, though objectively other groups in society might be
more deserving recipients of government assistance.
The rest of this paper is organized as follows. Section 2 contains a brief review of related liter-
ature. Section 3 empirically examines the relative position of the three Jatis, and its changes over
time, especially in educational attainment, to examine the validity of their demands. Section 4, in
turn, explores the determinants of social mobilization by the three groups, and the factors underlying
their success, and Section 5 offers concluding comments.
2 Review of related literature
Literature on these three jatis and their demand for reservations is mostly ethnographic and/or con-
sists of commentaries that trace the history of these specific demands. We provide a brief overview of
4

studies that help us contextualise these demands for quotas. Chandra (1997) examines how Kanbis of
Gujarat, who were predominantly agricultural castes, accumulated wealth as a result of migration to
east Africa and returned to India to claim a higher caste status, along with the more gentrified name
of “Patidar", signalling their upward mobility. Thus, their demand to be considered “backward" is
an about-face. This is very similar to the Jat story. Datta (1999)’s short commentary discusses how
the Jat strategy changed from that of demanding Kshatriya status via the Arya Samaj movement,
which was denied to them by the upper castes and colonial authorities, to that of demanding OBC
status via the Jat Mahasabha, the umbrella organization of Jats across different states in north India.
Datta (1999, pp. 3172) argues that their chief concern, not articulated as such, is to “access state
resources, homogenise Jat society vis-à-vis the others in the scramble for power and influence, and
restore the political and social equilibrium that was partially disturbed by Mandalisation". In a par-
allel vein, Deore and Munde (2013) suggest that for certain Maratha leaders to argue that they are
essentially Kunbis (the same as Kanbis in Gujarat), and therefore deserve reservation is disingenu-
ous, as various state commissions have shown Marathas to be forward castes, rather than backward.
These specific demands have garnered a great deal of media commentaries that detail the anxieties
and frustration of these groups, which we examine in detail. There are also media commentaries
justifying reservation demands, for instance by Marathas4, and our analysis directly addresses such
opinions by providing an empirically informed perspective in Section 3.5
4http://indianexpress.com/article/opinion/columns/case-for-extending-the-quota-jats-patidars-
marathas-3729998/5See, for instance,
http://timesofindia.indiatimes.com/city/delhi/Rich-Jats-want-reservation-to-bring-parity-in-
education-jobs/articleshow/51083193.cms;
http://scroll.in/article/754203/beyond-reservations-haryanas-jats-believe-the-ground-is-slipping-
beneath-their-feet;
http://indianexpress.com/article/opinion/columns/how-not-to-review-reservations/;
http://indianexpress.com/article/opinion/columns/jats-reservation-stir-obc-quota-rohtak-haryana-
protests/;
http://indianexpress.com/article/opinion/columns/jat-reservation-paidar-patel-the-quota-kapus/
5

3 When the powerful demand special protection: Demand for
quotas by three jatis
The extension of affirmative action to the OBCs in the early 1990s has been followed by a particu-
larly robust mobilization by castes or communities to be included in the OBC category. The issue
has become highly contentious with groups perceived as being socio-economically dominant joining
the fray. The demand for inclusion into the OBC category by Marathas, a predominantly landowning
caste, a group that is politically and economically dominant in the rich western state of Maharashtra,
has been ongoing since the 1990s. Since 2015, another powerful caste group - Patels or Patidars -
from the neighbouring state of Gujarat has been on the streets in a prolonged agitation, which has
occasionally turned violent with damage to public property, demanding to be classified as OBC. So
widespread was the agitation that its 22-year old leader, Hardik Patel, was imprisoned on sedition
charges, and put in jail for nine months between October 2015 and July 2016. In the northern In-
dian state of Haryana, the agitation by Jats, an agrarian middle caste, which has been clamoring for
OBC status since the late 1990s, took a particularly fierce and hostile turn, including a blockade of
the capital city of Delhi, which is surrounded by Haryana on three sides.6 While these three are
the most prominent examples, there are similar other demands sprouting up, e.g. Kapus in Andhra
Pradesh.
What is noteworthy about these demands is that all these communities are perceived to be pros-
perous and socially dominant (and in these three examples, also belong to richer states of India).
The case of the Patels is even more curious as Gujarat was rocked by violent anti-quota agitations in
the mid-1980s, and Patels were in the forefront of this agitation demanding a scrapping of quotas for
SC-STs, labeling quotas as anti-merit and unfair (Shah, 1987). Thus, their volte-face is especially
6See, for instance, http://www.ndtv.com/india-news/haryana-on-guard-as-jats-begin-fresh-
agitation-for-quota-today-10-facts-1415612.
6
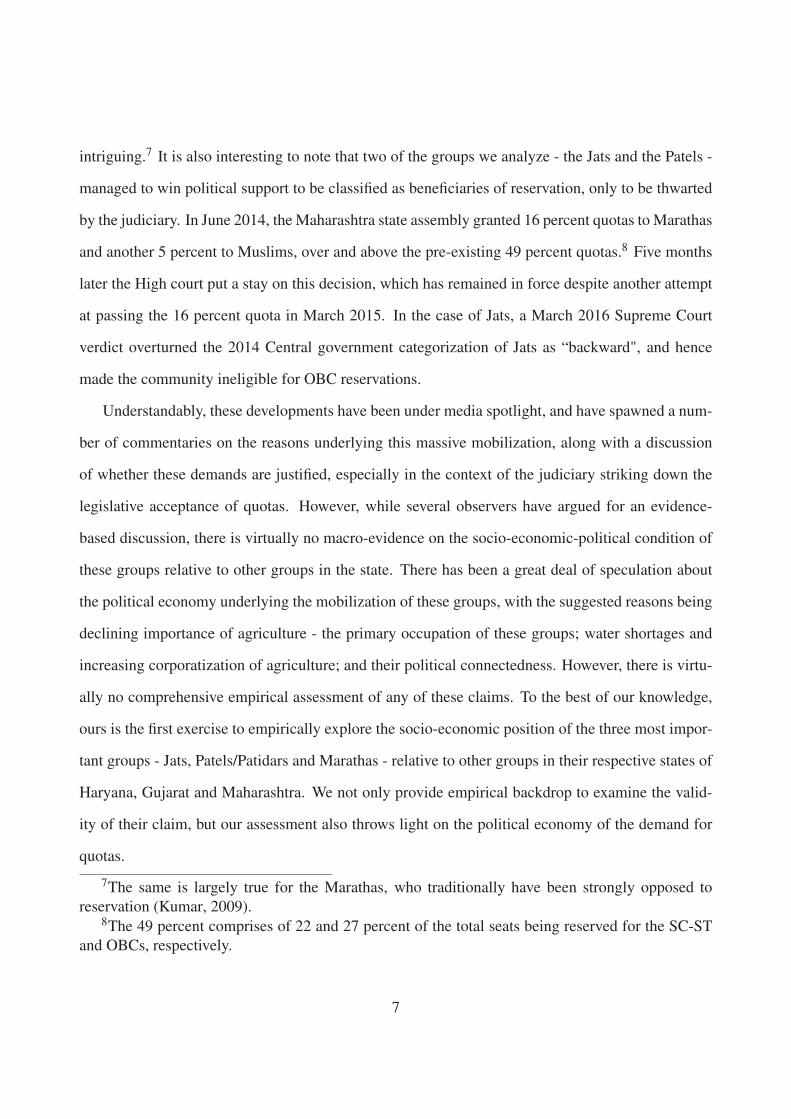
intriguing.7 It is also interesting to note that two of the groups we analyze - the Jats and the Patels -
managed to win political support to be classified as beneficiaries of reservation, only to be thwarted
by the judiciary. In June 2014, the Maharashtra state assembly granted 16 percent quotas to Marathas
and another 5 percent to Muslims, over and above the pre-existing 49 percent quotas.8 Five months
later the High court put a stay on this decision, which has remained in force despite another attempt
at passing the 16 percent quota in March 2015. In the case of Jats, a March 2016 Supreme Court
verdict overturned the 2014 Central government categorization of Jats as “backward", and hence
made the community ineligible for OBC reservations.
Understandably, these developments have been under media spotlight, and have spawned a num-
ber of commentaries on the reasons underlying this massive mobilization, along with a discussion
of whether these demands are justified, especially in the context of the judiciary striking down the
legislative acceptance of quotas. However, while several observers have argued for an evidence-
based discussion, there is virtually no macro-evidence on the socio-economic-political condition of
these groups relative to other groups in the state. There has been a great deal of speculation about
the political economy underlying the mobilization of these groups, with the suggested reasons being
declining importance of agriculture - the primary occupation of these groups; water shortages and
increasing corporatization of agriculture; and their political connectedness. However, there is virtu-
ally no comprehensive empirical assessment of any of these claims. To the best of our knowledge,
ours is the first exercise to empirically explore the socio-economic position of the three most impor-
tant groups - Jats, Patels/Patidars and Marathas - relative to other groups in their respective states of
Haryana, Gujarat and Maharashtra. We not only provide empirical backdrop to examine the valid-
ity of their claim, but our assessment also throws light on the political economy of the demand for
quotas.
7The same is largely true for the Marathas, who traditionally have been strongly opposed to
reservation (Kumar, 2009).8The 49 percent comprises of 22 and 27 percent of the total seats being reserved for the SC-ST
and OBCs, respectively.
7

3.1 Data and methodology
We use the nationally representative data from India Human Development Survey, 2012. This data
not only provides us information on broad caste groups but also individual jatis. Thus, it allows us
to identify Jats in Haryana, Patels in Gujarat and Marathas in Maharashtra. We compare these to
Brahmins, non-Brahmin forward castes9, OBCs (these are groups that are currently designated as
OBCs) and SC-STs. We compare outcomes on two broad categories - household-level outcomes and
individual level-outcomes. Our sample consists of 9,658, 15,984 and 9,364 individuals for Haryana,
Maharashtra and Gujarat, respectively, of which 12.97, 25.67 and 5.09 percent are Jats, Marathas
and Patels, respectively.
To estimate the socioeconomic differences between the Jats, Marathas, Patels and the other broad
caste groups, we estimate the following regression:
O jk = δ0 +δ1Brahmins jk +δ2Forward_Caste jk +δ3OBCS jk +δ4SC−STjk
+δ5Urban jk +δ6Districtk +δ7Age_HHead +δ8HH_Size+ ε jk. (1)
The regressions are estimated separately for each state. For household level outcomes, we restrict
the sample to household heads, whereas for individual level outcomes Equation 1 is estimated for
the entire sample of individuals. O jk refers to the outcome of interest for household j in district k for
household level outcomes, and refers to individual i in district k for individual level outcomes. The
omitted or reference category is the jati of interest - Jats in Haryana, Marathas in Maharashtra and
Patels in Gujarat. Examining the sign and significance of δ1,δ2,δ3, and δ4 allows us to evaluate the
position of each of these groups in relation to the jati we are interested in. The specification further
controls for whether the household is located in an urban or rural area, the age of the household
head, household size and a set of district dummies. A positive or negative δ j for j = {1,2,3,4} tells
9Brahmins are conventionally regarded at the top of the ritual caste hierarchy. Forward or upper
castes are also high up in the hierarchy, but Brahmin outcomes are typically superior to other forward
castes (Desai and Dubey, 2012).
8

us whether the jati of interest does better or worse than the comparison social group. Moreover, the
90 percent confidence intervals are also shown for each outcome of interest, and indicates whether
the point estimate of δ j is statistically different from zero.
3.2 Results - the static picture
3.2.1 Household level outcomes
The main household level variables considered are (i) per capita consumption expenditure; (ii)
whether the household is classified as poor; (iii) access to electricity; (iv) access to flush toilet;
(v) land ownership; and (vi) whether the household practices untouchability. Figure I shows the
4023
-6603
-16471
-21236
-3000
0-200
00-10
000
010
000
Brahminsnot Jats
Forward Castesnot Jats
OBCs notJats
"SC-ST not Jats"
Average PCCE Jats= 49113
7545
-1419 -1496
-4724
-5000
050
0010
0001
5000
Brahminsnot Marathas
Forward Castesnot Marathas
OBCs notMarathas
SC-ST notMarathas
Average PCCE Marathas= 25816
-4826
-2235
-10230-11550
-1500
0-100
00-50
000
5000
Brahminsnot Patels
Forward Castesnot Patels
OBCs notPatels
SC-ST notPatels
Average PCCE Patels= 41596
Figure I: Comparing the groups on per capita consumption expenditure
comparison based on per capita consumption expenditure (PCCE). The graphs show the relative po-
sition of the other groups with reference to the jati of interest in each of the three states. We see
that Jats are at the level of the Haryana Brahmins in terms of PCCE, and have a significantly higher
9

PCCE than all other groups in the state, including the forward castes. Marathas have a lower PCCE
than Maharashtra Brahmins, but are at the same level as other forward castes and OBCs, and sig-
nificantly higher than SC-STs. The Patels have statistically similar PCCE to Gujarati Brahmins and
forward castes, and significantly better-off than OBCs and SC-STs in the state.
Figure II shows the incidence of poverty: we see that Jats have a poverty incidence that is similar to
0.050.07
0.10
0.22
0.03
-0.2
0-0
.10
0.00
0.10
0.20
0.30
Brahminsnot Jats
Forward Castesnot Jats
OBCs notJats
SC notJats
ST notJats
-0.05
-0.01
0.03
0.10
0.19
-0.1
00.
000.
100.
200.
30
Brahminsnot Marathas
Forward Castesnot Marathas
OBCs notMarathas
SC notMarathas
ST notMarathas
0.01-0.01
0.05
0.08
0.17
-0.1
00.
000.
100.
20
Brahminsnot Patels
Forward Castesnot Patels
OBCs notPatels
"SC not Patels" "ST not Patels"
Figure II: Comparing the groups on probability of being classified as poor
Brahmins and significantly lower than other groups. Marathas are similar to Brahmins and other for-
ward castes, and less so to OBCs in terms of poverty incidence, but have significantly lower poverty
incidence compared to SC-STs. Patidars are similar to Gujarati Brahmins and other forward castes,
but have a lower incidence of poverty compared to OBCs, SC-STs in the state.
The differences in access to electricity and flush toilet is shown in Figure A1 and A2 in the
appendix. The differential access to electricity across groups is more muted compared to the first
two indicators. This is not surprising as the provision of electricity is a function of administrative,
as well as capacity-related factors. Despite greater similarity, we do see some important group dif-
ferences. Jats have greater access to electricity compared to Haryana OBCs and SC-STs; Marathas
10

have greater access compared to SC-STs and Patels have greater access compared to OBCs and
SCSTs. The implication of access to toilets goes beyond the mere fact of access to sanitation, and
is an important indicator of status in itself. Access to toilets suggests lower open defecation, and
that has strong positive implications for health, and in particular for stunting among young children
(Spears et al., 2013). It is important to note that 63, 44 and 67 percent of Jats, Marathas and Patels
respectively, report having access to a flush toilet. In terms of between group comparisons Jats are
11 and 16 percentage points more likely than OBCs and SC-STs, the Marathas are 6 and 14 per-
centage points more likely than OBCs and SC-STs, and Patels are 18 and 20 percentage points more
likely than OBCs and SC-STs, to have access to a flush toilet in Haryana, Maharashtra and Gujarat,
respectively.
The next household level outcome we explore is the probability of owing or cultivating land, and
-0.31 -0.33-0.37
-0.77
-0.80
-0.60
-0.40
-0.20
Brahminsnot Jats
Forward Castesnot Jats
OBCs notJats
SC-ST notJats
-0.06
-0.13
-0.06
-0.23
-0.25
-0.20
-0.15
-0.10
-0.05
0.00
Brahminsnot Marathas
Forward Castesnot Marathas
OBCs notMarathas
SC-ST notMarathas
-0.18
-0.07
-0.17
-0.29
-0.40
-0.30
-0.20
-0.10
0.00
Brahminsnot Patels
Forward Castesnot Patels
OBCs notPatels
SC-ST notPatels
Figure III: Comparing the groups on probability of owning or cultivating land
the results are shown in Figure III. We see that Jats are 30 to 77 percentage points more likely to
own or cultivate land than all social groups in Haryana, including Brahmins. Marathas and Patels,
similar to Jats, are more likely to own or cultivate land than all social groups in Maharashtra and
11

Gujarat, respectively. Thus, the popular perception of these groups being predominantly involved
in agriculture, and more likely to be working on their own land than being agricultural laborers is
indeed borne out by evidence.
The final outcome variable is whether the households report practicing untouchability - an ac-
0.190.15
0.02
-0.18
-0.20
-0.10
0.00
0.10
0.20
0.30
Brahminsnot Jats
Forward Castesnot Jats
OBCs notJats
SC-ST notJats
-0.02
-0.01 -0.01
-0.03
-0.06
-0.04
-0.02
0.00
0.02
Brahminsnot Marathas
Forward Castesnot Marathas
OBCs notMarathas
SC-ST notMarathas
0.25
0.12
0.05
-0.15
-0.20
0.00
0.20
0.40
Brahminsnot Patels
Forward Castesnot Patels
OBCs notPatels
SC-ST notPatels
Figure IV: Comparing the groups on probability of reporting that they practice untouchability
tivity deemed punishable by the 17th paragraph of the Indian constitution. Yet, covert and overt
instances of untouchability continue, with Brahmins, conventionally seen at the top of the social
hierarchy, reporting the highest practice of untouchability towards caste groups that they consider
ritually impure (Thorat and Joshi, 2015). Thus the self-confessed practice of untouchability by caste
groups is an indicator of where, that is, how high, they see themselves in the caste hierarchy. 24, 3.30
and 31 percent of households in Haryana, Maharashtra and Gujarat, respectively, report engaging in
untouchability. In comparison, 23.5 percent of Jats, 5 percent of Marathas and 32 percent of Patels,
in Haryana, Maharashtra and Gujarat, respectively, report practicing untouchability. The inter-group
differences are shown in Figure IV for each of the three states. We see that for Jats and Patels, their
practice of untouchability is similar to OBCs; however it is between 12 and 25 percentage points
12

lower than Brahmins and other forward castes, and 18 and 15 percentage points higher than SC-ST,
in Haryana and Gujarat, respectively. In the case of Maharashtra there are no significant differences
by social groups in the practice of untouchability; this is not surprising as less than 4 percent of
the households report engaging in untouchability. We should note that these differences are merely
suggestive, as these are self-reported figures for a phenomenon that is illegal and punishable by law.
The survey question, “in your household, do some members practice untouchability", which is fur-
ther followed up by “would there be a problem if someone who is scheduled caste were to enter
your kitchen or share utensils", is intended to capture broad contours of the issue, rather than very
detailed admission of the problem. Despite all these caveats, we see that these groups in terms of
social hierarchy are intermediate in Haryana and Gujarat and similar to upper castes in Maharashtra.
3.2.2 Individual level outcomes
The main variables explored at the individual level are: (i) years of education; (ii) probability of
completing secondary education or more; and the (iii) probability of holding a government job.
Figure V show that the average years of education for Jats (which is 5.90 years) is lower than
Brahmins and other forward castes, but higher than OBCs and SCs. Marathas have average years of
education equal to 6.58 which is lower than Brahmins by 2.18 years, but is similar to other forward
castes and OBCs, and 1.22 years more than the SC-STs. Patels’ average years of education is 7.46,
which is very similar to other forward castes in the state, and 0.97 years less than Brahmins; they
have a lead of 2.26 and 2.47 years of education over the OBCs and SC-STs, respectively. 16, 19 and
20 percent of Jats, Marathas and Patels have completed 12 years of schooling or more. Figure VI
compares the social groups on the indicator of the probability of having completed 12 or more years
of schooling; in Haryana, it is 8 and 6 percentage points higher for the Brahmin and other forward
castes; the Jats however do 3 and 7 percentage points better than the OBCs and SC-ST, respectively.
The Marathas are 13 percentage points less likely to have completed 12 years or more of education
as compared to the Brahmins, but are very similar to the forward castes and do 2 and 6 percentage
13

0.98
0.55
-0.55
-1.07
-2.00
-1.00
0.00
1.00
2.00
Brahminsnot Jats
Forward Castesnot Jats
OBCs notJats
SC-ST notJats
2.18
-0.03 -0.11
-1.22-1.00
0.00
1.00
2.00
3.00
Brahminsnot Marathas
Forward Castesnot Marathas
OBCs notMarathas
SC-ST notMarathas
0.97
-0.15
-2.26 -2.47
-3.00
-2.00
-1.00
0.00
1.00
2.00
Brahminsnot Patels
Forward Castesnot Patels
OBCs notPatels
SC-ST notPatels
Figure V: Comparing the groups on total years of education
0.080.06
-0.03
-0.07
-0.10
-0.05
0.00
0.05
0.10
Brahminsnot Jats
Forward Castesnot Jats
OBCs notJats
SC-ST notJats
0.13
-0.01-0.02
-0.06
-0.10
0.00
0.10
0.20
Brahminsnot Marathas
Forward Castesnot Marathas
OBCs notMarathas
SC-ST notMarathas
0.10
-0.02
-0.12 -0.11
-0.20
-0.10
0.00
0.10
0.20
Brahminsnot Patels
Forward Castesnot Patels
OBCs notPatels
SC-ST notPatels
Figure VI: Comparing the groups on proportion with more than and equal to 12 years of schooling
points better than the OBCs and SC-ST, respectively. The picture for Patels is similar to that of
Marathas, qualitatively in terms of caste gaps; however their lead over OBCs and SC-ST is much
larger and stands at 12 and 11 percentage points, respectively.
14

The crux of the demand for quotas is the presumed lack of access to government jobs, which
0.12
0.010.03
0.10
-0.05
0.00
0.05
0.10
0.15
0.20
Brahminsnot Jats
Forward Castesnot Jats
OBCs notJats
SC-ST notJats
-0.00
-0.04-0.03
0.00
-0.10
-0.05
0.00
0.05
Brahminsnot Marathas
Forward Castesnot Marathas
OBCs notMarathas
SC-ST notMarathas
0.10
0.000.01
0.14
-0.05
0.00
0.05
0.10
0.15
0.20
Brahminsnot Patels
Forward Castesnot Patels
OBCs notPatels
SC-ST notPatels
Figure VII: Comparing the groups on probability of holding a government job
according to anecdotal accounts, is lower than that for SC-STs, communities that have historically
enjoyed quotas. We see that 2.5 percent of Jats, 2.5 percent of Marathas and 0.008 percent of
Patels living in Haryana, Maharashtra and Gujarat, respectively, have a government job. A between-
group comparison of these differences is very revealing; we see in Figure VII that in Haryana, Jats’
access to government jobs is similar to forward castes and OBCs, despite the fact that historically,
Jats have been an agrarian caste and has not turned towards government jobs. Brahmins and SC-
STs’ probability of government jobs is 12 and 10 percentage points greater than that for Jats. The
point to note is that Jats already have access to government jobs that is similar to other OBCs in
the state, despite not officially being classified as OBCs. Marathas’ access to government jobs
is similar to that of Brahmins, and higher than that for other forward castes and OBCs, and not
different from that for SC-STs. Patels’ access to government jobs is similar to forward castes and
OBCs. However, the Brahmins and SC-ST are 10 and 14 percentage points more likely to hold a
government job. Therefore, the demand for quotas is government jobs is not justified by an empirical
15

analysis of any disadvantage vis-à-vis either the other dominant groups or even in relation to Dalits,
who have historically had access to quotas. The sharp disparity in access to government jobs in
between Brahmins and Jats and Patels in their respective states might be an important factor in
their feeling of relative disparity, as their reference point might be the dominant group, and not the
socioeconomically disadvantaged groups.
3.3 Results - Analyzing evolution of group (dis)advantage over time
The previous sections provides empirical evidence to show that the three groups demanding OBC
status and thereby access to reservations (quotas) are already closer to the upper castes in their
respective states than to the more disadvantaged groups. However, the evidence presented compares
the groups at one point in time. It could be argued that changes over time, more particular a relative
decline in relation to the other social groups might explain the forceful articulation for affirmative
action.
3.3.1 Panel analysis of household level indicators
In order to examine the changes in relative position between the social groups, the first strategy
undertaken by us is as follows:10 the IHDS 2011-12 is the second wave of a longitudinal data set,
the first wave of which was in 2004-5. The first wave of data does not have individual Jati-level
information. However, the two rounds can be linked in a panel, and through that we identify the
same households in the three states in the 2004-5 data. We first examine the changes over time on
the three household level variables - PCCE, probability of being poor, and whether they owned or
10In Deshpande and Ramachandran (2016)we examine the changing contours of caste disadvan-
tage over the last four decades, and find that on key material indicators, such as access to white
collar jobs, higher educational attainment, average wages etc., caste disparities are rising, rather
than falling. However, that analysis is based on the broad administrative categories – SC-ST, OBC
and Others – due to the nature of data availability. Given the disaggregated jati-level data in IHDS,
we can directly assess change over time for these specific groups, relative to other groups in their
respective states.
16

Table I: Panel analysis: evolution of relative (dis)advantage over time
(1) (2) (3)
PCCE Dummy for being Poor Dummy for Own or Cultivate Land
HARYANA
Jat Dummy* Dummy for Year 2012 11,909*** -0.0837** -0.0729**
(4,164) (0.0378) (0.0344)
[0.111] [-0.0710] [-0.0477]
HH Fixed Effects Yes Yes Yes
Other Controls Yes Yes Yes
Observations 2,631 2,631 2,631
R-squared 0.871 0.913 0.957
MAHARASHTRA
Maratha Dummy* Dummy for Year 2012 5,919*** -0.0323 -0.0294*
(960.9) (0.0250) (0.0167)
[0.131] [-0.0319] [-0.0246]
HH Fixed Effects Yes Yes Yes
Other Controls Yes Yes Yes
Observations 5,087 5,087 5,088
R-squared 0.901 0.866 0.957
GUJARAT
Patel Dummy* Dummy for Year 2012 8,963** 0.0244 -0.0102
(3,952) (0.0545) (0.0515)
[0.0676] [0.0140] [-0.00414]
HH Fixed Effects Yes Yes Yes
Other Controls Yes Yes Yes
Observations 2,790 2,790 2,791
R-squared 0.897 0.887 0.949
The other controls include a dummy for year 2012, age of the household head, a dummy for
being in an urban location and household fixed effects. In column (1), (2) and (3) the dependent
variables are per capita consumption expenditure, dummy for being classified as poor based on the
2012 Tendulkar poverty line, and a dummy for whether the household owns or cultivates any land.
p < .10; p < .05; p < .01.
17

cultivated any land - and estimate the following equation:
yi jk = δ0 +δ1D jCk +δ2D j +δ3Ck +δ4HHi + εi jkn, (2)
where the subscript i jk indexes individual i, from group j, from year k. D j is a dummy variable
taking the value 1 if the individual is a Jat in Haryana and zero otherwise, when the equation is
estimated for the state of Haryana; it takes the value 1 for Marathas in Maharashtra and zero other-
wise, when we consider Maharashtra; and finally for the state of Gujarat D j it takes the value 1 for
Patels and zero otherwise. Ck is a dummy variable which takes the value 1 if the data is from the
year 2011-12 and zero otherwise, and HHi is a household fixed effect. Moreover, all specifications
control for the age of the household head, as well as an urban dummy. As we are looking household
level variables, we restrict the estimation to household heads that are between 18 and 65 years old.
Panel A of Table I shows the results.
We see from Table I that Jats, in fact, increase their PCCE as compared to the other social groups
over the two rounds; moreover, they also decrease their probability of being classified as poor based
on 2012 Tendulkar poverty line (Planning Commission, Goverment of India, 2011). However, we
see that they reduce their probability of owning or cultivating land in 2011-12 compared to 2004-5,
relative to all the other groups in the state. Thus, the narrative of agrarian distress underlying anxi-
eties is borne out by the reduced probability of owning land. In Gujarat, we see that Patels had higher
PCCE, the same probability of being poor and of owning or cultivating land in 2011-12 compared
to 2004-05, relative to all other groups in the state. Thus, based on the probability of owning or
cultivating land, on average there is no sign of increasing agrarian distress among the Patels. In Ma-
harashtra, the change is very similar to that in Gujarat: Marathas had significantly higher PCCE, the
same probability of being poor, and a reduced probability of owning or cultivating land in 2011-12
compared to 2004-5, relative to all other groups combined.
Combining this evidence with that in the previous section, the picture that emerges is the follow-
18

ing. Assessed in 2011-12, the three aggrieved Jatis are closer to upper rather than middle or lower
castes on a variety of indicators. Comparing this picture to the relative position of the same house-
holds vis-á-vis all other groups in their respective states in 2004-05, we find that in terms of average
per capita expenditure, their position has improved over time. In terms of probability of being poor,
there is no worsening. In two of the three states, there is evidence of a decline in the probability of
owning or cultivating land, which could be the reason for the heightened anxiety. However, on the
whole, there is no overwhelming evidence of a relative deterioration in their position.
3.3.2 Changes in educational attainment using cohort analysis
The ongoing transformation of the Indian economy to a skill-based one implies that education gains
an ever more important role, and the traditionally agrarian social groups might feel ill equipped to
seize new knowledge-based or skill-based occupations, despite their dominant position. In order to
assess this we now consider how the younger cohorts of these three agrarian jatis compare to the
other social groups, relative to the same comparison between the older cohorts from these groups.
We define the younger cohort as comprising of individuals aged 18 to 35 in 2012, and the older
cohort as individuals who are aged 36-65 in 2012. We compare the three jatis within each state to
two broad social groups: (1) the Brahmins and the other Forward Castes; (2) the OBCs and SC-ST.
In order to evaluate changes over the two cohorts, we estimate the following regression:
yi jkn = δ0 +δ1D jCk +δ2D j +δ3Ck +δ4Rn + εi jkn, (3)
where the subscript i jkn indexes individual i, from social group j and cohort k and resident in dis-
trict n. D j is a dummy variable taking the value 1 for Jats in Haryana and zero otherwise, when the
equation is estimated for the state of Haryana; it takes the value 1 for Marathas in Maharashtra and
zero otherwise, when we consider Maharashtra; and finally for the state of Gujarat D j takes the value
1 for Patels and zero otherwise. Ck is a dummy variable which takes the value 1 if the individual is
19

aged 18 to 35 in 2012 and zero otherwise. Finally, Rn is a set of district dummies. Moreover, all
specifications control for the age of the individual as well as an urban dummy. Table II shows the
results.
The results for the Jats in Haryana show that the younger cohort increases its relative years of
schooling by 2.19 and 1.45 years, as compared to Group 1 (the Brahmins and the other Forward
Castes) and Group 2 (the OBCs and SC-ST), respectively. As the Jats were trailing Group 1 and
ahead of Group 2, this implies they close the gaps with the the other dominant, non-disadvantaged
groups and further increase their advantage in relation to the socially backward groups. For the
indicator of having completing secondary education or more, we see that there is neither conver-
gence nor divergence when compared to Group 1. However, they increase their completion rate of
secondary schooling by a whole 12 percentage points when compared to the socially disadvantaged
groups - the OBCs and SC-ST.
The younger Marathas in Maharashtra close the gap with the Brahmins and Forward castes by
almost 1 year of schooling, and fall behind Group 2 by 0.44 years, though they still hold an advan-
tage of 1.23 years of schooling as compared to Group 2. For the indicator of having completing
secondary education or more, we see that there is neither convergence nor divergence as compared
to Group 1 and 2. Finally the younger Patels in Gujarat show no convergence or divergence when
compared with the non-backward groups in the state of Gujarat; though it is important to note that
they in fact do better in absolute terms when compared to Group 1. Comparing the socially backward
groups to the Patels in Gujarat, we see that they ncrease their completion rate of secondary schooling
by a whole 14 percentage points, which is over and above the already 12 percentage points gap that
existed between them.
One potential channel that might account for such forceful demand for quotas is that the younger
cohorts of these three jatis have put in a greater investment in education, in comparison to corre-
sponding cohorts of other groups. Our preliminary investigation in this dimension cannot rule out
this hypothesis; yet more work is needed before firmly concluding that greater investment in educa-
20

Table II: Cohort analysis: evolution of relative (dis)advantage over time on educational indicators
Comparison with Brahmins and Other Forward Castes Comparison with OBCs and SC-ST
(1) (2) (3) (4)
Years of Dummy for Completing Years of Dummy for CompletingEducation Secdondary Educ. or More Education Secdondary Educ. Or more
HARYANA
Younger Cohort Dummy*Haryana Jat Dummy 2.19*** 0.018 1.45*** 0.12***
(0.40) (0.039) (0.34) (0.029)
[1.53 - 2.85] [-0.046 - 0.082] [0.90 - 2.01] [0.076 - 0.17]
Cohort aged 18 to 35 in 2011-12 -0.15 0.088** 1.31*** 0.079***
(0.40) (0.039) (0.26) (0.022)
[-0.80 - 0.51] [0.024 - 0.15] [0.88 - 1.73] [0.044 - 0.12]
Haryana Jat Dummy -2.43*** -0.11*** 0.50* 0.011
(0.31) (0.030) (0.26) (0.022)
[-2.94 - -1.92] [-0.16 - -0.065] [0.081 - 0.92] [-0.025 - 0.046]
Observations 2,069 2,071 4,387 4,391
R-squared 0.321 0.228 0.313 0.160
MAHARASHTRAYounger Cohort Dummy*Maharashtra Maratha Dummy 1.03*** 0.0091 -0.44** 0.0096
(0.24) (0.027) (0.18) (0.018)
[0.63 - 1.42] [-0.035 - 0.053] [-0.73 - -0.14] [-0.020 - 0.039]
Cohort aged 18 to 35 in 2011-12 -0.90*** -0.028 0.22 -0.016
(0.27) (0.030) (0.17) (0.017)
[-1.34 - -0.46] [-0.077 - 0.020] [-0.054 - 0.50] [-0.044 - 0.012]
Maharashtra Maratha Dummy -0.48** 0.015 1.23*** 0.066***
(0.19) (0.021) (0.14) (0.014)
[-0.80 - -0.16] [-0.020 - 0.049] [1.00 - 1.46] [0.043 - 0.089]
Observations 4,349 4,350 8,562 8,568
R-squared 0.298 0.171 0.340 0.189
GUJARATYounger Cohort Dummy*Gujarat Patel Dummy 0.24 0.043 -0.50 0.14***
(0.48) (0.052) (0.47) (0.036)
[-0.55 - 1.03] [-0.043 - 0.13] [-1.27 - 0.27] [0.080 - 0.20]
Cohort aged 18 to 35 in 2011-12 -0.085 -0.0092 1.26*** 0.025
(0.34) (0.037) (0.25) (0.019)
[-0.64 - 0.47] [-0.070 - 0.051] [0.85 - 1.67] [-0.0062 - 0.057]
Gujarat Patel Dummy 0.55* 0.0027 3.70*** 0.12***
(0.33) (0.036) (0.31) (0.024)
[0.0040 - 1.10] [-0.057 - 0.062] [3.19 - 4.21] [0.077 - 0.16]
Observations 1,932 1,934 4,254 4,259
R-squared 0.290 0.190 0.258 0.111
p < .10; p < .05; p < .01.
tion by younger cohorts is behind this demand for quotas.
21

Summary
The overall picture emerging from the socio-economic comparison of Jats, Marathas and the Patels
with the other social groups in Haryana, Maharashtra and Gujarat, respectively suggests that exten-
sion of reservation based on criteria of backwardness has no empirical validity. The three Jatis are
similar to the Brahmins and Other forward castes, and generally much better off compared to the
OBCs or the SC-STs in their respective states. This is not true only when we compare them at a
point in time, but looking at evolution shows that, if anything, these three Jatis have increased their
relative advantage compared to the disadvantaged social groups and closed gaps in relation to the
dominant caste groups.
4 Anxieties and Mobilization Success
4.1 Exploring the basis for anxieties: The structural change hypothesis
The Jats, Marathas and the Patels, are predominantly agricultural communities which benefited
from the Green Revolution and the White (milk) Revolution that took place in India starting the
early 1960s. The transformation happening in the economy, especially, the declining importance
of agriculture, and growth of corporatized agriculture and water shortages affecting productivity,
has meant that these groups feel increasingly vulnerable, especially given their former position of
strength (see, for instance, the discussion in Singh (2011) about the vulnerabilities of Jats in UP,
or Jodhka (2014).11 This structural change hypothesis has been highlighted by the popular press,
though commentators have not provided empirical evidence to support their assertion.12
11The column by Jodhka is available at http://indianexpress.com/article/opinion/columns/going-
backward/ )12Refer to http://scroll.in/article/754203/beyond-reservations-haryanas-jats-believe-the-ground-
is-slipping-beneath-their-feet
http://scroll.in/article/757889/in-maharashtra-the-maratha-demand-for-reservations-is-losing-steam
http://scroll.in/article/753595/casteism-brides-and-a-failed-gujarat-model-what-the-patel-demand-
for-reservations-is-really-about
22

Figures VIII and IX show the probability of holding a casual job in the agricultural and non-
0.10
0.050.09
0.41
0.00
0.10
0.20
0.30
0.40
0.50
Brahminsnot Jats
Forward Castesnot Jats
OBCs notJats
SC-ST notJats
0.14
0.020.05
0.36
0.00
0.10
0.20
0.30
0.40
Brahminsnot Marathas
Forward Castesnot Marathas
OBCs notMarathas
SC-ST notMarathas
0.07 0.050.09
0.24
-0.10
0.00
0.10
0.20
0.30
Brahminsnot Patels
Forward Castesnot Patels
OBCs notPatels
SC-ST notPatels
Figure VIII: Comparing the groups on probability of having a casual job in the agricultural sector
-0.31-0.28
-0.17
-0.02
-0.40
-0.30
-0.20
-0.10
0.00
0.10
Brahminsnot Jats
Forward Castesnot Jats
OBCs notJats
SC-ST notJats
-0.13
0.03 0.04
0.14
-0.20
-0.10
0.00
0.10
0.20
Brahminsnot Marathas
Forward Castesnot Marathas
OBCs notMarathas
SC-ST notMarathas
-0.22
-0.04
0.05 0.04
-0.30
-0.20
-0.10
0.00
0.10
Brahminsnot Patels
Forward Castesnot Patels
OBCs notPatels
SC-ST notPatels
Figure IX: Comparing the groups on probability of having a casual job in the non-agricultural sector
agricultural sector for the Jats, Marathas and the Patels, relative to the other caste groups, in Haryana,
23

Maharashtra and Gujarat, respectively. We note that in the agricultural sector, these three groups are
less likely than all other caste groups to be involved in casual jobs. On the other hand, when we
look at the non-agricultural sector, we see a more nuanced picture. 40 percent of the Jats involved
in the non-agricultural sector are likely to be in casual jobs. They have a 32, 29 and 17 percentage
point greater likelihood than Brahmins, Forward Castes, and OBCs, respectively, to be involved in
casual jobs, and there are no significant differences between the Jats and the SC-STs. On the other
hand, 23 percent of the Marathas employed in the non-agricultural sector hold casual jobs; this is 13
percentage points more than the Brahmins. The socially disadvantaged groups - OBCs and SC-STs
- are all more likely to be involved in casual jobs even in the non-agricultural sector. Finally, for the
Patels, 53 percent of those employed in the non-agricultural sector hold casual jobs. Having noted
this, it is important to highlight that in Gujarat, only the Brahmins are 22 percentage points less
likely to hold causal jobs compared to Patels. There are no significant differences between Patels
and the other social groups in the probability of holding casual jobs in the non-agricultural sector.
The above suggests that the declining importance of agriculture, with high levels of employment in
casual jobs in the non-agricultural sector could be an important factor driving demands for reserva-
tion. However, both Marathas and Patels have lower levels of casualization of the labor force in both
the agricultural and non-agricultural sectors, as compared to the socially disadvantaged groups.
For these three jatis, the dominant livelihood being agriculture has meant that these groups are
especially susceptible to the increasing water shortages. The combination of monsoon failures and
cropping patterns have led to the overexploitation of groundwater; for instance, according to the
World Bank, in Maharashtra “by 2025, an estimated 60 per cent of ground water blocks will be in
a critical condition."13 Moreover, the crushing and processing of the dominant cash crop in Maha-
rashtra, sugarcane, is an extremely water intensive process. For instance, in 2013-14, farmers grew
sugarcane in two lakh hectares of land, which is around 9.4 percent of the state’s cultivated area,
consuming 71.4 percent of its irrigation water. The uncertainty about future agricultural productiv-
13http://www.deccanherald.com/content/56673/indias-groundwater-table-dry.html
24

ity is most likely on the rise due to the vagaries of the monsoon and continuously declining water
table levels. The increased hardship due to declining water table levels has also been accompa-
nied by increasing competition for water for the farmers from the multi-national corporations (Shiva
et al., 2002). For instance, in the states of Andhra Pradesh, Kerala and Rajasthan, Coca Cola was
forced to shut down plants in the face of protests from farmers over depleted water levels affecting
both household consumption and irrigation needs.14 These changes have meant that traditionally
dominant agricultural groups are considering alternative avenues to ensure livelihood security in the
future, and one of the avenues has been to be included as beneficiaries of AA which provides access
to government jobs with security of tenure, and additional benefits such as access to health care and
pensions.
Another important element highlighted in the popular press has been the lack of integration of
the Jats, Marathas, and Patels, into the modern economy, where knowledge of English is considered
to be a necessity. Figure X shows the differentially probability for being fluent in English among
the caste groups relative to the Jats, Marathas, and Patels in Haryana, Maharashtra and Gujarat, re-
spectively. It is interesting to note that only 4.5 percent of the Jats are classified as being fluent. The
Brahmins and the other forward castes are 6 and 4 percentage points more likely to be fluent; an
increase of more than 100 percent. Moreover there are no significant differences between the Jats
and the OBCs and SC-STs. In the case of Marathas, again only 6 percent of the sample is fluent in
English; again the Brahmins and the other forward castes are 14 and 3 percentage points more likely
than the Marathas to be fluent in English, with no significant differences between the Marathas and
the socially disadvantaged groups - the OBCs, and SC-STs. Finally, in Gujarat, again 6 percent of
the Patels report being fluent in English. Moreover, there is seen to be no significant differences in
English fluency between the Patels and the non-backward groups. On the other hand, they are around
14Refer to Shiva (2006) for further details. Also refer to http://www.firstpost.com/india/coca-cola-
battles-water-crisis-in-three-states-rajasthan-meghalaya-andhra-pradesh-plants-shut-2623590.html
and
https://fsrn.org/2016/03/coca-cola-shuts-down-three-bottling-plants-in-india-amid-severe-water-
shortages/.
25
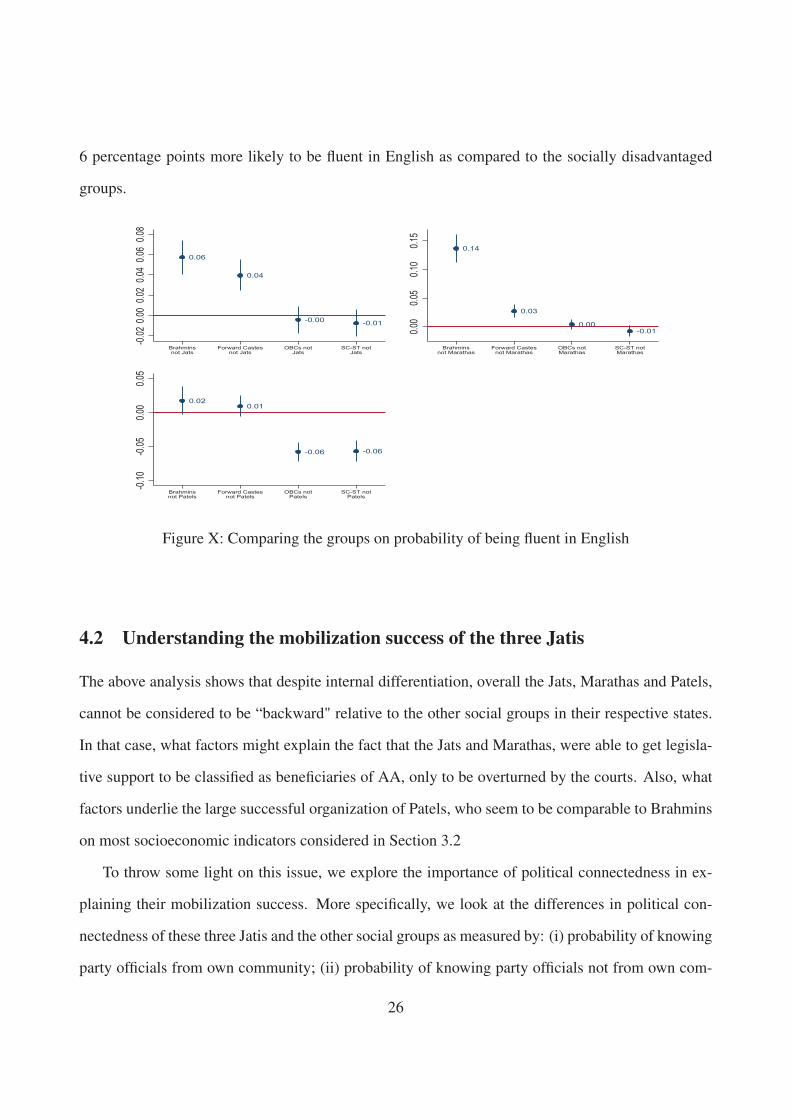
6 percentage points more likely to be fluent in English as compared to the socially disadvantaged
groups.
0.06
0.04
-0.00 -0.01
-0.02
0.00
0.02
0.04
0.06
0.08
Brahminsnot Jats
Forward Castesnot Jats
OBCs notJats
SC-ST notJats
0.14
0.03
0.00-0.010.0
00.0
50.1
00.1
5
Brahminsnot Marathas
Forward Castesnot Marathas
OBCs notMarathas
SC-ST notMarathas
0.020.01
-0.06 -0.06
-0.10
-0.05
0.00
0.05
Brahminsnot Patels
Forward Castesnot Patels
OBCs notPatels
SC-ST notPatels
Figure X: Comparing the groups on probability of being fluent in English
4.2 Understanding the mobilization success of the three Jatis
The above analysis shows that despite internal differentiation, overall the Jats, Marathas and Patels,
cannot be considered to be “backward" relative to the other social groups in their respective states.
In that case, what factors might explain the fact that the Jats and Marathas, were able to get legisla-
tive support to be classified as beneficiaries of AA, only to be overturned by the courts. Also, what
factors underlie the large successful organization of Patels, who seem to be comparable to Brahmins
on most socioeconomic indicators considered in Section 3.2
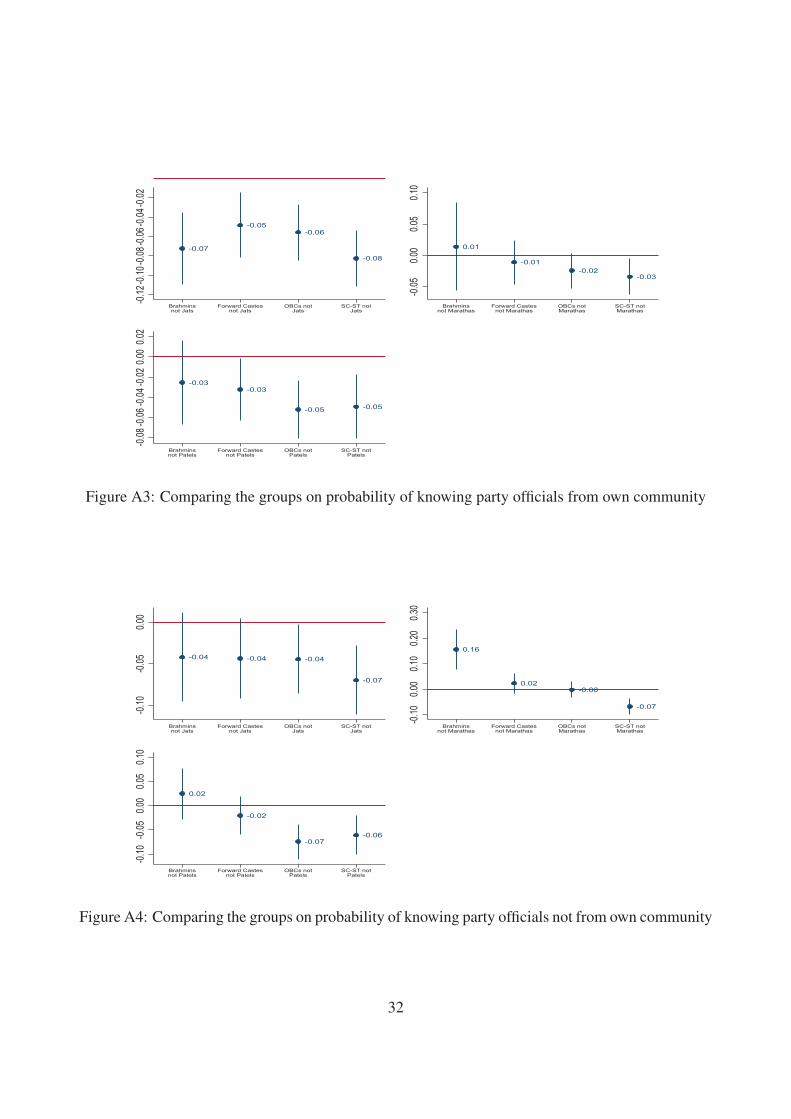
To throw some light on this issue, we explore the importance of political connectedness in ex-
plaining their mobilization success. More specifically, we look at the differences in political con-
nectedness of these three Jatis and the other social groups as measured by: (i) probability of knowing
party officials from own community; (ii) probability of knowing party officials not from own com-
26

munity; (iii) probability of knowing elected politician from own community; (iv) probability of
knowing elected politician not from own community; (v) probability of having a Panchayat member
from their own household (HH) or closely related to their HH.
The results of this analysis are shown in Figures A3, A4, A5, A6, and A7 in the appendix.
We see that within group cohesion is very strong among the three Jatis, with the Jats and Patels
being 3 to 8 percentage points more likely to know a party official or an elected politician from their
own community. On the other indicators, we see no sharp differences across the social groups with
political connectedness across community lines being not significantly different, though all the point
estimates do suggest better political capital for the three jatis considered.
5 Concluding Comments
Jats, Marathas and Patels are among the most powerful communities in their respective regions.
Jodhka (2014)15 argues that Jats are the “most important and powerful community in the rural land-
scapes of northwest India". Even compared to Patels and Marathas, the Jats are “superior-most"
in their region as Brahmanical dominance is weak. Landownership and cultivation have been their
economic backbone. Our findings provide empirical support to Jodhka’s argument that Jats are not
lagging behind, not even in government jobs, but are dealing with tectonic shifts caused to their
livelihoods due to the crisis of agriculture. Jodhka suggests that it is not the marginalized Jat culti-
vator, but the upwardly mobile Jat elite who are articulating the demand for quotas, as they do not
want to be stuck in agriculture, and feel that they are unable to compete with upper castes in urban
areas.
Overall, there is discontent among powerful farming communities due to the perception that real
economic power lies in the hands of the big corporations, and the state, overtly or covertly, acts in
their interest. These communities feel their power slipping away or eroding, in addition to feeling
15http://indianexpress.com/article/opinion/columns/going-backward/
27

ill prepared to shift towards urban, formal sector livelihood opportunities. Desai (2016)16 discusses
how a “sense of fairness in economic outcomes is strongly related to perceptions of prosperity". This
would imply that individuals or communities who feel strongly that the odds of economic success
are stocked against them are more likely to feel deprived. Desai reports estimates from IHDS panel
data that “forward castes were about 30 per cent more likely to feel that they were worse off in
2011-12 than in 2004-05".17. Thus, perceptions of being worse-off are real: our analysis suggests
that these perceptions are exactly that - feelings - not supported by evidence on the ground. The
evidence, which is overwhelming, suggests that these communities are not the most marginalized in
their respective states.
Having said this, economic changes that give rise to widespread anxieties, definitely need to be
understood and genuine grievances, including those that might come from forward castes dealing
with agrarian transformations, need to be addressed. Apropos demands for inclusion into the OBC
category, we would like to make the following argument: given increasing privatization, the base,
that is, total jobs that are eligible for reservations, is already shrinking. In another paper (Deshpande
and Ramachandran, 2016) we demonstrate how existing OBCs and SC-STs are further lagging be-
hind upper castes in a range of material indicators. In this context, extending quotas to relatively
richer and powerful groups would amount to diluting the already small and shrinking entitlement for
communities that are truly disadvantaged and discriminated against.
16http://www.thehindu.com/opinion/lead/the-politics-of-perceptions/article9320728.ece17Note that in the current classification of castes, Jats, Patels and Marathas are classified as for-
ward castes in IHDS
28

References
Datta, N. (1999). Forming an identity: A social history of the Jats. Oxford University Press, USA.
Deore, S. and N. Munde (2013). Reservation for Marathas? Economic and Political Weekly 48(34),
19–20.
Desai, S. and A. Dubey (2012). Caste in 21st century India: Competing narratives. Economic and
Political Weekly 46(11), 40.
Deshpande, A. (2013). Affirmative action in India. Oxford University Press.
Deshpande, A. and R. Ramachandran (2016). The changing contours of intergroup disparities and
the role of preferential policies in a globalizing world: Evidence from India. CDE WP No. 267,
December.
Holzer, H. and D. Neumark (2000). Assessing affirmative action. Journal of Economic Litera-
ture 38(3), 438–568.
Kumar, M. (2009). Reservations for marathas in maharashtra. Economic and Political Weekly 51(49),
10–12.
Planning Commission, Goverment of India (2011). Report of the expert group to review the method-
ology for estimation of poverty. Technical report.
Shah, G. (1987). Middle class politics: Case of anti-reservation agitations in Gujarat. Economic and
Political Weekly 22(19–21), AN155–AN172.
Shiva, V. (2006). Earth democracy: Justice, sustainability and peace. Zed Books.
Shiva, V., H. Radha, and H. J. Afsar (2002). Corporate hijack of water. Navdanya, New Delhi.
Singh, A. K. (2011). Why Jat reservations? Economic and Political Weekly 46(17), 20–22.
29

Spears, D., A. Ghosh, and O. Cumming (2013). Open defecation and childhood stunting in India:
An ecological analysis of new data from 112 districts. PLoS One 8(9), e73784.
Thorat, A. and O. Joshi (2015). The continuing practice of untouchability in India: Patterns and
mitigating influences. India Human Development Study Working Paper 3.
Weisskopf, T. E. (2004). Affirmative action in the United States and India: A comparative perspec-
tive. Routledge.
30

Appendix
-0.00-0.01
-0.03 -0.03
-0.04
-0.02
0.00
0.02
Brahminsnot Jats
Forward Castesnot Jats
OBCs notJats
SC-ST notJats
Proprtion of Jats w/access to electricity = 1.02
0.020.01
-0.00
-0.05
-0.05
0.00
0.05
Brahminsnot Marathas
Forward Castesnot Marathas
OBCs notMarathas
SC-ST notMarathas
Proprtion of Marthas w/access to electricity = 0.98
-0.01-0.02
-0.04-0.05
-0.08
-0.06
-0.04
-0.02
0.000
.02
Brahminsnot Patels
Forward Castesnot Patels
OBCs notPatels
SC-ST notPatels
Proprtion of Patels w/access to electricity = 0.98
Figure A1: Comparing the groups on access to electricity
-0.01 0.00
-0.11
-0.16
-0.20
-0.10
0.00
0.10
Brahminsnot Jats
Forward Castesnot Jats
OBCs notJats
SC-ST notJats
Proprtion of Jats w/access to flush toilet = 0.40
0.01 0.01
-0.06
-0.14
-0.20
-0.10
0.00
0.10
Brahminsnot Marathas
Forward Castesnot Marathas
OBCs notMarathas
SC-ST notMarathas
Proprtion of Marathas w/access to flush toilet = 0.31
0.00
-0.05
-0.18-0.20
-0.30
-0.20
-0.10
0.00
0.10
Brahminsnot Patels
Forward Castesnot Patels
OBCs notPatels
SC-ST notPatels
Proprtion of Patels w/access to flush toilet = 0.11
Figure A2: Comparing the groups on access to flush toilets
31
-0.07
-0.05-0.06
-0.08
-0.12
-0.10
-0.08
-0.06
-0.04
-0.02
Brahminsnot Jats
Forward Castesnot Jats
OBCs notJats
SC-ST notJats
0.01
-0.01-0.02
-0.03
-0.05
0.00
0.05
0.10
Brahminsnot Marathas
Forward Castesnot Marathas
OBCs notMarathas
SC-ST notMarathas
-0.03-0.03
-0.05 -0.05
-0.08
-0.06
-0.04
-0.02
0.00
0.02
Brahminsnot Patels
Forward Castesnot Patels
OBCs notPatels
SC-ST notPatels
Figure A3: Comparing the groups on probability of knowing party officials from own community
-0.04 -0.04 -0.04
-0.07
-0.10
-0.05
0.00
Brahminsnot Jats
Forward Castesnot Jats
OBCs notJats
SC-ST notJats
0.16
0.02-0.00
-0.07
-0.10
0.00
0.10
0.20
0.30
Brahminsnot Marathas
Forward Castesnot Marathas
OBCs notMarathas
SC-ST notMarathas
0.02
-0.02
-0.07-0.06
-0.10
-0.05
0.00
0.05
0.10
Brahminsnot Patels
Forward Castesnot Patels
OBCs notPatels
SC-ST notPatels
Figure A4: Comparing the groups on probability of knowing party officials not from own community
32

-0.04-0.03
-0.04-0.03
-0.08
-0.06
-0.04
-0.02
0.00
0.02
Brahminsnot Jats
Forward Castesnot Jats
OBCs notJats
SC-ST notJats
-0.07
0.02
-0.03
-0.06
-0.15
-0.10
-0.05
0.00
0.05
Brahminsnot Marathas
Forward Castesnot Marathas
OBCs notMarathas
SC-ST notMarathas
-0.04
-0.01
-0.05-0.04
-0.10
-0.05
0.00
0.05
Brahminsnot Patels
Forward Castesnot Patels
OBCs notPatels
SC-ST notPatels
Figure A5: Comparing the groups on probability of knowing elected politician from own community
0.01-0.00
-0.05
-0.02
-0.10
-0.05
0.00
0.05
Brahminsnot Jats
Forward Castesnot Jats
OBCs notJats
SC-ST notJats
0.070.06
0.02
-0.06
-0.10
-0.05
0.00
0.05
0.10
0.15
Brahminsnot Marathas
Forward Castesnot Marathas
OBCs notMarathas
SC-ST notMarathas
0.06
0.01
-0.07-0.05
-0.10
-0.05
0.00
0.05
0.10
0.15
Brahminsnot Patels
Forward Castesnot Patels
OBCs notPatels
SC-ST notPatels
Figure A6: Comparing the groups on probability of knowing elected politician not from own com-
munity
33

-0.00 0.01 -0.00-0.02
-0.10
-0.05
0.00
0.05
0.10
Brahminsnot Jats
Forward Castesnot Jats
OBCs notJats
SC-ST notJats
-0.06-0.05
-0.06
-0.09
-0.15
-0.10
-0.05
0.00
Brahminsnot Marathas
Forward Castesnot Marathas
OBCs notMarathas
SC-ST notMarathas
0.03
0.050.04
0.03
-0.05
0.00
0.05
0.10
Brahminsnot Patels
Forward Castesnot Patels
OBCs notPatels
SC-ST notPatels
Figure A7: Comparing the groups on probability of a Panchayat member from HH or close to HH
34