working paper no. 882 - levy institute
TRANSCRIPT

Working Paper No. 882
Investing in Social Care Infrastructure and Employment Generation: A Distributional Analysis of the Care Economy in Turkey
by
Kijong Kim*
Levy Economics Institute of Bard College
İpek İlkkaracan† Istanbul Technical University
Levy Economics Institute of Bard College
Tolga Kaya‡ Istanbul Technical University
January 2017
* Corresponding author: [email protected]; tel: +1-845-758-7738; fax: +1-845-758-1149. † Istanbul Technical University, Faculty of Management, Macka 34367 Istanbul, Turkey; [email protected]. ‡ Istanbul Technical University, Faculty of Management, Macka 34367 Istanbul, Turkey; [email protected]. This paper originates from a research project conducted by Istanbul Technical University Women’s Studies Center and the Levy Economics Institute with the support of the UNDP Istanbul Regional Hub for Europe and Central Asia (Micro-Capital Grant Agreement), the UN Women Regional Office for Europe and Central Asia (00093828-01), UNDP Turkey, ILO Turkey (TUR/13/02/SID), and the Aydın Doğan Foundation.
The Levy Economics Institute Working Paper Collection presents research in progress by Levy Institute scholars and conference participants. The purpose of the series is to disseminate ideas to and elicit comments from academics and professionals.
Levy Economics Institute of Bard College, founded in 1986, is a nonprofit, nonpartisan, independently funded research organization devoted to public service. Through scholarship and economic research it generates viable, effective public policy responses to important economic problems that profoundly affect the quality of life in the United States and abroad.
Levy Economics Institute
P.O. Box 5000 Annandale-on-Hudson, NY 12504-5000
http://www.levyinstitute.org
Copyright © Levy Economics Institute 2017 All rights reserved
ISSN 1547-366X

1
ABSTRACT
This paper examines the aggregate and gender employment impact of expanding the early
childhood care and preschool education (ECCPE) sector in Turkey and compares it to the
expansion of the construction sector. The authors’ methodology combines input-output analysis
with a statistical microsimulation approach. Their findings suggest that the expansion of the
ECCPE sector creates more jobs and does so in a more gender-equitable way than an expansion
of the construction sector. In particular, it narrows the gender employment and earnings gaps,
generates more decent jobs, and achieves greater short-run fiscal sustainability.
Keywords: Early Childhood Care and Preschool Education; Employment; Gender Equality;
Macroeconomic Impact; Microsimulation; Input-Output Analysis
JEL Classifications: I25; E17; R15; O23

2
1. INTRODUCTION
Low employment rates in Turkey have persisted despite its substantial economic growth over the
last 30 years. The employment rate is 49.5 percent for the working-age (15–64) population,
compared to the OECD average of 65.7 percent in 2014 (OECD 2015). Underlying this low
employment rate is the limited participation of women in the labor market. In 2014, the
employment rate for women was a mere 29.5 percent, one of the lowest in the world, whereas it
was 69.5 percent for men, which is on par with OECD and EU male averages.
One of the factors behind the low female employment rate in Turkey is the poor state of its social
care infrastructure. In particular, the early childhood care and preschool education (ECCPE)
enrollment in Turkey is very low compared to other OECD member countries. For children
between 0 and 2 years old, the enrollment rate was 0.24 percent in Turkey1 compared to the
OECD average of 33 percent in 2013–14. The enrollment rate for older children (3-year olds and
5-year olds) was 7.8 percent and 43.5 percent in Turkey, while the OECD average enrollment
rates were 70 percent and 94 percent, respectively. These gaps amount to the potential to enroll
over 3.3 million additional children. The low rates of enrollment coincide with the fact that 64.8
percent of working-age women in Turkey cite domestic responsibilities as a reason for staying
out of the labor force.
The link between the availability of high-quality, affordable social care services and the
alleviation of the constraints on the female labor supply has been well-established (Kimmel 1995;
Powell 1997; Budig and England 2001; Blau and Tekin 2007; Temple and Reynolds 2007;
Lefebvre and Merrigan 2008; see also Ilkkaracan [2012a and b] for Turkey). These female labor
outcomes reflect the supply-side economic effect of an ECCPE expansion that contributes to the
improvement of women’s labor force attachment and the reduction of gender gaps in labor force
participation.
1 There are no official statistics in Turkey on childcare and preschool enrollment rate for children under 3. This is an estimate based on Ilkkaracan, Kim, and Kaya (2015).

3
However, an expansion of ECCPE services and—more generally of the social care service
sector—also carries the potential to facilitate a substantial demand-side effect through job
generation by raising employment demand directly in the ECCPE sector and indirectly in the
sectors supplying its intermediate inputs. The role of the service sector as an engine of
development and growth has received growing attention in the recent literature (Ghani 2010;
Eichengreen and Gupta 2013). Studies find that both traditional services (such as food, personal,
and social services) and modern services (such as computer, communications, and business
services) may contribute considerably to employment creation and overall economic
development due to their labor-intensive nature. For instance, Tregenna (2008) finds that in
South Africa, the service sector generates significant direct and indirect employment, despite
relatively weaker backward linkages compared to manufacturing.
In addition, the analysis of the role of the child and elder care service sector can be particularly
relevant due to the growing demand for care services and the importance of childcare and
education in the development of human capital.2 Focusing on employment-generation potential,
Warner and Liu (2006) find that in the US the output multiplier effect of investing in childcare
services is substantial and higher than the effect of investing in other sectors, such as
construction. Antonopoulos and Kim (2010) and Antonopoulos et al. (2014) analyze the
aggregate employment and distributional impacts of investing in the care infrastructure in South
Africa and the US and find that in both countries it can generate more jobs and yields more
inclusive growth than investing in physical infrastructure. Importantly, these studies find that,
unlike the expansion of physical infrastructure, the expansion of the social care sector contributes
to the narrowing of employment and pay gaps. It does so not only by initiating the female labor
supply response, but also by direct and indirect generation of jobs in the ECCPE and related
sectors.
This paper contributes to the literature on service sector development and female employment by
examining the aggregate and gendered impact of the ECCPE expansion on employment in
Turkey. We utilize the input-output (I-O) framework to obtain aggregate results and augment it
2 Another strand of literature evaluates the macroeconomic impact of early childhood education, although its focus is limited to long-term economic growth effects via the human capital accumulation of children (e.g. Dickens, Sawhill, and Tebbs 2006).

4
with a microsimulation model in order to conduct a distributional impact assessment on gender
gaps in employment and earnings, as well as industrial and occupational segregation. We
compare the impacts of public expenditure expansion of the ECCPE and the construction sector.
Our findings highlight important differences in the aggregate and distributional implications
under the two scenarios.
The rest of the paper is structured as followed. Next, we present the summary statistics of the
data utilized in the analysis. We discuss the findings of the field survey of childcare centers and
preschools that we conducted in order to obtain the data on the cost structure of the ECCPE
sector needed for the accurate estimation of the sector’s employment multipliers. The following
section discusses the combined methodology of the I-O multiplier and microsimulation
approaches. We address issues related to the aggregation bias in I-O analysis and describe the
approach used to correct for it. In the subsequent section, we present the findings and compare
the two scenarios in terms of their impact on aggregate employment, gender gaps in employment
and earnings, and industrial and occupational gender segregation; this section also compares the
results in terms of fiscal sustainability. We summarize our findings and point to policy
implications in the conclusions.
2. DATA
As the basis for aggregate analysis, we use the 2011 Turkish I-O table from the University of
Groningen’s World Input-Output Database (WIOD) (Timmer et al. 2015). It is a symmetric
matrix of I-O accounts of 35 aggregate industries. However, it does not contain a separate
account for the ECCPE sector. Instead, the ECCPE expenditures are aggregated under two
different sectors: education (kindergartens for children age 3–5 and nursery classes for children
age 5; NACE 85.1) and health and social services (daycare centers and nurseries for children age
0–6; NACE 88.91). These sectors exhibit different employment intensities, both within and
among the sectors to which they belong, potentially resulting in biased employment multipliers.
For instance, a teacher’s aide is often employed to assist young children with their basic needs
and to facilitate the class activities with a classroom teacher, as required by law. The additional

5
employee per teacher could potentially double the number of teaching staff. In addition, the
relative intensity of intermediate inputs may be different from the aggregated sectors, as the
requirements for educating and caring for young children are likely to be different from the
requirements for students of school age. In order to obtain an accurate cost structure, we
conducted a survey of childcare centers and preschools.
Face-to-face interviews were carried out with representatives of 77 private and 25 public
facilities in 12 districts of Istanbul from December 2014–January 2015.3 During the interviews,
the respondents were asked to give information on the percentage share of each item in their total
annual expenses for 2014, their current utilization rates, and the number of students enrolled, as
well as the number of teachers, and managerial and nonmanagerial nonteaching staff.
Table 1 shows the detailed cost structure of the ECCPE sector along with the cost structure of the
construction sector in the original I-O table. Note that the ECCPE sector shows a higher intensity
of intermediate input use than that of construction. Food and beverage, utilities, and rental
payments together account for almost half of the total intermediate inputs used by the sector,
while they account for less than 2 percent of the total intermediate inputs used by construction.
On the other hand, manufactured goods account for over a third of the total intermediate inputs
in construction, whereas they account for only 1 percent in the case of the ECCPE.
The intensity of intermediate input use of the ECCPE sector surpasses those of education and
health-social work activities in the I-O table (19.3 and 46.7 percent, respectively). It may be due
to a bias from aggregation of detailed industry data in which the ECCPE is likely to account for a
small portion of total outputs of education and health-social work activities, given the very low
enrollment rates, as discussed earlier. Thus, evaluation of the accuracy of the cost structure from
the I-O table may be misleading.
3 These districts are Ataşehir, Bağcılar, Bakırköy, Beşiktaş, Beykoz, Büyükçekmece, Kadıköy, Küçükçekmece, Pendik, Sarıyer, Ümraniye, and Üsküdar.

6
Table 1. Input compositions of the ECCPE and construction sectors in Turkey (percent of gross output) Industry ECCPE Construction
Agriculture, Hunting, Forestry, and Fishing 0.00 0.03
Mining and Quarrying 0.00 1.33
Food, Beverages, and Tobacco 7.72 0.11
Textiles and Textile Products 0.00 0.77
Leather, Leather, and Footwear 0.00 0.02
Wood and Products of Wood and Cork 0.00 1.48
Pulp, Paper, Paper , Printing, and Publishing 0.81 0.25
Coke, Refined Petroleum, and Nuclear Fuel 0.17 0.91
Chemicals and Chemical Products 1.17 0.67
Rubber and Plastics 0.00 0.97
Other Nonmetallic Mineral 0.00 8.29
Basic Metals and Fabricated Metal 0.00 5.15
Machinery, n.e.c. 0.00 0.59
Electrical and Optical Equipment 0.21 0.77
Transport Equipment 0.00 0.11
Manufacturing, n.e.c.; Recycling 3.78 0.13
Electricity, Gas, and Water Supply 10.02 1.28
Construction 5.89 1.19
Sale, Maintenance and Repair of Motor Vehicles and Motorcycles; Retail Sale of Fuel 0.00 1.63
Wholesale Trade and Commission Trade, Except of Motor Vehicles and Motorcycles 1.23 3.33
Retail Trade, Except of Motor Vehicles and Motorcycles; Repair of Household Goods 1.08 3.05
Hotels and Restaurants 0.32 0.17
Inland Transport 3.27 3.61
Water Transport 0.22 0.31
Air Transport 0.21 0.09
Other Supporting and Auxiliary Transport Activities; Activities of Travel Agencies 0.57 0.30
Post and Telecommunications 1.63 0.25
Financial Intermediation 1.11 1.53
Real Estate Activities 10.26 0.08 Renting Services of Machinery and Equipment without Operator and of Personal and Household Goods 2.71 2.25
Public Administration and Defense; Compulsory Social Security 0.00 0.00
Education 1.32 0.01
Health and Social Work 0.31 0.03
Other Community, Social, and Personal Services 0.00 0.06
Private Households with Employed Persons 0.00 0.00
Imported Intermediate Consumption 6.50 11.97
Domestic Intermediate Consumption 54.01 40.72
Total Intermediate Consumption 60.51 52.69
Taxes Less Subsidies on Products 3.60 3.51

7
Cif/ fob Adjustments on Exports 0.00 0.00
Direct Purchases Abroad by Residents 0.00 0.00
Purchases on the Domestic Territory by Non-residents 0.00 0.00
Value Added at Basic Prices 35.85 43.19
International Transport Margins 0.00 0.60
Output at Basic Prices 100.00 100.00 Source: Authors’ calculations; WIOD-Turkey 2011.
3. METHODOLOGY
Our methodological framework combines the I-O multiplier and microsimulation approaches.
The goal of the I-O multiplier analysis4 is to discern the macroeconomic employment impact by
computing the direct and indirect employment multipliers of the ECCPE sector. We employ a
hypothetical integration method to integrate the domestic I-O account of the ECCPE sector into
the original I-O table without violating the symmetry of the table (Kim 2011). This ensures that
backward linkages (the effects of an increase in demand for intermediate inputs by the ECCPE
sector) are fully accounted for, while forward linkages (the effects of an increase in the
production of ECCPE services on other industries) are excluded from the multiplier calculation.
The treatment is particularly appropriate in the case of the care sector, whose output is not
demanded as an intermediate input for production in other sectors. For the comparisons with the
construction sector, we use its sectoral cost structure based on the 2011 I-O table.
The matrix of employment multipliers is a product of the matrix of output multipliers—the
Leontief inverse of the technical coefficient matrix A—and the vector of the total number of jobs
by industry (Miller and Blair 2009). The employment intensity of the ECCPE sector, or the
direct employment impact, is exogenously determined by regulations with respect to the current
teacher-to-student ratios, as well as findings from the field survey.
4 The I-O based multiplier analysis in this paper accounts for direct and indirect effects (or the within and across-industry multiplicative impacts of the intermediate demand), but does not capture the induced effect (or the multiplicative impact of the household final demand). As such, our results constitute a lower bound on the overall job creation impact.

8
A microsimulation model allows for a full distributional analysis, more than a simple gender
decomposition based on a fixed ratio. We employ the Levy Economics Institute Microsimulation
Model (LIMM), which is a constrained statistical matching method implemented by propensity-
score ranking (Masterson and Kum 2010). Through a microsimulation exercise based on the
micro data in the Statistics on Income and Living Conditions (SILC) 2011, the new jobs from the
I-O multiplier analysis are statistically matched to the most likely employable persons, who are
in the working-age population and unemployed or not participating in the labor market for
reasons other than retirement, illness, disability, or because they are students less than 20 years
old.
Table 2 describes the size and composition of the pool of employable individuals based on these
criteria. Out of the total of 16.8 million employable people, 84.8 percent, or 14.3 million, are
female. This is a direct outcome of the very low female employment rate in Turkey, as discussed
earlier. There are approximately 2.2 million unemployed and 14.6 million nonparticipant women,
an overwhelming majority of whom reported their main occupation as homemaking (female
ratios in each category are 23.3 and 94.0 percent, respectively). Women are predominantly
represented in the nonparticipant status, whereas men are in the unemployed status. The notion
of employability in this case is simply intended to create a pool for which likelihood estimations
are carried out.
We statistically match the new jobs to the most likely individuals by personal characteristics,
including gender, age, and education level, as well as household characteristics, including
income level, household size and structure, and age of household members. This composition of
the pool of employable people is reflected in our results, based on which the majority of female
beneficiaries of the newly created jobs are nonparticipant women and unemployed men.
Table 2. The pool of employable people by gender and labor force status Men Women Total Female ratio
Unemployed 1,678,839 508,934 2,187,773 23.3 Nonparticipant 877,244 13,773,719 14,650,963 94.0
Total 2,556,083 14,282,653 16,838,736 84.8 Source: Authors’ calculations from SILC 2011.

9
Earnings are imputed based on individual characteristics and the assigned industry and
occupation. First the log of hourly wage rates and usual weekly hours of work from these jobs
are imputed using a three-stage Heckit model within age-gender cells. The independent variables
in the wage estimation are age, age squared, marital status, industry, occupation, full-/part-time
employment, and the class of worker. For the work-hour estimation, we use age and number of
children, education, age, marital status, occupation, class of worker, and the predicted log of
hourly wage. As a final step, we use a hot-decking method based on affinity scoring to transfer
the earnings of the donor records (existing workers with earnings) to the matched job recipient
records. The new earnings are added to the recipients’ household income. The imputed earnings
are then used to estimate tax revenues and social security contributions based on employment
type and other individual and households characteristics.
In the comparative simulations, we inject 20.7 billion TRY (9.5 billion USD in 2014) in the
ECCPE sector and construction sector in two separate scenarios. This is the amount that is
necessary to raise the preschool enrollment rate in Turkey to the OECD average and it
corresponds to 1.36 percent of the Turkish GPD in 2014. We choose construction as a reference
sector since it has been one of the fastest growing sectors in Turkey, supported by public
subsidies and physical infrastructure projects. Yet there has been much debate as to whether
construction can be a sustainable employment-creating engine of growth in view of housing
price bubbles, susceptibility of the construction sector to recessions, its high import intensity, and
negative environmental consequences.5
4. RESULTS
4.1 Direct and Indirect Employment Effects
Employment multipliers, measured as the number of jobs per one million USD in spending,
demonstrate the relative magnitude of direct and indirect job creation.
Table 3
5 For example, Şenesen and Günlük-Şenesen (2015) find that, despite above-average sectoral growth rates, the impact of the construction sector on output growth rates and employment in Turkey has been limited.

10
Table 3 shows the number of jobs created directly in the corresponding industry and indirectly in
other industries. The expansion of the ECCPE sector generates more than three-times the number
of direct jobs (64.4 jobs) than the expansion of construction (21.3 jobs). The difference reflects
the higher labor intensity of the ECCPE sector compared to construction. In the case of the
indirect employment impact, the expansion of ECCPE generates 11.3 indirect jobs, while
construction creates 9.2 jobs per one million USD in investments. Hence, the ECCPE expansion
generates greater numbers of direct and indirect jobs, even though the share of indirect jobs out
of total jobs in the case of the ECCPE expansion is smaller (about 15 percent) compared to the
construction sector expansion (about 30 percent).
Table 3. Employment multipliers of ECCPE and construction (number of jobs per million USD)
ECCPE Construction Direct 64.4 21.3 Indirect 11.3 9.2 Total 75.7 30.5
Source: Authors’ calculations; Turkish liras were converted to the US dollars based on the 2014 average exchange rate.
The majority of new jobs under both scenarios are concentrated in their respective sectors. The
employment intensity of the ECCPE sector determines the size of the direct employment creation.
Legislation on nurseries and daycare centers dictates the student-to-teacher ratio to be 10-to-1 for
children 0 to 2 years old and 20-to-1 for children 3 to 5 years old; it also mandates one teacher’s
aide per teacher (MFSP 1996).6 We follow the legal guidelines of the Ministry of Education and
calculate the number of teachers and aides in relation to the allowable number of additional
children to be enrolled through the ECCPE expansion. We use the OECD average as a target
ECCPE enrollment rate for each age group. Based on the field survey, we set the composition of
teaching and nonteaching staff at an ECCPE center in our simulations as follows: 36.6 percent of
total staff are teachers and another 36.6 percent are teachers’ aides (23.6 teachers and 23.6
teachers’ aides per one million USD); 16 percent are nonteaching, nonmanagerial staff, such as
6 According to the preschool survey, the student-to-teacher ratio in private schools at full capacity is estimated to be 12.7 at the mean and 9.9 at the median. The student-to-aide ratio in the same schools is estimated to be 28.2 at the mean and 21.7 at the median.

11
cooks, janitors, and others (10.3 workers per one million USD) ; and the remaining 10.8 percent
is split equally between managers and clerks (3.5 workers each per one million USD).7
The industrial distribution of domestic intermediate demand explains the gap in the indirect job
multipliers shown in Figure 1. In particular, one million USD spending on ECCPE generates
2.09 jobs in agriculture, forestry, and fishing, despite the absence of direct intermediate demand
for their goods in the cost structure of the ECCPE sector. Indirect jobs in agriculture in fact
originate from the industry’s demand for food. The input composition of ECCPE in table 1
reports 7.7 percent of the total expenditure is on food and beverage, and the indirect employment
multiplier is 24.4 jobs in agriculture per million USD spending on food, because agriculture itself
is the most labor-intensive industry in Turkey, at 67.7 workers per million USD output.8 One
million USD spending on construction generates 3.2 jobs in wholesale and retail trades, as they
account for over 6.4 percent of the total cost in construction and 13 percent of the intermediate
input costs. A large trade margin on construction materials may explain the strong indirect job
creation.
7In the field survey data, the number of nonteaching staff with a full capacity of 80 students or more is in the range of five to seven, and we take the lower bound from the data for our analysis. The composition of nonteaching, administrative staff in a school of 100 students is: one manager, one clerk or an assistant manager, and three nonteaching, nonadministrative workers for cooking, cleaning, and security services. In total, 163,695 nonteaching staff jobs are generated in our ECCPE simulations.8As a robustness check on the indirect impact, we transform the endogenous forward linkages of agriculture to exogenous ones to remove their multiplicative impacts from the analysis. Without accounting for the contribution of indirect employment by agriculture, the numbers of indirect jobs in both cases are down to 9.1 and 8.8, respectively, or 19.4 and 4.3 percent decline. Despite the steeper decline in the ECCPE case, its effect on indirect employment is at least as strong as that of construction.

12
Figure 1. Distribution of indirect employment multipliers of ECCPE and construction (number of jobs)
Source: Authors’ calculations.
4.2. Jobs Generation and the Impact on Employment by Industry and Occupation
The investment of 20.7 billion TRY in the ECCPE sector generates almost 720,000 jobs,
compared to about 290,000 jobs in the case of the investment of the same amount in construction.
This corresponds to a 1.48 percentage point increase in the employment rate, from 49.85 to 51.33
percent, whereas the expansion of the construction sector raises it to only 50.45 percent, as
shown in table 4.
Table 4. Changes in employment (percent of working age population) Number of new
jobs Numbers of employed
Percent Change in Employment Rate
SILC - 24,080,271 49.85 - ECCPE 718,693 24,798,964 51.33 1.48 Construction 289,807 24,370,078 50.45 0.60 Source: Authors’ calculations from SILC 2011 and simulations.
Table 5 shows the distribution of new jobs by industry. In assessing the direct and indirect job
creation impact, we aggregate the original 35 industries in the I-O table into seven industries to
ensure that the number of jobs by each industry is large enough for the microsimulation. In both
cases, the increase in the intermediate demand creates new jobs in agriculture, manufacturing,
and the public and private service sectors, but with varying degrees of intensity. The new jobs in
0.0 0.5 1.0 1.5 2.0 2.5 3.0 3.5
Agriculture, forestry and fishingMining and quarrying
ManufacturingElectricity, gas and water supply
ConstructionWholesale and retail trade
Hotels and restaurantsTransportation, storage, communications
Financial intermediaionReal estate, renting and business activities
Public administration and defenseEducation
Health and social work activitiesOther community, social and personal services
Construction
ECCPE

13
agriculture account for 2.8 percent of all new jobs in the case of an ECCPE sector expansion, as
opposed to 1.3 percent in the case of construction. The larger share under ECCPE is mainly due
to its direct intermediate demand for agricultural products in the form of meals and snacks for
children at care facilities. In the case of construction, jobs in agriculture are generated only via
the indirect intermediate demand of other sectors. The manufacturing and utilities sectors
produce material inputs, water, and electricity, generating 3.7 and 10.6 percent of new jobs in the
case of the ECCE and construction scenarios, respectively. Of the new jobs created in the
construction sector in the case of ECCPE expansion, 1.7 percent is in part due to the demand for
facility maintenance and repair. On the other hand, no jobs are created in ECCPE via the
construction expansion. Under both scenarios, jobs are created in other service sectors, including
wholesale and retail sales, and transportation, storage, and communications. These industries are
an integral part of supplying material inputs, as well as providing direct services to the ECCPE
and construction sectors, and they constitute 3.8 and 13.4 percent of new jobs in the two
scenarios. Financial intermediation, real estate, renting, and other business activities also provide
auxiliary services in the production of both the ECCPE and construction sectors, and account for
2.1 and 4.3 percent of the new jobs. Government, health, and social work sectors receive little
employment benefits from the expansion scenarios (only 0.2 and 0.1 percent of new jobs), as
their contributions to the expansion, as well as to other industries as suppliers of intermediate
inputs, are insignificant. Education, of which ECCPE is a part, accounts for the majority of new
jobs (85.7 percent) as a result of the strong direct job creation impact of the sector. On the other
hand, the indirect impact is weak (only 0.6 percent of the new jobs) due to their low requirement
of education as an intermediate input.

14
Table 5. Total employment distribution across industries (shares in percent, total in number)
Industry ECCPE Construction
Agriculture 2.8 1.3 Mining, Manufacturing, and Utilities 3.7 10.6 Construction 1.7 70.2 Services 3.8 13.4 Financial Intermediation, Real Estate, Renting, and Business Activities 2.1 4.3 Government, Health, and Social work 0.2 0.1 Education, all (ECCPE only)
85.7 (85.1)
0.1 (0.0)
Total 718,693 289,806 Source: Authors’ calculations; WIOD-Turkey 2011.
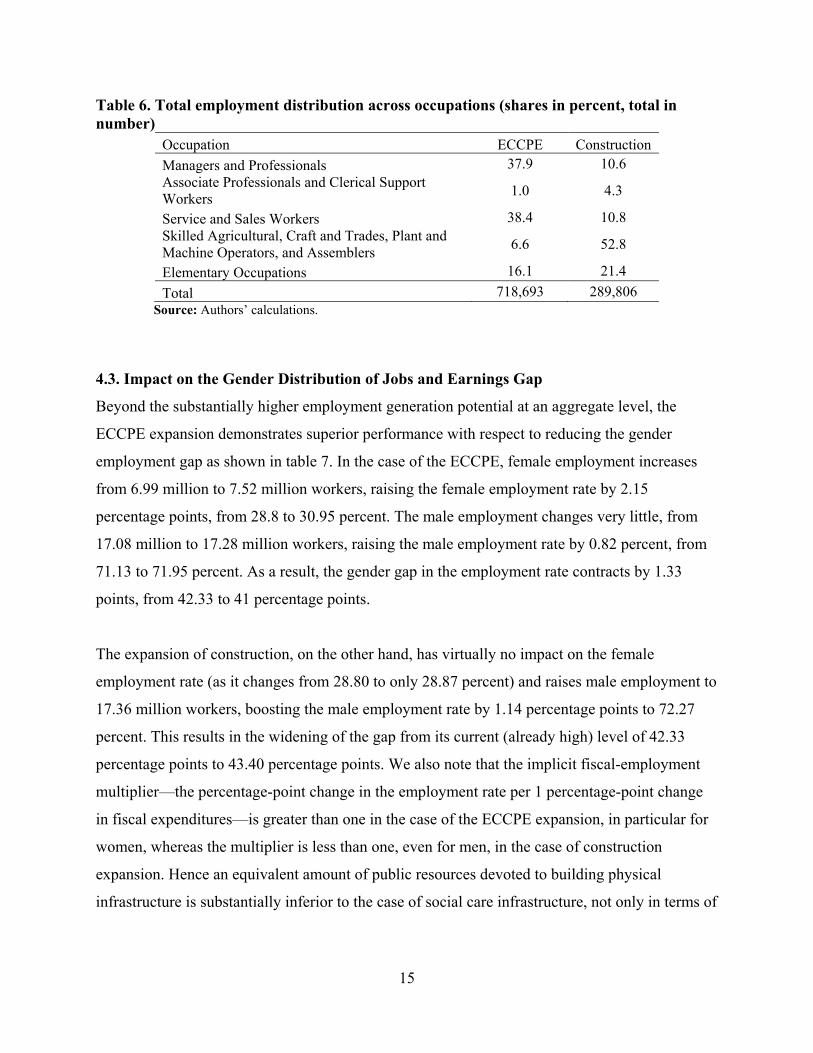
In terms of the distribution of occupations, the share of managers and professionals is 37.9
percent in the case of an ECCPE expansion, as opposed to 10.6 percent in the case of the
construction sector expansion (table 6). The difference is mainly due to the composition of
ECCPE workers, in that 36.6 out of 37.9 percent of all new workers in ECCPE (or 223,845 jobs)
are teachers, who are classified as professionals (234) in the International Standard Classification
of Occupations (ISCO-08). Teachers’ aides account for the difference in service and sales
workers. They constitute 36.6 out of 38.4 percent of the new ECCPE jobs and are classified as
service workers (531) in the ISCO-08. In the case of construction, the largest occupation group is
craft and related trades workers. Building and related trade workers and machine operators are a
part of this group, accounting for 52.8 percent of all new direct and indirect jobs from the
expansion of the construction sector. Elementary occupations include nonteaching and
nonmanagerial staff—cleaning, food preparation, and security and other building management—
and account for 16 percent of all new jobs in the ECCPE sector and 21.4 percent of all new jobs
in construction.
15
Table 6. Total employment distribution across occupations (shares in percent, total in number)
Occupation ECCPE Construction
Managers and Professionals 37.9 10.6 Associate Professionals and Clerical Support Workers
1.0 4.3
Service and Sales Workers 38.4 10.8 Skilled Agricultural, Craft and Trades, Plant and Machine Operators, and Assemblers
6.6 52.8
Elementary Occupations 16.1 21.4
Total 718,693 289,806 Source: Authors’ calculations.
4.3. Impact on the Gender Distribution of Jobs and Earnings Gap
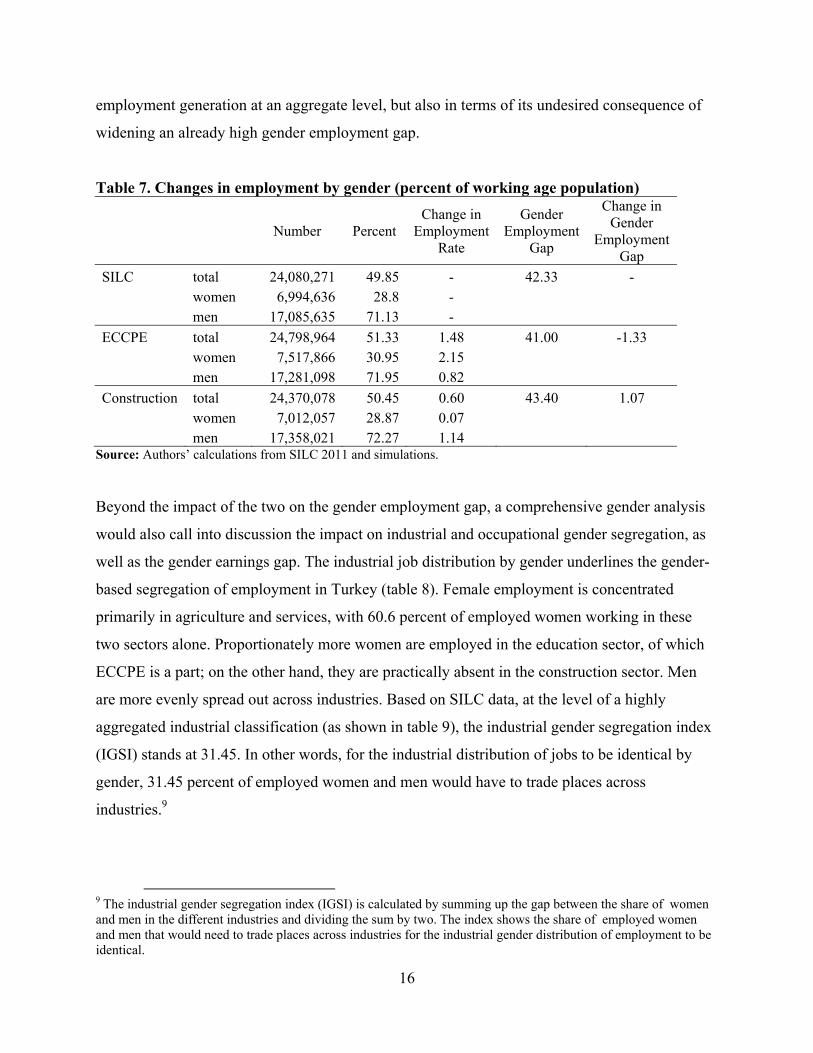
Beyond the substantially higher employment generation potential at an aggregate level, the
ECCPE expansion demonstrates superior performance with respect to reducing the gender
employment gap as shown in table 7. In the case of the ECCPE, female employment increases
from 6.99 million to 7.52 million workers, raising the female employment rate by 2.15
percentage points, from 28.8 to 30.95 percent. The male employment changes very little, from
17.08 million to 17.28 million workers, raising the male employment rate by 0.82 percent, from
71.13 to 71.95 percent. As a result, the gender gap in the employment rate contracts by 1.33
points, from 42.33 to 41 percentage points.
The expansion of construction, on the other hand, has virtually no impact on the female
employment rate (as it changes from 28.80 to only 28.87 percent) and raises male employment to
17.36 million workers, boosting the male employment rate by 1.14 percentage points to 72.27
percent. This results in the widening of the gap from its current (already high) level of 42.33
percentage points to 43.40 percentage points. We also note that the implicit fiscal-employment
multiplier—the percentage-point change in the employment rate per 1 percentage-point change
in fiscal expenditures—is greater than one in the case of the ECCPE expansion, in particular for
women, whereas the multiplier is less than one, even for men, in the case of construction
expansion. Hence an equivalent amount of public resources devoted to building physical
infrastructure is substantially inferior to the case of social care infrastructure, not only in terms of
16
employment generation at an aggregate level, but also in terms of its undesired consequence of
widening an already high gender employment gap.
Table 7. Changes in employment by gender (percent of working age population)
Number Percent Change in
Employment Rate
Gender Employment
Gap
Change in Gender
Employment Gap
SILC total 24,080,271 49.85 - 42.33 - women 6,994,636 28.8 - men 17,085,635 71.13 -
ECCPE total 24,798,964 51.33 1.48 41.00 -1.33 women 7,517,866 30.95 2.15
men 17,281,098 71.95 0.82
Construction total 24,370,078 50.45 0.60 43.40 1.07 women 7,012,057 28.87 0.07
men 17,358,021 72.27 1.14 Source: Authors’ calculations from SILC 2011 and simulations.
Beyond the impact of the two on the gender employment gap, a comprehensive gender analysis
would also call into discussion the impact on industrial and occupational gender segregation, as
well as the gender earnings gap. The industrial job distribution by gender underlines the gender-
based segregation of employment in Turkey (table 8). Female employment is concentrated
primarily in agriculture and services, with 60.6 percent of employed women working in these
two sectors alone. Proportionately more women are employed in the education sector, of which
ECCPE is a part; on the other hand, they are practically absent in the construction sector. Men
are more evenly spread out across industries. Based on SILC data, at the level of a highly
aggregated industrial classification (as shown in table 9), the industrial gender segregation index
(IGSI) stands at 31.45. In other words, for the industrial distribution of jobs to be identical by
gender, 31.45 percent of employed women and men would have to trade places across
industries.9
9 The industrial gender segregation index (IGSI) is calculated by summing up the gap between the share of women and men in the different industries and dividing the sum by two. The index shows the share of employed women and men that would need to trade places across industries for the industrial gender distribution of employment to be identical.

17
The expansion of the ECCPE sector further accentuates the industrial segregation by gender to
the extent that 96 percent of new female job recipients are concentrated in the ECCPE sector,
compared to 58.1 percent of new male jobs recipients. New employment for men is spread out
across different sectors, but the segregation index rises to 33.25 as a result of the concentration of
female employment in the ECCPE sector. The expansion of the construction sector tends to
increase industrial gender segregation as well, since the majority of the jobs created are taken by
males in the construction sector. Yet the increase in the segregation index is relatively lower than
the case of ECCPE (from 31.45 to 32.0), as jobs to be taken by females in particular are created
in industries in which women are relatively underrepresented.
Table 8. Industrial segregation of employment: before and after the simulations (percent) Before After
SILC ECCPE Construction
Industry Men Women Gap Men Women Gap Men Women Gap
Agriculture 17.6 42.0 24.4 17.5 39.2 21.7 17.3 41.9 24.6 Mining, Manufacturing, and Utilities
21.4 13.9 7.5 21.3 13.1 8.2 21.2 14.0 7.2
Construction 9.4 0.7 8.7 9.4 0.6 8.8 10.4 0.7 9.7
Services 33.9 18.6 15.3 33.7 17.3 16.4 33.6 18.6 15.0 Financial Intermediation, Real Estate, Renting, and Business Activities
6.7 7.7 1.0 6.7 7.3 0.6 6.6 7.8 1.2
Government, Health, and Social Work
7.4 9.1
1.7 7.3 8.5
1.2
7.2 9.1
1.9
Education and ECCPE 3.7 8.0 4.3 4.3 13.9 9.6 3.6 8.0 4.4
Total 100 100 -- 100 100 -- 100 100 --
IGSI 31.45 33.25 32.0 Source: SILC 2011; authors’ calculations.
In turn, the occupational gender segregation index (OGSI) at the highly aggregated level of
classification (see table 9) stands at 8.5 percent.10 In other words, 8.5 percent of employed
women and men would have to trade places across occupations in order for the occupational
gender distribution of employment to be identical. Gender-based occupational segregation is less
pronounced than the industrial segregation (see table 10). The share of high professional jobs
among women is 13.9 percent, lower than 16.5 percent among men. The shares of low
10 The occupational gender segregation index (OGSI) is calculated in the same way as the industrial gender segregation index (IGSI); see footnote 12.

18
professional jobs and elementary jobs are higher among women than men; therefore, the ECCPE
expansion creates a greater proportion of high professional and services jobs for women as
teachers and teachers’ aides compared to the existing occupational distribution, resulting in the
increase in the shares to 16.1 and 12.7 percent from 13.9 and 11.3 percent, respectively. As a
result, the OGSI is reduced to 7.9 percent. The ECCPE expansion hence contributes to the
reduction of occupational segregation. On the other hand, the construction expansion does very
little to the distribution of occupations and the OGSI remains the same as before. The above
discussion of the findings on aggregate employment outcomes and gender distribution of job
recipients highlights the female-inclusive nature of the investment in ECCPE relative to
construction.
Table 9. Occupational segregation of employment: before and after the simulations (percent)
Before After
SILC ECCPE Construction
Occupation Men Women Gap Men Women Gap Men Women Gap
High professional 16.5 13.9 2.6 16.5 16.1 0.4 16.4 13.9 2.5 Low professional 10.6 14.8 4.2 10.5 13.8 3.3 10.5 14.8 4.3 Service workers 13.5 11.3 2.2 13.9 12.7 1.2 13.4 11.4 2.0 Production workers 46.1 42.4 3.7 45.9 39.6 6.3 46.3 42.3 4.0 Elementary workers 13.3 17.6 4.3 13.2 17.8 4.6 13.4 17.6 4.2
Total 100 100 -- 100 100 -- 100 100 --
OGSI 8.5 7.9 8.5 Source: SILC 2011; authors’ calculations. Note: Occupations are aggregated into five groups from the conventional nine groups in the ISCO-08. The correspondence between the two groups is as follows: high professionals to managers and professionals; low professionals to technicians and associated professionals and clerical support workers; service workers to service and sales workers; production workers to skilled agricultural, forestry, and fishery workers, craft and related trades workers, and plant, machine operators, and assemblers; elementary workers to elementary occupations. Finally, the gender gap in earnings is significant, as shown in the left chart of figure 2.
Among the current workers with reported earnings, the median earnings for men and women are
10,800 and 8,630 TRY, resulting in an unadjusted gap of 20 percent.11 The middle chart of figure
2 shows the earnings from the expansion of ECCPE, with median earnings from the new jobs for
11 Accounting for unpaid family workers in the calcuation lowers women’s median earnings to 2,400 while they remain the same for men. The earnings gap then jumps up to 76 percent.

19
men and women being 16,500 and 15,550 TRY per year, respectively, corresponding to an
unadjusted earnings gap of 6 percent. Hence the gender earnings gap among the new workers
substantially decreases with the ECCPE expansion. Combining the new earnings from the
ECCPE expansion with the current earnings, the median female earnings go up to 9,000 TRY
from 8,630 TRY, while the male median earnings remain constant. The gender earnings gap is
thus reduced from its current level of 20 percent to 16.7 percent. The positive outcome stems
from the fact that the education industry offers above-average earnings opportunities for women
with higher education who hold teaching positions (high professionals) (see figure 3).
The construction expansion generates jobs that pay median earnings of 10,010 TRY for women
and median earnings of 7,650 TRY for men. This result is the reversal of the gender earnings gap
among the new workers, which is in part because the wages in construction tend to be lower than
in most industries, and 89 percent of the male workers in construction are production and
elementary workers, who have the lowest earnings among all occupations (figure 3). However,
the combined female median earnings go up by only 3 TRY to 8,633 TRY due to the very low
number of women receiving new jobs under the construction scenario. As a result, the combined
gender earnings gap declines by only 0.2 percent to 19.8 percent. Hence the expansion of the
construction sector does little to reduce the gender gap in earnings.

20
Figure 2. Annual earnings by gender and poverty status: current and new workers from simulations (TRY)
Source: Authors’ calculations.
Figure 3. Earnings distribution by industry, occupation, and gender from SILC 2011 (TRY)
Source: Authors’ calculations.
4.4. Fiscal Sustainability
The large scale of the fiscal expansion, which corresponds to 1.36 percent of the Turkish GDP,
calls for an assessment of its fiscal sustainability. We focus on the short-run sustainability
resulting from additional income tax revenue and social security contributions of the new
workers in the simulations.12 This estimation is undertaken by calculating the income tax and
12 Investing in ECCPE also entails long-run implications with respect to returns in the form of human capital enhancement and higher productivity, which is weaker in the case of contruction. A series of recent studies on the
020
,00
040
,00
060
,00
0A
nnua
l ear
nin
gs, T
L
male female
SILC
020
,00
040
,00
060
,00
0A
nnua
l ear
nin
gs, T
Lmale female
ECCPE
020
,00
040
,00
060
,00
0A
nnua
l ear
nin
gs, T
L
male female
Construction
0 20,000 40,000 60,000Annual earnings, TL
Education&Care
Gov't&Health
FIRE
Service
Construction
Mining&MFG
Agriculture
femalemale
femalemale
femalemale
femalemale
femalemale
femalemale
femalemale
SILC
0 20,000 40,000 60,000Annual earnings, TL
Elementary
Production
Service
Lowprofessional
Highprofessional
female
male
female
male
female
male
female
male
female
male
SILC

21
social security contributions of newly employed persons (i.e., the job recipients). Personal
income information in the SILC 2011 is the net of individual income tax, stamp tax, and
employee contributions to social security from gross income. There are four progressive income
tax rates based on taxable income, defined as gross income minus social security contributions.
Prior to this step, we employ probit and multinomial regressions to predict the registration status
of those who are assigned a job in the simulation, as only registered employees with a contract
pay contributions and income taxes, while nonregistered employees pay only income taxes. Next,
we impute the employees’ contributions to social security among the registered workers and the
income tax payment for those who are employed. Employers’ contributions are calculated using
a fixed ratio of employers’ to employees’ contributions (16.5 percent to 15 percent), following
regulations.
This approach results in 85.4 percent of the new jobs created from the ECCPE expansion being
likely to be registered for social security benefits, while only 30.2 percent of the new jobs created
from the expansion of construction are likely to be registered. Note that the percentage of jobs
with the benefits from the ECCPE expansion is much higher than the prevailing rate among
current workers, as a result of a higher-than-average rate of registered jobs in the education
sector, 95.2 percent compared to 56.6 percent of all employed workers.
Table 10. Distribution of jobs with social security benefits SILC ECCPE Construction Number of workers 14,015,471 613,685 87,545 Share (percent) 56.6 85.4 30.2
Source: Authors’ calculations from SILC 2011 and simulations.
Our estimations of the increase in government tax revenues under the two scenarios are
presented in table 11.
Under the ECCPE expansion, there is an increase of 8.8 billion TRY in total social security
contributions paid by employees and employers. The increase in receipts from individual income
US finds that spending on early childhood education yields the highest internal rates of return formalized in the form of higher future productivity and earnings (Heckman et al. 2010; Heckman, Pinto, and Savelyev 2013; Conti and Heckman 2012).
22
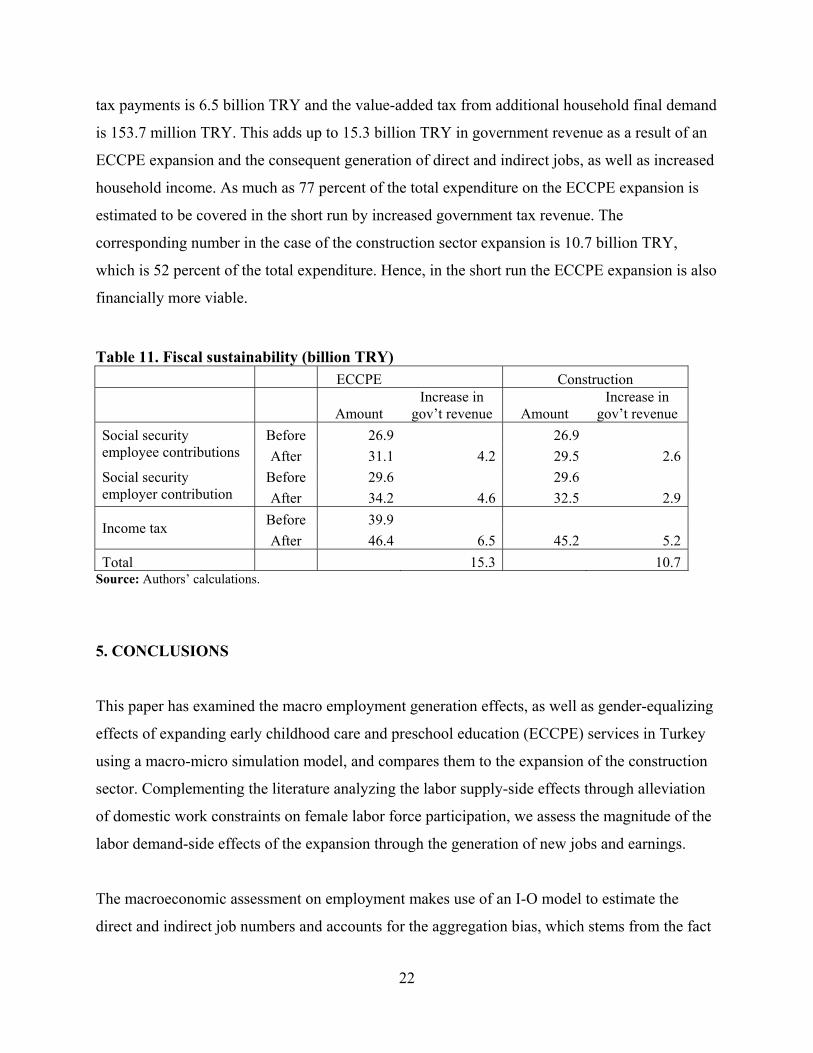
tax payments is 6.5 billion TRY and the value-added tax from additional household final demand
is 153.7 million TRY. This adds up to 15.3 billion TRY in government revenue as a result of an
ECCPE expansion and the consequent generation of direct and indirect jobs, as well as increased
household income. As much as 77 percent of the total expenditure on the ECCPE expansion is
estimated to be covered in the short run by increased government tax revenue. The
corresponding number in the case of the construction sector expansion is 10.7 billion TRY,
which is 52 percent of the total expenditure. Hence, in the short run the ECCPE expansion is also
financially more viable.
Table 11. Fiscal sustainability (billion TRY) ECCPE Construction
Amount Increase in
gov’t revenue Amount Increase in
gov’t revenue
Social security employee contributions
Before 26.9 26.9
After 31.1 4.2 29.5 2.6
Social security employer contribution
Before 29.6 29.6
After 34.2 4.6 32.5 2.9
Income tax Before 39.9
After 46.4 6.5 45.2 5.2
Total 15.3 10.7 Source: Authors’ calculations.
5. CONCLUSIONS
This paper has examined the macro employment generation effects, as well as gender-equalizing
effects of expanding early childhood care and preschool education (ECCPE) services in Turkey
using a macro-micro simulation model, and compares them to the expansion of the construction
sector. Complementing the literature analyzing the labor supply-side effects through alleviation
of domestic work constraints on female labor force participation, we assess the magnitude of the
labor demand-side effects of the expansion through the generation of new jobs and earnings.
The macroeconomic assessment on employment makes use of an I-O model to estimate the
direct and indirect job numbers and accounts for the aggregation bias, which stems from the fact

23
the ECCPE account is added into several sectors in the original I-O table. A business survey of
childcare centers and preschools was conducted to collect the necessary information to construct
a separate I-O account of the ECCPE sector. This account was subsequently integrated into the
2011 WIOD I-O table for Turkey, preserving the balanced nature of the original table by using a
hypothetical integration method. The Leontief inverse of the expanded table yields the
employment multiplier matrix on which we base the employment impact of the expansion. To
analyze the gender-based distributional impact, we employ the propensity score–based
microsimulation model to assign the jobs to the most likely individuals using the 2011 Survey of
Income and Living Conditions (SILC) of Turkey.
We simulate the model using the amount of investment that corresponds to raising the current
preschool enrollment rates in Turkey to their equivalent average OECD rates, which in our
calculations necessitates an increase in the total ECCPE expenditures to 1.36 percent of Turkish
GDP. Our findings show that investing in the social care infrastructure is likely to produce a
series of economic outcomes that are superior to the outcomes based on investing in physical
infrastructure. We find that the ECCPE expansion has the potential to generate 718,000 jobs and
raise the employment rate by 1.48 percentage points. On the other hand, the expansion of the
construction sector on the same scale is likely to generate only 289,000 jobs, raising the
employment rate by 0.6 percentage points. Moreover, the ECCPE expansion can increase
employment opportunities for women significantly, contracting the gender employment gap from
42.33 to 41 percent. By contrast, under the construction scenario, the gender employment gap is
further expanded to 43.4 percent. Furthermore, the ECCPE expansion reduces occupational
gender segregation and contracts the gender earnings gap, while the construction expansion has
hardly any impact. In addition, the majority of the new jobs from the ECCPE expansion are
likely to be decent jobs, defined as jobs with formal registration for social security benefits.
The large-scale fiscal expansion raises the question of fiscal sustainability. From a partial tax
simulation model, we find that up to 74 percent of the fiscal expenditure on the ECCPE
expansion can be recovered from additional income tax receipts and social security contributions,
whereas only 53 percent can be recovered in the case of the construction expansion.

24
Our findings suggest that a reordering of fiscal priorities, whereby public investment and
expenditures are directed towards the underdeveloped and neglected social care infrastructure
instead of the almost-exclusive emphasis on physical infrastructure, can serve as an effective tool
for inclusive, gender-egalitarian growth. This has implications both for fiscal expansions through
stimulatory spending in response to an economic recession, as well as for fiscal contractions
under austerity measures. While the decision to increase or decrease fiscal spending are usually
made with macroeconomic performance indicators in mind, our analysis demonstrates that
choosing fiscal priorities related to the ECCPE sector has strong implications for inclusive
employment creation.

25
REFERENCES Antonopoulos, Rania, and Kijong Kim. 2010. “Responding to the Crisis, Promoting Gender
Equality: Stimulus Packages, Public Job Creation and Lessons Learned from South Africa’s Expanded Public Works Programs,” in The World Economy in Crisis—The Return of Keynesianism, S. Dullein, E. Hein, A. Truger, A., and T. van Treeck (eds.). Marburg: Metropolis.
Antonopoulos, Rania, Kijong Kim, Thomas Masterson, and Ajit Zacharias. 2014. “Investing in
Care: A strategy for effective and equitable job creation,” in Gender Perspectives and Gender Impacts of the Global Economic Crisis, Rania Antonopoulos (ed.). New York: Routledge.
Bhagwati, J.N. 1984. “Splintering and Disembodiment of Services and Developing Nations.”
World Economy 7(2): 133–44. doi:10.1111/j.1467-9701.1984.tb00265.x. Blau, David, and Erdal Tekin. 2007. “The Determinants and Consequences of Child Care
Subsidies for Single Mothers in the USA.” Journal of Population Economics 20(4): 719–41.
Budig, Michelle J., and Paula England. 2001. “The Wage Penalty for Motherhood.” American
Sociological Review 66(2): 204–25. Central Bank of the Republic of Turkey (CBRT). 2015. Real Estate Price Index. Available at:
http://www.tcmb.gov.tr/wps/wcm/connect/TCMB+TR/TCMB+TR/Main+Menu/Istatistikler/Reel+Sektor+Istatistikleri/Konut+Fiyat+Endeksi.
Conti, Gabrielle, and James Heckman. 2012. “The Economics of Child Well-Being.” IZA
Discussion Paper No. 6930. Bonn: Institute for the Study of Labor (IZA). Dickens, William, Isabel Sawhill, and Jeffrey Tebbs. 2006. “The Effects of Investing in Early
Education on Economic Growth.” Brookings Institution Research Report. Washington, DC: The Brookings Institution.
Eichengreen, Berry, and Poonam Gupta. 2013. “The Two Waves of Service-Sector Growth.”
Oxford Economic Papers 65(1): 96–123. Gemmell, Norman. 1982. “Economic Development and Structural Change: The Role of the
Service Sector.” The Journal of Development Studies 19 1): 37–66. doi:10.1080/00220388208421849.
Ghani, Ejaz. 2010. “Is Service-Led Growth a Miracle for South Asia?” In The Service Revolution
in South Asia, Ejaz Ghani (ed.). New Delhi: Oxford University Press.

26
Greenhalgh, Christine, and Mary Gregory. 2001. “Structural Change and the Emergence of the New Service Economy.” Oxford Bulletin of Economics and Statistics 63(September): 629–46.
Heckman, James, Seong Hyeok Moon, Rodrigo Pinto, Peter Savelyev, A., and Adam Yavitz.
2010. “The Rate of Return to the HighScope Perry Preschool Program.” Journal of Public Economics 94(1–2): 114–28.
Heckman, James, Rodrigo Pinto, and Peter Savelyev. 2013. “Understanding the Mechanisms
through Which an Influential Early Childhood Program Boosted Adult Outcomes.” American Economic Review 103(6): 2052–86.
Ilkkaracan, Ipek. 2012a. “Why So Few Women in the Labor Market in Turkey: A Multi-
dimensional Analysis.” Feminist Economics 18(1): 1–36. —————. 2012b. “Work-Family Balance and Public Policy: A Cross-country Perspective.”
Development 55(3): 325–32. Ilkkaracan, Ipek, Kijong Kim, and Tolga Kaya. 2015. “The Impact of Public Investment in
Social Care Services on Employment, Gender Equality and Poverty: The Turkish case.” Research Report. Istanbul and Annandale-on-Hudson, NY: Istanbul Technical University Women’s Studies Center and the Levy Economics Institute at Bard College.
Kaldor, Nicholas. 1963. “Capital Accumulation and Economic Growth.” In Proceedings of a
Conference Held by the International Economics Association, F.A.Lutz and D.C. Hague (eds.). London: Macmillan.
Kay, David, James E. Pratt, and Mildred E. Warner. 2007. “Role of Services in Regional
Economy Growth.” Growth and Change 38(3): 419–42. Kim, Kijong. 2011. “Ex-Ante Evaluation of a Targeted Job Program: Hypothetical Integration in
a Social Accounting Matrix of South Africa.” Economic Modelling 28(6): 2683–90. Kimmel, Jean. 1995. “The Effectiveness of Child Care Subsidies in Encouraging the Welfare-to-
Work Transition of Low-Income Single Mothers.” The American Economic Review 85(2): 271–75.
Lefebvre, Pierre, and Philip Merrigan. 2008. “Child Care Policy and the Labor Supply of
Mothers with Young Children: A Natural experiment from Canada.” Journal of Labor Economics 26(3): 519–48.
Lin, Justin, Celestin Monga, Dirk Willem te Velde, Suresh D. Tendulkar, Alice Amsden, K.Y.
Amoako, Howard Pack, and Wonhyuk Lim. 2011. “DPR Debate: Growth Identification and Facilitation: The Role of the State in the Dynamics of Structural Change.” Development Policy Review 29(3): 259–310.

27
Masterson, Thomas, and Hyunsub Kum. 2010. “Statistical Matching Using Propensity Scores: Theory and Application to the Analysis of the Distribution of Income and Wealth.” Journal of Economic and Social Measurement 35(3–4): 177–96.
Miller, Ronald. E., and Peter D. Blair. 2009. Input-Output Analysis: Foundations and Extensions,
Second edition. New York: Cambridge University Press. Ministry for Family and Social Policies (MFSP). 1996. Implementing Regulation of Private
Nurseries, Day-care Centers and Children’s Clubs (Özel Kreş ve Gündüz Bakımevleri ve Özel Çocuk Kulüpleri Kuruluş ve İşleyiş Esasları Hakkında Yönetmelik). No. 22781 R.G., October 8. Available at: http://cocukhizmetleri.aile.gov.tr/data/544e2471369dc318044059a0/yeni_duzenlenen_ozel_kres_ve_gunduz_bakimevleri_ve_ozel_cocuk_kuluplerikurulus_ve_isleyis_esaslari_hakkinda_yonetmelik.pdf.
Organisation for Economic Co-operation and Development (OECD). 2015. Employment Outlook
2015, July. Paris: OECD. DOI: 10.1787/19991266. Available at: http://www.oecd-ilibrary.org/employment/oecd-employment-outlook-2015_empl_outlook-2015-en;jsessionid=32bq116g3n3m3.x-oecd-live-03
Powell, Lisa. 1997. “The Impact of Child Care Costs on the Labor Supply of Married Mothers:
Evidence from Canada.” The Canadian Journal of Economics 30(3): 577–94. Şenesen, Ü., and G. Günlük-Şenesen. 2015. “The Contribution of the Turkish Construction
Sector to Growth and Employment: An Assessment for the 2000s (Türkiye İnşaat Sektörünün Büyüme ve İstihdama Katkısı: 2000’li Yıllar için bir Sorgulama).” In A Tribute to Tuncer Bulutay (Tuncer Bulutay’a Armağan), N. Yıldırım (ed.). Ankara: Mülkiyeliler Birliği.
Temple, James, and Arthur Reynolds. 2007. “Benefits and Costs of Investment in Preschool
Education: Evidence from the Child-Parent Centers and Related Programs.” Economics of Education Review 26(1): 126–44.
Timmer, Marcel, Erik Dietzenbacher, Bart Los, Robert Stehrer, and Gaaitzen de Vries. 2015.
“An Illustrated User Guide to the World Input–Output Database: The Case of global automotive production.” Review of International Economics 23: 575–605.
Tregenna, Fiona. 2008. “The Contribution of Manufacturing and Services to Employment
Creation and Growth in South Africa.” South African Journal of Economics 76: S175–204.
Warner, Midred, and Zhilin Liu. 2006. “The Importance of Child Care in Economic
Eevelopment: A Comparative analysis of regional economic linkage.” Economic Development Quarterly 20: 97–103.

28
Wegner, Manfred. 1987. “Creating New Jobs in the Service Sector.” The Annals of the American Academy of Political and Social Science 492: 136–50.