working paper number 113 evaluating the success of
TRANSCRIPT

QEH Working Paper Series – QEHWPS113 Page 1
Working Paper Number 113
Evaluating the Success of Malaysia’s Exchange Controls (1998-99)
S. M. Ali Abbas*
The paper evaluates in depth, the exchange control measures imposed by Malaysia in September-1998. Controls are evaluated using three alternative benchmarks—Malaysia vs. itself (pre-controls), vs. ex-ante forecasts of Malaysia for the year-1999, and Malaysia vs. the other affected East Asian economies. The comparisons suggest that controls were effective in turning some key variables around, especially the stock market index, and also enabled Malaysia to incur fewer social costs vis-à-vis the other crisis-economies. Finally, a GARCH measure of Malaysia’s interest-rate and stock-market volatility is obtained and the impact of controls on volatility studied. Evidence was found of volatility responding differentially to the Russian crisis (before controls) and the Brazilian crisis (after controls), indicating that controls helped insulate Malaysia from developments in global financial markets. Overall the paper confirms the necessity of LDCs retaining the capital controls option in the absence of material efforts to reform the international financial architecture and the inadequacy of conventional policy tools to effectively deal with present-day capital flows.
January 2004
I am grateful to Dr. Valpy FitzGerald for providing the direction for this paper (it derives from my M-Phil Development Studies thesis at QEH in 2000), to Alex Cobham for his excellent supervision during the writing up, and to Syed Asad Kausar for his invaluable help with the econometric analysis.
* D-Phil Economics Candidate, University of Oxford <[email protected]>

QEH Working Paper Series – QEHWPS113 Page 2
INTRODUCTION Currency crises prior to the East Asian one were often blamed on poor fundamentals. Dollar-financed over-consumption and fiscal imbalance were cited as factors responsible for most Latin American crises. What was unique about the East Asian crisis, however, was its occurrence despite the underlying economies’ seemingly sound fundamentals. High saving and investment rates, consistent budget surpluses and low inflation had all been hallmarks of the region’s growth in the 1980s/90s. The devil, some pointed out, was the inherently destabilising nature of modern capital flows. The latter’s unique ability to accentuate or even cause boom-bust cycles in small open economies, and to spread their contagious effects across continents was identified as both unprecedented, and highly portentous for the international financial system. This naturally revived debate on how countries, especially emerging markets, could guard themselves against the risks of mobile capital. Stress was initially laid on the need to further strengthen country fundamentals--the latter being broadened to include sound risk-management abilities of the financial sector. To achieve that, developing countries (LDCs) were encouraged to adopt best practices in disclosure and corporate governance, and improve prudential regulation. Later, in the context of Malaysia’s September-1998 measures, and their endorsement by leading economists1, however, the debate was lent a new direction--one that pointed to those “unsayable words: capital controls”2. Two polar views came to surface: the orthodox free-market view saw any restrictions on capital mobility as distortionary and hence welfare-reducing. Inspired by the ‘Washington Consensus’, and led by the U.S. Treasury and the International Monetary Fund (IMF), this group derided controls as a step-backwards. It highlighted a) the benefits of integrating into international capital markets, as enunciated by the pre-crisis success of the East Asian economies themselves; b) the well-known risks of controls leading to a deferral of reform to politically convenient times—which in some countries, would never come; and c) the inherent difficulties of keeping controls effective in the face of increasingly sophisticated financial markets. Interventionist arguments emanated from UNCTAD3, World Bank (WB), and many LDCs themselves. They located the need for controls in the context of serious inadequacies in the international financial architecture, particularly the distortions inherent to the functioning (or malfunctioning) of financial markets. The role of IMF’s high-interest-rate policy in worsening the crisis of confidence in East Asia and deepening the recession was highlighted. More generally, the block presented controls as a necessary part of the policy armour of all those countries which did not possess the kind of financial infrastructure and fiscal stability that would enable capital account shocks (both positive and negative) to be perfectly accommodated. Numerous examples were cited in which countries, both developing and advanced, had materially benefited from imposing controls, both by discouraging reversible inflows during booms, and by limiting capital outflows in busts. Through this, industrialised countries (ICs) were criticised for their ‘double -standards’: the fact that they themselves imposed controls when it suited their needs, but discouraged LDCs from doing the same. As such, the foregoing clearly highlights the need to evaluate the potential of capital controls in today’s world, in particular Malaysia’s apparently bold move of imposing outflow controls in the midst of a crisis. Malaysia also makes a particularly interesting case study because it had an established history of adopting market-oriented and reform-minded policies in the region. Despite this, the country made a policy choice that directly clashed with the then prevailing economic orthodoxy of full capital account liberalisation. The question is, whether this choice disadvantaged or
1 Paul Krugman (1998;99)and Joseph Stiglitz (1998), for example. 2 a la Krugman (1998). 3 United Nations Conference on Trade and Development.

QEH Working Paper Series – QEHWPS113 Page 3
benefited Malaysia vis-à-vis those that preferred to respect the orthodoxy, and that in either case, were controls the differentia l factor, or something else? The paper proceeds as follows: It starts with identifying Malaysia’s pre-crisis strengths and weaknesses relative to the other East Asian economies, and the particular policy dilemmas that the crisis brought thereto. Discussion then turns to the problem of evaluating controls in the absence of an appropriate counterfactual for post-controls Malaysia. Three comparison benchmarks are chosen: Malaysia’s performance relative to itself (before controls were imposed), to that of its neighbours and to what ex-ante forecasts expected it to be. Controls are finally studied in the backdrop of their intended objectives, with a focus on whether the measures helped reduce volatility in line with authorities’ expectations.
0. HISTORY OF MALAYSIA’S CAPITAL ACCOUNT LIBERALISATION
Malaysia had a long history of good market-oriented macroeconomic management entering the 1990s. One of the earliest to liberalise the capital account among the LDCs, it fared exceptionally on most measures of openness4. Liberalisation commenced in November 1968 with current account convertibility, followed in 1973 by the floating of the ringgit, and in 1986-87 by the dismantling of important capital controls. The late 1980s also marked the beginning of financial deregulation, strengthening of prudential regulation and efforts to deepen financial markets. Following a temporary episode with a mix of tax-based and quantitative inflow controls in 19945, liberalisation regained momentum. By 1996, restrictions on the following capital account transactions had been materially relaxed. i) portfolio inflows by non-residents into all types of Malaysian financial instruments; primary
issues of securities abroad by residents required approval ii) portfolio outflows, except for corporate residents with domestic borrowing (subject to limits)
and primary issues of securities by non-residents (approval required) iii) borrowing abroad by authorised dealers and tier-1 investment banks iv) forex lending to residents and non-residents (subject to certain prudential limits) v) inward FDI (actively encouraged); approval required for certain strategic sectors vi) outward FDI The same period also saw offshore over-the-counter trading in equities and bonds listed on Malaysian exchanges, ringgit ‘financial’ transactions with non-residents, and the use of ringgit in trade payments and receipts, become established features of the country’s financial system. By mid-1997, an efficient offshore ringgit market in neighbouring Singapore had developed, accounting for most cross-country currency hedging activities (IMF, 1999). With Malaysian banks permitted to provide forward cover to non-residents against ringgit, there was nothing to stop arbitrage between onshore and offshore markets. Given the freedom over capital account transactions, these arbitrage opportunities played a crucial role in spreading to Malaysia the crisis that erupted in neighbouring Thailand in July-1997.
1. MALAYSIA & THE CRISIS: STRENGTHS & WEAKNESSES
4 In 1997, trade/GNP stood at 170%, FDI/Total Private Investment at 20% and foreign market share in total bank assets at
30%. These ratios were one of the highest in the region (BNM, 1998). 5 This refers to the six-month restrictions introduced in Jan-Feb 1994 in response to large inflows of foreign capital (especially short-term). A mix of non-market- and market-based measures was introduced; the former including prohibition
of short-term Malaysian money market security sales by residents to non-residents, and the latter, non-interest bearing
deposit requirements for banks against ringgit funds of foreign banking institutions (IMF, 2000).

QEH Working Paper Series – QEHWPS113 Page 4
As suggested by second-generation currency crisis models, domestic weaknesses alone were not the cause of the East Asian crisis’s collapse6. Foreigners’ self-fulfilling expectations played a crucial role in lending the crisis its eventual depth and breadth (Radelet and Sachs, 1998). This was particularly true for Malaysia which suffered despite having “generally stronger fundamentals than the other Asian crisis economies” (IMF, 2000:46). This partly explains why Malaysia reacted by blaming its ills on external factors, in particular, expressing its disenchantment with the state of the international financial architecture and the latter’s tolerance of currency speculators. To be accurate, though, Malaysia owed much of its pre-crisis prosperity precisely to its relatively more favourable posture towards foreign investment (Mohammed, 1998)--which makes the country’s resort to controls all the more interesting. Moreover, the economy was not without weaknesses. Indeed, in their absence, controls would have been unnecessary. It seems appropriate, therefore, to assess Malaysia’s subsequent policy choices in the context of its particular strengths and vulnerabilities as revealed by the crisis. This will enable us to better evaluate the rationale for the type and timing of outflow controls imposed by authorities in September 1998. We begin with a brief chronology of events following Malaysia’s entry into the East Asian crisis. 1.1 The Onset of the Crisis Turbulence hit Malaysia’s financial markets immediately after the Thai baht devaluation on 3-July-1997. A general re-assessment of regional lending risks brought the Malaysian ringgit (RM) under significant depreciative pressure as well. After a brief effort to defend the exchange rate by intervening in the forex market as well as allowing domestic interest-rates to rise, authorities let the ringgit float7 (see figures 1 & 20, and Appendix B). Contemporaneously, higher currency and country risk premia, caused offshore interest-rates to rise well above their on-shore counterparts, triggering significant capital flight from Malaysia 8. In an attempt to break the arbitrage link , BNM imposed limits on commercial banks’ offer-side swap transactions with nonresidents on 4-Aug-1997 (see Appendix A). While this permitted BNM to keep on-shore rates substantially below offshore-rates, it also augmented the arbitrage incentive. Outflows therefore continued via various legal channels 9, net FPI outflows alone exceeding RM 20 bn in Q3/4-1997 (figure 3). Mounting equity sales by foreigners coupled with the high interest-rates produced by BNM’s tight-credit policies to lower the KLSE10 composite index (CI) to half its pre-crisis level by end-1997 (figure 2). Real output growth rate (QoQ) declined from 7.1% in Q2-1997 to -8.9% in Q1-1998 (figure 16), led by sharp declines in manufacturing and construction output (figure 11). Consequently imports (both industrial and consumption) fell by much more than exports11, generating some of the current account surpluses needed to balance the capital outflows (figure 7). Even so, net international reserves fell markedly in 1997, falling below 3½ months of imports by Q1-1998 (figure 5). Corporate distress was reflected by a sharp increase in the number of listed companies seeking court protection from creditors. Financial sector distress was indicated by a large shift in deposits from domestic to foreign and large domestic banks; a rise in nonperforming loans (NPLs)--from 3.6% of total loans in June-1997 to 5.7% at end-1997 (subsequently peaking at 15% of in November-199812)
6 Second generation crisis models are explained in workd done by Masson and Agenor, and Krugman and Obstfeld, in 1998
and 1999 respectively. 7 Though the ringgit had originally been floated in 1973, it had become de facto pegged to the US$ in the years preceding the crisis. 8 IMF (2000) estimates this flight at RM 24.6 bn in quarters 2/3-1997. 9 These included transfers of nonresident deposits in Malaysia to offshore banks, and portfolio outflows by residents. 10 Kuala Lumpur Stock Exchange. 11 IMF (1999b) estimates that imports declined by 25% by far exceeding the slowdown in exports (10%). 12 IMF (1999b) estimates for NPLs stand even higher--at 25% of total as of December-1998.

QEH Working Paper Series – QEHWPS113 Page 5
(figure 12); and declining capital adequacy ratios--bottoming out at below 10% in August-1998 (figure 13) 1.2 Malaysia’s Unique Strengths There were many reasons why Malaysia’s external vulnerabilities, ex-ante, seemed markedly lower than those of the other East Asian countries. Malaysia’s short-term external debt/reserves ratio, at a healthy 0.5, remained consistently and considerably lower than the other crisis countries throughout the 1990s (figure 14c). As a proportion of total external debt also, it never exceeded 35% (figure 8)13. A clear preference for longer-term FDI over external bank borrowing (unlike Korea, for example) had ensured a higher equity component in the capital account. Similarly the country’s more developed capital markets (both equity and bond) had drawn in more portfolio investment than in other countries, indicating higher risk-sharing by foreigners14. “Malaysia stood out in the region as having had relatively strong regulatory structures and legal framework for corporate sector problem resolutions even before the crisis” (IMF, 1999a:85). Thus, dealing with crisis-induced corporate distress was likely to be less problematic. Similarly, Malaysia’s financial system15 was relatively sound, ranking high in the region, both on the risk-weighted-capital-adequacy and NPLs/total-loans criteria --the respective ratios stood at 12% and 3% just before the crisis (Mohammad, 1999). Loan provisioning had risen to a generous 2% in 1996 from 0.75% in 1990. Also, “Malaysia already had a well-designed institutional framework supported by strong legislation in place” to undertake any financial sector restructuring necessitated by the crisis (IMF, 1999b:30). Good financial management was reinforced by sound macroeconomic policies. Provision of various incentives to the private sector (especially since the late-1980s) had contributed to rapid economic growth (averaging above 8% through the 1990s); monetary and fiscal prudence ensured both low inflation (3% in 1996); and a history of budget surpluses and policies to promote domestic saving16 had helped keep current account deficits under check (5% in 1996). For these reasons, then, Malaysia did not suffer as sudden or severe a downturn as the other crisis countries. Indeed, IMF (1999b) does not even regard Malaysia (along with the Philippines) as a “crisis country”. Yet understating the extent of Malaysia’s troubles to either emphasise its pre-crisis economic and financial strengths, or to undermine the possible achievements of its subsequent controls would be unfair. By Q1-1998, the country had certainly been engulfed by serious problems, which were at least partly traceable to Malaysia’s weaknesses, as outlined below. 1.3 Structural Fragilities and Vulnerabilities
13 Malaysia’s prudence in this matter followed directly from its mid-1980s near-debt crisis whereafter strong measures were
instituted to prevent excessive build-up of short-term external debt. 14 Since such investments need to be ‘liquidated’ at market prices, the latter’s decline during crises cushions the capital
account against large reversals. 15 At the beginning of 1998, Malaysia’s financial system was dominated by commercial banks (22 domestic; 13 foreign-owned), 35 in all, and with about 69% of the system’s assets. Other significant players were finance companies (39 and
22%), merchant banks (12 and 6%), discount houses (7 & 3%) and money and exchange brokers (IMF, 1999b). A two-tier
structure was instituted for banks in December-1994 (extended to finance companies and merchant banks in 1996). Under this framework, institutions with prescribed minimum shareholder funds and satisfying the CAMEL (capital adequacy, asset
quality, management efficiency, earnings performance and liquidity position) test qualified as tier-1 institutions and were
subject to less regulation. The rest were tier-2, and as such, expected to increase their capital bases through mergers. The two-tier structure was abolished in April, 1999 after “it was perceived to have failed to achieve the desired strengthening of
the capital base of domestic banks” (IMF, 1999b:80). 16 These included, for example, the introduction of employee pension schemes.

QEH Working Paper Series – QEHWPS113 Page 6
As elsewhere in the region, the sheer momentum of growth and investment had caused investors, domestic and foreign, to overlook many important sources of vulnerability in the Malaysian economy. Though most of the debt was owed to the domestic financial system, Malaysia, nonetheless, had one of the highest loan/GDP ratios in the world (IMF, 1999a). From 1992-96, the debt/equity and short-term/total debt ratios hovered around 240% and 90% respectively for financial enterprises, and 160% and 50% for non-financial companies17. Moreover, while domestic indebtedness meant firms were less vulnerable to ER depreciation (than in other crisis countries), it also implied a strong link between corporate distress and financial sector problems. Financial institutions operated at high credit/deposit ratios (close to 1), which reduced their ability to increase lending when credit was tight as during periods of large capital outflows. Earlier policies had encouraged lending to Bumiputra18 for stock market investments in line with the ‘social equity’ objectives of the government19. Loans for the development of housing for Bumiputra communities had been encouraged for similar reasons (OECF, 1999). Rapid corporate sector expansion (partly induced by capital inflows) and rising asset prices (figures 2 & 18) fueled further credit growth20 in the 1990s (see figure 17). BNM raised interest-rates and imposed loan limits in April 1997 to prevent excessive lending. But bank liquidity remained high leading to erosion of asset quality (IMF, 1999b). Firms and the financial sector were both vulnerable to a decline in asset prices. Large closely-held conglomerates21 had indulged in double -leveraging: borrowing from banks to inject equity into subsidiaries, and using the subsidiaries’ shares as collateral to raise more debt (IMF: 1999a). Corporate wealth and lender health were, thus, critically hinged on the boom in equity markets. Moreover, many of these subsidiaries were financial institutions with large direct exposures to the property and stock market sectors, accentuating the vulnerability of the financial system22. Though the size of Malaysia’s equity market23 was impressive by regional standards (figure 14a)24, liquidity was not (figure 14b). Ordinary investor participation was low, the market catering mostly to group investment schemes, such as pension funds and the national investment trust25. Thus, regulations regarding securities dealings, investor protection and transparency had been slow to develop. In the 1990s, about one-third of all dealings occurred through the ‘nominee system’, 17 For some sectors (trading and services or consumption related enterprises) a 50% short-term debt ratio was not a source of vulnerability, but for property companies and diversified holdings it appeared excessive. Indeed, leverage among non-
financial enterprises was highest (60-70%) in precisely such companies (IMF, 1999a). 18 The ethnic Malay population whose political support had enabled Prime Minister Mahathir to assume and retain power in Malaysia since the mid-1970s. 19 The government had a stated policy of encouraging ownership of corporate assets by ethnic Malays to bring them at par
with the ethnic Chinese population which dominated the business scene in Malaysia. 20 Credit growth was particularly rapid among smaller financial institutions, in part reflecting their efforts to build their asset
bases to achieve Tier-1 status. 21 Large private sector companies were created as part of the government’s industrialisation and growth strategy adopted in the early 1980s. 22 The interdependencies inherent in Malaysia’s corporate ownership structures are well-documented in Claessens et.al
(1999). 15% of sampled firms were found to have some cross-ownership, 40% to have pyramid structures (including holding companies), and over 40% to have been affiliated with business groups. 23 The first stock exchange was jointly established with Singapore in 1964 and functioned as a twin market until end-1989.
Efforts to establish an independent stock market gained momentum as privatisation activity grew and portfolio inflows swelled. The dual listing system with Singapore was eventually abolished in January 1990. Even so, at the time of the crisis a
substantial volume of Malaysian shares was actively traded on the Singapore over-the counter market (CLOB). 24 The size of the security market had grown thanks largely to the privatisation carried out in the 1990s and a government policy that encouraged new listings. 25 As of 1996, 13.5% of stocks listed on the KLSE were owned by individuals, 47.8% by financial institutions, 36.1% by
nominees and 2.6% by others (OECF, 1999).

QEH Working Paper Series – QEHWPS113 Page 7
considered a ‘hotbed of suspicious securities dealings’ and a popular channel with domestic and foreign speculators (OECF: 1999). Moreover, even if domestic regulations had been strong, transactions taking place via the Central Limit Order Book (CLOB) in (Singapore) could not be subjected thereto. Capital markets, generally, and bond markets, specifically, have many advantages26. Malaysia’s bond market, while the best-developed among the crisis-countries, was much smaller than its stock market. At end-1996, bond/stock capitalisation ratio stood at 0.28 compared with 1.56 in the U.S (OECF, 1999). Liquidity was again dismal, with holding mostly confined to bank/institutional investors. Moreover, authorities’ strict liquidity and prudential requirements for financial institutions27 had allowed the government to use the bond market as a captive market. Though private listings had risen to equal government-bond stock by end-1997, issuance of the former had taken place mostly through private placements with bank guarantees. If anything, this increased reliance on, and the fragility of, the banking system. Key macroeconomic and financial indicators had started deteriorating in 1996-97. Export growth slowed, returns on construction fell and the share of firms with interest obligations exceeding profits increased (IMF, 1999a). This was particularly true for the highly leveraged finance companies, whose profitability was already on the decline due to narrowing interest-rate spreads28. Enthusiasm in the stock market also weakened starting March-1997, four months in advance of the crisis. Malaysia’s highly open economy and perceived similarity with other East Asian countries already rendered it vulnerable to regional shocks. The presence of active offshore currency and share trading only aggravated this vulnerability. An efficient offshore market can provide important services (like hedging) for traders and foreign investors, as pointed out by IMF (1999a), but policymakers must weigh these against the possible costs it can inflict on the domestic economy. Thus, even if Malaysia’s was a classic case of ‘contagion caused by investor panic’ as Park (1999) suggests, the country could still be partly blamed for choosing policies that rendered it more susceptible to such panic. This logic would imply that governments deserve credit when they reduce the economy’s vulnerability to international shocks, either through controls imposition or some other means. Chile’s inflow controls in the early 1990s, and Malaysia’s own 1994 controls and prudent external debt management are cases in point. It is against this backdrop that we now investigate if Malaysia’s 1998-99 controls can also be placed in the latter category.
2. THE IMPOSITION OF EXCHANGE CONTROLS On 1-Sep-1998, BNM imposed a two-pronged exchange control regime (see Appendix 4A for details):
i) ringgit and Malaysian share trading in Singapore were prohibited and repatriation of all ringgit held abroad was demanded within 30 days: to eliminate the offshore market for ringgit and reduce volatility and speculation in the currency and equity market
ii) nonresidents’ external accounts were frozen and a one-year holding period requirement was instituted for foreign portfolio investors29: to smoothen the outflow of foreign portfolio capital
At the same time the currency was pegged at 3.8 RM/US$, 10% more appreciated than its end-August trading value of around 4.2. Major modifications followed in February-1999, when the one-year
26 Efficient capital markets can, for instance, reduce corporate leverage and improve corporate governance. Bond markets, in
particular, can help lower firms’ reliance on bank financing and make the system more resilient to shocks. A developed ‘government-bond’ market, moreover, can greatly facilitate financial sector restructuring by allowing government to raise
the requisite funds in the time of need (IMF, 1999b). 27 Banks, pension funds, investment trusts and other institutional investors. 28 This was partly due to the increasing competition among financial institutions as well as the segmentation of inter-bank
money markets (IMF, 1999b). 29 Limits on residents’ investment abroad were also imposed.
QEH Working Paper Series – QEHWPS113 Page 8
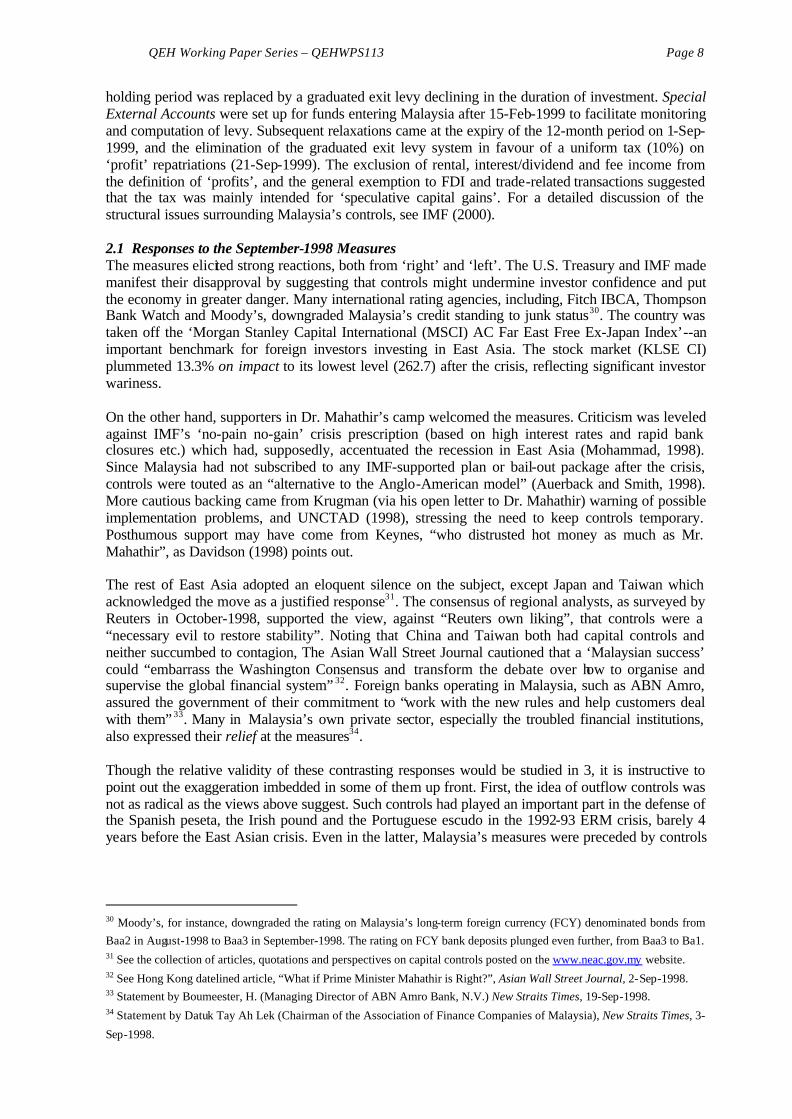
holding period was replaced by a graduated exit levy declining in the duration of investment. Special External Accounts were set up for funds entering Malaysia after 15-Feb-1999 to facilitate monitoring and computation of levy. Subsequent relaxations came at the expiry of the 12-month period on 1-Sep-1999, and the elimination of the graduated exit levy system in favour of a uniform tax (10%) on ‘profit’ repatriations (21-Sep-1999). The exclusion of rental, interest/dividend and fee income from the definition of ‘profits’, and the general exemption to FDI and trade-related transactions suggested that the tax was mainly intended for ‘speculative capital gains’. For a detailed discussion of the structural issues surrounding Malaysia’s controls, see IMF (2000). 2.1 Responses to the September-1998 Measures The measures elicited strong reactions, both from ‘right’ and ‘left’. The U.S. Treasury and IMF made manifest their disapproval by suggesting that controls might undermine investor confidence and put the economy in greater danger. Many international rating agencies, including, Fitch IBCA, Thompson Bank Watch and Moody’s, downgraded Malaysia’s credit standing to junk status30. The country was taken off the ‘Morgan Stanley Capital International (MSCI) AC Far East Free Ex-Japan Index’--an important benchmark for foreign investors investing in East Asia. The stock market (KLSE CI) plummeted 13.3% on impact to its lowest level (262.7) after the crisis, reflecting significant investor wariness. On the other hand, supporters in Dr. Mahathir’s camp welcomed the measures. Criticism was leveled against IMF’s ‘no-pain no-gain’ crisis prescription (based on high interest rates and rapid bank closures etc.) which had, supposedly, accentuated the recession in East Asia (Mohammad, 1998). Since Malaysia had not subscribed to any IMF-supported plan or bail-out package after the crisis, controls were touted as an “alternative to the Anglo-American model” (Auerback and Smith, 1998). More cautious backing came from Krugman (via his open letter to Dr. Mahathir) warning of possible implementation problems, and UNCTAD (1998), stressing the need to keep controls temporary. Posthumous support may have come from Keynes, “who distrusted hot money as much as Mr. Mahathir”, as Davidson (1998) points out. The rest of East Asia adopted an eloquent silence on the subject, except Japan and Taiwan which acknowledged the move as a justified response31. The consensus of regional analysts, as surveyed by Reuters in October-1998, supported the view, against “Reuters own liking”, that controls were a “necessary evil to restore stability”. Noting that China and Taiwan both had capital controls and neither succumbed to contagion, The Asian Wall Street Journal cautioned that a ‘Malaysian success’ could “embarrass the Washington Consensus and transform the debate over how to organise and supervise the global financial system” 32. Foreign banks operating in Malaysia, such as ABN Amro, assured the government of their commitment to “work with the new rules and help customers deal with them” 33. Many in Malaysia’s own private sector, especially the troubled financial institutions, also expressed their relief at the measures34. Though the relative validity of these contrasting responses would be studied in 3, it is instructive to point out the exaggeration imbedded in some of them up front. First, the idea of outflow controls was not as radical as the views above suggest. Such controls had played an important part in the defense of the Spanish peseta, the Irish pound and the Portuguese escudo in the 1992-93 ERM crisis, barely 4 years before the East Asian crisis. Even in the latter, Malaysia’s measures were preceded by controls
30 Moody’s, for instance, downgraded the rating on Malaysia’s long-term foreign currency (FCY) denominated bonds from Baa2 in August-1998 to Baa3 in September-1998. The rating on FCY bank deposits plunged even further, from Baa3 to Ba1. 31 See the collection of articles, quotations and perspectives on capital controls posted on the www.neac.gov.my website. 32 See Hong Kong datelined article, “What if Prime Minister Mahathir is Right?”, Asian Wall Street Journal, 2-Sep-1998. 33 Statement by Boumeester, H. (Managing Director of ABN Amro Bank, N.V.) New Straits Times, 19-Sep-1998. 34 Statement by Datuk Tay Ah Lek (Chairman of the Association of Finance Companies of Malaysia), New Straits Times, 3-
Sep-1998.

QEH Working Paper Series – QEHWPS113 Page 9
in Thailand35 (May-June, 1997), Philippines36 (Jul-1997 & April-1998) and Indonesia 37 (Aug-1997)--though many of these were removed once IMF-supported programmes were adopted. Malaysia itself tightened its capital account regulations in August-1997, without evoking serious criticism from any quarter. The comprehensive nature of the September-1998 controls was, perhaps, surprising, but the ‘idea’ of imposing outflow controls, certainly, was not. 2.2 Rationale for the September-1998 Imposition In order to understand the rationale behind the September-1998 measures, we first track the policy measures taken by the government since July-1997 to see if a residual need for controls can be identified. As detailed in Appendix 4B, policy underwent four phases till October-1998. In the adjustment phase interest-rates were raised, credit was tightened and merger plans in the financial sector were announced. With the arrival of the budget in October-1997, however, policy stance shifted towards reviving the economy through higher spending. At the same time, rules for foreign ownership of property were relaxed to ameliorate property price deflation (see Appendix 4A). The relative tightness of credit till end-1997 was found to be deleterious to the health of the highly leveraged Malaysian corporates. Monetary policy was cautiously relaxed therefore, in Q1-1998--the stabilisation phase. This featured the setting up of the National Economic Action Council and announcement of the National Economic Revival Plan. Blanket deposit guarantees were announced in March-1998 to prevent a systemic run on the banks, though a payments crisis was never imminent. At the same time banking and capital market regulations were tightened. By late Q2-1998, interest rates turned course (figure 1), falling a good 20-30% below their offshore counterparts by August-1998. This was the revival phase. Monetary/credit policies were aggressively eased, and the institutional infrastructure to rescue the corporate sector and recapitalise/consolidate the financial system was laid 38. Some prudent safeguards on loans were repealed; banks, in fact, were ordered, under penalty of sanctions, to increase lending for property and stock market investments--precisely the kind loans that helped trigger the East Asian crisis (EIU39, 1999). Expectedly, low interest-rates brought back the ghost of “unholy trinity” to the authorities. Capital outflows to the offshore market and short-selling in ringgit therein, revived depreciative pressures on the ER. A second wave of depreciation commenced in Q2, generating cost-push inflation and further import-contraction (see figures 7 & 9). The net FPI account also turned negative in Q2/3 after a temporary surplus in Q1 (figure 3). The expected decline in international reserves was preempted, however, by higher export revenues in late Q1/Q2 (figures 7 and 5). Overall, nonetheless, the reversal of tight monetary conditions--deemed essential to revive the real economy and corporate and financial sector health--had enunciated the policy contradiction inherent in targeting both ER stability and interest-rates while maintaining capital mobility. The ‘pre-imposition’ rationale for exchange controls in East Asia, most notably provided by Krugman (1998)
35 Thailand, like Malaysia, also had an active offshore market, which made currency defense problematic. Thailand,
therefore, imposed limits on baht lending to foreigners in May -June, 1997 that created a two-tier exchange market with
separate exchange rates for investors buying baht in domestic and offshore markets (trade, FDI and ‘genuine’ FPI transactions were excluded). 36 In July, 1997, the Philippines government instituted prior approval requirements for the sale of nondeliverable forwards to
nonresidents and lowered limits on residents’ forex purchases from banks for non-trade purposes. The latter were further reduced in April-1998. 37 Limits were imposed on forward sales of forex contracts by domestic banks to nonresidents (trade/FDI were excluded). 38 Danaharta--to deal with bad debts in the financial sector; Danamodal--to recapitalise the banking system and CDRC--a Corporate Debt Restructuring Committee were all established at this juncture. BNM remained the lead coordinator of the
restructuring programme, closely supervising the activities of the three agencies. 39 The Economist Intelligence Unit Annual Economic Forecast (1999).

QEH Working Paper Series – QEHWPS113 Page 10
and UNCTAD (1998), was predicated precisely on the ability of controls to resolve this contradiction. In its 1-Sep-1998 press announcement of controls, BNM itself cited “regaining monetary autonomy” as the “over-riding objective” of controls. Yet, there were other important structural factors at play as well--the stock market, for instance, which Malaysia’s confidence building measures (including monetary policy reversal), had failed to revive. Partly responding to the sharp rating downgrades most East Asian economies received in 1998, the Malaysian stock market sank to its lowest level in years in August-1998 (figure 2). Offshore currency and stock trading only worsened the situation by offering attractive arbitrage opportunities to investors, and undermining ringgit stability. Earlier, Malaysia’s larger capital markets were mentioned as a strength. They were, to the extent that they helped prevent an outright bankruptcy of the financial system. But to the extent that a perverse combination of Malaysia’s ownership structures and risky policies had raised financial and corporate exposure to asset markets, a larger stock market represented a weakness. Indeed, as the sectoral break-up of NPLs in figure 15 reveals, loans for stock market and property investments were the major source of the problem. Add to this loans made against stock-collateral and the stock of bank-guaranteed corporate bonds, and most of the financial sector’s vulnerabilities can be traced to the state of Malaysia’s equity markets. The wealth implications of stock market movements for savers (consumers) notwithstanding, the foregoing probably explains why authorities pressured banks to increase their stock-market lending as well as relaxed ‘controls’ on foreign ownership of property. It was a desperate bid to revive the flagging asset markets and, through that, restore some health to the financial and corporate sectors. More importantly, it helps us understand why the capital controls eventually imposed targeted mainly ‘equity outflows’ while attempting to resolve an ‘essentially banking crisis’, a question broached by IMF (2000). 2.3 The Timing Issue The debate on the motive for controls notwithstanding, their timing bewildered even more people. For e.g., in hindsight, it appears that Q2/Q3-1998 represented the turning point for the region. Exports picked up, foreign reserves stabilised and financial sector consolidation gathered steam. This was also partly true for Malaysia , as pointed out earlier. So had Malaysia ‘already turned the corner’ by August-1998--making controls redundant (Krugman, 1999)? Or was their timing just perfect, as Wing (1999) suggests. The latter’s contention that the eve of controls represented the “worst period for Malaysia, if not the other countries” is also not without weight. We discuss this below. On many counts, the three months immediately preceding controls (especially August-1998 represented Malaysia’s worst period since the crisis struck. Bank capitalisation fell to its lowest, to just over 10% in August-1998, symptomatic of nontrivial financial distress (figure 12). August-imports, at $4.317 bn, hit rock-bottom as well, indicating severe contraction in demand (figures 7 & 16). Producer infla tion and employment trends, as up till July, confirmed similar contraction on the supply side (figures 9 & 10). The stock market was certainly at its lowest in August-1998, while the ringgit had depreciated to its minimum in 7 months. Money supply had not picked up, despite sustained government efforts, reflecting both banks’ hesitation to lend as well as weak capital inflows (figures 1, 3 & 4 respectively). Many of these effects had been exacerbated by the political turmoil that struck Malaysia in late-summer 199840, and the Russian crisis (August) which accentuated investor wariness towards emerging markets. The latter led to a sharp rise in Malaysia’s risk premium in August-1998 (figure 19). Moreover, speculative arbitrage driven by onshore-offshore interest-rate differentials accentuated the volatility and turbulence already plaguing domestic money and stock markets (figures 1 & 2).
40 Deputy Prime Minister Anwar Ibrahim, who had been a big proponent of ‘free-market and liberalisation policies’, was
sacked.

QEH Working Paper Series – QEHWPS113 Page 11
If nothing else, the above discussion suggests that controls were not imposed in the ‘best of times’ for Malaysia. Moreover, even if the period from June to August-1998 can be regarded a turning point ‘ex-post’, this was certainly not obvious ‘ex-ante’--which is what really matters for policymaking. Indeed, international economic forecasts well into the late-winter of 1998 continued to paint a rather gloomy picture of East Asia -1999, with Malaysia no exception. Though this underscores the difficulties of extending otherwise logical arguments to a complex issue like controls, it provides, nonetheless, a useful starting-point for assessing the costs and benefits thereof.
3. ASSESSING MALAYSIA’S EXCHANGE CONTROLS The question of whether Malaysia’s controls were ‘successful’ or not ultimately depends on how ‘success’ is defined. Is it measured by: A) the degree to which Malaysia out-performed or under-performed the other crisis countries (Korea,
Indonesia, Thailand--referred to as “KIT” henceforth41) in the controls-period, and thereafter; or B) the extent to which controls lived up to, or defied, the forecasts of independent analysts; or C) how well controls achieved their intended objectives, as set by BNM Choosing either of the above involves the implicit or explicit assumption of a ‘counterfactual’ or ‘benchmark’ for Malaysia. Both, the issues that can be addressed, and the conclusions regarding the costs and benefits of controls, hinge crucially on this choice. 3.1 Benchmark ‘A’: Comparing Malaysia with Korea, Indonesia and Thailand The main problem with comparing Malaysia and a group of other East Asian crisis-countries (Korea, Indonesia, Thailand, referred to as “KIT” from now onwards) is the nontrivial dissimilarities between the two. As mentioned earlier, IMF (1999b) argues that Malaysia’s superior firm and banking sector fundamentals helped prevent as severe a crisis therein as in KIT42 (IMF, 1999b). Insofar as this is true, then, an ex-post recovery by Malaysia matching KIT’s is not enough to vindicate controls, as authorities in Malaysia presently claim. After all, if Malaysia started from a better position and also relied on the controls ‘crutch’, it should have done much better than KIT, and not just not much worse. The above, nonetheless, should be balanced by the fact that Malaysia has recovered ‘without’ IMF-‘support’. Consequently, Malaysia’s official external debt, and the associated interest obligations, have not increased like KIT’s43 (figure 8) after 1998. In the long-run, therefore, the country can sustain higher fiscal and current account deficits than other regional economies can. Also, Malaysia’s difficulties were ‘different’ from the others, as mentioned in 1, and as such it was not clear if an IMF-package, as an alternative to controls, would have been appropriate. For example, Malaysian corporates and banks did not have large unhedged foreign currency exposures like KIT. IMF’s high interest rate policy which was meant to defend the plunging currencies, was, therefore, not as relevant for Malaysia. In fact, as Sachs (1999) points, these policies did little to improve the situation even in KIT. Also, since Malaysian banks were better capitalised and managed than KIT’s, subscription to an IMF-plan calling for rapid bank closures may have caused the axe to fall on otherwise healthy financial institutions. Finally, none of the IMF-packages included a plan for reviving the stock or property markets, which were the major causes of corporate and financial distress in Malaysia. These issues notwithstanding, there are meaningful comparisons that can still be drawn. For example, as IMF (2000) notes, Malaysia’s country risk premium remained consistently higher than at least
41 The Philippines has not been included because it had not attracted as much foreign interest before the crisis as the other
East Asian countries. 42 Certainly Malaysia never faced a payments crisis. 43 Thailand, Indonesia and Korea all negotiated IMF/U.S.-rescue packages running into tens of billions of dollars, most of
which is debt that needs to be repaid.

QEH Working Paper Series – QEHWPS113 Page 12
Korea and Thailand44. Thus, one reason why Malaysia didn’t raise more external debt may have been that it ‘couldn’t’, except at an exorbitant cost. This is underscored by the unenthusiastic international response to Malaysia’s 1999 sovereign bond issue (which had to be scaled down many a time to US$ 1mn). Similarly, the sustained return of private capital flows to Malaysia in Q1-2000 (figure 6), lagged (and was less than) that observed in Korea and Thailand (Freemalaysia, 1999). Given that the return of export growth in late-1998/1999 was equally partaken of by all countries in the region, Malaysia’s international balance-of-payments position after the imposition of controls remained similar to KIT’s. Currencies in the entire region rebounded in 1999, regaining much of their lost value and facilitating, in the process, a return to lower interest-rates. KIT bourses recovered as well, reflecting the return of FPI. KLSE’s upturn, by contrast, mostly reflected “purchases by state -controlled institutional funds, investments by nonresidents with funds blocked inside Malaysia, and the improvement in confidence in the region, more generally” (IMF, 2000:53).
But as NEAC (1999) points out and emerges from World Bank (2000), Malaysia was not “racked by riots” like neighbouring Thailand and Indonesia. Employment indicators (figure 10) remained relatively healthy and the social costs of the crisis, as such, were lower. While this might have been because Malaysia’s crisis was milder, to the extent that this was due to authorities’ timely expenditures and anti-deflationary policies, part-enabled by controls, Malaysia can claim the credit for outperforming KIT on this count. There were fears that controls would lead authorities to abuse the breathing space provided, and hence, defer financial reform. Earlier IMF reports (1999a) find evidence of the reverse in Malaysia --reforms were accelerated after controls (p.8). Birchal (1999), however, suggests that BNM’s October-1999 announcement to delay, till December-2000, the deadline for the merger of Malaysia’s 55 financial institutions into six core banking groups confirms the initial fears45. This is all the more important considering that restructuring has been relatively swift in both Thailand and Korea. However, at least two issues must be addressed before a final word in the matter can be given. First, it is not unlikely, at least in theory, that by procuring a stop to the decline in financial sector health, controls may have reduced the requisite size (and exigency) of reform46. Second, the mere speed or quantity of reform-measures is not necessarily the best indicator of their quality . Indeed, IMF (1999a) expressed fears that an excessively hasty restructuring effort might cause Danaharta to become a ‘reservoir of bad debts’ and a potential source of ‘fiscal overhang’. Moreover, building consensus among business groups, and spreading-over-time the social costs (job losses etc.) associated with mergers and closures, are likely to enhance the long-run viability and success of financial reform. Since these were cited as the two major concerns driving the October-1999 announcement by BNM, it makes sense to wait and see how Malaysia’s reforms fare vis-a-vis reforms in KIT in the longer-run. As in the case above, only time will reveal the significance of the costs of lost investor credibility incurred by Malaysia. No matter how you look at them, outflow controls contain an element of expropriation. This is true for Malaysia’s controls as well. In fact, a large part of the nonresident funds actually blocked by the September-measures is likely to have belonged to ‘loyal’ investors who had ridden out the storm (Freemalaysia, 1999). Moreover, since the exit levy of 10% (since September-1999) applies to FPI profits in general (even if remitted after 12 months), some marginal genuine portfolio investors would also be discouraged. These costs were partly reflected in the dismal FDI/FPI flows to Malaysia throughout 1999. At how big a disadvantage this puts Malaysia vis-a-vis KIT specifically, and emerging markets in general, is a question only time can answer. Malaysia’s record of keeping its word regarding the duration of controls (both in 1994 and 1998-99) may, nonetheless, limit these credibility losses (Mohammad, 1998).
44 The political turmoil surrounding Indonesia has ensured a consistently higher premium therefor since early 1998. 45 The earlier deadline was April-2000. 46 This is discussed in detail towards the end of 3.3.

QEH Working Paper Series – QEHWPS113 Page 13
3.2 Benchmark ‘B’: Analysts’ Forecasts at the Time of Imposition Global analysts’ reaction to controls was briefly mentioned in 2.1. Rating agencies’ downgrades were predicated on fears that the measures would undermine commitment to openness in trade and foreign investment, which had been a key driver of Malaysia’s earlier success. The Economist Intelligence Unit (EIU) forecast for Malaysia (1999) expected controls to be ‘tested’ by mounting depreciative pressures on the ringgit and the incentive for ‘circumvention’ (through import-overinvoicing) created thereby. Protracted recession, export contraction and financial sector distress were also predicted. The forecast “assumed that the impact of easier fiscal and monetary policies would be limited” (p.32). Ex-post none of it came true. Malaysia’s GDP rebounded in mid-1999 (figure 16), exports boomed since February-1999 and the ringgit came under appreciative, not depreciative pressure. SSB (2000) estimates that by end-1999, the ringgit was 10% undervalued compared with its ‘equilibrium’ level. By EIU standards, then, as by those of most forecasters, it is difficult to characterise controls as a “failure”47. The main advantage of an evaluation of controls based on analysts’ forecasts for Malaysia, is that it avoids the conceptual snag of choosing a counterfactual based on conditions outside Malaysia (as in A). It must be noted, however, that like their collective failure to predict the crisis in the region, most forecasters couldn’t prophesy a V-shaped recovery in East Asia either. As such, therefore, 1999-forecasts for the region, in general, were gloomy. In such a situation, therefore, it might be best to evaluate controls relative to the objectives authorities set for them. 3.3 Benchmark ‘C’: Performance Vs. Intended Objectives This benchmark permits a sequential study of the economic impact of various structural modifications to controls (especially, the ‘market-based’ February-1999 measures). Conveniently, this would also subsume a cross-period comparison (of pre- and post-controls Malaysia) given that the objectives were set in view of the situation prevailing at the time of imposition. The main shortcoming of this approach (but not unique to it) is its inability to trace causality of effects back to controls (IMF, 2000). This is because of the way objectives are often set for controls--i.e., almost always through macroeconomic targets. Since a host of factors affect the macroeconomy, the mere achievement of targets does not imply, ipso facto, that controls were the cause therefor. I have attempted to tackle the problem in two ways. First, through a visual examination of the macroeconomic trends (in the figures attached), I briefly study if the relevant dates (September-1999--referred to as C1, and February-1999--referred to as C2) represent turning points for the relevant variables. C1 and C2 have been taken separately to account for the possibility of the latters’ ‘market-orientation’ positively impacting investor confidence, as suggested by IMF (2000). If this were indeed true, and assuming controls were effective, then at least for some recovery variables (production activity, FDI, for instance), one might expect C2 to be more likely to be a turning point than C1. Second, in section 4, I enrich the same approach with financial econometric techniques to study the impact of controls on two more complicated variables: interest-rate and stock market volatilities. We begin, then, by formally listing the stated objectives of controls, most of which were discussed in 248.
1. To allow low interest rates to be sustained (monetary autonomy), and contain ringgit speculation, by preventing excessive cross-border flows of short-term capital
2. To preserve the gains made in terms of strengthening the balance-of-payments position and containing inflation so as to ensure a positive environment for economic recovery
47 See Krugman (1999) in support of this view. 48 The list has been derived from Mohammad (1998) and BNM press releases posted on www.bnm.gov.my.

QEH Working Paper Series – QEHWPS113 Page 14
3. To provide some breathing space so as to ensure smooth completion, not substitution, of ongoing structural adjustment measures, in particular, those aimed at recapitalising the financial sector and cleaning up/ restructuring bad debts
4. To insulate Malaysia’s financial markets from the turbulence (and potential contagion therefrom) characterising global financial markets--controls were deemed ‘necessary in the absence of concrete measures to reform the international financial architecture’
Of these, (1) seems to have been largely achieved. By breaking the arbitrage link, C1 helped sustain the aggressive pre- and post-controls interest-rate cuts by BNM (figure 1 & Appendix 4B). The currency peg that was introduced contemporaneously with controls was also quite comfortably sustained, despite initial widespread pessimism regarding successful defence thereof (EIU, 1999). There was no immediate discernable impact of C1 on economic recovery (2), though, as the trends in GDP-growth (figure 16) indicate. By contrast, C2 does seem to represent a favourable turning point at least for production activity (figure 11) and producer inflation (figure 9). At least the former reinforces the view expressed earlier regarding C2’s positive effect on investor confidence. The build-up of reserves that had started in Q2-1998 was noticeably accelerated after C1 (figure 5). Given that the direct positive effect of C1 on net FPI was small, and on FDI only temporary (figures 3 & 4), causality between controls and reserves is somewhat problematic. As BNM (1998) argues, fresh FDI inflows, despite being exempted from controls, remained weak due to the administrative/reporting complexity they implied. Reserves, then, might have been largely responding to the pickup in exports that coincided with C1 and C2 (figure 7) 49. The causality link between exports and controls, though obscure, may have existed ‘via imports’, since Malaysia’s exports depend critically on imported components (OECF, 1999). March-1999, the month following C2, is a clear turning point for industrial imports (figure 11). To the extent that C2 positively impacted producer confidence (figure 11, and as mentioned above), which in turn boosted the imports required for exports, an argument in favour of C2 might be possible. The issue of controls causing financial reform (3) to be deferred was raised in 3.1. What remains to be seen is whether controls could have possibly contributed to improving financial sector health. We look at two indicators of the latter: NONPERFORMING LOANS Though an unambiguous reversal in the NPLs/total loans ratio does not come till February-2000, nontrivial improvements can be detected as early as November-1998, barely two months after C1. There could have been many reasons for this: reversal of prices in asset markets (as discussed in 2.2. and elaborated below) to which many loans had been made; the increasing momentum of restructuring efforts by Danaharta and, indeed, the low interest-rates facilitated by controls which prevented highly-leveraged corporates from going bankrupt. However, insofar as low interest-rates boosted asset prices and reduced the costs of servicing the debt issued to fund Danaharta50, the former might have driven the latter two. Indeed, Standard and Poor, in their 1999 upgrading of Malaysia’s credit outlook, noted that had it not been for the sharp interest-rate cuts in the three-months on either side of C1, NPLs/total loans could have risen above 30% on a three-month basis. BANK CAPITALISATION Low interest-rates also reduced the costs of funding Danamodal51--the recapitalisation agency. As for NPLs, however, rising asset-prices may have also helped the cause of capital adequacy. Visual evidence corroborates this view rather strongly, at least for the stock market. After the 13.3% on-impact decline in the KLSE CI, the latter rebounded to 445 by 7-Sep-1998, a rise over 1-Sep-1998 of 49 The rise in export revenues, at least in September-1998, may have been due to the J-curve effect of the ringgit being
pegged at an appreciated level (OECF, 1999). However, this argument partly backfires because it would suggest a
corresponding decline in imports as well. This clearly does not happen in September-1998. 50 In a way, therefore, this militated against the higher interest-rates (than KIT) that controls may have caused Malaysia to
face in international capital markets as pointed out by figure 19. 51 The government had planned to issue RM 10 bn worth of deep-discounted bonds for this purpose.

QEH Working Paper Series – QEHWPS113 Page 15
70%52 (figure 1). Thereafter the index has followed a steady upward trend leaving 1-Sep-1998 as the incontrovertible ‘tip’ in Malaysia’s ‘V’-shaped crisis and recovery. The fact that exactly the same is true for risk-weighted capital (figure 12), which bottoms out in August-1998, indicates possibly strong cross-benefits of rising asset prices for financial sector health. To complete the qualitative evaluation of Malaysia’s controls, we need to address two final, but important, sets of issues: efficiency and effectiveness. 3.4 The Efficiency Concerns If markets price assets fairly, any attempt to alter those prices raises questions of efficiency. It is, thus, that OECF (1999) expresses concerns over the justifiability of Malaysian authorities’ “manipulation” of different prices (stock, property and exchange rate) through controls. The answer ultimately depends on whether one believes markets behaved inefficiently during the East Asian crisis, and, if they did, were controls the best response before authorities. Earlier, in the case of Chile, we saw how unrestricted capital flows had raised concerns of exchange rate appreciation and asset-price inflation, in excess of levels warranted by ‘equilibrium factors or fundamentals’. A similar ‘bubble’ is now known to have developed in pre-crisis East Asia as well. IMF (1998:30) described the appropriate government response for that situation:
“To the extent that the problem is information asymmetries that are intrinsic to the operation of financial markets, that cannot realistically be removed, and that give rise to significant systemic risks, an argument exists for the permanent application of policies designed to influence the volume of certain types of financial transactions”.
In a way, this is an argument for using controls to “manipulate” prices downwards to their fair level. The reverse situation can also arise. Crises that have an element of panic in them often leave assets priced far below their fair and long-run values. Ex-post this certainly seems true for East Asia, where asset prices fell to historic lows, before rebounding quickly to their pre-crisis levels. Insofar as it was true for Malaysia, one could also make a case for “manipulating” prices upwards to their fair level. But authorities’ first attempt at doing so preceded the September-1998 measures. In October-1997 controls on nonresident ownership of Malaysian property were relaxed in a bid to lift property prices53. It is, indeed, surprising why these two apparently similar capital control measures evoked such different responses from the international community. Another way to determine if authorities’ “price-manipulation” was efficient is by directly analysing foreign investors’ reaction thereto. Figure 6 reveals that there were significant net-FPI outflows from late-August/199954 till early-October/1999, suggesting that investors might have considered Malaysian securities to be over-valued. However, the cumulative outflows (peaking at RM -4.5 bn in Janurary-2000) seem small when compared with Malaysia’s forex reserves (averaging RM 115 bn in 1999). More importantly, the outflows were rather temporary, reversing noticeably in Q1-2000. A similar pattern is found around the February-1999 relaxation as well. Had equity-prices been way
52 IMF (2000) points out that this was due less to a return of confidence and more to investments by ‘trapped nonresident’ funds. However, this criticism would have been more valid if the stock market (and bank capital) had declined once controls
were lifted. Since that did not happen, one can argue that the improvements in asset prices and financial sector health were
not just artificial or cosmetic. 53 See Appendix 4A. 54 IMF (2000) hints at the possible rationale for investors exiting ‘before’ September-1999 when the one-year holding
requirement (to become eligible for tax exemption) would be fulfilled for funds blocked since September-1998. The argument might be that investors expected the stock market to take a major fall on 1-September-1999. To the extent that the
capital losses arising therefrom were expected to exceed the ‘exit levy’, it made sense to repatriate funds before 1-
September-1999.

QEH Working Paper Series – QEHWPS113 Page 16
above their fair levels , the unequivocal upward trend therein would have been affected more severely by the relaxations. It, thus, seems difficult to criticise controls on efficiency grounds. There is a possibility, however, that the portfolio inflows since Jan-2000 represented a return of those funds that had been driven away by the tax, and its associated complications, per se. With the abolition of the two-tier regime, and a reduction in the levy for short-term flows, on 21-Sep-1999, this impediment was removed. Appell (1999) reports, for example, that the two-tier system caused “horrendous” difficulties for foreign fund managers trying to keep track of their funds’ net-asset-values. One is tempted to question the validity of this argument, though, considering many of these fund managers have long faced a similar two-tier capital-gains tax regime in the U.S. Whatever the specific reason, however, it does appear that investors were rather quick to forget, if not forgive, Malaysia’s temporary experiment with exchange controls. On 5-November-1999, barely two-months after the September-1999 relaxation, and despite the remaining 10% levy, the International Finance Corporation re-included Malaysia into its emerging market index. At the time of writing this report, Malaysia was also scheduled to be reinstated in the MSCI emerging market index in late May-200055. 3.5 Effectiveness of Malaysian Controls One argument against invoking outflow controls in crisis as against inflow controls in booms, is that the former are notoriously difficult to enforce (Edwards, 1999a). Any evaluation of Malaysia’s controls without addressing their effectiveness would be incomplete. IMF (2000) describes Malaysia’s controls as “effective”, with little evidence of the development of traditional channels for evasion: trade misinvoicing, illegal forex market or nondeliverable forward market. Morgan Stanley (199956) suggest this largely was due to the ringgit’s undervaluation relative to regional currencies, which made circumvention less attractive. Even in the initial months after September-1998, however, when the ringgit’s undervaluation was not obvious, illegal financial transactions were found limited due to the unavailability of willing onshore counter-parties (IMF, 2000). The above implies that domestic agents firmly complied with the regulations. Why? One popular reason is that Malaysia, like Chile, is a country of law-abiding citizens. The second more compelling argument is that the incentive to cheat was limited (IMF, 2000). Growth in black market activity in the cash market, for e.g., halted once participants realised that authorities had adequate forex reserves to meet their needs. This has the important implication that controls are effective only if agents believe that imposing authorities can successfully defend their policies (the peg in this case). The fact that in the absence of this important prerequisite, controls might not be a suitable option, is a point that countries contemplating exchange controls in future, should carefully note. Closely related to the above is also the issue of timing. As discussed in 2.3, Malaysia has been ex-post criticised for imposing controls at a time when the situation had already stabilised. One wonders, however, if an earlier imposition would have been as sustainable and effective, given that in times of panic, agents’ expectations of authorities’ ability to weather the storm are rather low. Indeed, as IMF (1999a) notes Malaysia’s relatively strong macro-fundamentals in September-1998 and the acceleration of financial reform efforts thereafter played an important part in sustaining the credibility of controls and, therefore, in keeping them effective. As mentioned in 2.1.2, the distinction between ‘preventive’ and ‘curative’ controls (a la Krugman) is an important one--the former being almost impossible to enforce (as suggested by Latin America’s experience therewith during its debt-crisis). Thus, to the extent that the delay, till September-1998, helped push Malaysian controls into the latter category, the timing thereof may have been just right from the effectiveness standpoint.
55 Unofficial analyst forecasts suggest that the reinstatement will produce a fresh inflow of around RM 20 bn. 56 Cited in IMF (2000).

QEH Working Paper Series – QEHWPS113 Page 17
Also, the need to make controls wide-ranging (as in Chile) cannot be understated. IMF (1999a:8) notes that the effective closing of CLOB, amendment of the Companies Act to limit distribution of dividends, and demonetisation of large-denominations ringgit notes, all helped plug potential loopholes--thereby contributing to regime-effectiveness. This was coupled with both a strict implementation of regulations by BNM, and timely dissemination of information regarding the rules to provide greater transparency and understanding of the measures. As IMF (2000) notes, the exit-levy system and the reporting requirements instituted since September-1998 implied significant administrative costs for BNM and all other parties involved. While these costs are difficult to quantify, some part thereof might have been financed by controls themselves. Though the exact tax-revenue figures are not available, rough computations (based on net-FPI outflows) suggest an amount well over RM 1billion for the year-ending March-2000.
4. VOLATILITY IN MALAYSIA’S FINANCIAL MARKETS: DID CONTROLS HELP? Malaysia was not spared the financial market turmoil caused by the East Asian crisis. As emerges from figures 1 and 2, stock prices and interest-rates, both witnessed huge fluctuations in the two-years following July-1997. The Russian financial collapse beginning in May-1998 and surfacing fully in August-1998, and the fall of the Brazilian real in early-1999 testified to the global nature of the panic that hit East Asia. Contagion effects between seemingly dissimilar economies suggested that no country could expect to be fully shielded from the meltdown. Yet the relatively clean escape of China and India from the region’s problems, despite being situated in the heart of Asia, implied that vulnerability was not a given. Countries could guard against international volatility through retrained integration into international markets. More importantly, it implied that fundamentals, as defined by economic orthodoxy, were not the differential factor distinguishing crisis-countries from non-crisis ones. The quest for that differential determinant, arguably, led Malaysia into imposing exchange restrictions in September-1998 (Krugman’s, 1998 Plan B for East Asia). In authorities’ own words, controls were expected to “insulate Malaysia from contagion developments in the global markets” (Mohammad, 1998:164). Particularly, the measures were imposed at a time (in the immediate aftermath of the Russian crisis), when there was more uncertainty than ever, over how protracted and wide-ranging the global financial crisis would be. This, however, did not make clear, if authorities aimed to contain volatility, per se, in Malaysia’s financia l markets, or the downward slide therein. Earlier discussion indicated that the latter was indeed reversed to some extent by controls. But nothing has been established regarding their effect on the former. As is well-established, volatility can hurt investment by increasing the uncertainty surrounding returns, and as such, the ‘option value of waiting’ (Dixit and Pindyck, 1994). Thus, any controls-induced stability can have significant positive spillovers for investment and growth for the imposing country. Secondly, insofar as panic is more likely to be triggered during periods of high volatility, a reduction in the international sources thereof can represent a gain for the global financial system as a whole. By reducing volatility within their own borders, individual countries can, therefore, contribute to a reduction in volatility without as well. As such, this suggests, the need for approaching the issue more formally than has been done so far. 4.1 Estimating Interest-Rate and Stock-Market Volatility in Malaysia Interest-rates and stock prices respond very fast to external shocks, as evinced by the sharp adjustments therein after the Thai baht devaluation in July-1997 (see figures 1 and 2). Suitable measures of variation, like daily or weekly standard deviation, in these variables are therefore likely to be reflective of the overall volatility in Malaysia’s financial markets. To obtain these, I employ a GARCH57 framework which has become standard for volatility modeling in financial economics58. The following three steps were involved. 57 Generalised Autoregressive Conditional Heteroskedasticity. 58 Outlined in Campbell et.al (1997).
QEH Working Paper Series – QEHWPS113 Page 18
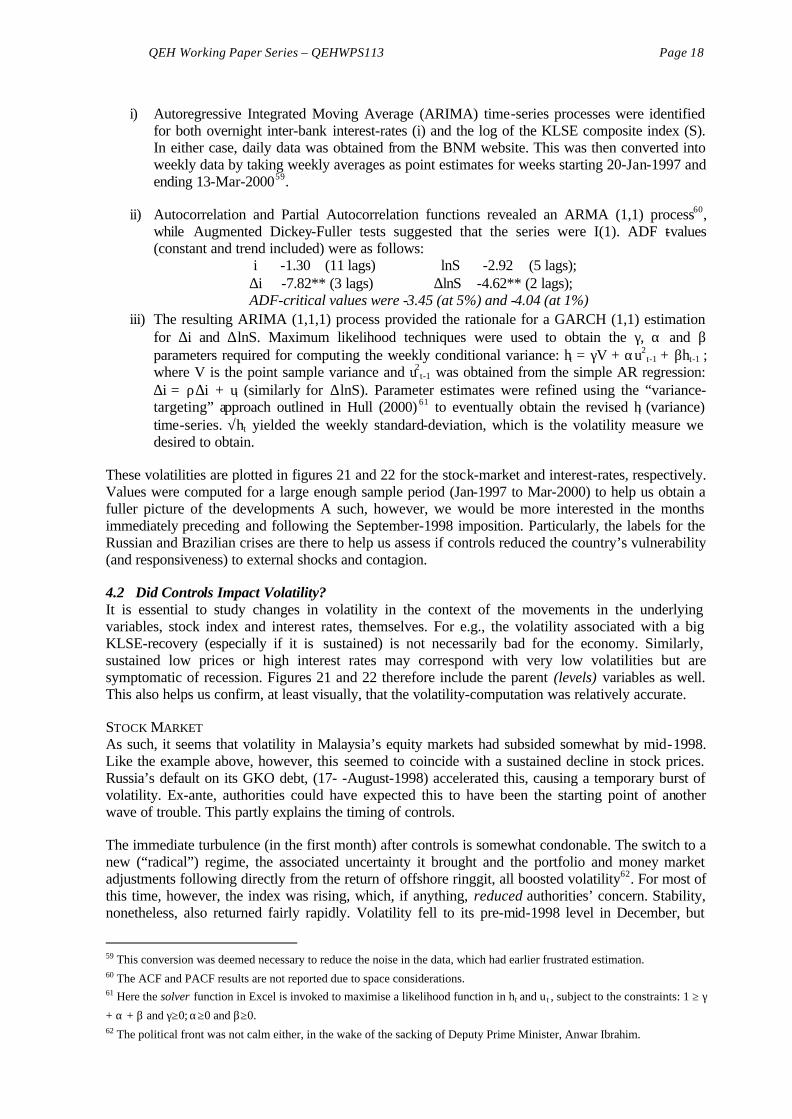
i) Autoregressive Integrated Moving Average (ARIMA) time-series processes were identified
for both overnight inter-bank interest-rates (i) and the log of the KLSE composite index (S). In either case, daily data was obtained from the BNM website. This was then converted into weekly data by taking weekly averages as point estimates for weeks starting 20-Jan-1997 and ending 13-Mar-200059.
ii) Autocorrelation and Partial Autocorrelation functions revealed an ARMA (1,1) process60,
while Augmented Dickey-Fuller tests suggested that the series were I(1). ADF t-values (constant and trend included) were as follows:
i -1.30 (11 lags) lnS -2.92 (5 lags); ∆i -7.82** (3 lags) ∆lnS -4.62** (2 lags); ADF-critical values were -3.45 (at 5%) and -4.04 (at 1%)
iii) The resulting ARIMA (1,1,1) process provided the rationale for a GARCH (1,1) estimation for ∆i and ∆lnS. Maximum likelihood techniques were used to obtain the γ, α and β parameters required for computing the weekly conditional variance: ht = γV + αu2
t-1 + βht-1 ; where V is the point sample variance and u2
t-1 was obtained from the simple AR regression: ∆i = ρ∆i + ut (similarly for ∆lnS). Parameter estimates were refined using the “variance-targeting” approach outlined in Hull (2000) 61 to eventually obtain the revised ht (variance) time-series. √ht yielded the weekly standard-deviation, which is the volatility measure we desired to obtain.
These volatilities are plotted in figures 21 and 22 for the stock-market and interest-rates, respectively. Values were computed for a large enough sample period (Jan-1997 to Mar-2000) to help us obtain a fuller picture of the developments A such, however, we would be more interested in the months immediately preceding and following the September-1998 imposition. Particularly, the labels for the Russian and Brazilian crises are there to help us assess if controls reduced the country’s vulnerability (and responsiveness) to external shocks and contagion. 4.2 Did Controls Impact Volatility? It is essential to study changes in volatility in the context of the movements in the underlying variables, stock index and interest rates, themselves. For e.g., the volatility associated with a big KLSE-recovery (especially if it is sustained) is not necessarily bad for the economy. Similarly, sustained low prices or high interest rates may correspond with very low volatilities but are symptomatic of recession. Figures 21 and 22 therefore include the parent (levels) variables as well. This also helps us confirm, at least visually, that the volatility-computation was relatively accurate. STOCK MARKET As such, it seems that volatility in Malaysia’s equity markets had subsided somewhat by mid-1998. Like the example above, however, this seemed to coincide with a sustained decline in stock prices. Russia’s default on its GKO debt, (17- -August-1998) accelerated this, causing a temporary burst of volatility. Ex-ante, authorities could have expected this to have been the starting point of another wave of trouble. This partly explains the timing of controls. The immediate turbulence (in the first month) after controls is somewhat condonable. The switch to a new (“radical”) regime, the associated uncertainty it brought and the portfolio and money market adjustments following directly from the return of offshore ringgit, all boosted volatility62. For most of this time, however, the index was rising, which, if anything, reduced authorities’ concern. Stability, nonetheless, also returned fairly rapidly. Volatility fell to its pre-mid-1998 level in December, but
59 This conversion was deemed necessary to reduce the noise in the data, which had earlier frustrated estimation. 60 The ACF and PACF results are not reported due to space considerations. 61 Here the solver function in Excel is invoked to maximise a likelihood function in ht and u t , subject to the constraints: 1 ≥ γ
+ α + β and γ≥0; α≥0 and β≥0. 62 The political front was not calm either, in the wake of the sacking of Deputy Prime Minister, Anwar Ibrahim.

QEH Working Paper Series – QEHWPS113 Page 19
with the rise in index, possibly suggesting the move to a new improved equilibrium. Crucial to note is that the latter was not disturbed at all by the Brazilian devaluation (15-February-1999) , which was perhaps more relevant for Malaysia (as an emerging market) than was the Russia crisis. This differential response of markets to two major contagion events suggests that controls did help insulate Malaysia’s stability from international turmoil. Indeed, Mohammad (1999) cited this controls-enabled stability as the reason why authorities could afford to relax controls in February-1999. Still the asymmetric nature of the exit levy was designed to specifically discourage short-term FPI flows and keep volatility risk low. IMF (2000:59) was bearish on the prospects of this being achieved, arguing that “the did not involve any procedures to reduce the buying and selling of shares for ringgit”. This does seem to find support from figure 21. Most of the permanent stability gains were made during September-1998 and February-1999. Nothing much changed for volatility thereafter. The same also holds for the lifting of controls in September-1999 and the subsequent abolition of the graduated levy. The fact that volatility did not increase thereafter, may, however, be partly suggestive of the adequacy of the 10% asymmetric 63 tax that remained. This said, volatility had not return to its pre-crisis levels even by the end of the sample period, possibly suggesting a permanent impact of the crisis on the equilibrium level of stock-market volatility. INTEREST RATES Interest-rate volatility remained markedly low in Malaysia, averaging under 1% over the sample period, barely one-fifth of the corresponding figure for the stock-market. Moreover, unlike their impact on volatility in the latter, controls appear to have remained more neutral towards interest-rate volatility. The latter’s response in the wake of the first signs of Brazil’s problems in late-1998 was similar to the one for the Russian crisis. Nontrivial blips were produced in either case. However, this may have partly been, at least for the Brazilian case, due to the active monetary measures authorities took after imposing controls. In the absence of these measures, the ups and downs might have been less marked. This is probably the reason that the response similarity fails when the January devaluation of the real is considered. Indeed the latter hardly caused a whimper in the money-markets (both in levels and vola tility). What is also important to note is that the major interest-rate cuts surrounding September-1998, were sustained. Volatility did not increase after the new rates had set in, as it should have, had agents regarded the currency peg unsustainable. This ability of authorities to permanently cut interest-rates by half without permanently affecting their volatility, is rather incredible, and as such, might not have been possible had domestic markets not been delinked from international ones. Moreover, for interest-rates, this segmentation function of controls remained most important. Their volatility, therefore, was not affected by either the February, or the September-1999 relaxations. Overall, however, volatility declined to pre-crisis levels by October-1998, indicating, if at all, a favourable effect of the regime per se. The discussion above suggests that Malaysia’s controls did help the financial stability cause, at least on the interest-rate and stock-market volatility criteria. For one, there was evidence of a more lacklustre response of markets to crisis-developments after controls than before. Secondly, controls seem to have allowed the variables in question to move to new improved equilibria both in levels and volatility. Third, the February-1999 measures, contrary to the September-1998 ones, had no impact either on stock-market or interest-rate volatility. However, this is not necessarily an argument against controls, since the February-adjustments were as much a response to the stability gains already made as they were a measure to discourage short-term flows.
5. RECOMMENDATIONS FOR FUTURE RESEARCH The absence of an appropriate counterfactual for Malaysia complicates evaluation of its control-regime. To deal with this, a three-pronged approach was employed in this chapter. First, its was 63 The levy was asymmetric because, like the URR in Chile, it implied a higher annualised tax for short-term repatriations
that for long-term ones.
QEH Working Paper Series – QEHWPS113 Page 20
studied if a policy rationale for controls existed at the particular time they were imposed. Contrary to popular opinion, discussion revealed that it did, especially, since ex-ante evidence of Malaysia “having turned the corner” by August-1998, was not compelling. Second, using different comparison benchmarks--Malaysia vs. the other affected economies, Malaysia vs. analysts’ ex-ante forecasts, and Malaysia vs. itself in the pre-controls period, the utility of the September-1998 measures was reassessed. On either criterion, controls were found to have fared rather well. Vis-a-vis KIT, Malaysia was seen to incur lower social costs and amass less foreign debt. Compared with ex-ante forecasts, Malaysia performed miraculously, though, indeed, this was partly because the region per se rebounded in a way that very few could imagine. Finally, controls were found the unequivocal turning points for key variables, such as stock-market and bank capitalisation. All this, however, was not attained without incurring a substantial initial loss in the country’s international reputation. The latter caused Malaysia’s country-risk to remain consistently higher than that for neighbouring economies, preventing authorities to finance their bank restructuring efforts from external sources. This, coupled with general investor wariness with “controls” to delay the return of voluntary capital to the country till early this year. The lost contact with foreign markets has to be weighed, however, against the benefits of reduced-volatility that controls brought, as suggested by the analysis above. This temporary insulation function of controls cannot be undermined in a world where strong fundamentals are no longer a sufficient guarantee against crisis. This was also probably recognised by foreign investors who, in the end, proved more sympathetic to, or at least more forgiving of, Malaysia’s controls, than was originally anticipated. The lack of attempts at circumventing controls as well as the sustaining of the controls-facilitated improvements in equity markets and interest-rates are testament thereof. However, it is difficult to say with surety that the same would have been true if controls had not been made more market-based and relaxed over time. Indeed, there was evidence of both the February-1999 and September-1999 measures favourably impacting investor confidence and production activity. The world has only begun to assess the efficacy and usefulness of Malaysia’s controls. One can be certain, that over time, as the long-term effects of controls become more apparent, academic attention will turn to Malaysia the way it did to Chile. Though any number of issues can be studied, the one pertaining to volatility is likely to catch more attention than it did earlier. As such, therefore, it is important to point out the improvements that can be made upon the semi-empirical study on volatility undertaken above. The impact on financial volatility is best studied using GARCH regressions as done in Edwards (1999a) for Chile. Using dummies for controls and other events (like the Russian and Brazilian crises, etc.), I applied the same methodology to Malaysia (Jan-1997 to Mar-2000). There were serious problems with normality and specification tests, though, making inference problematic (the reason for nor reporting the regressions here). These problems were not unprecedented, however, given the highly volatile period being modeled and the unavailability of appropriate proxies for most of the explanatory variables. As such, however, the method remains superior to the visual-based approach taken in this paper, and it would be desirable if analysts can pursue it further using better data, and incorporating more information.

QEH Working Paper Series – QEHWPS113 Page 21
6. CONCLUDING NOTE The list of ‘suggested’ prerequisites for countries hoping to avoid crises seems to grow with every new crisis. Even if this were not the case, and the list could be narrowed to a few desirable policies--improving governance and disclosure standards, tightening prudential regulation, cleaning up the financial sector, removing policies (currency pegs, deposit insurance) that create moral hazard etc.--the problem would not be solved. Primarily, because none of these changes can be brought about overnight. The disastrous effects on investor-confidence of rapid bank closures in East Asia (1997) highlight the dangers of moving too fast. Sustainable reform requires both time and thinking, luxuries that modern-day capital flows do not permit. In this context, and given the dismal progress towards reform of the international financial architecture, temporary controls on capital may, thus, represent the only real option before LDCs. However, the indispensability of controls does not automatically imply their desirability in any situation or form. The experience of Malaysia (998-99), depicted in this paper as a relatively successful and effective control-episode, suggests that a lot of thought and commitment on the part of the imposing authorities was required to ensure that agents perceived controls (and the promise to lift them) as credible. In this context, it is particularly important to recognise the limits to what “quantitative” restrictions can achieve in modern times. One of the main reasons why the rent-seeking and confidence-related costs of controls remained low in Malaysia and in countries like Chile was because the measures were market-based in either case. Where they were not, as in Malaysia before February-1999, authorities were quick to realise the benefits of making the regime market-based. Also, the acceleration of financial reforms in Malaysia immediately after the September-imposition, lends credence to the view that the country did not intend to ‘hide behind controls’. It is no surprise, therefore, why investor response to Malaysia rebounded remained much more positive than originally anticipated. Indeed, in a way, both these facts: Malaysia’s preference for a “market-based” control-regime, and its adherence to food financial policies, make the “success” of the exchange control regime a success of the orthodoxy! All that needs to be done is to moderately redefine the term ‘orthodoxy’ to include controls. IMF’s first cautious attempts at this came in 1998 (this has more recently become the formal IMF position).
“If policies are operationalised though the use of taxes that make their effect felt by altering relative prices, rather than through the use of administrative controls, there is no reason why they should be viewed as incompatible with the still-desirable goal of capital account liberalisation” (IMF, 1998:30)
The paper also highlights the importance of distinguishing between traditional and modern controls (see also Abbas, 2003). Most of the financial-repression, dependency-theory rationales for controls have become outdated. This is particularly true for emerging markets, which have, by definition, attainted this status by adopting sound macroeconomic and structural reform policies. These countries have little incentive to turn the clock back and return to the very stage they ‘emerged from’. Yet, ironically, it is not controls, but unfettered capital mobility, that threatens to do precisely that today. By reversing gains made in the social and economic sectors and undermining ongoing reforms, capital flow-induced crises can erode the mass-support for market-based policies in these countries. Indeed, this would constitute a more accurate explanation for Malaysian authorities’ impolite criticism of the “West” in the aftermath of the crisis. Broadly then, this paper suggests that the case against the imposition of exchange controls in times of crisis needs to be made rather than assumed. Small open economies, like LDCs are not in a position to correct distortions inherent in the operation of international financial markets--distortions such as herding and bandwagon effects, as well as moral hazard problems deriving from the existence of international rescuers of last resort. As many eminent economists and individual countries have repeatedly stressed, this is a job for the international financial architects. Merely focusing on the policies internal to the crisis country would not solve the problem. IMF’s high-interest-rate policy prescription for Malaysia in the 1997 East Asian crisis also faced the same criticism, as highlighted in the Malaysian study. Malaysia’s early abandonment of the prescription and adoption of expansionary

QEH Working Paper Series – QEHWPS113 Page 22
policies (which eventually necessitated the September-1998 exchange controls), seemed to have contributed to its relative social prosperity vis-à-vis the other affected economies. More importantly, the country’s emergence from the crisis without an IMF-supported programme suggested that viable alternatives to conventional policies existed, and could be particularly attractive when adoption of the latter entailed huge political and social costs. One reason that the literature presents for not according capital controls this “viable policy alternative status”, relates to the unique problem of enforcing them. Yet, the discussion in this paper suggests that this is not an insurmountable problem, either for outflow controls (Malaysia) or controls imposed for a reasonably long period (Chile) (see Abbas, 2003). Moreover, as Rodrik & Velasco (1999:24) contend, ineffectiveness is not the differential factor between controls and other policies, especially prudential regulation, on which so much stress is laid. In their words, “financial markets that can evade capital controls can surely also evade prudential controls. Regulatory ineffectiveness may undercut the argument for capital controls, but it undercuts even more seriously the emphasis on financial controls that pervades the G-7’s approach to the international financial architecture.”
____________________

QEH Working Paper Series – QEHWPS113 Page 23
APPENDIX A
CAPITAL/EXCHANGE CONTROL M EASURES (JULY 1997 TO SEPTEMBER 1999)
DATE AFFECTED FLOWS
MEASURE MOTIVATION
4-Aug-97 Banking system transactions
Ceiling ($2 million per foreign customer) imposed on banks’ non-commercial related ringgit offer-side swap transactions (i.e., forward order/spot purchases of ringgit by foreign customers). Hedging requirements for foreigners for trade-related and genuine portfolio and FDI investments were excluded
Delink offshore market from its onshore counterpart and reduce upward pressures on domestic interest-rates
28-Aug-97 Stock market transactions
Short -selling of listed KLSE securities banned Limit speculative pressures on stock prices and ringgit
Oct -97 Real estate transactions
Quota on sales to foreigners of high-end condominiums raised from 30 to 50%; foreigners allowed to acquire two condominium -units (compared with one earlier)
Reduce impending supply in the high-end of the property market
1-Sep-98 Offshore ringgit market
transactions
1. All ringgit held offshore required to be repatriated by 1-Oct-98; licensed offshore banks prohibited from ringgit trading; approval required for fund-transfers between external accounts
2. Limit introduced on exports/imports of ringgit by travelers (starting 10-Oct -98) 3. Residents prohibited from granting rin ggit credit facilities to nonresident corresponding
banks and stockbroking companies 4. Residents prohibited from obtaining ringgit credit facilities from nonresidents 5. Requirement on imports and exports to be settled in foreign currency 6. Malaysian banks prohibited from conducting transactions in offer-side swaps with
nonresident banks and from engaging in reverse repo transactions collateralised by ringgit instruments with nonresident banks
7. All purchases/sales of ringgit financial assets required to be transacted through authorised depository institutions; trading in Malaysian shares on Singapore’s Central Limit Order book (CLOB) over-the-counter market became de facto prohibited as a result of a strict enforcement of the existing law requiring Malaysian shares to be registered in KLSE and other authorised trades prior to trade
Eliminate the ofshore ringgit market and restrict supply of ringgit to speculators that can be used to take positions against the ringgit
1-Sep-98 Portfolio investments
1. Approval requirement introduced for nonresidents to convert ringgit held in external accounts into foreign currency, except for purchases of ringgit assets
2. 12-month waiting period (from 1-Sep-98 or date of entry of funds, whichever is later) for nonresidents to convert ringgit proceeds from sale of Malaysian securities held in external accounts (FDI, repatriation of interest, dividends, fees, commissions, and rental income from portfolio investment excluded)
3. Approval requirement beyond a certain limit for all residents t o invest abroad in any form 4. Limits on forex exports by residents; and up to the amount brought into Malaysia for
nonresidents
Check heavy capital outflows by residents and nonresidents
15-Feb-99 (announced 4-Feb-99)
-do- The 12-month holding period for repatriation of portfolio capital was replaced with: 1. A graduated system of exit levy on repatriation of the principal of capital investments (in
shares, bonds, and other financial instruments, except property investments) made prior to 15-Feb-99, with the levy decreasing in the duration of the investment (30% if repatriated in less than 7 months after date of entry (or 1-Sep-98) whichever comes later; 20% if in 7-9 months, and 10% if in 9-12 months); no levy on principal if repatriated after 12 months and no levy on profits, interest, dividend or rental income
2. A graduated exit levy on the repatriation of profits from investments made after 15-Feb-99 in shares, bonds, and other financial instruments, except property investments, with the levy decreasing in t he duration of the investment (30% if repatriated before 12 months and 10% if repatriated after 12 months)
Encourage existing portfolio investors to take a longer-term view of their investments in Malaysia, attract new funds to the country, discourage destabilising short -term flows, and allow for a smoother outflow of funds
18-Feb-99 & 5-Apr-99
-do- Repatriation of funds related to investments in immovable property and MESDAQ (where growth and technology shares are listed) exempted from the exit levy
Exclude from the controls certain types of investments that are either difficult to liquidate or resemble FDI
1-Mar-99 Ringgit transactions
Ceiling on the import and export of ringgit for border trade with Thailand raised Facilitate trade transactions
1-Sep-99 Portfolio investments
The 12-month holding period for funds that had entered Malaysia before 1-Sep-98 expires; funds blocked by controls allowed to leave Malaysia
Authorities keep their word of not extending holding period beyond 12 months indicating t hat controls are a temporary feature only
21-Sep-99 -do- The graduated exit levy is consolidated into one rate (10%) for all repatriations irrespective of maturity
Simplify/reduce tax on capital outfows so as to encourage more inflows
Source: Adapted from IMF (1999a/b; 2000)


QEH Working Paper Series – QEHWPS113 Page 25
APPENDIX B
THE FOUR PHASES OF GOVERNMENT POLICY (JUL-1997 TO END-1998) 1) “Adjustment” (Sep-Dec 1997)
Ø Monetary and credit policy tightened Ø Interest rates raised Ø 15% upper limit for loan growth through end -1998 set Ø Maximum auto loan ratio reduced from 75 to 70%
Ø Budget announced Ø Standards for ensuring sound management of financial institutions enhanced Ø Sector-wise bad debts disclosed; definition of bad debts tightened Ø Ordinary allowances for bad debts raised from 1 to 1.5%.
Ø Other financial sector measures introduced Ø Announcement of merger of 39 finance companies into 8 Ø Priority lending to production-oriented sectors Ø Requirements relating to disclosure of corporate information enhanced
2) “Stabilisation” (Jan-Apr 98)
Ø Recovery and confidence-building measures Ø Established National Economic Action Council Ø National Economic Recovery Plan drawn up (announced Jan, implemented starting May) Ø Blanket guarantee for all bank deposits announced
Ø Stock market-related measures Ø Foreign ownership of electronics/communications stocks liberalised (to retain capital) Ø Securities brokerage business deregulated Ø Broadened insider trading definition Ø Enhanced information disclosure requirements for listed companies
Ø Monetary policy relaxed and financial sector regulations tightened Ø Reserve ratio reduced from 13.5% to 10% Ø Enhanced regulations to ensure sound management of banks Ø Per borrower limit set at 25% of capital Ø Enhanced disclosure requirements and supervision Ø Raised required net worth for finance cos. (from 8 to 9% by end-1998, and 10% by 1999) Ø Finance companies mergers intitated
3) “Revitalisation” (May-Aug 98)
Ø Financial sector restructuring initiated Ø Danaharta established to purchase bad debts and clean up liabilities Ø Danamodal established to recapitalise financial institutions banks Ø Corporate Debt Restructuring Committee (CDRC)--joint public and private committee to
handle corporate debts Ø Credit and monetary policies eased markedly
Ø Reduced reserve ratio twice (from 10 to 8%, and then to 6%) Ø Expanded allowable variation in daily reserve balance from ± 0.5% to ± 2.0% Ø Basis for using base lending rate changed from KLIBOR to 3mth CB intervention rate Ø Reduced bank interest rate spreads from 4% to 2.5% (to be implemented from Oct) thereby
cutting banks’ margins Ø Reduced BNM intervention rate from 11% to 9.5%. Ø Raised max auto loan to 80% Ø Abolished funding restrictions placed on capital markets
4) “Post-Capital Controls Imposition” (Sep-98 onwards)
Ø Marked relaxation of credit and monetary policies Ø Reserve rate reduced from 6% to 4% Ø BNM intervention rate reduced from 9.5 to 8% Ø Reduced liquid asset ratio for commercial banks from 17% to 15% Ø Low priced housing loans exempted from 20% restriction on real estate loans. Margins for
real estate loans were liberalised regardless of purpose of loan Ø Loan-deposit spread regulation abolished Ø Banks asked to increase loans by at least 8% by end-1998

QEH Working Paper Series – QEHWPS113 Page 26
Ø Expanded credit lines for stocks and unit trusts sold by commercial banks and finance companies (from 15% to 20%)
Ø Measures to improve transparency Ø Required listing of nominee accounts and OTC trading on KLSE and clearance of accounts at
securities exchange Ø Deposit and withdrawal restrictions for shares tightened Ø KLSE starts disclosing daily share price and price-to-book value data for all listed
companies Ø Corporate law revised to protect creditors; a company cannot ask for legal protection without
consent of creditor who owns more than 50% of its debt Ø Vitalisation of insurance industry and priority sectors
Ø All commercial banks, 10 finance companies, and others asked to join the ‘Fund for Small and Medium Scale Industries’
___________________
Source: Adapted from OECF (1999)

QEH Working Paper Series – QEHWPS113 Page 27
FIGURE 1
FIGURE 2
Source: BNM and NEAC
Overnight Inter-Bank Interest Rates (%)
2
4
6
8
10
12
14
16
18
202/
1/97
30/1
/97
5/3/
97
2/4/
97
2/5/
97
2/6/
97
1/7/
97
30/7
/97
3/9/
97
1/10
/97
29/1
0/97
27/1
1/97
29/1
2/97
3/2/
98
4/3/
98
1/4/
98
2/5/
98
2/6/
98
1/7/
98
30/7
/98
27/8
/98
25/9
/98
27/1
0/98
25/1
1/98
23/1
2/98
26/1
/99
1/3/
99
31/3
/99
30/4
/99
1/6/
99
2/7/
99
3/8/
99
3/9/
99
4/10
/99
1/11
/99
2/12
/99
4/1/
00
8/2/
00
10/3
/00
1-month moving average
40.43% on 10-Jul-97
Stock Market Index
200
400
600
800
1000
1200
1400
2/1/
97
1/2/
97
3/3/
97
3/4/
97
3/5/
97
3/6/
97
3/7/
97
2/8/
97
2/9/
97
2/10
/97
2/11
/97
2/12
/97
1/1/
98
1/2/
98
3/3/
98
3/4/
98
3/5/
98
3/6/
98
3/7/
98
2/8/
98
2/9/
98
2/10
/98
2/11
/98
2/12
/98
1/1/
99
1/2/
99
3/3/
99
3/4/
99
3/5/
99
3/6/
99
3/7/
99
2/8/
99
2/9/
99
2/10
/99
2/11
/99
2/12
/99
1/1/
00
1/2/
00
2/3/
00
1-month moving average
KLSE CI
M 2 (RM million)
380,000
390,000
400,000
410,000
420,000
430,000
440,000
3579
6
3582
7
3585
5
3588
6
3591
6
3594
7
3597
7
3600
8
3603
9
3606
9
3610
0
3613
0
3616
1
3619
2
3622
0
3625
1
3628
1
3631
2
3634
2
3637
3
3640
4
3643
4
3646
5
3649
5
3652
6
Market capitalization (RM billion)
100
200
300
400
500
600
700
3579
6
3582
7
3585
5
3588
6
3591
6
3594
7
3597
7
3600
8
3603
9
3606
9
3610
0
3613
0
3616
1
3619
2
3622
0
3625
1
3628
1
3631
2
3634
2
3637
3
3640
4
3643
4
3646
5
3649
5
3652
6
3655
7
3658
6
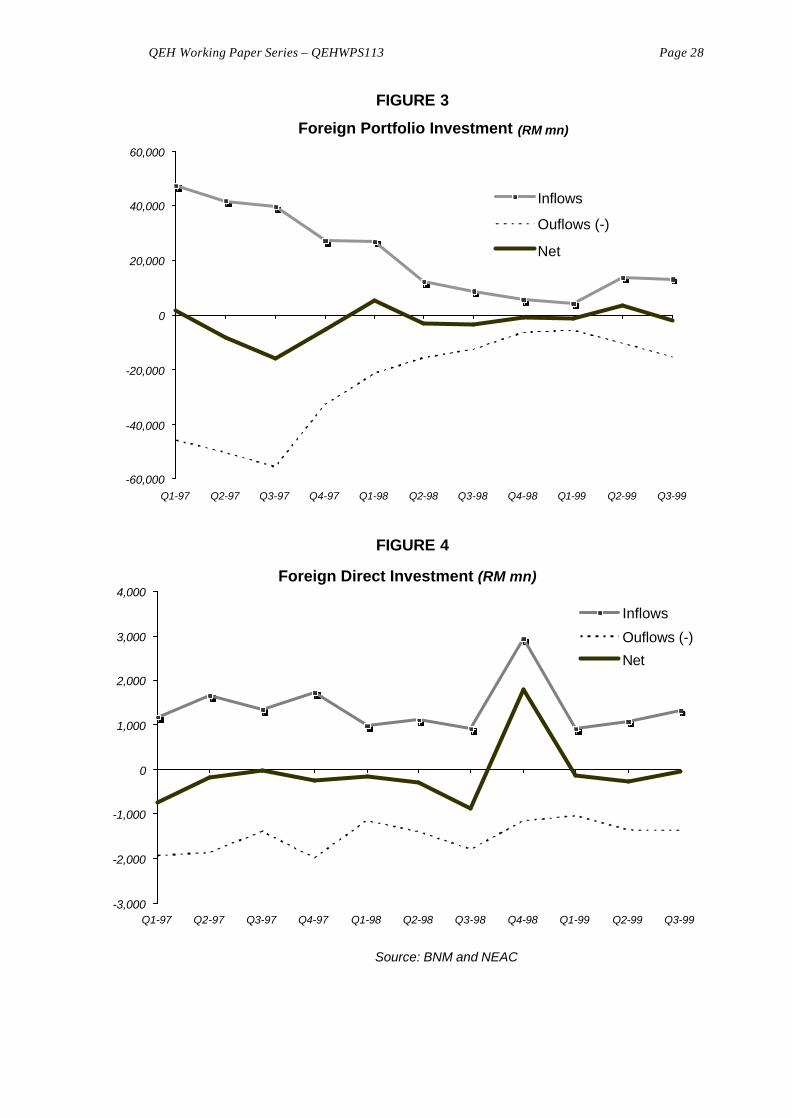
QEH Working Paper Series – QEHWPS113 Page 28
FIGURE 3
FIGURE 4
Source: BNM and NEAC
Foreign Portfolio Investment (RM mn)
-60,000
-40,000
-20,000
0
20,000
40,000
60,000
Q1-97 Q2-97 Q3-97 Q4-97 Q1-98 Q2-98 Q3-98 Q4-98 Q1-99 Q2-99 Q3-99
Inflows
Ouflows (-)
Net
Foreign Direct Investment (RM mn)
-3,000
-2,000
-1,000
0
1,000
2,000
3,000
4,000
Q1-97 Q2-97 Q3-97 Q4-97 Q1-98 Q2-98 Q3-98 Q4-98 Q1-99 Q2-99 Q3-99
Inflows
Ouflows (-)
Net
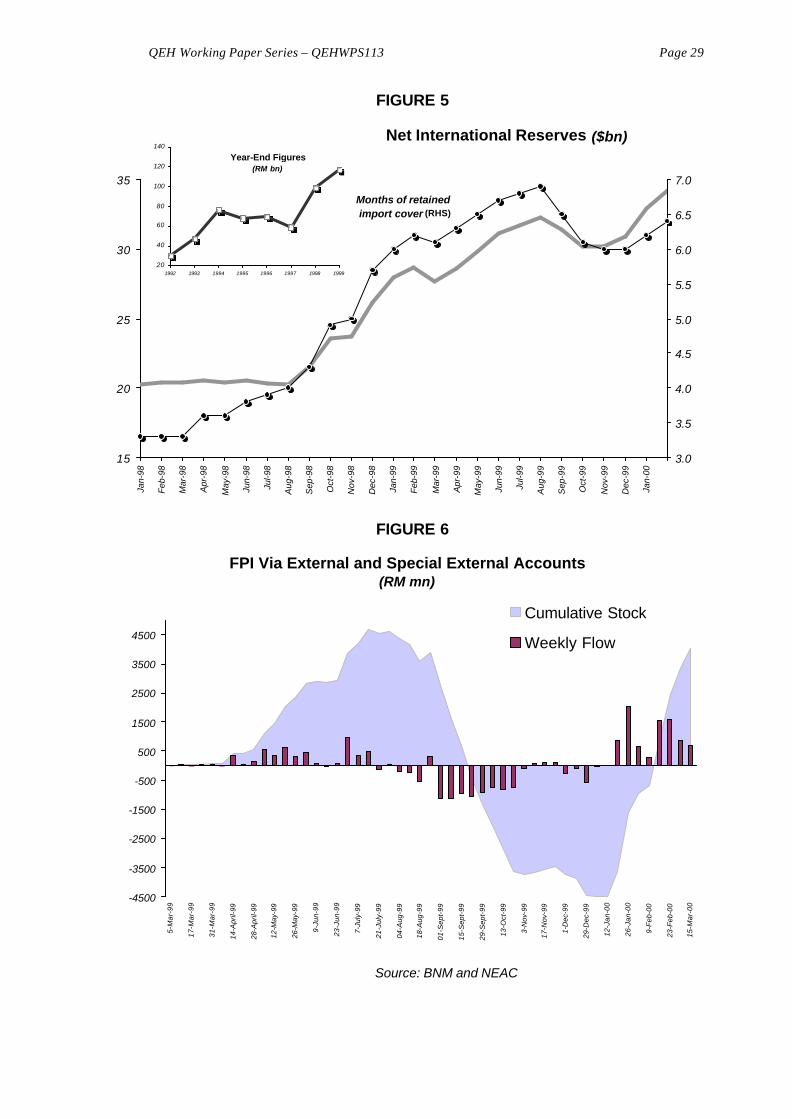
QEH Working Paper Series – QEHWPS113 Page 29
FIGURE 5
FIGURE 6
Source: BNM and NEAC
Net International Reserves ($bn)
15
20
25
30
35
Jan-
98
Feb
-98
Mar
-98
Apr
-98
May
-98
Jun-
98
Jul-9
8
Aug
-98
Sep
-98
Oct
-98
Nov
-98
Dec
-98
Jan-
99
Feb
-99
Mar
-99
Apr
-99
May
-99
Jun-
99
Jul-9
9
Aug
-99
Sep
-99
Oct
-99
Nov
-99
Dec
-99
Jan-
00
Months of retained import cover (RHS)
3.0
3.5
4.0
4.5
5.0
5.5
6.0
6.5
7.0
Year-End Figures (RM bn)
20
40
60
80
100
120
140
1992 1993 1994 1995 1996 1997 1998 1999
FPI Via External and Special External Accounts(RM mn)
-4500
-3500
-2500
-1500
-500
500
1500
2500
3500
4500
5-M
ar-9
9
17-M
ar-9
9
31-M
ar-9
9
14-A
pril-
99
28-A
pril-
99
12-M
ay-9
9
26-M
ay-9
9
9-Ju
n-99
23-J
un-9
9
7-Ju
ly-9
9
21-J
uly-
99
04-A
ug-9
9
18-A
ug-9
9
01-S
ept-
99
15-S
ept-
99
29-S
ept-
99
13-O
ct-9
9
3-N
ov-9
9
17-N
ov-9
9
1-D
ec-9
9
29-D
ec-9
9
12-J
an-0
0
26-J
an-0
0
9-F
eb-0
0
23-F
eb-0
0
15-M
ar-0
0
Cumulative Stock
Weekly Flow

QEH Working Paper Series – QEHWPS113 Page 30
FIGURE 7
FIGURE 8
Source: BNM and NEAC
4,000
5,000
6,000
7,000
8,000
9,000Ja
n/98
Feb/
98
Mar
/98
Apr
/98
May
/98
Jun/
98
Jul/9
8
Aug
/98
Sep
/98
Oct
/98
Nov
/98
Dec
/98
Jan/
99
Feb/
99
Mar
/99
Apr
/99
May
/99
Jun/
99
Jul/9
9
Aug
/99
Sep
/99
Oct
/99
Nov
/99
Dec
/99
Jan/
00
(US$ mn)
500
700
900
1,100
1,300
1,500
1,700
1,900
2,100
2,300
2,500 Exports Imports Trade Balance (RHS)
External Debt
0
5
10
15
20
25
30
35
Q1-
95
Q2-
95
Q3-
95
Q4-
95
Q1-
96
Q2-
96
Q3-
96
Q4-
96
Q1-
97
Q2-
97
Q3-
97
Q4-
97
Q1-
98
Q2-
98
Q3-
98
Q4-
98
Q1-
99
Q2-
99
Q3-
99
60
80
100
120
140
160
180Short-term/Total (%)
Total (RM bn) - RHS

QEH Working Paper Series – QEHWPS113 Page 31
FIGURE 9
FIGURE 10
FIGURE 11
Source: BNM and NEAC
Inflation (% change in index over same
period previous year)
-8
-4
0
4
8
12
16
20Ja
n/98
Feb
/98
Mar
/98
Apr
/98
May
/98
Jun/
98
Jul/9
8
Aug
/98
Sep
/98
Oct
/98
Nov
/98
Dec
/98
Jan/
99
Feb
/99
Mar
/99
Apr
/99
May
/99
Jun/
99
Jul/9
9
Aug
/99
Sep
/99
Oct
/99
Nov
/99
Dec
/99
Jan/
00
0
1
2
3
4
5
6
7PPI (LHS)CPI
0
2
4
6
8
10
12
14
Jan/
98
Feb/
98
Mar
/98
Apr
/98
May
/98
Jun/
98
Jul/9
8
Aug
/98
Sep
/98
Oct
/98
Nov
/98
Dec
/98
Jan/
99
Feb/
99
Mar
/99
Apr
/99
May
/99
Jun/
99
Jul/9
9
Aug
/99
Sep
/99
Oct
/99
Nov
/99
Dec
/99
Jan/
00
(# '000)Retrenchments Job Vacancies
-20
-15
-10
-50
5
1015
20
2530
Jan/
98
Feb/
98
Mar
/98
Apr
/98
May
/98
Jun/
98
Jul/9
8
Aug
/98
Sep
/98
Oct
/98
Nov
/98
Dec
/98
Jan/
99
Feb/
99
Mar
/99
Apr
/99
May
/99
Jun/
99
Jul/9
9
Aug
/99
Sep
/99
Oct
/99
Nov
/99
Dec
/99
Jan/
00
7.0
7.5
8.0
8.5
9.0
9.5
10.0
10.5
11.0Industrial Production Index(% growth yoy) - LHSIndustrial Imports (RM bn)

QEH Working Paper Series – QEHWPS113 Page 32
FIGURE 12
FIGURE 13
Source: National Economic Action Council
Risk-Weighted Capital Ratio (%)
10.0
10.5
11.0
11.5
12.0
12.5
13.0
Jan/
98
Feb/
98
Mar
/98
Apr
/98
May
/98
Jun/
98
Jul/9
8
Aug
/98
Sep
/98
Oct
/98
Nov
/98
Dec
/98
Jan/
99
Feb/
99
Mar
/99
Apr
/99
May
/99
Jun/
99
Jul/9
9
Aug
/99
Sep
/99
Oct
/99
Nov
/99
Dec
/99
NPLs/Total (3 month basis) (%)
4
5
6
7
8
9
10
11
12
13
14
15
Jan/
98
Feb/
98
Mar
/98
Apr
/98
May
/98
Jun/
98
Jul/9
8
Aug
/98
Sep
/98
Oct
/98
Nov
/98
Dec
/98
Jan/
99
Feb/
99
Mar
/99
Apr
/99
May
/99
Jun/
99
Jul/9
9
Aug
/99
Sep
/99
Oct
/99
Nov
/99
Dec
/99

QEH Working Paper Series – QEHWPS113 Page 33
Figure 14a Figure 15
Figure 14b
Figure 16
Figure 14c
Source: Rodrik and Velasco (1999) and NEAC Source: BNM and Saloman Smith Barney (2000) estimates
Short-term External Debt/Reserves
0.0
0.5
1.0
1.5
2.0
2.5
3.0
3.5
1992 1993 1994 1995 1996 1997
Market Capitalisation/GDP (%)
0
50
100
150
200
250
300
1985 1990 1995 1996 1997
Trading Turnover Rate (%)
0
50
100
150
200
250
1985 1990 1995 1996 1997
Malaysia Indonesia
Korea Thailand
Philippines
Sectoral Share of NPLs (%)(3 month basis; as of June 1998)
0
5
10
15
20
25
Con
sum
er C
redi
t
Com
mer
ce
Fina
nce,
Ser
vice
s
Aut
o Lo
ans
Oth
er
Con
stru
ctio
n
Man
ufac
turin
g
Sec
uriti
es P
urch
ases
Hou
sing
/Rea
l Est
ate
-10
-8
-6
-4
-2
0
2
4
6
8
10
Q2-
97
Q3-
97
Q4-
97
Q1-
98
Q2-
98
Q3-
98
Q4-
98
Q1-
99
Q2-
99
Q3-
99
41
42
43
44
45
46
47
48
49
50
51
QoQ Growth (%)
Real GDP (RM bn) - RHS
RGDP(Historical Trend (RMB bn)
100
150
200
250
300
1992
1993
1994
1995
1996
1997
1998
1999
2000
E
2001
E

QEH Working Paper Series – QEHWPS113 Page 34
FIGURE 17 FIGURE 18
FIGURE 19 FIGURE 20
Source: IMF (1999a;b)
Private Sector Credit Growth
0
5
10
15
20
25
30
1992 1993 1994 1995 1996 1997 1998
(12-month % change, end of period)Property Price Index
120
140
160
180
200
220
1992 1993 1994 1995 1996 1997 1998
(1990 = 100)
Sovereign Bond Spreads (bps)
200300
400500
600700
800900
10001100
1200
Apr
/98
May
/98
Jun/
98
Jul/9
8
Aug
/98
Sep
/98
Oct
/98
Nov
/98
Dec
/98
Jan/
99
Feb
/99
Mar
/99
Apr
/99
May
/99
(spread over 10 yr. treasury note)
Exchange Rate
80
100
120
140
160
180Ju
n/97
Aug
/97
Oct
/97
Dec
/97
Feb/
98
Apr
/98
Jun/
98
Aug
/98
Oct
/98
Dec
/98
Feb/
99
Apr
/99
(LCY/FCY, Jun-1997 = 100)

QEH Working Paper Series – QEHWPS113 Page 35
FIGURE 21
Malaysia: Daily Stock Market Volatility(20-Jan-1997 to 13-Mar-2000)
1%
2%
3%
4%
5%
6%
7%
8%
9%
10%
1/97 3/97 4/97 6/97 8/97 9/97 11/97 12/97 2/98 4/98 5/98 7/98 8/98 10/98 12/98 1/99 3/99 5/99 6/99 8/99 9/99 11/99 1/00 2/000
100
200
300
400
500
600
700
800
900
1000
1100
1200
1300
1400
Brazildeval.
Russian Crisis
KLSE CI (RHS)

QEH Working Paper Series – QEHWPS113 Page 36
FIGURE 22
Malaysia: Daily Interest Rate Volatility(20-Jan-1997 to 13-Mar-2000)
0.0%
0.5%
1.0%
1.5%
2.0%
2.5%
3.0%
3.5%
4.0%
4.5%
5.0%
1/97 3/97 4/97 5/97 7/97 8/97 9/97 11/97 12/97 2/98 3/98 4/98 6/98 7/98 8/98 10/98 11/98 1/99 2/99 3/99 5/99 6/99 8/99 9/99 10/99 12/99 1/00 2/00
Brazildeval
0%
1%
2%
3%
4%
5%
6%
7%
8%
9%
10%
11%
12%
13%
14%
Russian Crisis
(8.5%) 18-Jul-97
Crisis
Weekly Interest Rates (RHS)

QEH Working Paper Series – QEHWPS113 Page 37
BIBIOGRAPHY
Abbas, S.M.A. (2003) “Reassessing the costs and benefits of Chile’s inflow controls (1991-98)”, forthcoming, Latin American Business Review Appell, D. (1999) “Malaysia Simplifies Tax for Foreign Share Investors”, Asian Wall Street Journal, New York, September 22 Auerback & Smith (1998) “Its One world, Ready or Not? But Some Are Not”, International Herald Tribune, September 9 Bank Negara Malaysia (1998) Annual Report 1998 Birchal, J. (1999) “Malaysia: Bank Reform in Doubt”, http://www.ft.com/nbearchive/email-bfq28b742.htm Campbell, Lo and MacKinlay (1997) The Econometrics of Financial Markets, Princeton University Press Claessens, Djankov and Lang (1998) Corporate Diversification in East Asia: The Role of Ultimate Ownership and Group Affiliation”, Policy Research Working Paper No. 2089, World Bank, Washington Dixit and Pindyck (1994) Investment Under Uncertainty, Princeton University Press Economist Intelligence Unit (1999) Global Economics: World Outlook 1999, The Economist, London Edwards, S. (1999a) “How Effective are Capital Controls”, NBER Working Paper 7413, National Bureau of Economic Research, Massachusetts Freemalaysia (1999) “Do We Need Controls?”, www.freemalaysia.com, January 11 Hull, J. (2000) “Estimating Volatilities and Correlations”, Chapter 15 in Options, Futures and Other Derivatives, (4th Edition) IMF (1998) “Capital Account Liberalisation: Theoretical and Practical Aspects”, IMF Occasional Paper 172, Prepared by: Eichengreen and Mussa with Dell’ Ariccia, Detragiache, Milesi-Ferretti and Tweedle, International Monetary Fund, Washington, D.C. ____ (1999a) “Malaysia: Selected Issues”, IMF Staff Country Reports 99/86, IMF, Washington, August, ____ (1999b) “Financial Sector Crisis and Restructuring: Lessons from Asia”, IMF Occasional paper 188, Prepared by: Kochhar, Roger, Tzanninis, Johnston, Moore and Otker-Robe, International Monetary Fund, Washington, D.C. ____ (2000) “Country Experiences with the Use and Liberalisation of Capital Controls” IMF Study, Prepared by: Ariyoshi, Hebermeier, Laurens, Otker-Robe, Canales-Kriljenko, and Kirilenko, International Monetary Fund, Washington, D.C. Krugman, P. (1998) “It’s Time to Get Radical With Asia”, Fortune article, http://web.mit.edu/krugman

QEH Working Paper Series – QEHWPS113 Page 38
___________ (1999) “Capital Control Freaks: How Malaysia Got Away With Economic Heresy”, Slate , www.slate.com, October Krugman and Obstfeld (1999) International Macroeconomics, 5th Edition Mohammed, D. (1998) “Statement by the Governor of the Fund and the Bank for Malaysia” Summary Proceedings, IMF Annual Meeting 1998, Washington ____________ (1999) “Statement by the Governor of the Fund and the Bank for Malaysia” Annual Meeting of the Board of Governors 1999, Washington National Economic Action Council (1998-2000) Collection of Views on Capital Controls, www.neac.gov.my OECF (1999) “Evaluating Malaysia’s capital controls 1998”, OECF, Japan. Park and Song (1999) “Managing Foreign Capital Flows: The Experiences of the Republic of Korea, Thailand, Malaysia and Indonesia” in G. Helleiner (ed.) Capital Account Regimes and the Developing Countries, 1999, UNCTAD Park, Y. (1999) “Too Much Volatility, Too Much Contagion, and What Can Be Done for It?” Expert Meeting on Portfolio Investment Flows and Foreign Direct Investment, UNCTAD, Geneva, 28-30 June Radelet and Sachs (1998) “The East Asian Financial Crisis: Diagnosis, Remedies, Prospects”, Brookings Papers on Economic Activity, 1998:1 Rodrik and Velasco (1999) “Short-term Capital Flows”, NBER Working paper 7364, Massachusetts Sachs, J. (1999) “Forget the ‘Asian Crisis’”, Asiaweek, February 26 Salomon Smith Barney (2000) “Malaysia Perspective: The Rally Has Legs”, Equity Research Report, February 16 Stiglitz, J. (1998) “More Instruments and Broader Goals: Moving Toward the Post-Washington Consensus”, The 1998 WIDER Annual Lecture, http://www.worldbank.org/html/extdr/extme/js-010798/wider.htm, UNCTAD (1998) Trade and Development Report, UNCTAD, Geneva Wing, T. (1999) “From ‘Guru’ To God: Krugman Should Know His Limits”, New Strait Times, October 6 World Bank (2000) Global Economic Prospects, World Bank, Washington