working paper seriesb1f459eb90.en.pdf · for derivatives with a risk weight of 100%. this...
TRANSCRIPT

Working Paper Series The anatomy of the euro area interest rate swap market
Silvia Dalla Fontana, Marco Holz auf der Heide, Loriana Pelizzon, Martin Scheicher
Disclaimer: This paper should not be reported as representing the views of the European Central Bank (ECB). The views expressed are those of the authors and do not necessarily reflect those of the ECB.
No 2242 / February 2019

Abstract
Using a novel regulatory dataset of fully identified derivatives transactions, this paper providesthe first comprehensive analysis of the structure of the euro area interest rate swap (IRS) marketafter the start of the mandatory clearing obligation. Our dataset contains 1.7 million bilateral IRStransactions of banks and non-banks. Our key results are as follows: 1) The euro area IRS marketis highly standardised and concentrated around the group of the G16 Dealers but also around asignificant group of core “intermediaries”(and major CCPs). 2) Banks are active in all segments ofthe IRS euro market, whereas non-banks are often specialised. 3) When using relative net expo-sures as a proxy for the “flow of risk”in the IRS market, we find that risk absorption takes placein the core as well as the periphery of the network. 4) Among the Basel III capital and liquidityratios, the leverage ratio plays a key role in determining a bank’s IRS trading activity. 5) Also,after mandatory central clearing, there is still a large dispersion in IRS transaction prices, which ispartly determined by bank characteristics, such as the leverage ratio.Keywords: OTC derivatives, network analysis, interest rate risk, banking, risk management, hedg-ing;JEL Classification: G21, E43, E44
ECB Working Paper Series No 2242 / February 2019 1

1 Non-technical summary
At around ten times the world GDP, the global over-the-counter (OTC) derivatives market is avery sizeable part of the financial system. In this market, derivatives, repurchase offers, or bondsare traded among banks and institutional investors. By accounting for around 60% of the totalgross notional volume of OTC derivatives, the largest single segment is Interest Rate Swaps (IRS).Given the very active trading, major dealers’ total gross notional IRS exposures many times exceedtheir capital.In the global financial crisis, the network structure of the OTC interest rate derivatives marketcreated the risk of rapid propagation of distress across the financial system. In particular, thecore of the market was highly concentrated on a few major dealers, which were connected withmany other traders (banks as well as non-banks). This “hub and spoke”structure made the marketconducive to contagion from distress at a dealer at the core to other parts of the global financialsystem. In late 2008, the OTC derivatives market therefore became one of the main epicentres ofthe global financial crisis. In particular, in the aftermath of the collapse of Lehman Brothers itprovided a material source of systemic risk and a mechanism for the propagation of counterpartyrisk among major banks.After the crisis, policy makers launched a number of measures to reduce systemic risk. In Europe,reforms to strengthen the OTC derivatives market are conducted through the European MarketInfrastructure Regulation (EMIR). New measures include reporting of all OTC derivatives trans-actions in trade repositories, clearing of all trades in standardised instruments through centralcounterparties (CCPs), and higher capital charges and margins for non-centrally cleared deriva-tives trades. This paper analyses the IRS trading by major euro area banks. Our sample comprisesall key characteristics of 1.7 million IRS transactions among 218 fully identified counterparties. Thevolume of our dataset equals around EUR 95,000 billion. We focus on the analysis of “who tradeswith whom on which type of IRS” from a number of different perspectives. Our sample comprisesa snapshot as of 31/03/2018 for all open IRS trades with euro area counterparties. Informationavailable to us per transaction comprises: notional value, market value of transactions, price ∼“fixed rate”, execution date, maturity, and currency.From a policy perspective, our paper is motivated by questions related both to financial stabilityand monetary policy. In particular, analysis of the OTC market structure is crucial for under-standing potential sources of IRS market risks. The bilateral nature of OTC trades implies thatcounterparty risk externalities are potentially large and that their assessment has to be based onthe structure of bilateral exposures. The resilience of a market is influenced by the level of concen-tration among major traders. For instance, in a market where activity is widely dispersed across alarge number of relatively smaller traders, the failure of one counterparty may not directly increasethe risk of the materiliasation of widespread contagion. The prolonged low-yield environment is anadditional motivation for understanding the OTC interest rate derivatives market. In the case of amajor market turbulence, major dealers may face large margin calls on their derivatives positions.Our key results are as follows: (1) The euro area IRS market is highly standardized and concen-trated around the group of the G16 Dealers but also a significant group of core Intermediaries(and major CCPs). (2) Banks are mostly trading on all IRS market segments, whereas non-banksare often specialised. (3) When using relative net exposures as a proxy for the flow of risk in theIRS market, we find that risk absorption takes place in the core as well as the periphery of thenetwork. (4) Among the Basel III capital and liquidity ratios, the leverage ratio plays a key rolein determining a bank’s IRS trading activity. (5) Also, after mandatory central clearing, there isstill a large dispersion in IRS transaction prices, which is partly determined by bank characteristicssuch as the leverage ratio.
ECB Working Paper Series No 2242 / February 2019 2

From a policy perspective, our paper offers four preliminary conclusions. First, our empiricalfindings about market structure highlight the crucial importance of CCP resilience, as these vitalproviders of financial market infrastructure have recently been moving to a significant role in thecore of the OTC network. Second, our analysis highlights that not only the G-16 Dealers but alsoother firms (i.e., “intermediaries”) play an important role in the IRS market, thereby potentiallyimproving the resilience of the market since the intermediation role is distributed among a largerand more diverse group of firms. Third, our findings about the interconnectedness and high volumeof IRS trading have implications for liquidity risk management: the widespread use of marginingas a counterparty risk management tool heightens the need for holistic liquidity risk managementplanning on the part of major market participants as sudden margin increases may require the post-ing of large amounts of high-quality collateral in a very limited period of time. Fourth, our findingsabout the interaction between the leverage ratio and market activity provides further support forrecent policy discussions on the calibration of the leverage ratio treatment of certain derivativesexposures (see also BCBS 2018).
ECB Working Paper Series No 2242 / February 2019 3
2 Introduction
This paper analyses the structure of the OTC euro area IRS market. For this purpose, we make use
of a novel and proprietary set of transaction data. The IRS market represents the largest segment
of the OTC derivatives market, accounting for more than 60% of the global OTC derivatives mar-
ket (Bank for International Settlements (2017)). The euro area IRS market has an aggregate gross
notional of EUR 98.3 trillion, which means that the notional volume of our dataset equals 37% of
the global market volume1. At the time of writing, IRSs in the EU are mostly traded OTC (i.e.,
in bilateral transactions between major financial firms). In contrast, in the US, “Swap Execution
Facilities”are now playing an important role in the trading and in particular in the price formation
of many derivatives categories.
Due to the private nature of bilateral transactions, OTC derivatives markets are “dark mar-
kets”(Duffie (2012)). Their systemic importance has been clearly illustrated in the global financial
crisis. In the process of post-crisis regulatory reforms, reducing the opacity and fragmentation in
OTC markets has been a priority for global policy makers (cf. Financial Stability Board (2017)).
For the definition and implementation of these policy goals, understanding the OTC market struc-
ture and activity is an essential ingredient. The aim of this paper is to help policy makers and
academics to better understand the structure of this important fixed-income market.
Bilateral trading has historically made analysis of the IRS market structure difficult as there was
a general lack of comprehensive transaction data. However, since the global financial crisis, the
Dodd-Frank Wall Street Reform and Consumer Protection Act in the US and the European Mar-
ket Infrastructure Regulation (EMIR) are addressing opacity, counterparty risk and contagion risk.
Two key elements of these regulatory reforms illustrate the relevance of our analysis of the anatomy
of the euro area IRS market: (i) most standardised OTC derivatives are now being centrally cleared
and (ii) OTC derivatives transactions are being reported to “trade repositories”(TRs). More specif-
ically, since 2016, transactions in the EU in basis, fixed-to-float IRS, FRAs, and OIS in EUR, GBP,
JPY and USD have to be centrally cleared. Hence, all new trades in standardised IRSs are now
being cleared via Central Counterparties (CCPs). The second element of the new framework
is specifically targeted to improve post-trade transparency by means of making transaction data
1See Bank for International Settlements (2017)
ECB Working Paper Series No 2242 / February 2019 4
available to supervisors and central banks. We are therefore able to use a novel regulatory dataset
of bilateral OTC euro area IRS transactions defined by the EMIR regulation (see Abad, Alda-
soro, Aymanns, D’Errico, Fache Rousova, Hoffman, Langfield, Neychev, and Roukny (2016) for a
detailed introduction to the dataset). Our sample comprises around 1.7 million IRS transactions
among 55,643 counterparties. Out of these more than 55,000 counterparties in our sample, we fully
identify and categorize the major 282 major entities, which account for 95% of the overall notional
exposure. The gross notional volume of our data set equals around EUR 98 trillion, hence, we cover
37% of the global IRD market2 (assuming no double counting) and more than 98% of the EUR
market3. Our unique transaction dataset allows us to investigate the market microstructure and
the dynamics of IRS trading in the euro area starting from individual transactions up to a sectoral
and finally a market-wide perspective.
Our paper can also shed some light on the potential impact of the leverage ratio requirements on
the OTC derivatives market. Basel III has introduced capital and liquidity requirements on top of
the risk-weighted capital requirements already present in Basel II. In particular, via the leverage
ratio, Basel III requires banks to hold capital against certain types of off-balance-sheet exposures
for derivatives with a risk weight of 100%. This regulatory reform might influence trading activity
in derivatives markets due to the fact that its risk sensitivity is quite low (see Haynes, McPhail,
and Zhu (2018) for the impact of leverage ratio on the competitive landscape of the US option
market). We empirically investigate the relevance of this policy issue in the euro area IRS market.
We study whether Basel III capital and liquidity ratios influence the gross and net trading activity
and transaction price dispersion in IRS trades.
The main goal of our paper is to document stylized facts on a key market segment. Our findings
can then be used for extending the theoretical work. We test a number of hypotheses derived from
the existing empirical and theoretical literature on OTC markets. We offer four main contributions
to the empirical literature on OTC markets.
• First, we describe the structure and trading activity in the Euro area IRS market. Our
analysis considers both the aggregated level (defined as total gross and net notional volume
aggregated across all instruments) as well as key subsegments of the market. We define
2See BIS Statistics: http://stats.bis.org/statx/srs/table/d5.13Estimate from cleaned data set based on ECB Statistical Data Warehouse
ECB Working Paper Series No 2242 / February 2019 5

market subsegments by means of currency (e.g., activity in EUR versus USD) or maturity
(e.g. activity in 10-year swaps versus 5-year swaps). So far, a detailed description of the
largest segment of the OTC market has not been available.
• Second, we investigate specialization among IRS traders. In particular, we compare the
strategies of dealers, major banks, and non-banks in terms of their activity across currencies
and maturities. We investigate differences in terms of their gross or net notional exposure. We
distinguish determinants of gross and net trading activity. Hence, we also study the “flow”of
interest rate risk in the network.
• Third, we investigate how a trader’s IRS activity is related to its balance sheet. We focus on
banks due to availability of comparable balance-sheet data. We test whether bank character-
istics such as bank size or Basel III capital (both using risk weights and leverage ratio) and
liquidity ratios explain differences in trading activity.
• Finally, we focus on a subsample of transaction prices to analyse trader-level price dispersion.
For prices of standardised centrally cleared IRS transactions, we test if different types of
traders pay different prices (see also Hau et al (2017) for evidence on price discrimination in
the FX market). Due to mandatory central clearing, counterparty risk should have declined
materially. Earlier papers on OTC market analysis have documented that counterparty risk
is a key driver of price dispersion in bonds, whether CDS or IRS (see Du, Gadgil, Brody,
and Vega (2017) or Cenedese, Ranaldo, and Vasios (2017b)). In this context, we also study
whether the size of trade activity as well as balance sheet and Basel III capital and liquidity
ratio characteristics affect this price dispersion.
Our key empirical results are as follows: We observe that trading in the IRS market is focused
on standardized instruments and concentrated around a group of core banks (and major CCPs).
In contrast to the network of other OTC markets (e.g., CDS), the core of the market (defined
by bilateral notional exposures) is not only composed of G-16 Dealers (i.e., banks with material
investment bank activity), but also some universal banks (“intermediaries”, in our terminology),
which make active use of IRSs in a range of currencies and maturities, whereas they typically do
not actively participate with similar intensity in, for example, CDS trading. We also find that the
portfolios of non-banks are more specialised than most banks’ IRS portfolios. Finally, we observe
ECB Working Paper Series No 2242 / February 2019 6

that net risk exposure is significantly allocated both in the core as well as the periphery of the
network. In terms of banks’ balance-sheet characteristics, we find that dealers’ and intermediaries’
large trading activity is not just driven by their balance-sheet size, but that other variables matter
as well. Moreover, we find that a bank’s leverage ratio determines the size of its trading activity as
well as its net notional exposure. Banks having similar characteristics, in presence of lower leverage
constraints, are more active in the IRS market. The other two Basel III ratios that we consider
(risk-weighted capital ratio or proxy for liquidity ratio) are instead not relevant.
In our analysis of price dispersion, we find that even after the start of mandatory clearing, there is
still significant transaction price dispersion. In terms of transactions’ market pricing, we do not find
significant differences for the “intermediary”category with respect to dealers’ transactions. Among
the Basel III ratios, the leverage ratio is the most relevant ratio where the most constrained bank
charges a larger spread when it is not initiating the trade. The size of the trade is also an important
variable to explain price dispersion.
Overall, our findings shed new light on the current structure of OTC trading and the impact of
regulatory reforms. We significantly extend previous empirical analysis4, which was typically fo-
cused on just two groups of traders: dealers, who trade with all market participants, and customers,
who only trade with dealers (cf. Collin-Dufresne, Junge, and Trolle (2017) for US index CDS and
Getmansky, Girardi, and Lewis (2016) and Bellia, Panzica, Pelizzon, and Peltonen (2017) for the
single-name CDS market). However, this binary categorization does not capture market activity
in the largest segment of the OTC derivative market: the IRS market. An additional driver of the
more complex structure of the core of the IRS market is the rapid growth of central clearing. All in
all, the core of the euro area IRS market therefore consists of dealers, other major universal banks,
and CCPs.
So far, despite its magnitude and economic importance, few papers have studied the IRS market.
The overwhelming majority of empirical papers has concentrated on the CDS market5. Fiedor,
Lapschies, and Orszaghova (2017) perform a network analysis of the EU’s centrally cleared interest
rate derivatives market, with a focus on counterparty relations within both direct (house) clearing
4See Duffie, Garleanu, and Pedersen (2005) and Duffie, Garleanu, and Pedersen (2007) for research on theoreticalframeworks
5Oehmke and Zawadowski (2016) provide the first detailed anatomy of the CDS market. See also Collin-Dufresneet al. (2017), Loon and Zhong (2014), Loon and Zhong (2016), Arora, Gandhi, and Longstaff (2012), Battiston,D’Errico, Scheicher, and Peltonen (2018), and Brunnermeier, Clerc, and Scheicher (2013)
ECB Working Paper Series No 2242 / February 2019 7

and client clearing. Benos, Payne, and Vasios (2016) study the links between centralized trading,
transparency, and the US IRS market liquidity. They present evidence from the implementation
of the Dodd-Frank Act on USD IRS. Hoffmann, Langfield, Pierobon, and Vuillemey (2017) focus
on total interest rate exposures and match IRS exposure to balance-sheet exposures to interest
rate risk. Cenedese et al. (2017b) study pricing differences between transactions using central and
bilateral trades, focusing on the non-mandatory clearing period. We are largely complementary to
these papers since we focus on a period wherein central clearing is mandatory and look at (i) the
role the different traders’ categories and (ii) the potential role of capital requirements constraints
are playing in this market in terms of gross and net notional exposures and transaction prices.
The rest of this paper is organized as follows. Section 2 provides some background on the IRS
market and the regulatory framework. Section 3 introduces our research issues and empirical hy-
potheses. In Section 4, we describe our dataset. Section 5 presents our results, starting with the
descriptive statistics for our novel dataset, both at transaction and trader level, and then we test
the different hypotheses described in Section 3. Section 6 presents robustness checks and Section 7
concludes.
3 Background
In this section, we briefly describe the mechanics of IRS and important recent changes in the reg-
ulatory framework for OTC derivatives trading.
An IRS is an agreement to exchange cash flows at specified points in time according to a bilateral
contract (cf. Chapter 7 in Hull (2014)). Credit institutions, institutional investors, or industrial
firms use IRS to adjust differently structured payment flows in asset-liability management, to hedge
against interest rate risks or to take on such risks for trading purposes.
In the euro area, the Euribor unsecured money market rate is currently typically used as the under-
lying interest rate, while the Libor rate is used for GBP or USD transactions. These reference rates
have a maturity of three or six months and the maturity of the corresponding swaps is typically
five or ten years. Banks specifically use IRS for hedging interest rate risk in their loan books or
bond portfolios, transforming the cash flows from bond issuance or intermediation (i.e., providing
hedging opportunities for other banks or non-financials).
ECB Working Paper Series No 2242 / February 2019 8

A common economic mechanism behind an IRS position is the comparative advantage that each
side of the transaction holds in a particular market segment. At the initiation of a transaction, the
present value of the position of the fixed rate payer corresponds to that of the floating rate payer.
The spread between the current floating rate and the initially determined fixed rate is typically
re-calculated at half-year intervals. Depending on whether the calculated spread is positive or neg-
ative, one or the other counterparty will have to pay the incremental cash flow, as illustrated in
the following example of the structure of a five-year IRS:
Counterparty 1 (the buyer) pays: Payments Counterparty 2 (the sellers) pays:
Five-year fixed rate 1%——> five-year floating rate
1% <——EURIBOR + 10 BP Three-month EURIBOR + 10BP
At the initiation of the transaction the market value of a standard IRS is therefore very close to
zero (cf. Hull 2014). During the lifetime IRS are often valued as the difference between the value
of a fixed-rate bond and the value of a floating-rate bond where the floating rate bond is priced by
noting that it is worth par immediately after the next payment date.
In the aftermath of the financial crisis, global regulators have put in place a number of measures
to foster the resilience of the OTC market (cf. Financial Stability Board (2017)). Among recent
regulatory developments, three measures deserve particular attention in the context of IRS analysis:
• Clearing obligation: EMIR includes the obligation to centrally clear certain classes of OTC
derivatives via authorised CCPs 6. Since February 2016, EU transactions of major market
participants in basis, fixed-to-float IRS, FRAs, and OIS in EUR, GBP, JPY, and USD have
to be centrally cleared. Hence, all new trades involving “standardised”IRS among dealers
and major banks are now cleared via CCPs, whereas for instance, Pension Funds can for the
time being still use bilateral clearing.
• Mandatory margining: EMIR also fosters risk mitigation in non-centrally cleared OTC con-
tracts. Bilaterally cleared transactions have to be covered by margining, covering both current
(“variation margin”) as well as the potential future exposure (“initial margin”). This reform
6https://www.esma.europa.eu/sites/default/files/library/public_register_for_the_clearing_
obligation_under_emir.pdf
ECB Working Paper Series No 2242 / February 2019 9
came into force for the major dealers in February 2017. This second element of the revised
regulatory framework focuses on the bilateral market because EMIR also foresees detailed
requirements for CCP risk management
• Post-trade transparency: According to Article 9 of the EMIR, the counterparties of a deriva-
tive contract have to report the details of the transaction, including modifications and cancel-
lations to a trade repository (TR), “no later than the business day following the conclusion,
modification or termination of the contract”. The set of details shall be reported to a TR
registered according to Article 55 title VI or recognized in accordance with Article 77 of the
EMIR.
CCPs have been active for a long time in the clearing of exchange-traded instruments such as stocks
or derivatives which often use a central order book. However, the contagion in the aftermath of
the Lehman collapse in September 2008 has led to regulatory reforms of the structure of OTC
markets (cf. Sidanius and Zikes (2012)). A key benefit of increased central transaction clearing
is the sizeable reduction of counterparty credit risk (see, e.g., Duffie, Scheicher, and Vuillemey
(2015)). By stepping into what was formerly a bilateral trade through novation (“buyer to every
seller”and vice versa), CCPs can reduce or reallocate the impact of an institution’s distress on its
counterparties. CCPs apply stringent membership criteria and require extensive collateralization
of positions. Clearing members have to post margins and contribute to the CCP’s default funds,
which mutualise potential losses above a pre-defined threshold. As CCPs allow for the multilateral
netting of exposures, they significantly reduce the size of open exposures and thereby also members’
overall collateral and liquidity requirements. Multilateral netting can also reduce the size and
complexity of the overall network of exposures. Overall, CCPs face a unique risk profile oriented
toward tail risk. Given their important role in the financial system, the US FSOC designated three
CCPs as systemically important. The regulatory requirements for the use of CCPs together with
comprehensive margining in the bilateral segment have had a substantial effect on counterparty
credit risk. In particular, the use of prudent margining has materially reduced the risk of contagion
in the OTC derivatives market. As discussed in detail in Financial Stability Board (2017), OTC
derivatives markets have become more resilient overall.
ECB Working Paper Series No 2242 / February 2019 10

4 Research Issues and Empirical Hypotheses
In our empirical analysis, we do not build on a single unifying theoretical framework. Instead, we
base our hypotheses on theoretical and empirical research on OTC markets more broadly.
These hypotheses, therefore, should be seen as broadly guiding our empirical analysis and allowing
us to perform a number of descriptive tests that shed light on trading activity in the IRS market.
Hence, the aim of this paper is to deliver a set of descriptive results in order to provide a foundation
for future theoretical and empirical work on IRS markets.
Hypothesis 1: In the IRS market, trading is focused on standardised products.
Our first hypothesis is designed to analyse the composition of transactions in the IRS market.
In contrast to exchange-traded markets, OTC transactions are executed bilaterally, which leads to
decentralisation of trading. An investor who wants to, for example, sell an instrument has to first
start a (costly) search for a buyer (Duffie et al. (2005)). The search friction is accompanied by
other market frictions. Two additional frictions are (1) lack of transparency about actual transac-
tion prices (cf. Benos et al. (2016)) and (2) the ongoing impact of dealer balance-sheet costs on
their trading activity (cf. Andersen, Duffie, and Song (2018)).
Market participants have developed a number of tools to reduce the costs of some of these frictions.
One commonly used approach in a number of market segments is to standardise the definition
of key features of frequently used instruments, such as the maturity, transaction size, or coupon.
Increased harmonisation of instruments then allows for the evolution of benchmark contracts. This
process simplifies the search for a counterparty and therefore allows for faster and cheaper matching
of buyers and sellers. This evolution can be observed in the single-name CDS market, where trans-
actions are typically conducted on a maturity of five years, with standardised coupons and senior
unsecured debt as underlying instrument (cf. Oehmke and Zawadowski (2016)). As Benos et al.
(2016) and Cenedese et al. (2017b) discuss, standardisation is also common for US$-denominated
IRS contracts. We test whether this practice is also the case for euro-denominated IRS trading.
Our focus is on maturity as a key variable. We also extend the definition of standardisation in
terms of the structure of cash flows, therefore adding the “fixed-floating”variable to the analysis.
ECB Working Paper Series No 2242 / February 2019 11

Hypothesis 2: Network structure:
2a) The core of the network in the IRS market is constituted not only by dealers but also by other
major banks: intermediaries.
2b) Non-banks are typically located in the periphery of the network.
2c) The core of the network is non-specialised whereas the periphery is specialised.
We now move from a transaction to a network perspective. As a mitigant to the costly search
friction, a group of dealers has emerged in many OTC market segments. Dealers execute trades
with smaller or less-active market participants (e.g., non-banks) and typically try to run largely
matched positions because their business model is oriented toward intermediation rather than out-
right risk retention7. Dealers aim not to take proprietary positions, thereby avoiding exposure to
market risk. Therefore, a key risk for dealers is counterparty risk, which in a crisis can lead to
elevated likelihood of contagion via counterparty credit risk (cf. Glasserman and Young (2015)).
As Eisfeldt, Herskovic, Siriwardane, and Rajan (2018) document, in the CDS market, trading takes
place via a “core”set of dealers, which trade with all market participants, and a “periphery,”which
only trades with the firms in the core of the market. Hence, firms located on the periphery of
the CDS network do not trade with each other, but only with dealers. Based on this finding, we
conjecture that the aggregate network in the IRS market is also characterized by a “core-periphery
structure”(where the network is defined by the matrix of aggregated bilateral gross / net expo-
sures).
In contrast to other OTC derivatives market segments (e.g., CDS), the IRS market is used by a
very large number of banks because it offers hedging for a fundamental risk of banking, namely
interest rate risk (cf. Hofmann et al., 20188). This market characteristic implies the potential for a
more complex core structure. In particular, we conjecture that some non-dealer bank participants
7The crucial role of G-16 Dealers in many OTC segments has been documented, for example, for corporate bonds(Di Maggio, Kermani, and Song (2017)), municipal bonds (Li and Schrhoff (2018)) or index CDS; or as in Collin-Dufresne et al. (2017), the main role of dealers is to match instrument buyers and sellers, partly by using the dealerbalance sheet.
8The single-name CDS market offers hedging only for a small subset of a bank’s credit risk exposures. In particular,activity is concentrated on major G-20 and emerging market sovereigns, G-SIBs, and major industrials. Therefore,for many borrowers in a bank’s loan book there is no corresponding direct hedge instrument available in the CDSmarket
ECB Working Paper Series No 2242 / February 2019 12

are also located in the core of the market because the structure of their balance sheet implies the
need for a large number of transactions.
To identify these “intermediaries”(i.e., banks that act like dealers but are not in the generally used
lists9 ) from our dataset, we analyse activity across major sub-segments of the IRS market. For this
purpose, we first define 27 subsegments of the IRS market by categorising transactions according
to their currency (EUR, USD, and others), maturity (5 years, 10 years, and others) or cash-flow
structure (fixed-floating, floating-floating, and fixed-fixed). We then count in how many of these
27 subsegments a firm has non-zero notional exposure in our sample period. The realised values of
this index give us an indication if a market participant is active across all segments (value equal
to 27 implies no specialisation) or only a handful (single-digit value-i.e., high specialisation). This
approach allows us to apply a data-driven selection of the firms in the core of the network rather
than use lists compiled for other market segments or simply the aggregate volume of trade or the
total number of counterparties.
We now move from the core to the periphery of the market. An example of an entity located on
the periphery is a pension fund that wants to enter into an IRS to hedge its interest rate risk. For
this transaction, it will contact a dealer rather than another pension fund because the likelihood
of a match is higher with the former rather than the latter, and pension funds are typically not
clearing members in CCPs10. Hence, clustered nodes typically define a core of key market makers
that are closely linked to a large number of other traders.
In addition to the network location, specialisation is another characteristic of a firm’s market
activity. Our sample comprises instruments in a range of currencies (EUR and USD, but also
emerging-market currencies), maturities (from O/N to 30 years), or cash-flow profiles (e.g., plain-
vanilla fixed-floating, basis swaps, or cross-currency contracts that swap EUR benchmark rates for
USD rates). Specialisation is not only relevant in terms of market pricing, but also because of
potential market power in smaller and more concentrated market segments.
Hypothesis 3: In absolute as well as relative terms holders of net notional IRS exposure are lo-
cated both in the core as well as in the periphery of the network.
9G-16 Dealers: Bank of America Merrill Lynch; Barclays; BNP Paribas; Citigroup; Credit Agricole; Credit Suisse;Deutsche Bank; Goldman Sachs; JP Morgan; Morgan Stanley; Nomura; Societe Generale; UBS (cf FSB 2017);
10See exemption from clearing obligation under EMIR implementation for Pension Funds.
ECB Working Paper Series No 2242 / February 2019 13
Our next hypothesis focuses on the transfer of risk in the IRS market via holdings of net ex-
posure. We again take as a starting point the results on the structure of the CDS market (cf.
Battiston et al. (2018)). This is characterized by the existence of long chains of intermediation
wherein the underlying risk of a reference entity’s default is passed between dealers and other mar-
ket participants (e.g., hedge funds). This process results in a “flow of credit risk”(i.e., the flow
of the underlying reference entity’s default risk) along this intermediation chain, which leads to
interconnectedness among a large number of counterparties, some of which are non-banks. Em-
pirical analysis for bilateral exposures in the CDS market by Battiston et al. (2018), Bellia et al.
(2017), and Getmansky et al. (2016) shows that exposure to fundamental credit risk frequently
does not remain with the dealers, but instead “flows”to smaller market participants who may also
have correlated CDS portfolios.
As a specific proxy for the IRS market, we measure risk absorption by means of a firm’s net / gross
ratio as well as net notional exposures. We then analyse the determinants of these measures in a
regression approach. Given the stylised facts of the CDS market, we conjecture that some of the
entities in the periphery of the IRS network are ultimate “risk absorbers”- that is, they fulfil other
institutions’ demands for interest rate risk hedging.
Our methodology is focused on the trading and risk transfer within the IRS market. Hence, in con-
trast to Hoffmann et al. (2017), we focus on who bears the specific risk traded in the IRS market
rather than interest rate risk more generally (e.g., including all banks’ exposures on interest rate
risk such as fixed-rate loans or banks’ portfolios). Our net exposure analysis is also motivated by
new regulatory requirements for comprehensive margining: Traders both in the CCP as well as the
bilateral market face the risk of margin calls when their positions are accumulating mark-to-market
losses. Hence, from a risk perspective, our analysis is oriented toward understanding the impact
of high and increasing market volatility on traders’ IRS exposures. In this context, our analysis
of the structure of net exposures can shed some light on the impact of margin calls on major traders.
Hypothesis 4: Bank size explains a bank’s IRS market activity
We next turn to the drivers of the allocation of banks to the core or the periphery of the net-
ECB Working Paper Series No 2242 / February 2019 14

work of bilateral exposures. We focus on banks due to the availability of comparable balance-sheet
information (i.e., the lack of data for hedge funds or pension funds). We investigate whether size is
the main determinant of the location in the core-periphery structure of the network. Our analysis
of the role of total assets as a determinant of market activity is broadly motivated by the discussion
of a bank’s size as a proxy for its role in networks of bilateral exposures and its contagion risk (cf.
Glasserman and Young (2015)). We also investigate whether a bank’s market activity is largely
driven by the size of its balance sheet. Moreover, we also study whether there is any relationship
between net exposures and bank size by looking first at net over gross notional ratio and then at
the net notional.
Hypothesis 5: The role of Basel III capital and liquidity ratios
5a) A bank’s regulatory capital ratio (measured by CET1 / risk-weighted assets) and its liquidity
ratio (measured by liquid assets / total assets) are positively related to its gross and net notional.
5b) Banks’ leverage ratios (as measured by CET1 / total exposures) are positively related to their
IRS market activity.
We aim to check whether better-capitalised banks11 and/or banks with a higher liquidity buffer are
more active in IRSs. There could be several reasons why a bank’s capital and liquidity ratio might
affect its market activity. First, a bank’s RWA-based capital position (defined as CET1 relative
to risk-weighted assets) is a common determinant of a bank’s rating and its counterparty risk in
general (for a general discussion, see Acharya, Fleming, Hrung, and Sarkard (2016)). We might
expect that market participants prefer to trade with an entity that is well-capitalised and therefore
more resilient to market shocks. A similar logic applies to a bank’s holding of liquid assets, which
can be directly used to cover any sudden margin calls from CCPs.
However, mandatory clearing should have reduced the relevance of counterparty risk in the se-
lection of a counterparty. A capital ratio that might be more relevant now is the leverage ratio
which is defined as capital relative to total assets (i.e., with equal risk weights of 100% for all
instruments irrespective of their risk). Introduced by Basel III, the leverage ratio requires more
capital against derivatives exposures, which have a low level of market risk. It also does not fully
11See also Siriwardane (2018).
ECB Working Paper Series No 2242 / February 2019 15

recognize position offsets and the availability of risk-mitigating collateral (e.g., in its definition of
exposure measure). A number of authors (see, e.g., Haynes et al. (2018), for the impact of the Basel
III leverage ratio on the competition in the option market and Boyarchenko, Eisenbach, Gupta,
Shachar, and Van Tasse (2018) for a survey) have recently highlighted that the new regulation may
affect the cost and therefore the willingness of banks to trade in OTC markets due to the binding
nature of the leverage ratio for a number of major firms. This concern is particularly relevant
for high-notional markets such as interest rate derivatives or repos. As some major banks have a
comparatively weak capital position (relative to total assets), they are not able to provide as much
“balance-sheet space”as before the crisis (for a comprehensive discussion, see Duffie (2018b)). For
instance, in the context of derivatives clearing for client business, which is also penalised by the
leverage ratio, Acosta-Smith, Ferrara, and Rodriguez-Tous (2018) show that the leverage ratio had
a “dis-incentivising” effect on client clearing, with a notable reduction in UK banks’ willingness to
take on new clients. We test this hypothesis in the euro area IRS market by investigating how a
bank’s market activity is related to its leverage ratio, with particular emphasis on those banks that
are in the lower part of the capital distribution. We also investigate how the Basel III capital and
liquidity ratios affect net exposures both in terms of net over gross notional ratio and absolute net
exposure. In this case, we expect that risk-weighted capital and liquidity ratios are more relevant
when risk mitigation across positions is recognized.
Hypothesis 6: There is material dispersion in price data for dealers versus intermediaries; Basel
III’s capital and liquidity ratios have a role in explaining price dispersion.
As discussed earlier, OTC derivatives markets are characterized by the lack of centralized price-
formation mechanisms, as they are based on bilateral trades. This decentralised and fragmented
process might generate several impediments to OTC market functioning because buyers and sellers
negotiate terms privately, often in ignorance of the prices currently available from other potential
counterparties and with limited knowledge of trades recently negotiated elsewhere in the market.
This induces: (i) sequential trade of assets by search and bargaining; (ii) opaqueness: non-dealers
request quotes bilaterally or on dealer RFQ platforms, with limited post-trade price transparency;
and (iii) limits to dealer formation and exchange migration (see Duffie (2012) and Duffie (2018b)).
ECB Working Paper Series No 2242 / February 2019 16
These characteristics are also typical for the IRS market and generate a significant price dispersion
and an “OTC premium”as documented by Cenedese et al. (2017b).
However, the counterparty credit risk reduction from growing central clearing, transparency, and
standardisation induced by the new regulation should have reduced opacity and thereby also may
have reduced pricing-discrimination power. As both dealers and intermediaries are in the core we
conjecture that dispersion in their transaction prices is similar and rather low. We use a regression
approach to check this hypothesis on a subset of transactions where price data are available. This
approach allows us to analyse the role of intermediaries not only in terms of their exposure but also
with respect to their effect on pricing dynamics, thereby shedding additional light on their role in
the euro area IRS market.
Another aspect that is currently extensively debated is the role of Basel III capital and liquidity
ratios, the associated high costs of dealer balance-sheet space and the evidence for mispricing (and,
therefore, room for price dispersion (see Adrian, Etula, and Muir (2014), He, Kelly, and Manela
(2016), Du, Tepper, and Verdelhan (2018), Andersen et al. (2018), Boyarchenko et al. (2018), Bel-
lia et al. (2017), and Fleckenstein and Longstaff (2018)). In this paper, we investigate this issue
without looking at the law of one price but rather by testing whether and how capital and liquidity
ratios influence the price dispersion.
5 Our Sample and Descriptive Statistics
5.1 Derivatives dataset: Transaction-level perspective
Our dataset builds on regulatory reporting under the EMIR. EMIR requires EU entities to report
their derivatives transactions to trade repositories authorised by the European Securities Markets
Authority (Abad et al. (2016) describe the reporting and associated problems). Hence, all EU-
located legal persons (counterparties) entering into a derivative contract must report the details of
that contract to a TR.
We obtain transaction-level derivatives data from the main TRs, which in turn have access to the
transaction data following the EMIR regulation.
ECB Working Paper Series No 2242 / February 2019 17

As of March 2018, the following TRs have been authorised by ESMA12 :
• Bloomberg Trade Repository Limited
• CME Trade Repository Ltd.
• DTCC Derivatives Repository Plc
• ICE Trade Vault Europe Ltd.
• KDPW
• NEX Abide Trade Repository AB
• Regis-TR S.A.
• UnaVista Limited
We use a snapshot of the stock of all open IRS transactions on March 30, 2018, for traders domiciled
in the euro area on one side of the transaction. For that date, the EMIR dataset on euro area OTC
interest rate derivatives contains 4,042,960 trades.
As the transaction data in TRs include many data errors and also double reporting due to the
structure of EMIR reporting, the TR data are not readily usable for research purposes, and hence
we perform an extensive cleaning procedure (summarized in Table 1). In particular, we follow the
approach of Abad et al. (2016). Our filters are defined as follows:
• Remove transactions with missing data on key variables (missing notional, missing counter-
parties’ IDs)
• Remove transactions with clear misreported data, mainly transactions with an implausible
value of notional (i.e., lower than 50k and higher than 10bn), but also transactions with
implausible maturitiy dates (i.e. before 2018 and after 2050);
• We narrow the time span of contracts execution from 2000 to March 2018, deleting all trans-
actions before 2000;
• Focus exclusively on IRS (e.g., we drop swaptions).
• Drop intragroup transactions (e.g., trades between two subsidiaries within a banking group);
this was performed not only using a specific dummy variable available in the dataset for
intragroup, but also using our traders’ mapping and groups reconciliation;
12https://www.esma.europa.eu/supervision/trade-repositories/list-registered-trade-repositories
ECB Working Paper Series No 2242 / February 2019 18

• Drop double reporting (same trade reported twice) and other inconsistent observations iden-
tified due to the EMIR double-reporting obligation;
Application of all these filters together produces a final dataset of 1,666,489 trades. The restrictions
on our sample are largely due to data availability and quality problems of reported trades in the
EMIR data collection. We will discuss the subset of transaction data with valid price information
later.
Table 2 reports standard summary statistics for the transaction-level dataset. On a transaction
level, the main variables of interest, besides the identity of reporting and reported counterparties,
are the key features of the contract (i.e., the gross notional amount of the trade) and the effective
execution and maturity dates of the transaction.
In Table 2, we separate summary statistics respectively for the overall market, the cleared subseg-
ment (i.e., cases in which one counterparty is a CCP), and the bilateral subsegment (i.e., cases in
which two firms clear directly with each other).
Aggregate gross notional equals EUR 98.3 trillion, which means that the volume of our dataset
equals 37% of the global market volume and 98% of the Euro area market13. In total, 55% is
constituted by cleared transactions and 45% by non-cleared transactions.
The median gross transaction notional across all transactions equals EUR 19.1 million with 25%
of transactions below EUR 6 million, and 25% of transactions above EUR 50 million. Hence, we
both observe transactions with a size that is more of a retail magnitude as well as some very large
trades. The standard deviation is three times the mean of the notional, confirming wide dispersion
in size. This indicates that we observe a heterogeneous network structure, which includes trans-
actions from the largest dealers to much smaller banks, other institutions (e.g., investment funds),
and corporates. A comparison between the cleared and the bilateral market segments indicates that
the average gross notional of a cleared transaction is twice the average notional of a non-cleared
transaction.
It is worth highlighting that in the IRS market, gross notional is not a representative measure of
risk exposure because only the difference of the fixed and the floating rate is typically exchanged.
Nevertheless, the highly positive correlation of gross notional with trade activity shows that no-
tional provides us with detailed information about market structure, especially considering that
13Source: BIS.
ECB Working Paper Series No 2242 / February 2019 19
the variable measuring market value has many misreported values14
For the limited subsample, where both variables are available, the average market value is 1% of
the average gross notional. This combination of high gross notional and the low net market value
indicate that IRS exposures are frequently adjusted and that an exposure opened at some date is
typically not kept unchanged until the maturity of the IRS contract. This corresponding high level
of trade activity is a stylized fact also for other OTC derivatives markets. According to Bank for
International Settlements (2017), global notional for all counterparties captured by the BIS data
collection is EUR 346,594 billion with a market value of EUR 7,082 billion, which equals around
2% of notional.
Table 2 shows that 50% of the open trades as of March 30, 2018, are expiring by 2022. This is
confirmed by the distribution of IRS contract maturity, with 25% of contracts having a maturity
lower than five years.
5.2 Aggregation to firm-level perspective
Our first approach to the definition of firm-specific characteristics uses a categorization of the 282
counterparties in our sample into six different groups. This group covers 95% of the total market
exposure (see also further below).
1. G-16 Dealers (n=16): Due to their role as “core”intermediaries (cf., e.g., Peltonen, Scheicher,
and Vuillemey (2014)), we define the category “Dealers”from the list of the main sixteen
derivatives dealers as commonly used by researchers (for an example, see Benos et al. (2013)).
2. Intermediaries (n=10): We introduce and define this new category of non-dealer banks be-
cause we observed a group of large banks that play a role in the market similar to the dealers,
and that together with the dealers constitute the core of the IRS market. We describe the
details of our identification process below.
3. Banks supervised by the Single Supervisory Mechanism (SSM) that are non-dealers and non-
intermediaries (n=87): As our dataset consists of derivatives transactions in the euro area,
we expect banks domiciled in the euro area (i.e., supervised by the SSM) to be more active in
this market than banks from other currency regions. Therefore, we define a separate category.
14Similar to market prices, the reporting of market values are particularly prone to data errors (see also Abad et al.(2016)). We therefore focus on notional measures for most of our analysis.
ECB Working Paper Series No 2242 / February 2019 20

4. Other banks (n=46): Non-dealers and non-intermediaries outside the SSM scope.
5. CCPs: Our sample comprises 11 CCPs domiciled in the EU, US or Asia.
6. Non-banks: All remaining counterparties (n=112) are predominantly investment funds, in-
surance companies, pension funds, or non-financials. Given that investment funds or asset
managers do not publish harmonized data on their balance sheets, this category is omitted
in the analysis where we make use of proxies for a firm’s capital or liquidity.
We define a large set of dummy variables to test our hypotheses outlined in the previous section.
Our second approach makes use of balance-sheet data. We retrieved bank balance-sheet information
as of 31/12/2017 from S&P Global SNL Financial. We matched these data using legal entity
identifiers (LEI), but since each group has different branches with different LEIs, we carefully chose
group data and then reconciled all branches and subsidiaries within the respective groups. The
balance-sheet data are only available on a comparable basis for banks, as many non-banks (e.g.,
hedge funds or pension funds) do not publish harmonized balance-sheet data. We also collected
information on a bank’s size (total assets), risk-weighted assets, liquid assets, and two measures of
the capital position (CET1 relative to total exposure or risk-weighted assets).
In terms of summary statistics, we first describe the entities in our sample by means of their
balance sheets. As Table 3 shows, the sample is dominated by banks with large balance sheets:
the biggest bank in our sample has a balance sheet exceeding EUR 2 trillion. The leverage ratio is
higher than 5.5% for half the banks in our sample. According to the liquidity ratio, liquid assets
(using the SNL rather than the regulatory definition) are typically one-third of total assets. We
also investigate whether the Basel III capital and liquidity ratios are highly correlated (i.e., they
always capture the same feature of a bank). Panel B of Table 3 shows that this is not the case.
Correlation among total assets, CET1 ratio, leverage ratio, and liquidity ratio is low and ranges
between 0.35 to -0.30.
To illustrate the information available in our dataset, we briefly describe the activities of one
dealer on one (randomly chosen) day in 2017. On that day, the dataset recorded 425 trades between
the dealer and a variety of counterparties:
• 205 with one major EU CCP;
• 139 with other CCPs such as the US or Japan;
ECB Working Paper Series No 2242 / February 2019 21

• Rest with US G-SIBs, Asian banks, or fixed-income fund;
The total gross notional of new trades equals EUR 26 billion. Maturities range from 3 months to
30 years. Products range from IRS referring to benchmark Euribor to CPI inflation derivatives and
to swaps in Emerging Market currencies. This example further confirms the high level of market
activity for major firms. A summary of trading activity from a trader perspective is reported
in Table 5. We show the differences between the bilateral and the cleared market from a trader
perspective. The total number of counterparties in the cleared market amounts to 174, in line with
the number of clearing members for the two major CCPs in the EU. In the bilateral market, the
number increases to 55,600 and the distribution of firms’ exposure falls from an average exposure
of EUR 672 billion in the cleared market to EUR 1.4 billion in the bilateral segment. Here most
players have a very concentrated activity level, with 75% of traders active in only one transaction
with one counterparty. One driver is the activity of, for example, a large number of individual
investment funds that only make use of a very limited number of transactions to fine-tune their
interest rate exposure. The distribution of trade activity at trader level confirms the core-periphery
structure of the network: 282 counterparties cover 95% of the overall market exposure. That is
why from now on, we will also focus on these 282 counterparts from a network perspective.
In our sample constituted by these 282 major players, we observe 4,070 links, which implies a
network density of 5%. Hence, only a small share of all possible bilateral links actually exists.
Indeed, for the vast majority of counterparties, there are no direct bilateral links. This indicates
that the aggregate IRS network also exhibits the so-called “small world”properties that have been
documented for other financial networks, as well as a scale-free degree distribution (see Peltonen
et al. (2014) for evidence on a similar structure in the global CDS market).
5.3 Price Data
Additonal problems with data quality preclude us from a fully fledged analysis of the price data.
In particular, after filtering, we have price data only for around 10 % of transactions.
We proceed using the following filters:
• Execution date from July 2017 onward
• Floating rate only EURIBOR 3M or EURIBOR 6M
ECB Working Paper Series No 2242 / February 2019 22
• Centrally cleared transactions
• Maturity only 5 or 10 years
• Drop: No fixed-rate leg data; misreported execution date; upfront payment; inter-dealer and
inter-intermediary trades
• Drop: Price outliers: We calculate the differences of the transaction prices with respect to the
closing price of the day before obtained from Reuters. If the absolute value of this difference
is greater than 150 basis points, the price transaction is dropped. We define this threshold
following Cenedese et al. (2017b)); around n=15,000
This filter procedure leaves us with a data set consisting of 30,775 transactions, which we use to
test Hypothesis 6.
We report summary statistics of price differences in Table 4. We show the distribution of the
differences of the transaction prices with respect to the closing price obtained from Reuters when
we do not distinguish between the initiator of the trade and the non-initiator. This distribution is
centered on zero (i.e., the median is very close to zero for all traders for all the different contracts).
For intermediaries, the dispersion for the 10-year IRS is also very small; more than 50% of the
transactions ranges between -1.95bp and 1bp around the Reuters rate. In contrast, for dealers and
other banks, the dispersion is about 12bp, with a significant negative skewness.
6 Results
In this section we investigate the hypotheses described in Section 2.
6.1 Hypothesis 1: In the IRS market, trading is focused on standardised prod-
ucts.
We first investigate the concentration on standardised products by exploring the distribution of the
trade frequency and volume across cash flow contract structure, maturities, and currencies. Figure
1 plots these distributions. Figure 1 shows that both in terms of number of trades and volume, the
fixed-floating contract is the most common; in terms of currency, the euro is the most common;
and in terms of maturities, the “typical”(i.e., the most commonly traded) IRS contract in the Euro
area market has a maturity of 5 or 10 years.
ECB Working Paper Series No 2242 / February 2019 23

Floating-floating and fixed-fixed swaps are far less common. We observe roughly 20,000 fixed-fixed
contracts (1%), out of which 13,613 are cross-currency, with 25% of the cross-currency transactions
for the EUR-USD currency pair. This empirical evidence confirms our Hypothesis 1: In the IRS
market, trading is focused on standardised products. As regards the execution date of the trades in
our sample, half of the transactions have been executed from 2016 to the sample cut-off in March
2018. This concentration in shorter maturities may also be due to back-loading of trades in the
TRs and the clearing obligation, which creates incentives for clearing members to also novate their
old trades to the CCP to obtain the netting benefits (cf. Duffie et al. (2015)). The impact of the
clearing obligation in defining the cleared versus bilateral market is visible when comparing the
two columns in Table 2: Non-cleared contracts are indeed from older vintages: half of them were
executed by 2015. Most recent transactions tend to be cleared: 25% were executed from 2015 to
2017, and 50% of them were executed during the last year.
In sum, we find that trading activity is concentrated in standardised IRS transactions and largely
cleared in the most recent period (about 81%).
6.2 Hypothesis 2: Network structure:
2a) The core of the network in the IRS market is constituted not only by
dealers but also by other major banks: intermediaries.
2b) Non-banks are typically located in the periphery of the network.
2c) The core of the network is non-specialised whereas the periphery is
specialised.
In Hypothesis 2, we move from the transaction-level view of our dataset to the aggregated (i.e.,
firm-level) analysis. Here, we apply a network perspective to analyse “who trades with whom.”
We show a stylized chart of the network with all major categories of firms in our sample in Figure
2, from the perspective of the ECB-supervised euro area banks. It clearly illustrates the dominant
role of CCPs and core firms. As of March 2018, 62% of the total gross notional of SSM banks was
concentrated in global CCPs.
To investigate the concept of dealer and understand who is actually performing a dealer function
in the IRS market with similar trading characteristics, although not officially defined as dealers,
ECB Working Paper Series No 2242 / February 2019 24
we calculate an index based on the number of different types of contracts traded by the firms
in our sample. We divide the type of contracts into 27 different categories based on currency,
maturity, and cash flows exchanged (fixed, floating) 15. We compute for each trader the number of
transactions in each category: we create a dummy equalling 1 if the counterparty traded at least
once on that type of contract, and 0 otherwise. We obtain an index with values from 1 to 27,
where 1 is a highly specialized counterparty trading only one type of contract (e.g., EUR 10-year
Fixed-Floating), whereas a value of 27 indicates that a firm is acting as intermediary by trading all
possible types of IRS contracts contained in our sample. Results are displayed in Table 6, where
we show that not only dealers but also some major non-dealer banks act as intermediaries, trading
all different types of IRS. The index shows that 10 firms, which do not belong to the dealer group,
nevertheless are active in all subsegments of the euro area IRS market. Hence, as Table 6 shows,
the total group of core firms consists of 16 dealers (4 from the euro area) plus 10 intermediaries (6
from the euro area) plus 11 CCPs (the latter by construction situated in the core of the network
due to their high interconnectedness). In the periphery of the network, we find in the category
“other banks” 46 firms, then 87 other SSM banks (i.e., smaller banks domiciled in the euro area),
14 insurers / pension funds, and 98 other non-banks (note that we have a cutoff at 95% equal to
n=282 of the total sample to improve the presentation in the tables and charts).
Following this approach and treating non-dealer intermediaries as a separate category situated
between the categories of dealers and SSM banks, respectively, we compare in Table 6 other major
dimensions of market activity. We are interested in variables that can help us identify new categories
of traders playing important roles in the market. From the magnitude of the average exposure for
dealers, intermediaries, and SSM banks, we can see how dealers and intermediaries report average
gross exposure which is far higher than in other categories. This difference is particularly striking
for dealers: for dealers we observe a total gross notional of EUR 80.3 trillion. For intermediaries
in the euro area, the amount is 14 trillion, and for non-euro area intermediaries, the amount is 1.2
15 The 27 categories are: EUR 5yrs FixFloat, EUR 10yrs FixFloat, EUR other maturities FixFloat, EUR 5yrsFixFix, EUR 10yrs FixFix, EUR other maturities FixFix, EUR 5yrs FloatFloat, EUR 10yrs FloatFloat, EUR othermaturities FloatFloat, USD 5yrs FixFloat, USD 10yrs FixFloat, USD other maturities FixFloat, USD 5yrs FixFix,USD 10yrs FixFix, USD other maturities FixFix, USD 5yrs FloatFloat, USD 10yrs FloatFloat, USD other maturi-ties FloatFloat, Other currencies 5yrs FixFloat, Other currencies 10yrs FixFloat, Other currencies Other maturitiesFixFloat, Other currencies 5yrs FixFix, Other currencies 10yrs FixFix, Other currencies Other maturities FixFix,Other currencies 5yrs FloatFloat, Other currencies 10yrs FloatFloat, and Other currencies Other maturities Float-Float.
ECB Working Paper Series No 2242 / February 2019 25
trillion. For other SSM banks that are clearing members, the amount is 11.1 trillion, and for SSM
banks that are non-clearing members, the amount is 7 trillion. In terms of notional magnitude, non-
banks are far less active. The ranking according to gross notional is also reflected in the measures
of net notional. Our index, therefore, allows us to interpret the observed volume of trading and
number of counterparties, both indicators previously used to identify institutions that are at the
core or in the periphery of a network.
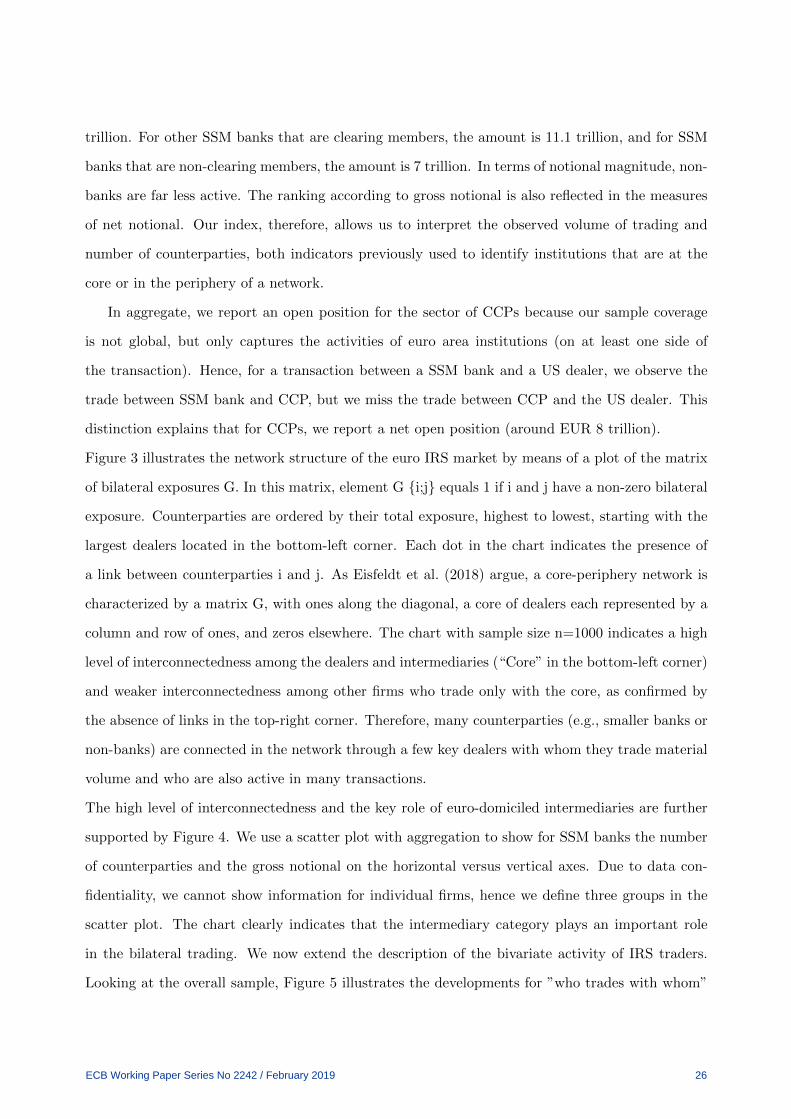
In aggregate, we report an open position for the sector of CCPs because our sample coverage
is not global, but only captures the activities of euro area institutions (on at least one side of
the transaction). Hence, for a transaction between a SSM bank and a US dealer, we observe the
trade between SSM bank and CCP, but we miss the trade between CCP and the US dealer. This
distinction explains that for CCPs, we report a net open position (around EUR 8 trillion).
Figure 3 illustrates the network structure of the euro IRS market by means of a plot of the matrix
of bilateral exposures G. In this matrix, element G {i;j} equals 1 if i and j have a non-zero bilateral
exposure. Counterparties are ordered by their total exposure, highest to lowest, starting with the
largest dealers located in the bottom-left corner. Each dot in the chart indicates the presence of
a link between counterparties i and j. As Eisfeldt et al. (2018) argue, a core-periphery network is
characterized by a matrix G, with ones along the diagonal, a core of dealers each represented by a
column and row of ones, and zeros elsewhere. The chart with sample size n=1000 indicates a high
level of interconnectedness among the dealers and intermediaries (“Core” in the bottom-left corner)
and weaker interconnectedness among other firms who trade only with the core, as confirmed by
the absence of links in the top-right corner. Therefore, many counterparties (e.g., smaller banks or
non-banks) are connected in the network through a few key dealers with whom they trade material
volume and who are also active in many transactions.
The high level of interconnectedness and the key role of euro-domiciled intermediaries are further
supported by Figure 4. We use a scatter plot with aggregation to show for SSM banks the number
of counterparties and the gross notional on the horizontal versus vertical axes. Due to data con-
fidentiality, we cannot show information for individual firms, hence we define three groups in the
scatter plot. The chart clearly indicates that the intermediary category plays an important role
in the bilateral trading. We now extend the description of the bivariate activity of IRS traders.
Looking at the overall sample, Figure 5 illustrates the developments for ”who trades with whom”
ECB Working Paper Series No 2242 / February 2019 26
before and after the clearing obligation started in June 2016. We observe that market activity be-
came concentrated around dealers and CCPs after the start of the clearing obligation. Almost all
categories shrink their exposures with respect to the dealers, with the consequent concentration of
most market exposure in the hands of a few traders (dealers and CCPs). We also observe that - in
part mechanically - CCPs’ contribution is steadily increasing. Also due to the clearing obligation,
activity with CCPs has increased from 66% in the pre-clearing obligation period (from 2000 to
2016 included, considering that the obligation came into force for most traders in 2016) to 81% in
the post-clearing obligation period (2017 and 2018, with data up to March only). The dealer-CCP
segment has - in relative terms - witnessed the biggest increase with respect to the overall market,
while in all other segments both bilateral and cleared activity is narrower than the dealer-CCP
share in the market. Therefore the IRS market’s structural dependence dealers is still evident,
despite CCPs’ increased activity. In parallel, dealers also play a pivotal role as major clearing
members (see, e.g., Lin and Surthi (2013) for an illustration of the key role of G-SIBs in major
global CCPs). The mutualisation of default resources in CCPs implies that the dealer counterparty
credit risk is a strong determinant of the CCPs resilience, as the CCPs’ own financial resources are
typically modest. Thus, the soundness of dealers’ solvency and liquidity positions continues to be
essential for safeguarding the stability of the OTC market overall.
In sum, our analysis confirms that the IRS network is not just concentrated around dealers, but
that intermediaries do indeed play an important role as well.
We complete the analysis of Hypothesis 2 (a, b, and c) with a regression analysis to test whether
the activity of the financial institutions grouped in a subset of 10 categories are indeed statistically
different. We start by investigating market activity on a cross-sectional perspective using an OLS
estimation model. The regression specification is
Trade Activityk = α+ βj ∗X + εk (1)
Where the dependent variable Trade Activityk, is equal to the total gross notional (natural log
value) of firm k, βj is the dummy for category j of the trader k, and X is a dummy interaction
variable to separate dealers and intermediaries domiciled in the euro area vs non-euro area dealers
and intermediaries, or other banks and non-banks that are clearing members versus non-clearing
ECB Working Paper Series No 2242 / February 2019 27

members. Total exposure, expressed as the log value of the gross notional, is computed by aggre-
gating the gross notional of all open positions for the fully identified counterparties (271 traders,
excluding the CCPs) in our sample.
Predictor variables in our first specification are dummy variables for each of the categories that
we distinguish in the market. The dummy is 1 if the counterparty belongs to that category and
0 otherwise. To understand market structure more precisely, we interact the categories with ad-
ditional dummy variables equal to 1 if the Dealer or Intermediary belongs to the euro area, and
a dummy variable equal to 1 if the SSM banks, other banks, and non-banks are clearing mem-
bers. Our reference category is “SSM banks that are not clearing members.”We focus on dealers
and intermediaries in the euro area because this group is particularly significant if we consider the
EMIR reporting obligation: it applies to entities established in the EU who enter into, modify, or
terminate certain derivatives transactions. This means that for an EU dealer, the aggregate gross
exposure we can obtain from EMIR data represents the full picture of the dealer in the IRS market,
whereas -as mentioned earlier- for US dealers, we only observe their activity in the Euro IRS market
with EU counterparties, therefore generating a partial sample of a US dealer’s trading activity in
IRSs. Finally, investigating the network structure by means of OLS estimation allows us to test
the statistical significance of this new category that we identify and define as Intermediaries.
Table 7 shows the results of our baseline regression of gross notional exposure on the different cate-
gories of market traders. Column 1 of Table 7 shows that dealers as well as SSM clearing members
have a larger gross notional amount than SSM non-clearing members. Moreover, clearing members
in general have a larger gross notional amount, so they are more active than firms that are not
clearing members. This analysis confirms the results from the summary statistics and shows that
the relevance of dealers and intermediaries is not driven by a single institution, but statistically,
the single dealers and clearing members indeed represent a level of activity that is far larger than
the others’ activities.
Moving from column 1 to column 2 of Table 7, we now distinguish between dealers and interme-
diaries, as the latter seem to have an important role as well in the IRS markets. The regression
confirms that this group of major non-dealer banks has a significant market activity. The coef-
ficients indicate that the intermediaries have a level of activity similar to dealers - non-EMU in
the euro area IRS market. Indeed, the separate identification of this category is accompanied by
ECB Working Paper Series No 2242 / February 2019 28
an increase in the R-squared of the regression. Since the coefficient for intermediaries-euro area is
lower than for dealers-euro area and higher than SSM banks-clearing members, we use the F-Test
to test (1) that the trade activity of euro area dealers = euro area intermediaries; and (2) that
the trade activity of euro area intermediaries = SSM banks clearing members 16. The results of
the F-Test indicate that (1) we can reject the equality hypothesis (i.e., euro area dealers 6= euro
area intermediaries); and (2) we can also reject the equality hypothesis for intermediaries and SSM
banks. To correctly interpret the results and the magnitude of the single traders, we need to keep
in mind that the category “Dealers - Euro area” contains 4 banks, “Intermediaries - Euro area”
contains 6 banks, and “SSM banks - clearing members” contains 28 banks. These findings pro-
vide further support to our hypothesis that the new category of major non-dealer banks acting as
intermediaries is indeed a combination of the profiles of G-16 Dealers and SSM banks - clearing
members, constituting itself as a second-level-core, which is located between the “traditional” core
represented by the G-16 Dealers and the periphery of smaller banks and non-banks.
In sum, the regression analysis therefore confirms Hypothesis 2a and 2b (i.e., that dealers and
intermediaries are at the core of the network and that non-banks are largely at the periphery of
the network).
With the same methodology, we now test Hypothesis 2c (i.e., whether banks are non-specialized,
whereas non-banks are specialised). As discussed earlier in the context of Figure 1, trading in
the IRS market is focused on standardised products. As a next step in the structural analysis,
we move toward an investigation of trader specialization. We focus on two key dimensions of the
concentration of a firm’s trading activity: (i) maturities and (ii) currencies.
In this section, we use the regression approach introduced above to investigate specialization at
firm level. In particular, we study whether some groups of firms focus on only certain types of
IRSs. Given that in our sample, the complete picture of trade activity is only available for EMU
financial institutions, we concentrate on the subsample of the 148 banks. The dependent variable
(gross notional) is divided into 12 different types of contracts based on the cash-flow structure
(fixed/floating, floating/floating, fixed-fixed) and four maturities buckets (1-3yrs, 4-6yrs, 9-11yrs,
and others). Since our database focuses on firms from the euro area, by construction there is a
16We do not distinguish clearing members from non-clearing members in the dealer and intermediary categoriesbecause the firms in these two categories are all clearing members.
ECB Working Paper Series No 2242 / February 2019 29

concentration on EUR-denominated contracts, and therefore we perform three different regressions
for three types of currencies: (i) EUR, (ii) USD, and (iii) others. In particular, we run the following
regression:
Trade Activityk,y,i = α+ βj +My + βj ∗My+ εk,y,i (2)
Where:
TradeActivityk,y,i = Total gross notional of trader k on a specific contract maturity bucket y (1-3
yrs, 4-6yrs, 9-11yrs and others) and cash flow structure i (fixed/floating, floating/floating, fixed-
fixed)
βj = Dummy for category j of traders
My = Dummy for the maturity buckets y
In order to avoid any bias in this regression due to structural features in the dataset, we consider
only the period from April 2017 to March 2018 (specifically to avoid overestimation on contracts
with longer maturities), and we eliminate contracts expiring in the next few months. The reference
group in this specification is constituted by SSM banks (i.e., smaller banks domiciled in the euro
area that are neither dealers nor intermediaries).
The estimates for the regression coefficients are reported in Table 8. Columns 1, 2, and 3 of Table
8 show the results for the three different currency buckets in which we divided the total gross no-
tional, respectively: gross exposure for contracts in EUR, in USD and in all other currencies. Table
8 shows that overall, there is a different specialization in maturities among the three currencies. For
EUR-denominated IRSs, there is a concentration on five years; for USD IRSs, the concentration
is more on the one-to-three years and the five years. For the other currencies, there is no specific
maturity that dominates.
Dealers report higher exposures on standard 10-year-maturity contracts in EUR and USD con-
tracts, while for the other contracts, there is no particular specialisation. Intermediaries do not
seem to be specialised in any maturity, which is consistent with their function of intermediation
in the market. The category “other banks”is more focused on currencies other than EUR, with a
predominance of 10 year-contracts traded in other currencies and very short-term contracts traded
ECB Working Paper Series No 2242 / February 2019 30

in USD.
For robustness, we perform a similar regression by grouping all the contracts in the different ma-
turity buckets and investigate whether dealers show a specialisation on currencies. The analysis
shows that dealers are not significantly specialised in a particular currency, and that intermediaries
are more specialised in the EUR currency (results are provided upon request).
6.3 Hypothesis 3: In absolute as well as relative terms holders of net IRS
exposure are located both in the core as well as in the periphery of the
network.
The granular nature of our data set allows us to study in detail the structure of net exposures. In
particular, we now investigate the flow of interest rate risk as it is captured by the cash flow structure
and risk-return tradeoff of plain-vanilla IRS. We are aware that a net IRS exposure might indicate
a proprietary position, a hedging position of other balance-sheet exposures, or a client exposure.
As Hoffmann et al. (2017) show, the composition of a bank’s mortgage book, in particular the share
of fixed-rate versus floating-rate exposures, is a key factor for the structure of a bank’s interest rate
risk. They also find that euro area banks’ derivative positions reduce their balance-sheet IR risk
exposure by around 25% on average. For our global sample of banks, there are no consistent and
reliable publicly available measures of interest rate risk. Therefore, we cannot pursue the analysis
of the disaggregated firm-specific motivation for IRS trading further. In particular, the lack of data
precludes us from disentangling the hedging of balance-sheet positions, proprietary trading, and
position taking for third parties. Our methodology, which is closely determined by the limitations
of the dataset, does not allow us to distinguish these motives for IRS trading in detail. Nevertheless,
our analysis is per se important because it allows us to investigate who is taking either the fixed
or floating interest rate risk in this market and is therefore potentially affected by margin calls in
case of sizable shocks on the level or volatility of interest rates.
Given their vital role as market makers, dealers typically run matched positions. In essence, their
business model is oriented toward intermediation rather than outright retention of interest rate
risk. Dealers (and intermediaries) are therefore both buyers and sellers and generate a complex
network of exposures. This interconnected series of risk transfers among market players creates a
ECB Working Paper Series No 2242 / February 2019 31

mechanism that the literature discusses as a “flow of risk”(cf. Battiston et al. (2018)).
In the previous sections, we have already reported the summary statistics for the net exposure across
categories, both in terms of distribution across traders (Table 5) and aggregate values (Table 6).
We now implement the concept of risk absorption to study the flow of risk in the IRS market.
For this purpose, we compute the ratio of net over gross notional. Table 6 shows that the sum
of the net exposures is positive and equal to EUR 12 trillion for dealers and negative for all the
other categories. The second-largest net exposure in absolute terms is represented by CCPs and
is equal to 7.9 trillion, indicating that there is a significant flow of risk that is matched by non-
euro financial institutions. The third-largest category consists of the intermediaries from the euro
area and the fourth is non-banks with, respectively, EUR 1.3 trillion and 1 trillion. However, the
ranking is quite different if we consider the net over gross notional ratio, where, among the euro
area financial institutions, those with the largest ratio are non-banks and other banks that are
non-clearing members, indicating that their positions are more directional. A detailed description
of the distribution of the net over gross ratio is reported in Figure 6 for all 282 firms included in the
analysis. Figure 6 shows that the institutions with the largest net/gross ratio are the other banks
and non-banks showing both a positive and a negative large net over gross ratio, and those with
a net over gross ratio close to zero are dealers, intermediaries, CCPs, and insurance companies.
Hence, the large net notional volumes that we observe for dealers are to a large part due to their
large gross notional exposures. In this context, we also highlight a structural difference with IRSs
compared to other OTC derivatives such as CDS. As Bellia et al. (2017) illustrate, in the CDS
market, dealer absolute net exposure is far lower than almost all other market participants, even if
their gross notional is several times larger than all other market participants.
We use the regression setup introduced above to test the nature of the flow of risk. In particular,
we try to detect which categories function as risk absorbers in the euro area IRS market. For this
purpose, we focus on two measures:
• The ratio of net divided by gross notional which indicates how much each trader is exposed
on one side (fixed / floating) with respect to its overall exposure;
• The absolute value of the net notional.
ECB Working Paper Series No 2242 / February 2019 32
By using these two dependent variables, respectively reported in column 1 and 2 of Table 9, we
can study the risk absorption, both at trader level and also at the level of the market overall. The
specification of the baseline regression on risk absorption is
Net Exposurek = α+ βj ∗X + εk (3)
Where Net Exposurek is, for the first regression, the ratio computed as the net notional over the
gross notional for every trader k, in absolute value; and for the second regression, the aggregate
net notional in absolute value; βj are dummies for the different categories of traders in which the
market is divided and X is a dummy interaction variable that separates dealers and intermedi-
aries domiciled in the euro versus non-euro area, or other banks and non-banks that are clearing
members as opposed to non-clearing members. In contrast to the previous setup, we now split the
non-bank category, separating insurance companies and pension funds from the other non-banks.
The motivation for this approach is that we expect these two subcategories to have different risk
profiles due to the different natures of their businesses.
The results are reported in Table 9. The first column of Table 9 shows that the net/gross notional
ratio for dealers EMU is in the lower part of the range and roughly similar to positions for dealers
outside the euro area and intermediaries from the euro area. We find similar results for SSM banks
that are clearing members as well as for insurance companies and pension funds. This means that if
we normalize by trading activity, traders with larger net/gross notional ratio are SSM non-clearing
members, and other banks. The coefficient for dealers EMU is now less significant and lower (i.e.,
it is less negative compared with the other categories, suggesting a higher net over gross exposure).
Moving from the trader perspective to a broader perspective with the regressions dependent vari-
able expressed as the net notional in absolute value in column 2 of table 9, we observe that the
dealers and intermediaries remain the most significant traders, bearing the bulk of the IRS market
exposure.
In sum, these results allow us to accept our Hypothesis 3. We confirm that net notional exposures
are located both in the periphery, where smaller entities are more exposed, but at the same time,
the mass of market exposure remains in the core where dealers (also due to their larger gross no-
tional) are more exposed than other major firms.
ECB Working Paper Series No 2242 / February 2019 33

6.4 Hypothesis 4: Bank size explains a bank’s market activity.
The use of IRSs is also closely linked to the size and composition of a bank’s balance sheet. In
particular, large banks and those who hold a large fraction of their assets in loans, bonds, or de-
posits for which hedging of interest rate risk is necessary from a business-model perspective, might
be very active in the IRS market. In this section, we add bank size, expressed as total assets (in
log value), to our set of explanatory variables and investigate to what degree market activity is
explained by differences in size.
We therefore add the bank size to the regression equation (1). The baseline regression is now
Yk = α+ βj ∗X +BAk + εk (4)
Where Yk is the dependent variable considered in equations 1 and 4 (i.e., log of gross notional,
absolute net over gross ratio exposure, log of absolute value of the net notional exposure). BAk
is the log of total assets of bank k as of the end of 2017. For this specification, the number of
observations is smaller than in the previous regression analysis because balance-sheet data were
not available for all banks, and in particular, there are no comparable data for non-banks (e.g.,
hedge funds). Results are reported in Table 10.
The first column of Table 10 shows that banks with larger balance sheets also have a higher exposure
to IRSs. The coefficient is positive and significant at the 1% level. Indeed, after introducing the log
of total assets in our regression, we can see how only three categories keep their significance with
respect to the reference group: Dealers - Euro area, Intermediaries - Euro area, and SSM banks
- clearing members. The other categories have now become insignificant and their differences in
trading activity are largely driven by their differences in size. Column 2 of Table 10 illustrates the
role of bank size on the net over gross exposure ratio. As expected, log of total assets is not any
more significant, and results are similar to those already presented above. In column 3, we also
investigate whether the absolute differences in net exposure are driven by bank size. The regression
results show that the coefficient for log of total assets is significant and positive, and that only the
coefficient of dealers and intermediaries remains significant, indicating that the net exposure for
ECB Working Paper Series No 2242 / February 2019 34

the other institutions is largely driven by bank size. Finally, as a robustness check, we divide the
net exposure by bank size, confirming that the only difference in this ratio refers to dealers and
intermediaries.
In sum,we can accept Hypothesis 4 on the role of banks’ size data explaining the structure of market
activity. Nevertheless, bank size cannot explain the important role of dealers and intermediaries in
the IRS market.
6.5 Hypothesis 5: Basel III capital and liquidity ratios:
5a) Bank capital (measured by CET1 / risk-weighted assets) and liquidity
(measured by liquid assets / total assets) ratios are positively related to
a bank’s gross and net notional.
5b) Banks’ leverage ratios (as measured by CET1 / total exposures) are
positively related to their IRS market activity.
In the analysis so far, we have documented that dealers and intermediaries play an important role
in the IRS market in terms of trading activity and net exposure and that their role is not completely
explained by the size of their balance sheets. We now investigate the role of Basel III capital and
liquidity ratios in influencing trading activity.
We extend the previous specification by adding three explanatory variables derived from bank
balance-sheet data, namely liquidity ratio (SNL variable “Liquid Assets”divided by total assets),
CET1 ratio, computed as CET1 capital over risk-weighted assets, and the leverage ratio (fully
loaded CET1 and additional tier 1 capital divided by total leverage exposure)17. We then inter-
act the leverage ratio and total assets variables to investigate their combined effect. Our fifth
specification is:
Trade Activityk = α+ βj +BAk +RWCk + LRk + Lk + Lk ∗ BAk + εk (5)
Where the LHS remains the same as in the previous specification, RWCk is the risk-weighted
capital ratio, LR the liquidity ratio, and L the leverage ratio for bank k as of the end of 2017. and
Lk ∗ BAk is the variable generated by interacting the leverage ratios with banks’ total assets.
17Source for all balance-sheet data is SNL.
ECB Working Paper Series No 2242 / February 2019 35

Table 11 shows the results of this set of regressions. Comparing the liquidity ratio and leverage
ratio, only the second one is significant for the gross exposure prediction. The negative sign sug-
gests that banks’ leverage ratios (as measured by CET1 / total exposures) are negatively related
to their IRS market activity. This is an additional effect caused by including in the denominator a
more coarse measure of the derivatives exposure. Therefore, banks that are more active in trading
derivatives (especially derivatives with large notionals, such as IRSs) have lower leverage ratios (as
confirmed by Table 6). To better understand the impact of banks’ leverage ratio on IRS trading
activity, we interact the leverage ratio with bank size. This interaction coherently suggests that
banks with lower leverage (i.e., higher capital to total assets) are more active in IRS.
To further ivestigate our hypothesis on the role of capital and liquidity, we use an F-test to check
the equality hypothesis of “euro area dealers versus euro area intermediaries”and the equality hy-
pothesis of “euro area intermediaries versus SSM banks.”This time, we cannot reject the equality
hypothesis for dealers and intermediaries, but we reject the equality hypothesis for intermediaries
and SSM banks. The result suggests that IRS market activity is not significantly related to a
bank’s liquidity, whereas capital indeed plays a significant role. While, as tested before, in terms of
trading activity, intermediaries represent a hybrid category between SSM banks and dealers, when
including balance-sheet variables, we find that their activity is more similar to dealers than to SSM
banks.
In sum, the regressions in this section confirm the findings by Acosta-Smith et al. (2018) or Haynes
et al. (2018) on the leverage ratio as a factor which may restrict bank participation in the OTC
derivatives markets.
6.6 Hypothesis 6: There is no material dispersion of transaction prices for
Dealers vs. Intermediaries and Basel III capital and liquidity ratios can
explain price dispersion.
In this section, we investigate whether price differences (already briefly discussed earlier) depend on
trader category (i.e., whether the firm is a dealer, an intermediary or a smaller bank) and depend on
the trader’s side in the transaction (if the firm is the initiator and is paying fixed or receiving fixed
ECB Working Paper Series No 2242 / February 2019 36
interest rate). We identify the “initiator”based on the assumption that the initiating party has to
offer an incentive for a counterparty to enter into the trade. Therefore, if the reported price in our
dataset is higher than the reference price (Reuters’ official rate), we assume that the counterparty
paying fixed (i.e., the buyer) was the initiator of the trade (and vice versa).
The statistics reported in Table 4 provide a simple description of pricing dynamics, but they omit
that the transaction price should be affected if the buyer or the seller is an initiator or not (i.e.,
will pay or receive the bid and the ask price). Therefore, this simple analysis is biased because we
do not consider the difference in the price when the trader initiates the trade (and pays the ask or
receives the bid) or when it is not initiating the trade and therefore gets the best conditions (i.e.,
pays the bid or receives the ask).
Table 12 shows the descriptive statistics of price difference for the above-mentioned subsegments.
We observe that, in terms of univariate statistics, intermediaries have both a better mean and
median price difference than the dealers. This result also applies to other banks. The finding is
robust when the initiator is paying or receiving the fixed interest rate. It seems that the market
power of dealers does not translate in a material price advantage. Indeed, on average, when they
initiate a contract where they are buyers and therefore pay a fixed rate, the average transaction
price exceeds the floating rate and is higher than the prices that other categories propose when
they initiate a contract as buyers. Intermediaries benefit from lower price dispersion, lower fixed
rates payed, and lower fixed rate received. On the other side, the price spread for the trader who is
not the initiator is also lower than the one charged by dealers; therefore these differences might be
due to aspects that the simple statistical univariate analysis could not capture (e.g., the type of the
contract, the size of the transaction, and so on). For this reason, we analyse the price dispersion
using regression analysis, which builds on the specifications which we used to analyse notionals.
Our specification for the regression price analysis is:
Price Differencei,k,t = α+ βj + Vi,k,t +BAk +RCk + Gt +Hy + εk,t (6)
Where the Price Differencei,k,t of contract i, by trader k at time t
βj = indicates that the trader is a dealer, an intermediary, or another bank. For the price analysis,
we consider only euro area dealers and intermediaries because of price data quality and availability.
ECB Working Paper Series No 2242 / February 2019 37
Vi,k,t=is the log of the volume of the contract i, made by trader k at time t
BAk = is the logarithm of total assets of the trader k.
RCk = is a vector of the Basel III capital and liquidity ratio: RWCk, LRk, Lk
Gt = is the daily time fixed effect
Ht = is the contract fixed effect: Euribor3m to 5 years, Euribor 3m to 10 years, Euribor 6m to 5
years or Euribor 6m to 10 years
We estimate four regressions by distinguishing between initiators and non-initiators, and between
paying fixed and receiving fixed interest rates. Results are reported in Table 13.
Column 1 reports the results of the regression when the trader is initiating the trade and paying a
fixed interest rate. In this specification, we do not find any significant difference in the price paid by
the trader if it is a dealer, an intermediary, or another bank. The difference in price is largely driven
by the volume of the individual transaction: larger transactions have a lower interest rate paid by
the trader who initiates the trade. Bank size, in this case, is not highly relevant, and also the Basel
III capital and liquidity ratios are almost insignificant. Only the leverage ratio is significant and
negative, indicating that firms with larger capital over total exposure ratios could afford to take
these positions and get a better price. In column 2, we report the regression analysis when the
trader is initiating a transaction and receiving a fixed interest rate. In this case, the dependent
variable is negative. Here, both dealers and intermediaries are able to receive a fixed interest rate
that is better than other banks’, with a coefficient that is slightly better for the dealers. However,
the dealers’ coefficient is significant only at the 10% level, indicating high variability. Instead,
the coefficient on intermediaries is significant at the 5% level, and therefore has a lower level of
variability. Larger transactions also benefit from better conditions on rates. Bank size is also
not strongly significant. Among the Basel III ratios, the leverage ratio seems to be most relevant,
indicating that, again, banks with more capital over total exposure are able to receive a better fixed
interest rate. The other two columns investigate the cases wherein the trader is not initiating the
trade; these columns are largely symmetric to the previous two columns given that, in a significant
part of the transactions, they just mirror the previous two regressions.
In sum, we find that, from a pricing perspective as well, intermediaries are important traders in
the IRS market and might in some cases even get better pricing than dealers. Moreover, Basel III
capital and liquidity ratios matter as determinants of price dispersion. There is also some evidence
ECB Working Paper Series No 2242 / February 2019 38

that banks tend to transfer the larger costs of capital from their transactions on the IRS market
to counterparties. In particular, banks with potential leverage ratio constraints tend to charge a
higher price or - symmetrically - banks with lower leverage constraints might offer a better price
to their counterparties.
7 Robustness and Additional Results
In this section, we start by showing two tables produced with the aim of checking the robustness
of our results. To confirm the robustness, we use three approaches:
First, we re-estimate the baseline regression with the sample for September 2017 rather than March
2018. Table 14 shows the results. We can clearly see that the categorization of banks and non-banks
into the different groups used in our analysis holds even when considering a different point in time
(i.e., from 1970 to September 2017, in this check).
Second, we re-estimate the baseline regression of the distribution of risk absorption with fixed-
floating swaps only, thereby dropping the fixed-fixed and floating-floating contracts or contracts
that cannot be clearly defined. Table 15 shows the results. As expected (see Figure 1 for the
concentration of fixed-floating contracts in our sample), the results are confirmed.
Finally, we analyse the impact of dropping noneuro area intermediaries. Table 16 shows the results
of our first baseline regression on trade activity (LHS: log of gross notional) excluding from the
sample the intermediaries that do not belong to the euro area. The results are confirmed.
Table 17 shows the results for specialisation in terms of currencies, and Table 18 summarises the
price data filtering.
8 Conclusions
This paper uses a number of perspectives to investigate the anatomy of the euro area IRS market.
In particular, we explore notional measures as well as observed transaction prices. We move from
the transaction level to the level of aggregate exposures. Our approach provides new evidence to
regulators and policy makers regarding the structure and activity in the IRS market along two
dimensions: (1) risk absorption and (2) the impact of regulatory reforms such as the clearing obli-
gation and the role of Basel III capital and liquidity ratios in influencing trade activity.
ECB Working Paper Series No 2242 / February 2019 39

Overall, we show that on one side, the structure of the market in terms of trading activity is not
just concentrated on a few global dealers. We highlight the relevance of the role of other institutions
(intermediaries) that provide a significant contribution to trading activity. As regards net expo-
sures, we document that our measure of risk absorption is not just concentrated at the periphery
of the network, but also at the core, and this differentiates the IRS market from other OTC deriva-
tives markets like CDS. Moreover, we show that bank size is not the only variable able to explain
differences in trading activity, but Basel III capital and liquidity ratios play a significant role in a
market where counterparty credit risk now has been dramatically reduced due to the mandatory
clearing obligation. In terms of the Basel III capital and liquidity ratios, the leverage ratio has an
important role in explaining trading activity. We find that firms having a larger capital over total
exposure ratio have lower trading activity. This is due to a peculiarity of the small and medium
banks whose leverage ratios often exceed those of larger banks. In contrast, for large banks, differ-
ent leverage ratio levels influence their trading activity. We find that firms having a larger capital
over total exposure ratio have lower trading activity. Our analysis confirms the claims of some
market observers (cf. Haynes et al. (2018)): The leverage ratio imposed by Basel III may provide
a constraint to the trading activity in the IRS market even if it has no direct material effect on
the net over gross ratio. The other Basel III ratios such as risk-weighted capital requirement or
liquidity ratios have no significant effect on explaining trading activities. Regarding net exposure,
the only exception is the risk-weighted capital requirement. Here, a larger ratio is linked to a larger
net exposure on the IRS market.
Finally, our analysis of price dispersion finds that it is still significant even if counterparty risk is
nowadays less relevant due to mandatory central clearing. Dealers and intermediaries are obtaining
similar better pricing when they initiate the trade with asymmetries between paying and receiving
fixed interest rates. We also show that Basel III capital and liquidity ratios affect price dispersion.
We find that those firms with leverage ratio constraints do search more in order to get a better
price if they are large banks. Risk-weighted capital requirements also matter in explaining price
dispersion.
ECB Working Paper Series No 2242 / February 2019 40
References
Abad, J., I. Aldasoro, C. Aymanns, M. D’Errico, L. Fache Rousova, P. Hoffman, S. Langfield,
M. Neychev, and T. Roukny. 2016. Shedding light on dark markets: First insights from the new
EU-wide OTC derivatives dataset. ESRB Occasional Paper, No. 11.
Abbassi, P., and F. Bruning. 2018. The Pricing of FX Forward Contracts: Micro Evidence from
Banks Dollar Hedging. Federal Reserve Bank of Boston Working Paper, No. 18-6.
Acharya, V., M. J. Fleming, W. B. Hrung, and A. Sarkard. 2016. Dealer financial conditions and
lender-of-last-resort facilities. Journal of Financial Economics, pp. 1–27.
Acosta-Smith, J., G. Ferrara, and F. Rodriguez-Tous. 2018. The impact of the leverage ratio on
client clearing. Bank of England Staff Working Paper, No. 735.
Adrian, T., E. Etula, and T. Muir. 2014. Financial Intermediaries and the Cross-Section of Asset
Returns. Journal of Finance .
Andersen, L., D. Duffie, and Y. Song. 2018. Funding value adjustments. Journal of Finance .
Arora, N., P. Gandhi, and F. A. Longstaff. 2012. Counterparty credit risk and the credit default
swap market. Journal of Financial Economics 103:280–293.
Bank for International Settlements. 2017. Semiannual OTC derivatives statistics at end-2016.
Battiston, S., M. D’Errico, M. Scheicher, and T. Peltonen. 2018. How does risk flow in the credit
default swap market. Journal of Financial Stability 35:53–74.
Bellia, M., R. Panzica, L. Pelizzon, and T. Peltonen. 2017. The demand for central clearing: to
clear or not to clear, that is the question. ESRB Working Paper, No. 62.
Benos, E., R. Payne, and M. Vasios. 2016. Centralized trading, transparency and interest rate swap
market liquidity: Evidence from the implementation of the Dodd-Frank Act. Working Paper.
Boyarchenko, N., T. M. Eisenbach, P. Gupta, O. Shachar, and P. Van Tasse. 2018. Bank-
Intermediated Arbitrage. Federal Reserve Bank of New York Staff Reports, No. 858.
ECB Working Paper Series No 2242 / February 2019 41

Brunnermeier, M., L. Clerc, and M. Scheicher. 2013. Assessing contagion risks in the CDS market.
Banque de France, Financial Stability Review, 7:123–134.
Cenedese, G., P. Della Corte, and T. Wang. 2017a. Currency Mispricing and Dealer Balance Sheets.
Working Paper.
Cenedese, G., A. Ranaldo, and M. Vasios. 2017b. OTC Premia. Working Paper.
Cielinska, O., J. Andreas, U. Shreyas, J. Tanner, and M. Vasios. 2017. Gauging market dynamics
using trade repository data: the case of the Swiss franc de-pegging. Bank of England Financial
Stability Paper, No. 41.
Collin-Dufresne, P., B. Junge, and A. B. Trolle. 2017. Market Structure and Transaction Costs of
Index CDSs. Working Paper.
Di Maggio, M., A. Kermani, and Z. Song. 2017. The value of trading relations in turbulent times.
Journal of Financial Economics 124:266–284.
Du, W., S. Gadgil, M. Brody, and C. Vega. 2017. Counterparty Risk and Counterparty Choice in
the Credit Default Swap Market. Working Paper.
Du, W., A. Tepper, and A. Verdelhan. 2018. Deviations from covered interest rate parity. The
Journal of Finance, 73:915–957.
Duffie, D. 2012. Dark Markets: Asset Pricing and Information Transmission in Over-the-Counter
Markets. Princeton University Press .
Duffie, D. 2018a. Over-the-Counter Market Efficiency. Nobel Symposium on Money and Banking,
Stockholm.
Duffie, D. 2018b. Post-Crisis Bank Regulations and Financial Market Liquidity. Baffi Lecture .
Duffie, D., N. Garleanu, and L. H. Pedersen. 2005. Over the Counter Markets. Econometrica,
73:1815–1847.
Duffie, D., N. Garleanu, and L. H. Pedersen. 2007. Valuation in Over-the-Counter Markets. Review
of Financial Studies, 20:1865–1900.
ECB Working Paper Series No 2242 / February 2019 42

Duffie, D., M. Scheicher, and G. Vuillemey. 2015. Central clearing and collateral demand. Journal
of Financial Economics, 116:237–256.
Eisfeldt, A. L., B. Herskovic, E. Siriwardane, and S. Rajan. 2018. OTC Intermediaries. Working
Paper.
Fiedor, P., S. Lapschies, and L. Orszaghova. 2017. Networks of counterparties in the centrally
cleared EU-wide interest rate derivatives market. ESRB Working Paper, No. 54.
Financial Stability Board. 2017. Review of OTC derivatives market reforms: Effectiveness and
broader effects of the reforms. Available at www.fsb.org.
Fleckenstein, M., and F. A. Longstaff. 2018. Shadow funding costs: Measuring the cost of balance
sheet constraints. NBER Working Paper Series, No. 24224.
Getmansky, M., G. Girardi, and C. Lewis. 2016. Interconnectedness in the CDS market. Financial
Analysts Journal 72:62–82.
Glasserman, P., and H. P. Young. 2015. How likely is contagion in financial networks? Journal of
Banking & Finance 50:383–399.
Glasserman, P., and H. P. Young. 2016. Contagion in financial networks. Journal of Economic
Literature 54:779–831.
Hau, H., S. Langfield, and G. Vuillemey. 2017. Discriminatory pricing of over-the-counter deriva-
tives. ESRB Working paper, No. 61.
Haynes, R., L. McPhail, and H. Zhu. 2018. Assessing the impact of the Basel III leverage ratio on
the competitive Landscape of US Derivatives Markets: Evidence from Options. CFTF Policy
Brief .
He, Z., B. Kelly, and A. Manela. 2016. Intermediary asset pricing: New evidence from many asset
classes. Journal of Financial Economics, 126:1–35.
Hoffmann, P., S. Langfield, F. Pierobon, and G. Vuillemey. 2017. Who bears interest rate risk?
ECB Working Paper, No. 2176.
ECB Working Paper Series No 2242 / February 2019 43

Hollifield, B., A. Neklyudov, and C. Spatt. 2017. Bid-Ask Spreads, Trading Networks and the
Pricing of Securitizations. Working Paper.
Hull, J. 2014. Options, Futures, and Other Derivatives. Prentice Hall.
Li, D., and N. Schrhoff. 2018. Dealer Networks. Journal of Finance .
Lin, L., and J. Surthi. 2013. Capital requirements for OTC Derivatives Central Counterparties.
IMF Working Paper No. 13/3.
Loon, Y. C., and Z. K. Zhong. 2014. The impact of central clearing on counterparty risk, liquidity,
and trading: Evidence from the credit default swap market. Journal of Financial Economics,
112:91–115.
Loon, Y. C., and Z. K. Zhong. 2016. Does Dodd-Frank affect OTC transaction costs and liquidity?
Evidence from real-time CDS trade reports. Journal of Financial Economics, 119:645–672.
Manning, M., and D. Hughes. 2016. Central counterparties and banks: Vive la difference. Journal
of Financial Market Infrastructures, 4:1–24.
Oehmke, M., and A. Zawadowski. 2016. The anatomy of the CDS market. Review of Financial
Studies, 30:80–119.
Peltonen, T. A., M. Scheicher, and G. Vuillemey. 2014. The network structure of the CDS market
and its determinants. Journal of Financial Stability, 13:118–133.
Sidanius, C., and F. Zikes. 2012. OTC derivatives reform and collateral demand impact. Bank of
England Financial Stability Paper, No. 18.
Siriwardane, E. 2018. Limited Investment Capital and Credit Spreads. Journal of Finance .
ECB Working Paper Series No 2242 / February 2019 44
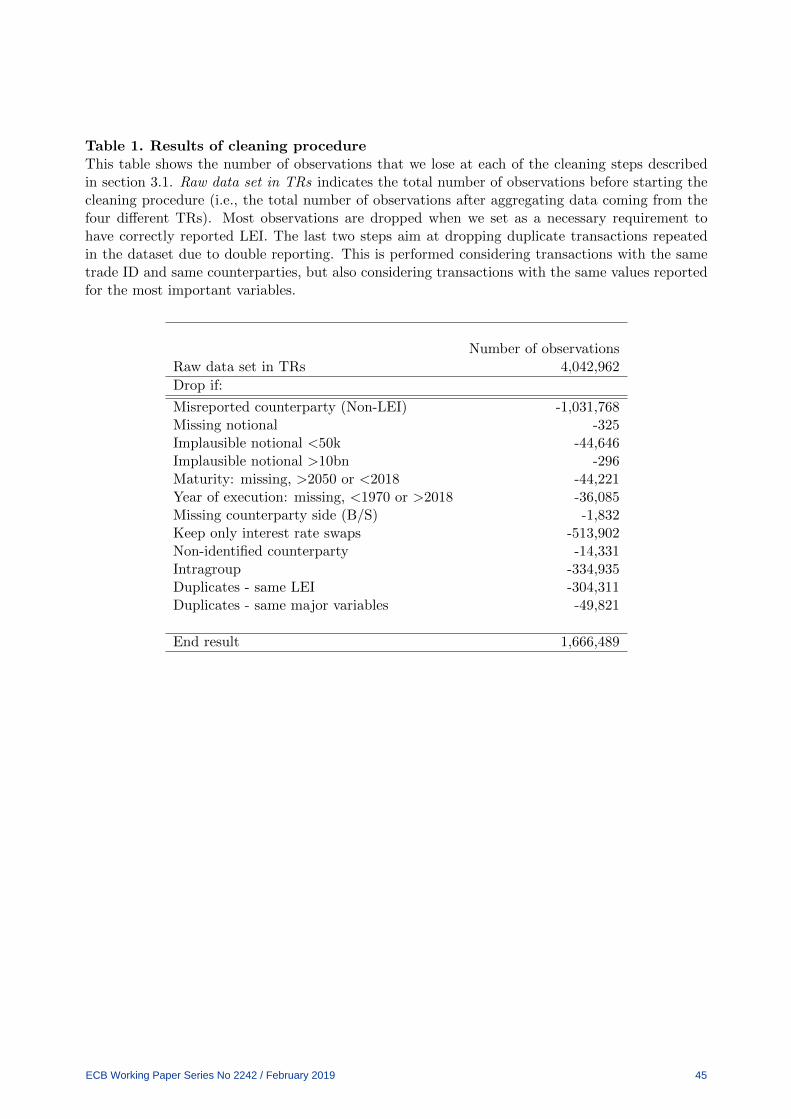
Table 1. Results of cleaning procedureThis table shows the number of observations that we lose at each of the cleaning steps describedin section 3.1. Raw data set in TRs indicates the total number of observations before starting thecleaning procedure (i.e., the total number of observations after aggregating data coming from thefour different TRs). Most observations are dropped when we set as a necessary requirement tohave correctly reported LEI. The last two steps aim at dropping duplicate transactions repeatedin the dataset due to double reporting. This is performed considering transactions with the sametrade ID and same counterparties, but also considering transactions with the same values reportedfor the most important variables.
Number of observationsRaw data set in TRs 4,042,962
Drop if:
Misreported counterparty (Non-LEI) -1,031,768Missing notional -325Implausible notional <50k -44,646Implausible notional >10bn -296Maturity: missing, >2050 or <2018 -44,221Year of execution: missing, <1970 or >2018 -36,085Missing counterparty side (B/S) -1,832Keep only interest rate swaps -513,902Non-identified counterparty -14,331Intragroup -334,935Duplicates - same LEI -304,311Duplicates - same major variables -49,821
End result 1,666,489
ECB Working Paper Series No 2242 / February 2019 45
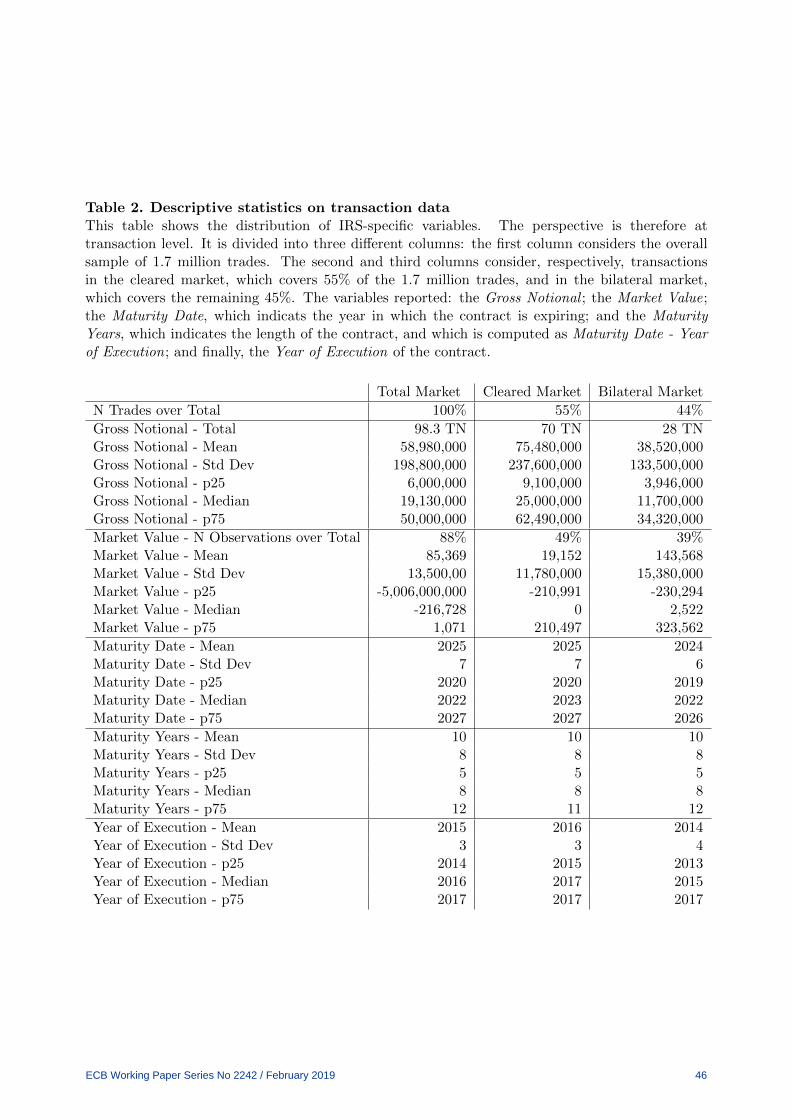
Table 2. Descriptive statistics on transaction dataThis table shows the distribution of IRS-specific variables. The perspective is therefore attransaction level. It is divided into three different columns: the first column considers the overallsample of 1.7 million trades. The second and third columns consider, respectively, transactionsin the cleared market, which covers 55% of the 1.7 million trades, and in the bilateral market,which covers the remaining 45%. The variables reported: the Gross Notional ; the Market Value;the Maturity Date, which indicats the year in which the contract is expiring; and the MaturityYears, which indicates the length of the contract, and which is computed as Maturity Date - Yearof Execution; and finally, the Year of Execution of the contract.
Total Market Cleared Market Bilateral Market
N Trades over Total 100% 55% 44%
Gross Notional - Total 98.3 TN 70 TN 28 TNGross Notional - Mean 58,980,000 75,480,000 38,520,000Gross Notional - Std Dev 198,800,000 237,600,000 133,500,000Gross Notional - p25 6,000,000 9,100,000 3,946,000Gross Notional - Median 19,130,000 25,000,000 11,700,000Gross Notional - p75 50,000,000 62,490,000 34,320,000
Market Value - N Observations over Total 88% 49% 39%Market Value - Mean 85,369 19,152 143,568Market Value - Std Dev 13,500,00 11,780,000 15,380,000Market Value - p25 -5,006,000,000 -210,991 -230,294Market Value - Median -216,728 0 2,522Market Value - p75 1,071 210,497 323,562
Maturity Date - Mean 2025 2025 2024Maturity Date - Std Dev 7 7 6Maturity Date - p25 2020 2020 2019Maturity Date - Median 2022 2023 2022Maturity Date - p75 2027 2027 2026
Maturity Years - Mean 10 10 10Maturity Years - Std Dev 8 8 8Maturity Years - p25 5 5 5Maturity Years - Median 8 8 8Maturity Years - p75 12 11 12
Year of Execution - Mean 2015 2016 2014Year of Execution - Std Dev 3 3 4Year of Execution - p25 2014 2015 2013Year of Execution - Median 2016 2017 2015Year of Execution - p75 2017 2017 2017
ECB Working Paper Series No 2242 / February 2019 46
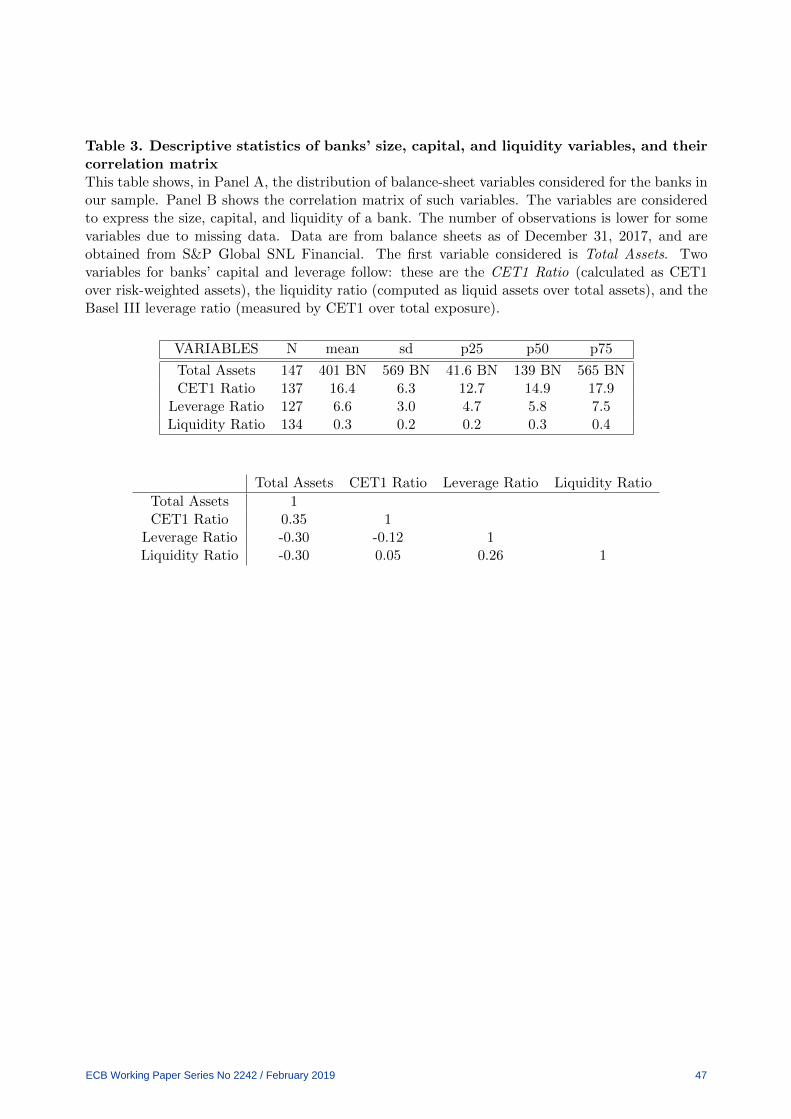
Table 3. Descriptive statistics of banks’ size, capital, and liquidity variables, and theircorrelation matrixThis table shows, in Panel A, the distribution of balance-sheet variables considered for the banks inour sample. Panel B shows the correlation matrix of such variables. The variables are consideredto express the size, capital, and liquidity of a bank. The number of observations is lower for somevariables due to missing data. Data are from balance sheets as of December 31, 2017, and areobtained from S&P Global SNL Financial. The first variable considered is Total Assets. Twovariables for banks’ capital and leverage follow: these are the CET1 Ratio (calculated as CET1over risk-weighted assets), the liquidity ratio (computed as liquid assets over total assets), and theBasel III leverage ratio (measured by CET1 over total exposure).
VARIABLES N mean sd p25 p50 p75
Total Assets 147 401 BN 569 BN 41.6 BN 139 BN 565 BNCET1 Ratio 137 16.4 6.3 12.7 14.9 17.9
Leverage Ratio 127 6.6 3.0 4.7 5.8 7.5Liquidity Ratio 134 0.3 0.2 0.2 0.3 0.4
Total Assets CET1 Ratio Leverage Ratio Liquidity Ratio
Total Assets 1CET1 Ratio 0.35 1
Leverage Ratio -0.30 -0.12 1Liquidity Ratio -0.30 0.05 0.26 1
ECB Working Paper Series No 2242 / February 2019 47

Table 4. Descriptive statistics of price differencesThis table shows the distribution of the differences of the transaction prices with respect to theclosing price obtained from Reuters. We consider only transactions between one counterparty andthe CCP, traded in the period from 2017 Q3 and 2018 Q1. Each row refers to the different floatingrates of the transactions (i.e., Euribor 3 months to 5 years, Euribor 3 months to 10 years, Euribor6 months to 5 years, and Euribor 6 months to 10 years). The three columns differ dependingwhether the transaction is between the CCP and a dealer, an intermediary, or a non-dealer ornon-intermediary bank.
Dealer - CCP Intermediary - CCP Other banks - CCP
p25 p50 p75 p25 p50 p75 p25 p50 p75EU3M5YR -12.06 1.09 15.35 -10.5 0.61 13.25 -10.8 0.9 14.55EU3M10YR -9.76 0.29 8.53 -5.09 0.94 4.94 -8.31 0.53 3.24EU6M5YR -12.82 0.06 4.38 -7.97 0.08 2.24 -13.79 0.1 12.1EU6M10YR -8 -0.35 1.5 -1.95 -0.23 1 -10.33 -0.6 1.1
n 16649 (37%) 11057 (24%) 7724 (17%)
ECB Working Paper Series No 2242 / February 2019 48

Table 5. Descriptive statistics of market activity measures at trader levelThis table shows the distribution of main trade activity measures from a trader perspective. PanelA considers the cleared market, and Panel B the bilateral market. We first indicate the totalnumber of counterparties trading in each market. The other variables are: Gross Notional, NetNotional, Number of Trades and Number of Counterparties. The distribution of each variable iscomputed from a trader perspective, meaning that the mean of the gross notional is the averagegross notional of a trader in the cleared market and in the bilateral market (Panels A and B,respectively).
Cleared MarketTotal n. of counterparties: 174
mean sd p25 p50 p75
Gross Notional 672 BN 4 TN 40 MN 882 MN 46.7 BNNet Notional 107 BN 619.8 BN 7 MN 143 MN 5.1 BNNumber of Trades 8,895 50,814 12 65 928Number of Counterparties 3 11 1 1 2
Bilateral MarketTotal n. of counterparties: 55,611
mean sd p25 p50 p75
Gross Notional 1.4 BN 72 BN 566,658 2.2 MN 15 MNNet Notional 288 BN 132 BN 500 196 MN 11 MNNumber of Trades 32 1.17 1 1 2Number of Counterparties 3 64 1 1 1
ECB Working Paper Series No 2242 / February 2019 49

Table 6. Counterparties’ characteristics based on categorizationThe table shows the sums and means of major characteristics for a counterparty, considering ourallocation of the 282 fully identified counterparties in different categories. For dealers and inter-mediaries, a further distinction is made depending on whether they belong to the EMU (EuropeanMonetary Union) area or not. Dealers are the G-16 Dealers (i.e., the main 16 derivatives deal-ers). Intermediaries is a category defined by us of non-dealers that exhibit similar behaviour todealers and are trading all different IRSs. For SSM banks (banks under the supervison of the Euro-pean Central Bank) and other banks, a further distinction is made between clearing members andnon-clearing members. The last three categories are non-banks, and then in a separate category,insurance companies and pension funds, and finally, the category including all CCPs. Each categorycontains the following number of counterparties: dealers 16, intermediaries EMU 6, intermediariesnon-EMU 4, SSM banks clearing members 28, SSM banks non-clearing members 59, other banksclearing members 18, other banks non-clearing members 28, non-banks 98, insurances and pensionfunds 14, CCPs 11.
Net Net overGross Net Gross Notional Gross ratio N. of Index
Notional Notional Notional (mean - (mean - Counterparties (mean)(sum) (sum) (mean) absolute absolute (mean)
values) values)
Dealers 80.3 TN 12 TN 5 TN 939.6 BN 15% 1401 26.75Intermediaries EMU 14 TN -1.3 TN 2.3 TN 357 BN 14% 3191 27.0Intermediaries Non-EMU 1.2 TN -47.7 BN 310 BN 116 BN 37% 201 27.0SSM Banks Clearing members 11.1 TN -603 BN 396 BN 30.8 BN 16% 627 18.8SSM Banks Non-Clearing Members 7 TN 143 BN 117 BN 14.3 BN 31% 253 12.2Other Banks Clearing Members 1.3 TN -372 BN 72.6 BN 21.1 BN 32% 67 19.4Other Banks Non-Clearing Members 2.3 TN -571 BN 82.9 BN 46.4 BN 37% 29 16.1Non-Banks 11.4 TN -1 TN 116 BN 17.4 BN 35% 15 10.9Insurances Pensions 904 BN -41.2 BN 64.6 BN 8.3 BN 15% 12 11.5CCPs 58.5 TN -7.9 TN 5.3 TN 714 BN 20% 23 8.4
Total Liquid Leverage CET1 Gross Notional Net NotionalAssets Assets ratio Ratio over Total Assets over Total Assets(mean) (mean) (mean) (mean) (mean) (mean - absolute values)
Dealers 1.3 TN 659 BN 5.5 13.8 3.5 0.6Intermediaries EMU 844 BN 233 BN 5.5 13.4 3.2 0.6Intermediaries Non-EMU 987 BN 396 BN 4.3 13.3 0.6 0.2SSM Banks Clearing Members 195 BN 63 BN 5.5 17.4 1.8 0.2SSM Banks Non-Clearing Members 97.7 BN 31.3 BN 7.9 17.7 0.7 0.1Other Banks Clearing Members 454 BN 153.8 BN 5.8 14.4 0.6 0.1Other Banks Non-Clearing Members 461 BN 128.6 BN 7.3 17.3 1.0 0.4Non-Banks - - - - - -Insurances Pensions - - - - - -CCPs - - - - - -
ECB Working Paper Series No 2242 / February 2019 50

Table 7. Market activityThis table shows the results for the regression of the exposures. The regression investigates ifthe market activity is more influenced by certain categories. The dependent variable, (i.e., theexposure) is expressed in terms of the log value of the aggregate gross notional at counterpartylevel. We use an OLS estimation model. Explanatory variables are dummies indicating whetherthat counterparty belongs to a certain category (dummy=1) or not (dummy=0). The regressionin column 1 follows the “traditional”categorization of the traders, mainly distinguishing betweendealers and other banks and non-banks that are non-dealers. In column 2, we add a distinct categoryfor the non-dealers that we identified as intermediaries. We show that adding this category addssignificant contribution to the analysis. We control the effect of a counterparty being a clearingmember by adding a further distinction between clearing members and non-clearing members. Thereference group is SSM banks that are not clearing members. Test statistics, derived from standarderrors clustered at counterparty level, are given in parentheses. The significance is indicated asfollows: * <0.1, ** <0.05, *** <0.01.
(1) (2)VARIABLES Log Gross Notional Log Gross Notional
Dealers EMU 6.793*** 6.793***(0.393) (0.394)
Dealers Non-EMU 4.244*** 4.244***(0.446) (0.448)
Intermediaries EMU 4.992***(0.331)
Intermediaries Non-EMU 2.785***(0.474)
SSM Banks Clearing Members 2.682*** 2.187***(0.460) (0.461)
Other Banks Clearing Members 1.419*** 1.133**(0.443) (0.444)
Other Banks Non-Clearing Members 0.820** 0.820**(0.381) (0.383)
Non-Banks Clearing Members 1.565*** 1.529**(0.586) (0.672)
Non-Banks Non-Clearing Members 0.434 0.434(0.358) (0.360)
Constant 23.47*** 23.47***(0.322) (0.323)
Observations 271 271R-squared 0.351 0.388
ECB Working Paper Series No 2242 / February 2019 51

Table 8. Specification at bank levelThis table shows the results for the regression on the specialisation of the banks in our sample.The dependent variable is the total gross notional of trader k divided into 12 different types ofcontracts based on a specific contract maturity bucket (1-3 years, 4-6 years, and 9-11 years) and cashflow structure (fixed-floating, fixed-fixed, and floating-floating). Columns 1, 2, and 3 distinguishthree different regressions for three types of currencies: (1) Euro, (2) US Dollars, and (3) othercurrencies. The explanatory variables are dummy variables controlling for the different maturitiesof the contracts and dummies on a counterparty’s category; in this specification, the focus is onlyon banks. The most important categories of dealers and intermediaries are now focusing only onEMU area dealers and intermediaries. Interaction variables are added to investigate whether acategory is more specialised on certain maturities. SSM banks (i.e. banks under the supervision ofthe European Central Bank) are the reference group. Test statistics, derived from standard errorsclustered at counterparty level, are given in parentheses. The significance is indicated as follows: *<0.1, ** <0.05, *** <0.01.
(1) (2) (3)Log of Log of Log of
VARIABLES Gross Notional Gross Notional Gross NotionalEUR USD Other Currencies
Dummy 1-3 years 0.365 1.295*** 0.917**(0.495) (0.416) (0.429)
Dummy 5 years 0.913** 1.247*** 0.441(0.401) (0.322) (0.385)
Dummy 10 years -1.093*** -0.999*** -0.326(0.375) (0.306) (0.324)
Dealers EMU 13.10*** 18.05*** 17.28***(0.696) (0.866) (1.780)
Dealers EMU * 1-3 years 0.336 0.229 1.879(0.535) (0.546) (1.214)
Dealers EMU * 5 years -0.925** -0.515 0.0385(0.414) (0.494) (0.424)
Dealers EMU * 10 years 0.905** 1.024* -0.454(0.396) (0.554) (0.445)
Intermediaries EMU 12.15*** 15.13*** 14.29***(0.674) (1.093) (1.237)
Intermediaries EMU * 1-3 years 0.132 -0.515 0.580(0.510) (1.567) (1.548)
Intermediaries EMU * 5 years -0.764* 0.392 0.371(0.427) (0.983) (1.381)
Intermediaries EMU * 10 years -0.441 -0.532 -2.002*(0.988) (1.129) (1.095)
Other Banks -3.434*** 2.399** 3.620***(1.014) (0.956) (1.045)
Other Banks * 1-3 years 1.873** 2.022*** 1.250(0.932) (0.771) (0.768)
Other Banks * 5 years 0.526 0.169 1.232**(0.786) (0.694) (0.599)
Other Banks * 10 years 0.250 0.108 -0.629(0.648) (0.611) (0.636)
Constant 10.22*** 5.159*** 4.067***(0.638) (0.558) (0.577)
Observations 1,776 1,776 1,776R-squared 0.129 0.195 0.192
ECB Working Paper Series No 2242 / February 2019 52
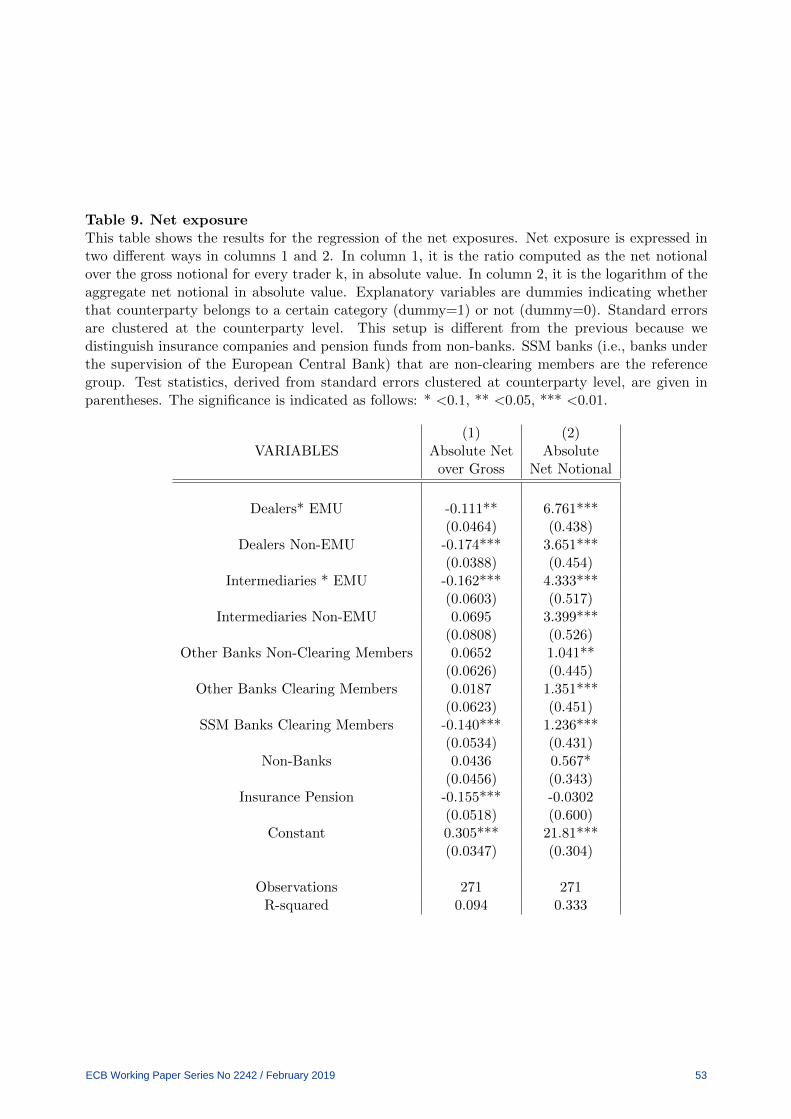
Table 9. Net exposureThis table shows the results for the regression of the net exposures. Net exposure is expressed intwo different ways in columns 1 and 2. In column 1, it is the ratio computed as the net notionalover the gross notional for every trader k, in absolute value. In column 2, it is the logarithm of theaggregate net notional in absolute value. Explanatory variables are dummies indicating whetherthat counterparty belongs to a certain category (dummy=1) or not (dummy=0). Standard errorsare clustered at the counterparty level. This setup is different from the previous because wedistinguish insurance companies and pension funds from non-banks. SSM banks (i.e., banks underthe supervision of the European Central Bank) that are non-clearing members are the referencegroup. Test statistics, derived from standard errors clustered at counterparty level, are given inparentheses. The significance is indicated as follows: * <0.1, ** <0.05, *** <0.01.
(1) (2)VARIABLES Absolute Net Absolute
over Gross Net Notional
Dealers* EMU -0.111** 6.761***(0.0464) (0.438)
Dealers Non-EMU -0.174*** 3.651***(0.0388) (0.454)
Intermediaries * EMU -0.162*** 4.333***(0.0603) (0.517)
Intermediaries Non-EMU 0.0695 3.399***(0.0808) (0.526)
Other Banks Non-Clearing Members 0.0652 1.041**(0.0626) (0.445)
Other Banks Clearing Members 0.0187 1.351***(0.0623) (0.451)
SSM Banks Clearing Members -0.140*** 1.236***(0.0534) (0.431)
Non-Banks 0.0436 0.567*(0.0456) (0.343)
Insurance Pension -0.155*** -0.0302(0.0518) (0.600)
Constant 0.305*** 21.81***(0.0347) (0.304)
Observations 271 271R-squared 0.094 0.333
ECB Working Paper Series No 2242 / February 2019 53

Table 10. Impact of bank sizeThis table shows the results for the regression investigating the impact of a bank’s size on differentexposure measures. The different measures considered for market activity are: log of total grossnotional in column 1; the ratio computed as the net notional over the gross notional for every traderk, in absolute value in column 2; the logarithm of the aggregate net notional in absolute value incolumn 3; and the logarithm of the aggregate net notional scaled over total assets in column 3.The explanatory variables follow the same setup as in Table 6, the only difference being that wedo not consider non-banks (for reasons of balance-sheet data availability), and we add the variableexpressing the size of a bank (i.e., the logarithm of total assets). Data are from 31/12/2017 and areobtained from S&P Global SNL Financial. Test statistics, derived from standard errors clusteredat counterparty level, are given in parentheses. The significance is indicated as follows: * <0.1, **<0.05, *** <0.01.
(1) (2) (3) (4)VARIABLES Log of Absolute Net over Log of Absolute Net Notional
Gross Notional Gross Ratio Net Notional / Total Assets
Dealers EMU 3.700*** -0.0768 4.002*** 2.387**(0.568) (0.0772) (0.582) (0.920)
Dealers Non-EMU 1.511*** -0.142** 1.221** 0.389*(0.556) (0.0664) (0.530) (0.207)
Intermediaries EMU 2.528*** -0.131* 2.149*** 0.780**(0.455) (0.0780) (0.616) (0.393)
Intermediaries Non-EMU 0.595 0.142 1.609*** 0.421**(0.662) (0.104) (0.553) (0.202)
Other Banks Non-Clearing Members 0.142 0.0993 0.518 0.402*(0.415) (0.0633) (0.473) (0.217)
Other Banks Clearing Members -0.259 0.0435 0.146 0.138(0.512) (0.0681) (0.411) (0.116)
SSM Banks Clearing Members 1.341*** -0.118** 0.530 0.209(0.348) (0.0548) (0.377) (0.130)
Log of Total Assets 0.903*** -0.00488 0.825*** -0.118*(0.145) (0.0198) (0.134) (0.0643)
Constant 1.180 0.408 1.375 3.037*(3.627) (0.495) (3.372) (1.579)
Observations 147 147 147 147R-squared 0.665 0.132 0.598 0.327
ECB Working Paper Series No 2242 / February 2019 54

Table 11. Impact of banks’ capital and liquidityThis table shows the results for the regression investigating the impact of a bank capital andliquidity on different exposure measures. The different measures considered for market activity are:log of total gross notional in column 1; the ratio computed as the net notional over the gross notionalfor every trader k in absolute value in column 2; the logarithm of the aggregate net notional inabsolute value in column 3; and the logarithm of the aggregate net notional scaled over total assetsin column 3. The explanatory variables follow the same setup as in Table 9, the only differencebeing that we now add the variable expressing the of a bank’s capital and liquidity (i.e., the CET1ratio, calculated as CET1 over risk-weighted assets; the liquidity ratio, computed as liquid assetsover total assets; and the Basel III leverage ratio, measured by CET1 over total exposure). Aninteraction variable investigating the combined effect of the leverage ratio and the total assets isadded in the second column of each specification. Data are from 31/12/2017 and are obtained fromS&P Global SNL Financial. Test statistics, derived from standard errors clustered at counterpartylevel, are given in parentheses. The significance is indicated as follows: * <0.1, ** <0.05, ***<0.01.
(1) (2) (3) (4) (5) (6) (7) (8)Log of Log of Absolute Absolute Log of Log of Net Net
VARIABLES Gross Gross Net over Net over Absolute Absolute Notional/ Notional/Notional Notional Gross Ratio Gross Ratio Net Notional Net Notional Total Assets Total Assets
Dealers EMU 2.638*** 3.043*** 0.0475 0.0373 3.513*** 4.013*** 2.039** 2.095**(0.702) (0.735) (0.0985) (0.101) (0.745) (0.799) (0.900) (0.895)
Dealers Non-EMU 0.631 0.514 -0.0312 -0.0283 1.024 0.880 0.164 0.148(0.678) (0.697) (0.0796) (0.0796) (0.669) (0.734) (0.277) (0.283)
Intermediaries EMU 2.119*** 2.283*** -0.0556 -0.0597 1.905*** 2.108*** 0.753* 0.776*(0.472) (0.445) (0.0884) (0.0893) (0.696) (0.703) (0.425) (0.426)
Intermediaries Non-EMU -0.177 0.323 0.244** 0.231** 1.217** 1.836*** 0.217 0.286(0.741) (0.676) (0.112) (0.115) (0.613) (0.586) (0.242) (0.236)
Other Banks Non-Clearing Members -0.176 -0.453 0.0480 0.0550 0.177 -0.165 0.221 0.183(0.607) (0.565) (0.0699) (0.0738) (0.647) (0.622) (0.342) (0.347)
Other Banks Clearing Members -0.401 -0.229 0.108 0.104 0.250 0.463 0.0377 0.0614(0.552) (0.525) (0.0787) (0.0793) (0.421) (0.412) (0.151) (0.154)
SSM Banks Clearing Members 1.110*** 1.029*** -0.0893* -0.0873* 0.338 0.237 0.105 0.0938(0.363) (0.369) (0.0498) (0.0489) (0.415) (0.417) (0.0997) (0.0983)
Log of Total Assets 1.052*** 0.248 -0.0220 -0.00173 0.911*** -0.0827 -0.123 -0.233*(0.170) (0.301) (0.0220) (0.0585) (0.170) (0.374) (0.0880) (0.126)
CET1 Ratio 0.0471** 0.0494** -0.00425 -0.00431 0.0397* 0.0426* 0.00161 0.00193(0.0233) (0.0244) (0.00275) (0.00279) (0.0223) (0.0238) (0.00637) (0.00658)
Liquidity Ratio 1.424 2.290 -0.0937 -0.116 0.445 1.515 0.942 1.062(1.397) (1.485) (0.192) (0.205) (1.484) (1.589) (0.617) (0.670)
Leverage Ratio -0.119** -3.074*** 0.0116 0.0861 -0.0937 -3.745*** -0.0295 -0.436(0.0516) (0.920) (0.00936) (0.215) (0.0716) -1.396 (0.0191) (0.347)
Log of Tot Assets * Lev Ratio 0.119*** -0.00300 0.147** 0.0164(0.0373) (0.00870) (0.0565) (0.0140)
Constant -2.783 17.11** 0.819 0.317 -0.875 23.71** 3.114 5.849*(4.539) (7.484) (0.590) (1.445) (4.643) (9.274) (2.333) (3.173)
Observations 117 117 117 117 117 117 117 117R-squared 0.769 0.786 0.202 0.204 0.696 0.724 0.381 0.385
ECB Working Paper Series No 2242 / February 2019 55
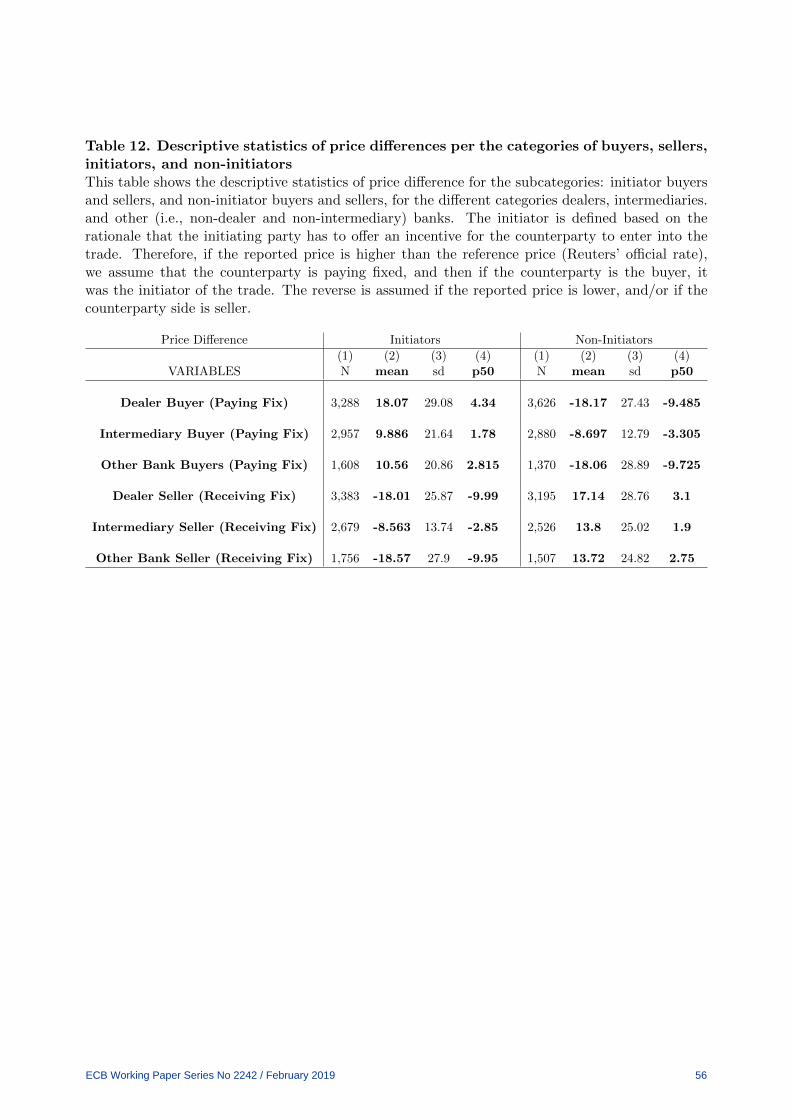
Table 12. Descriptive statistics of price differences per the categories of buyers, sellers,initiators, and non-initiatorsThis table shows the descriptive statistics of price difference for the subcategories: initiator buyersand sellers, and non-initiator buyers and sellers, for the different categories dealers, intermediaries.and other (i.e., non-dealer and non-intermediary) banks. The initiator is defined based on therationale that the initiating party has to offer an incentive for the counterparty to enter into thetrade. Therefore, if the reported price is higher than the reference price (Reuters’ official rate),we assume that the counterparty is paying fixed, and then if the counterparty is the buyer, itwas the initiator of the trade. The reverse is assumed if the reported price is lower, and/or if thecounterparty side is seller.
Price Difference Initiators Non-Initiators
(1) (2) (3) (4) (1) (2) (3) (4)VARIABLES N mean sd p50 N mean sd p50
Dealer Buyer (Paying Fix) 3,288 18.07 29.08 4.34 3,626 -18.17 27.43 -9.485
Intermediary Buyer (Paying Fix) 2,957 9.886 21.64 1.78 2,880 -8.697 12.79 -3.305
Other Bank Buyers (Paying Fix) 1,608 10.56 20.86 2.815 1,370 -18.06 28.89 -9.725
Dealer Seller (Receiving Fix) 3,383 -18.01 25.87 -9.99 3,195 17.14 28.76 3.1
Intermediary Seller (Receiving Fix) 2,679 -8.563 13.74 -2.85 2,526 13.8 25.02 1.9
Other Bank Seller (Receiving Fix) 1,756 -18.57 27.9 -9.95 1,507 13.72 24.82 2.75
ECB Working Paper Series No 2242 / February 2019 56
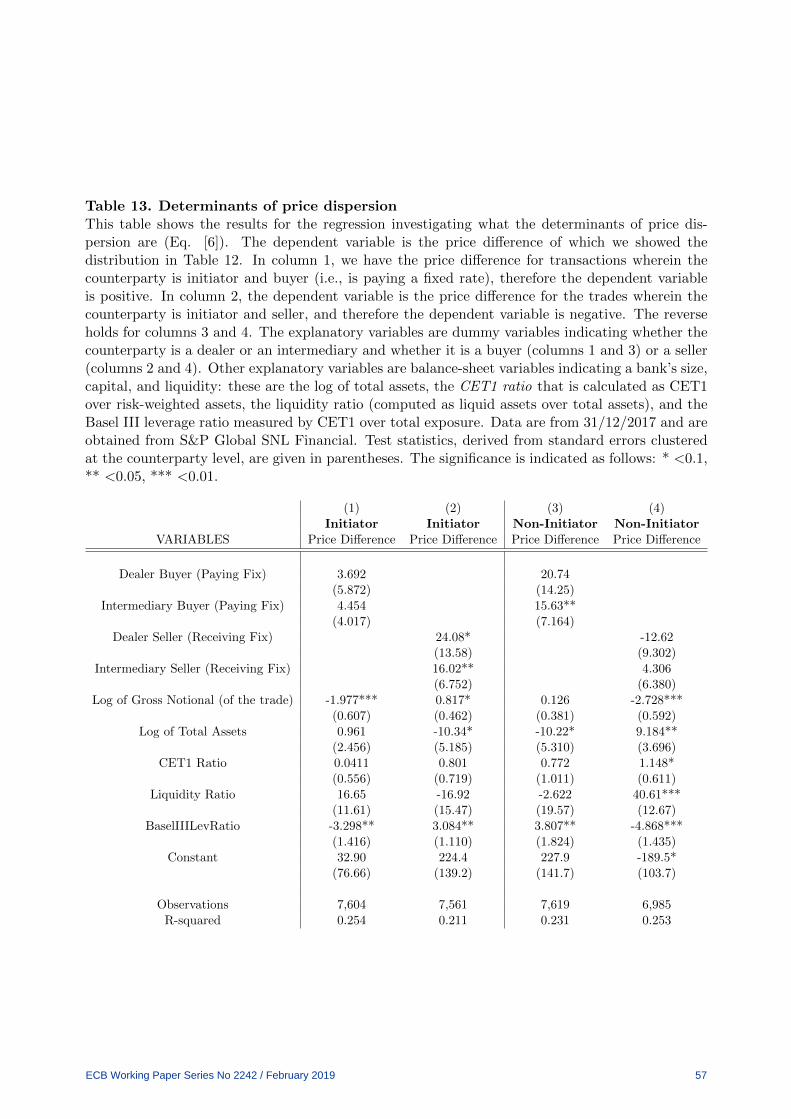
Table 13. Determinants of price dispersionThis table shows the results for the regression investigating what the determinants of price dis-persion are (Eq. [6]). The dependent variable is the price difference of which we showed thedistribution in Table 12. In column 1, we have the price difference for transactions wherein thecounterparty is initiator and buyer (i.e., is paying a fixed rate), therefore the dependent variableis positive. In column 2, the dependent variable is the price difference for the trades wherein thecounterparty is initiator and seller, and therefore the dependent variable is negative. The reverseholds for columns 3 and 4. The explanatory variables are dummy variables indicating whether thecounterparty is a dealer or an intermediary and whether it is a buyer (columns 1 and 3) or a seller(columns 2 and 4). Other explanatory variables are balance-sheet variables indicating a bank’s size,capital, and liquidity: these are the log of total assets, the CET1 ratio that is calculated as CET1over risk-weighted assets, the liquidity ratio (computed as liquid assets over total assets), and theBasel III leverage ratio measured by CET1 over total exposure. Data are from 31/12/2017 and areobtained from S&P Global SNL Financial. Test statistics, derived from standard errors clusteredat the counterparty level, are given in parentheses. The significance is indicated as follows: * <0.1,** <0.05, *** <0.01.
(1) (2) (3) (4)Initiator Initiator Non-Initiator Non-Initiator
VARIABLES Price Difference Price Difference Price Difference Price Difference
Dealer Buyer (Paying Fix) 3.692 20.74(5.872) (14.25)
Intermediary Buyer (Paying Fix) 4.454 15.63**(4.017) (7.164)
Dealer Seller (Receiving Fix) 24.08* -12.62(13.58) (9.302)
Intermediary Seller (Receiving Fix) 16.02** 4.306(6.752) (6.380)
Log of Gross Notional (of the trade) -1.977*** 0.817* 0.126 -2.728***(0.607) (0.462) (0.381) (0.592)
Log of Total Assets 0.961 -10.34* -10.22* 9.184**(2.456) (5.185) (5.310) (3.696)
CET1 Ratio 0.0411 0.801 0.772 1.148*(0.556) (0.719) (1.011) (0.611)
Liquidity Ratio 16.65 -16.92 -2.622 40.61***(11.61) (15.47) (19.57) (12.67)
BaselIIILevRatio -3.298** 3.084** 3.807** -4.868***(1.416) (1.110) (1.824) (1.435)
Constant 32.90 224.4 227.9 -189.5*(76.66) (139.2) (141.7) (103.7)
Observations 7,604 7,561 7,619 6,985R-squared 0.254 0.211 0.231 0.253
ECB Working Paper Series No 2242 / February 2019 57
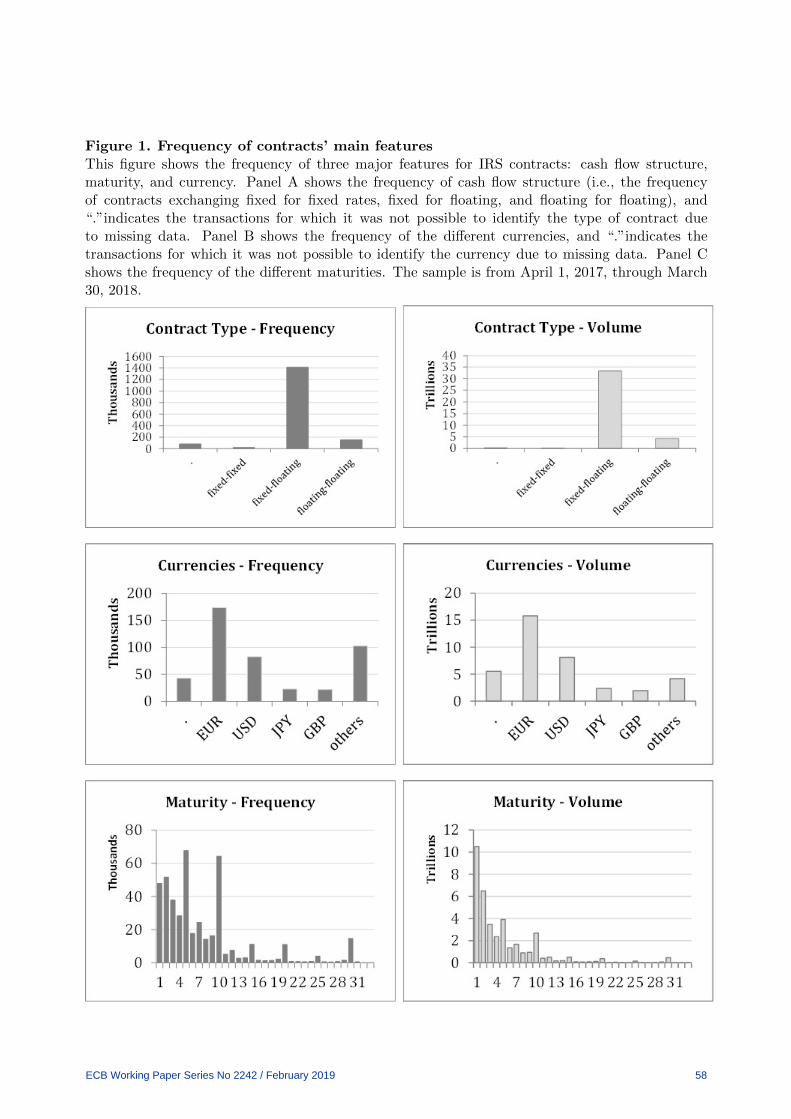
Figure 1. Frequency of contracts’ main featuresThis figure shows the frequency of three major features for IRS contracts: cash flow structure,maturity, and currency. Panel A shows the frequency of cash flow structure (i.e., the frequencyof contracts exchanging fixed for fixed rates, fixed for floating, and floating for floating), and“.”indicates the transactions for which it was not possible to identify the type of contract dueto missing data. Panel B shows the frequency of the different currencies, and “.”indicates thetransactions for which it was not possible to identify the currency due to missing data. Panel Cshows the frequency of the different maturities. The sample is from April 1, 2017, through March30, 2018.
ECB Working Paper Series No 2242 / February 2019 58

Figure 2. Network chart from SSM banks’ perspectiveThis figure shows a stylized chart of the network with all major categories of firms in our samplefrom the perspective of the supervised euro area banks.
ECB Working Paper Series No 2242 / February 2019 59

Figure 3. Network matrixThis figure shows the network structure of the euro area IRS market by means of a plot of twomatrices. In Panel A we show the network matrix among 1,000 counterparties, in Panel B amongthe major 250 counterparties. In both matrices, element G(i;j) equals one if i and j have a non-zerobilateral exposure. Counterparties are ordered by their total gross exposure, highest to lowest,starting with the biggest dealers located in the bottom-left corner. Each dot, G, in the chartindicates the presence of a link between counterparty i and j.
ECB Working Paper Series No 2242 / February 2019 60
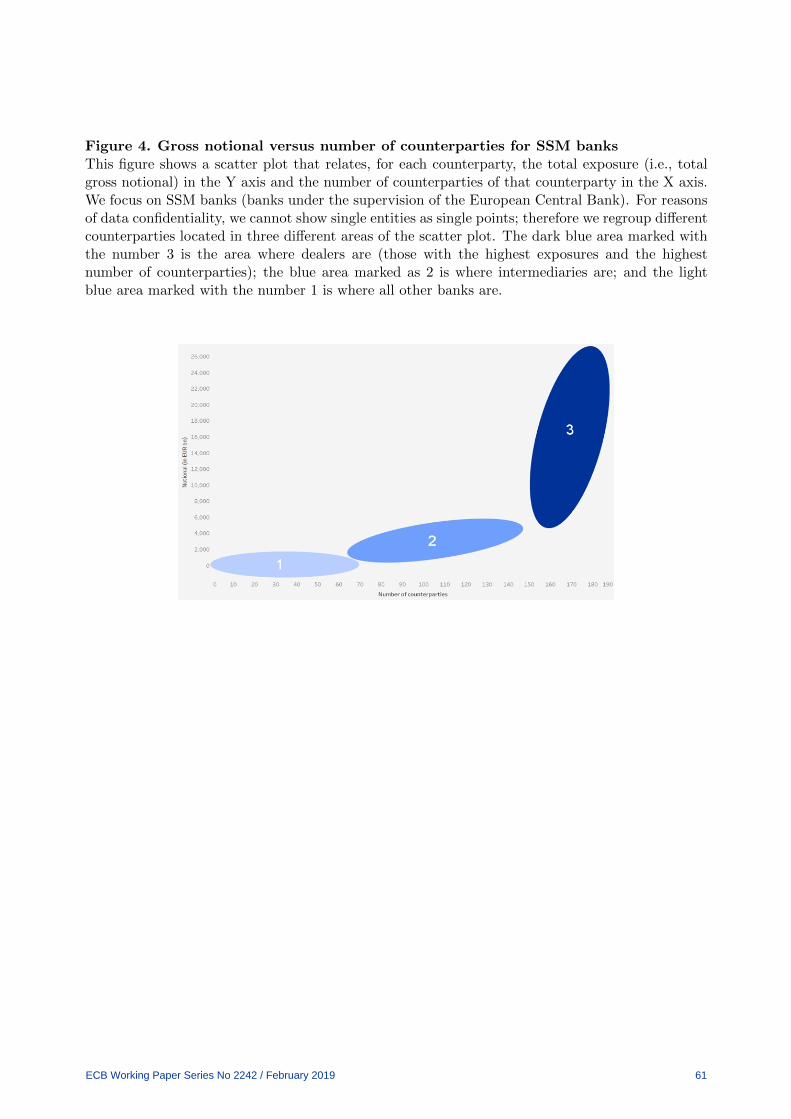
Figure 4. Gross notional versus number of counterparties for SSM banksThis figure shows a scatter plot that relates, for each counterparty, the total exposure (i.e., totalgross notional) in the Y axis and the number of counterparties of that counterparty in the X axis.We focus on SSM banks (banks under the supervision of the European Central Bank). For reasonsof data confidentiality, we cannot show single entities as single points; therefore we regroup differentcounterparties located in three different areas of the scatter plot. The dark blue area marked withthe number 3 is the area where dealers are (those with the highest exposures and the highestnumber of counterparties); the blue area marked as 2 is where intermediaries are; and the lightblue area marked with the number 1 is where all other banks are.
ECB Working Paper Series No 2242 / February 2019 61
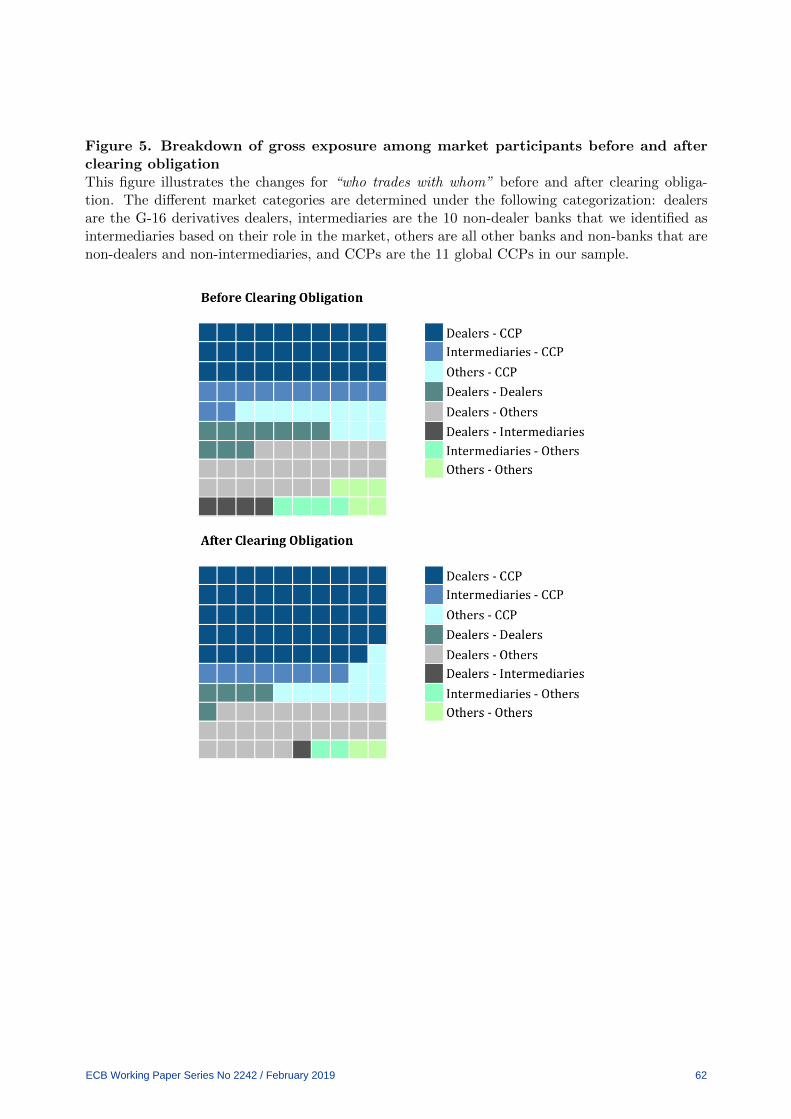
Figure 5. Breakdown of gross exposure among market participants before and afterclearing obligationThis figure illustrates the changes for “who trades with whom” before and after clearing obliga-tion. The different market categories are determined under the following categorization: dealersare the G-16 derivatives dealers, intermediaries are the 10 non-dealer banks that we identified asintermediaries based on their role in the market, others are all other banks and non-banks that arenon-dealers and non-intermediaries, and CCPs are the 11 global CCPs in our sample.
ECB Working Paper Series No 2242 / February 2019 62

Figure 6. Net over gross ratio at counterparty levelThis figure shows the single net over gross ratios distributed from the lowest (-100%) to the highest(+100%) for each counterparty. Counterparties with a ratio close to +/- 100% are the ones withhigher exposure on one side of the market (fixed or floating). These are other banks (meaningnon-dealers, non-intermediaries, and non-euro area banks) and non-banks. Counterparties with aratio closer to zero are the ones more active in both sides of the contracts; these are mainly dealers,intermediaries, and CCPs.
ECB Working Paper Series No 2242 / February 2019 63

Online appendix: Material available upon request
Table 14. Robustness Check 1: Cross-sectional regression on market activity with September 2017sample
(1) (2)VARIABLES Log of Log of
Gross Notional Gross Notional
Dealers EMU 6.599*** 6.688***(0.354) (0.348)
Dealers Non-EMU 4.227*** 4.315***(0.385) (0.380)
Intermediaries EMU 4.942***(0.293)
Intermediaries Non-EMU 3.436***(0.270)
Other Banks Non-Clearing Members 0.979* 1.068**(0.499) (0.496)
Other Banks Clearing Members 1.771*** 1.860***(0.322) (0.315)
SSM Banks Clearing Members 2.898*** 2.632***(0.393) (0.395)
Non-Banks Non-Clearing Members 0.432 0.520(0.351) (0.345)
Non-Banks Clearing Members 1.116** 1.204***(0.438) (0.434)
Constant 23.63*** 23.54***(0.278) (0.270)
Observations 208 208R-squared 0.433 0.479
ECB Working Paper Series No 2242 / February 2019 64

Table 15. Robustness Check 2: Regression on risk absorption considering only Fixed-Floatingcontracts
(1) (2)VARIABLES Absolute Abolute
Net over Gross Net Notional
Dealers EMU -0.138*** 6.585***(0.0474) (0.467)
Dealers Non-EMU -0.207*** 3.367***(0.0376) (0.474)
Intermediaries EMU -0.157*** 4.252***(0.0543) (0.610)
Intermediaries Non-EMU -0.0871 2.790***(0.0767) (0.603)
SSM Banks Clearing Members -0.142*** 1.534***(0.0473) (0.409)
Other Banks Clearing Members -0.0937* 1.080**(0.0502) (0.466)
Other Banks Non-Clearing Members 0.00641 0.946**(0.0582) (0.450)
Non-Banks -0.0113 0.470(0.0451) (0.348)
Insurances Pensions -0.149*** -0.0201(0.0499) (0.584)
Constant 0.278*** 21.61***(0.0366) (0.308)
Observations 271 271R-squared 0.079 0.314
ECB Working Paper Series No 2242 / February 2019 65

Table 16. Robustness Check 3: Regression on trade activity without considering the role of NonEuro Intermediaries
(1) (2)VARIABLES Log of Gross Notional Log of Gross Notional
Gross Notional Gross Notional
Dealer EMU 6.777*** 6.793***(0.390) (0.394)
Dealers Non-EMU 4.228*** 4.244***(0.443) (0.447)
Intermediaries EMU 4.992***(0.331)
SSM Banks Clearing Members 2.666*** 2.187***(0.457) (0.461)
Other Banks Clearing Members 1.357*** 1.434***(0.425) (0.435)
Other Banks Non-Clearing Members 0.804** 0.820**(0.378) (0.382)
Non-Banks Clearing Members 1.322** 1.529**(0.586) (0.671)
Non-Banks Non-Clearing Members 0.418 0.434(0.355) (0.359)
Constant 23.49*** 23.47***(0.318) (0.322)
Observations 271 271R-squared 0.350 0.381
ECB Working Paper Series No 2242 / February 2019 66

Table 17. Robustness Check 4: specialisation - currency
VARIABLES Log of Gross Notional
Dealers EMU 10.61***(0.848)
Dealers EMU * EURO 0.415(0.282)
Dealers Non-EMU 8.106***(0.849)
Intermediaries EMU 8.044***(0.828)
Intermediaries EMU * EURO 1.881***(0.286)
Intermediaries Non-EMU 6.555***(0.862)
SSM Banks Clearing Members 3.514***(0.977)
SSM Banks Clearing Members * EURO 3.595***(0.268)
Other Banks Clearing Members 4.257***(1.096)
Other Banks Clearing Members * EURO 0.685(0.561)
Other Banks Non-CM 3.105***(1.031)
Non-Banks Clearing Members 4.686***(1.435)
Non-Banks Clearing Members * EURO 0.884(1.130)
Non-Banks Non-CM 0.976(0.935)
Constant 18.18***(0.785)
Observations 813R-squared 0.139
ECB Working Paper Series No 2242 / February 2019 67
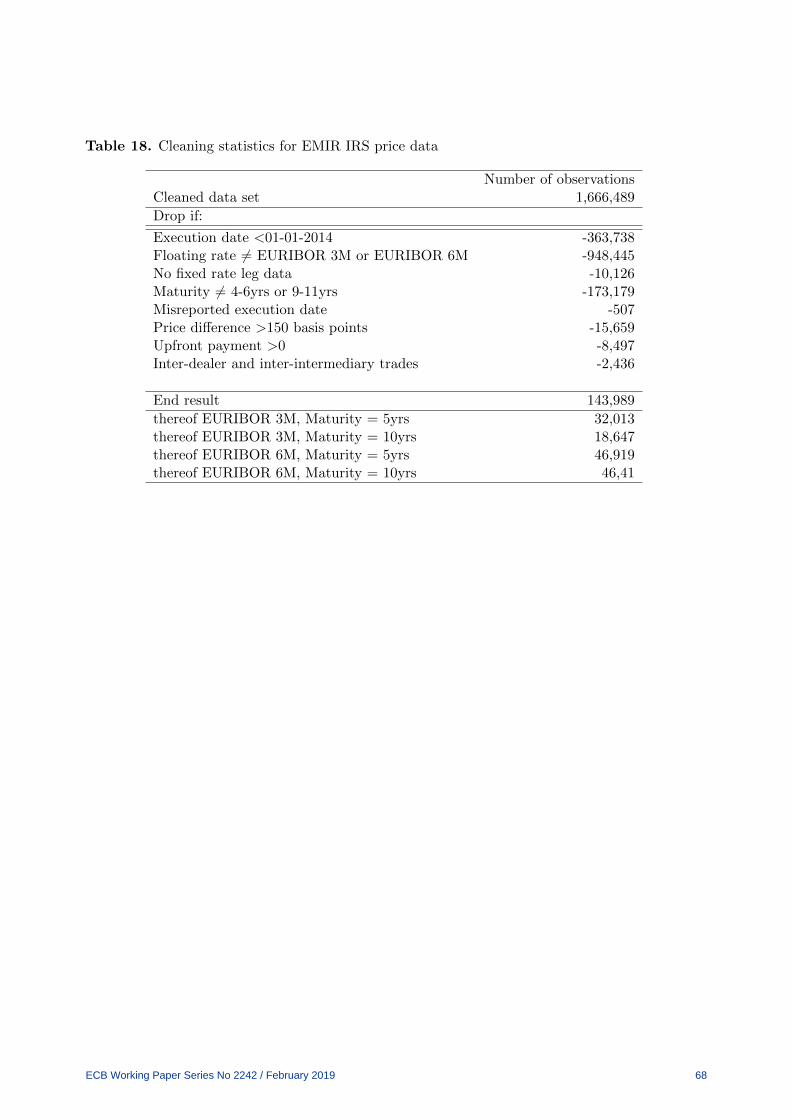
Table 18. Cleaning statistics for EMIR IRS price data
Number of observationsCleaned data set 1,666,489
Drop if:
Execution date <01-01-2014 -363,738Floating rate 6= EURIBOR 3M or EURIBOR 6M -948,445No fixed rate leg data -10,126Maturity 6= 4-6yrs or 9-11yrs -173,179Misreported execution date -507Price difference >150 basis points -15,659Upfront payment >0 -8,497Inter-dealer and inter-intermediary trades -2,436
End result 143,989
thereof EURIBOR 3M, Maturity = 5yrs 32,013thereof EURIBOR 3M, Maturity = 10yrs 18,647thereof EURIBOR 6M, Maturity = 5yrs 46,919thereof EURIBOR 6M, Maturity = 10yrs 46,41
ECB Working Paper Series No 2242 / February 2019 68

Acknowledgements The views presented in the paper are those of the authors only and do not necessarily represent the views of the European Central Bank, the SSM or the Eurosystem. The authors thank Christian Resch for research assistance.
Silvia Dalla Fontana USI Lugano - Swiss Finance Institute, Lugano, Switzerland; email: [email protected]
Marco Holz auf der Heide European Central Bank, Frankfurt am Main, Germany; email: [email protected]
Loriana Pelizzon SAFE - Goethe University Frankfurt, Frankfurt am Main, Germany; email: [email protected]
Martin Scheicher European Central Bank, Frankfurt am Main, Germany; email: [email protected]
© European Central Bank, 2019
Postal address 60640 Frankfurt am Main, Germany Telephone +49 69 1344 0 Website www.ecb.europa.eu
All rights reserved. Any reproduction, publication and reprint in the form of a different publication, whether printed or produced electronically, in whole or in part, is permitted only with the explicit written authorisation of the ECB or the authors.
This paper can be downloaded without charge from www.ecb.europa.eu, from the Social Science Research Network electronic library or from RePEc: Research Papers in Economics. Information on all of the papers published in the ECB Working Paper Series can be found on the ECB’s website.
PDF ISBN 978-92-899-3504-3 ISSN 1725-2806 doi:10.2866/610799 QB-AR-19-023-EN-N