working paper series - ecineq · ecineq wp 2016 - 416 working paper series the impact of taxes,...
TRANSCRIPT

ECINEQ WP 2016 - 416
Working Paper Series
The impact of taxes, transfers, and subsi-
dies on inequality and poverty in Uganda
Jon Jellema
Nora Lustig
Astrid Haas
Sebastian Wolf
ECINEQ 2016 - 416October 2016
www.ecineq.org
The impact of taxes, transfers, and subsidieson inequality and poverty in Uganda∗
Jon Jellema†
Commitment to Equity Institute
Nora Lustig
Tulane University, U.S.A.
Astrid Haas
Sebastian Wolf
International Growth Centre, Uganda
Abstract
This paper uses the 2012/13 Uganda National Household Survey to analyze the redistributive effectiveness andimpact on poverty and inequality of Uganda’s revenue collection instruments and social spending programs.Fiscal policy – including many of its constituent tax and spending elements – is inequality-reducing in Uganda,but the reduction of inequality due to fiscal policy in Uganda is lower than other countries with similar levelsof initial inequality, a result tied to low levels of spending in Uganda generally. The impact of fiscal policyon poverty is negligible, while the combination of very sparse coverage of direct transfer programs and nearlycomplete coverage of indirect tax instruments means that many poor households are net payers into, ratherthan net recipients from, the fiscal system. As Uganda looks ahead to increased revenues from taxation andconcurrent investments in productive infrastructure, it should take care to protect the poorest households fromfurther impoverishment from the fiscal system.
Keywords: fiscal incidence, poverty, inequality, fiscal policy, Uganda.
JEL Classification: D31, D63, H22, H23, I38.
∗This Working Paper is Chapter 18 in Lustig, Nora, editor. 2018. Commitment to Equity Hand-book. Estimating the Impact of Fiscal Policy on Inequality and Poverty (Brookings Institution Pressand CEQ Institute, Tulane University). The online version of the Handbook can be found here:http://www.commitmentoequity.org/publications-ceq-handbook/. The Uganda CEQ Assessment and Reportare International Growth Centre (www.theigc.org) projects. The CEQ Institute would also like to acknowledgethe generous support provided by the Bill & Melinda Gates Foundation. Launched in 2008, the CEQ project isan initiative of the Center for Inter-American Policy and Research (CIPR) and the department of Economics,Tulane University, the Center for Global Development and the Inter-American Dialogue. The CEQ project ishoused in the Commitment to Equity Institute at Tulane. For more details visit www.commitmentoequity.org.
†Contact details. J. Jellema: Commitment to Equity Institute Associate Director for Africa, Asia,and Europe; Email: [email protected]. N. Lustig: Samuel Z. Stone Professor of Latin AmericanEconomics, Tulane University, New Orleans, LA, USA; director of the CEQ institute; nonresident fellow ofCenter for Global Development and Inter-American Dialogue; Email: [email protected]. A. Haas: CountryEconomist for the International Growth Centre, Uganda; Email: [email protected]. S. Wolf: CountryEconomist for the International Growth Centre, Uganda; Email: [email protected].

2
1. Introduction and Country Context
Over the last 25 years Uganda has made great strides in reducing poverty; it is one of the few Sub-
Saharan African countries that achieved the Millennium Development Goal of halving the
proportion of people living in poverty between 1990 and 2015, and it reached this goal five years
ahead of time.3 Even so, figure 1 indicates that high income inequality remains: as measured by the
Gini coefficient – where a coefficient of 0 represents perfect equality and a coefficient of 1 perfect
inequality – inequality has fluctuated around 0.4 since the beginning of this millennium.4 A growing
body of international evidence suggests that high income inequality may slow growth5 and can also
have negative effects on socio-economic stability6. In recognition of the negative effects of income
inequality, the Ugandan government has repeatedly declared the reduction of income inequality a
priority policy goal (see the Uganda National Development Plans I and II, for example).
Figure 1. Gini Index of Inequality in Uganda, 1992-2013
Source: MoFPED (2014).
However, the overall impact of fiscal policy on inequality in income, consumption, savings, and other
outcomes is often poorly understood. This study provides policy makers with an assessment of the
redistributive impact of fiscal policy – both its individual elements as well as the composite whole –
in Uganda, using an internationally recognized methodology developed by the CEQ Institute.7 This
study estimates the impact of fiscal revenue collections (taxes) and fiscal expenditures – direct cash
and near-cash transfers, in-kind benefits, subsidies – on household-level income inequality and
poverty. By using an internationally consistent methodology, the results from the Uganda CEQ
Assessment can be compared with results from other CEQ countries.
To our knowledge, fiscal incidence has so far not been studied systematically in Uganda. The
assessment summarized in this report comes at a crucial time for Ugandan fiscal policy. On the
revenue side, the government wants to raise the tax-to-GDP ratio from 13.9 percent in 2014/15 to
16.3 percent in 2020/21.8 This implies new directions in tax policy and tax collection that may have
3 Duponchel, McKay, and Ssewanyana (2015). 4 MoFPED (2014). 5 Berg and Ostry (2011); Ostry, Berg, and Tsangarides (2014). 6 Bardhan (2015). 7 For details on the methodology, please see the Introduction to Commitment to Equity Handbook. Estimating the Impact of Fiscal Policy on Inequality and Poverty (2017), Lustig and Higgins (2017), Higgins and Lustig, (2017), Jellema and Inchauste (2017), and Higgins (2017). 8 MoFPED (2016).
0.32
0.34
0.36
0.38
0.4
0.42
0.44
1992/93 1999/00 2002/03 2005/06 2009/10 2012/13
ECINEQ WP 2016 - 416 October 2016

3
negative impacts on poor and non-poor households alike, depending on which tax instrument the
government intends to use to generate the bulk of the revenue increase. On the expenditure side, the
government has committed to large infrastructure projects that will leave little fiscal space for other
social spending, for targeted spending on social protection, or for introducing new initiatives to
reduce income inequality. Gaining a clear understanding of the impact of the current fiscal system
will be crucial in the design of a pro-poor fiscal system for the years to come.
The Ugandan government’s strategy to tackle poverty and income inequality over the last 25 years
can be broken down in two periods. The first period was characterized by an expansion of the
provision of in-kind education, healthcare, water, and sanitation benefits. After a period of civil war
and chaos, the new National Resistance Movement government’s extensive liberalization agenda,
combined with disciplined monetary and fiscal policy reforms, triggered a period of sustained
economic growth and trade in the early 1990s. Alongside gains from increased economic activity, the
establishment of the semi-autonomous Uganda Revenue Authority led to large improvements in
domestic revenue collections. The tax-to-GDP ratio rose from 6 to 13 percent in between 1990 and
2000. With additional resources at hand, the government formulated a comprehensive Poverty
Reduction Plan in 2007 that would increase service delivery drastically. The centerpiece of the plan
was the introduction of universal primary education. Delivery of many of these services was to be
managed in a decentralized fashion, funded by transfers from central government. Donors aided
these efforts with budget support.9
When the growth of taxes relative to GDP began to level off in the early 2000s, the government
refocused. Infrastructure and investments in productive sectors were prioritized over further
expenditure increases on service delivery transfers, arguably shifting fiscal policy away from the pro-
poor, redistributive agenda that had been taken on in the 1990s to focus more directly on economic
growth. This policy shift meant that in real terms, service delivery transfers largely peaked around
2003, with later adjustments mainly covering increases in the wage bill.10
The second period was characterized by the introduction of targeted cash and in-kind benefits.
Responding to chronic inequality among regions caused by political instability and conflict, the
government shifted to smaller programmes specifically targeted to reduce regional imbalances in the
early 2000s. The first Northern Uganda Social Action fund was introduced in 2003 and was followed
by the introduction of the Social Assistance Grants for Empowerment programs in 2009 and the
second Northern Uganda Social Action fund in 2010. These regionally-focused programs are still on-
going, but given the large infrastructure investments the government is undertaking it is unclear
whether there will be sufficient fiscal space to expand them from their current rather small size.
Furthermore, first evaluations have raised concerns of these projects’ effectiveness.11
The government foresees large infrastructure investments going forward. These commitments leave
little space to expand targeted poverty-reduction or income-equality programs and require intensified
9 Kuteesa and others (2009). 10 Aziz and others (2016). 11 Ssewanyana and Kasirye (2015).
ECINEQ WP 2016 - 416 October 2016

4
tax- and other revenue-collection efforts. In this context, the government is embarking on a reform
to improve the efficiency of the service delivery transfer systems already in place. As part of these
reforms, the government is reformulating transfer amounts and spending regulations to achieve a
more equitable transfer distribution among districts and a more efficient delivery of in-kind
education, healthcare, water, and sanitation benefits. The introduction of performance conditionality
and transparency initiatives, it is hoped, will increase the accountability of decentralized government
units.
Income inequality has a complex set of drivers including educational opportunities, access to
healthcare, water, and sanitation, availability of infrastructure, financial inclusion, and gender
inequality. Not all of these are influenced by fiscal policy, but the progressivity of taxes and
government expenditures is undisputedly significant. It is important to note that the assessment
summarized in this report aims to uncover only the extent of redistribution achieved by the fiscal
system and remains silent on its dynamic and long-term effects on income inequality as well as their
channels. These issues are beyond the scope of the study and the interested reader is referred to the
2015 issue of the IMF’s Regional Economic Outlook for Sub-Saharan Africa for an overview.
Furthermore, this study focuses solely on the fiscal year 2012/13, because this is the latest year in
which the Uganda National Household Survey was carried out. Additional assessments of earlier or
later periods are required to uncover trends, so further research is called for.
The Ugandan CEQ Assessment demonstrates that fiscal policy in Uganda is equalizing and does not
increase poverty. However, the redistributive impact is quite small, especially when compared with
similar low-income countries such as Ethiopia and Tanzania and with the trend observed for twenty-
nine low- and middle-income countries (including Uganda).12 The small effect is primarily driven by
low social spending (as a share of GDP), which in turn may be driven by low revenues from
domestic collections and low revenues overall. Tax revenues in the year 2012/13 were just under 12
percent of GDP (provisional figures), lower than in Ethiopia and Tanzania, for example. At just over
12 percent, fiscal expenditures were also small (as a proportion of GDP), and the social expenditures
that were executed at least partly to redistribute income accounted for approximately one-third of the
total.
Within the social expenditures, education and health had the largest effect in reducing national
income inequality, achieving a reduction of 1.6 Gini points (education and health make up a
reduction of about 1.0 and 0.6 Gini points each individually). These in-kind transfers also constituted
the largest proportion of social expenditure (at 2.4 and 1.6 percent of GDP, respectively). Direct 12 Argentina (Rossignolo, 2017); Armenia (Younger and Khachatryan, 2017); Bolivia (Paz-Arauco and others, 2014); Brazil (Higgins and Pereira, 2014); Chile (Martinez-Aguilar and others, 2017); Colombia (Melendez and Martinez, 2015); Costa Rica (Sauma and Trejos, 2014); Dominican Republic (Aristy-Escuder and others, 2017); Ecuador (Llerena and others, 2015); El Salvador (Beneke, Lustig, and Oliva, 2017); Ethiopia (Hill and others, 2017); Georgia (Cancho and Bondarenko, 2017); Ghana (Younger, Osei-Assibey, and Oppong, 2017); Guatemala (Cabrera, Lustig, and Moran, 2015); Honduras (Icefi, 2017a); Indonesia (Jellema, Wai-Poi, and Afkar, 2017); Iran (Enami, Lustig, and Taqdiri, 2017); Jordan (Alam, Inchauste, and Serajuddin, 2017); Mexico (Scott, 2014); Nicaragua (Icefi, 2017b); Peru (Jaramillo, 2014); Russia (Lopez-Calva and others, 2017), South Africa (Inchauste and others, 2017); Sri Lanka (Arunatilake, Inchauste, and Lustig, 2017); Tanzania (Younger, Myamba, and Mdadila, 2016); Tunisia (Jouini and others, 2017); Uruguay (Bucheli and others, 2014); and Venezuela (Molina, 2016).
ECINEQ WP 2016 - 416 October 2016
5
transfers have provided meaningful income to the poor, but geographical coverage of these transfers
is very limited and thus they have led only to a modest reduction in income inequality of 0.1 Gini
points. Indirect subsidies of water, electricity, and agricultural inputs had a negligible, but equalizing
redistributive impact in the period studied, reducing inequality by only 0.05 Gini points. On the tax
side, VAT and excise taxes are neutral to slightly equalizing in distributive terms, in part due to their
exemption schedule. Income taxes, which do not affect the poorest 50 percent of the population,
help reduce inequality in disposable income by 1.2 Gini points.
Uganda’s fiscal system leaves the incidence of poverty virtually unchanged: when the impact of
indirect taxes and indirect subsidies is taken into account, Uganda’s “no change” is the third-best
result in a seven-country comparator group (Bolivia, Ethiopia, Ghana, Honduras, Nicaragua,
Tanzania, and Uganda). Furthermore, Uganda is the only low-income country in Africa in which the
poverty headcount after taking into account the effect of indirect taxes and subsidies does not rise
above the market income (or “pre-fiscal”) poverty headcount. This remarkable outcome has as much
to do with the value of non-market consumption (autoproduction, autoconsumption) in rural areas
where the majority of the poor are located as with the set of indirect tax exemptions and indirect
subsidies on the provision of water, electricity, and agricultural inputs. These results are relevant
when considering options to increase domestic resource mobilization in Uganda. Whatever path is
chosen, it is important to assess the impact of reforms on the tax and subsidy system on the poor.
The rest of this report is organized in the following manner: section 1 will provide an overview of the
main transfers and taxes in Uganda; section 2 will explain the methodology behind the assessment
and a description of the data sources; section 3 will provide an overview of the main findings from
the Uganda assessment together with international benchmark comparisons; and section 4 will
conclude and spell out the implications the results have for policy in Uganda.
2. Social Spending and Taxation in Uganda
The following sections examine the level and composition of public social expenditures and revenue
collection.
2.1 Social Spending and Subsidies
Social spending in Uganda can be divided in three categories: in-kind transfers, direct transfers, and
indirect subsidies. As outlined in the introduction, in-kind transfers were the government’s main
instrument to address income inequality until around 2003, and they remain today the largest transfer
item (in terms of expenditure magnitudes) in the government’s portfolio of expenditures. Beginning
in the early 2000s, however, the government shifted focus and concentrated on more targeted direct
transfers aimed at reducing regional inequalities as their main inequality reduction tool. Targeted,
direct transfers may see their share of public expenditures decrease as the government has declared
ECINEQ WP 2016 - 416 October 2016
6
that, going forward, it intends to focus on reducing poverty and inequality by boosting agricultural
productivity and by increasing investment in other productive sectors.13
Table 1 provides a snapshot of expenditures in the fiscal year 2012/13. Social expenditures – social
protection, education, health, and housing and urban spending – account for nearly two-fifths of
total expenditures; infrastructure approximately one-third; defense spending one-tenth; and other
sectors (for example, energy and mineral development, information and communications technology,
tourism, trade, and industry; these are not shown in table 1, the remaining 17 percent.
Table 1 also provides a snapshot of the fiscal expenditures covered by Uganda’s CEQ Assessment.
Defense spending (“security” in Uganda budget report terminology) and infrastructure are not
covered while most of the social protection portfolio is incorporated. The only “in-kind” social
spending that is not covered by this CEQ Assessment is “housing/urban” spending, of which there
is very little in Uganda as a whole and virtually none undertaken outside of the capital, Kampala.
13 MoFPED (2016).
ECINEQ WP 2016 - 416 October 2016

7
Table 1: Uganda Government Expenditures, 2012/13
UGX, (billions) % of GDP Included?
Total Expenditure 7,454 12.1% …
Defense Spending 749 1.2% No
Social Spending 2,817 4.6% Yes
Social Protection 344 0.6% …
Social Assistance of which 84 0.14% Yes
Cash Transfers 84 0.14% Yes
Noncontributory Pensions … … …
Near Cash Transfers … … …
Other … … …
Social Insurance 260 0.4% Yes
Education of which 1,504 2.4% …
Pre-school n.c. n.c. …
Primary 750 1.2% Yes
Secondary 528 0.9% Yes
Post-secondary non-tertiary n.c. n.c. …
Tertiary 202 0.3% Yes
Health of which 969 1.6% Yes
Contributory n.c. n.c. …
Noncontributory n.c. n.c. …
Housing & Urban 24 0.04% No
Subsidies of which 129 0.21% …
Energy of which … … …
Electricity … … …
Fuel … … …
Food … … …
Inputs for Agriculture 18 n.c. Yes
Water 91 n.c. Yes
Rural Electrification 9 n.c. Yes
Infrastructure 2,595 4.21% No
Note: Expenditures (and revenues) included in Uganda’s CEQ Assessment may not be fully allocated within the Uganda National Household Survey (UNHS) for various reasons – see section 3 below for more detail on the allocative methods and assumptions. Source: Uganda Annual Budget Performance Report 2012/13
Key: ... means the value is not applicable
n.c. means the value was not calculated.
2.1.1 In-Kind Transfers
Education:
The main education expenditure is for capitation grants for primary and secondary school students,
which are allocated to schools based on their current enrollment figures. At a primary level, schools
receive a grant of about 7,000 Ugandan shillings (UGX) in 2012/13 (currently about US$2.11) per
ECINEQ WP 2016 - 416 October 2016

8
student per year. For secondary school the amount was about 41,000 UGX (currently about
US$12.35) for government schools and 47,000 UGX for public private partnership schools (currently
about US$14.16) per student per year enrolled in one of the identified schools under Uganda's
Universal Secondary Education Program (Uganda Ministry of Education and Sports, 2013). At a
tertiary level, the government allocates scholarships for study at public institutions.
Health:
Uganda abolished user fees in public health facilities in 2001 in support of the government's overall
aim of attaining universal health care coverage. Health transfers are made through grants to a district
government level. These transfers include payments of wages for health workers at all district health
facilities, funding for service delivery operations by the health departments, as well as a development
grant for constructing and rehabilitating health facilities.14
2.1.2 Direct Transfers
Social Assistance Grants Transfer for Empowerment (SAGE):
This programme – which began as a pilot in 2011 and is targeted at the poorest and most vulnerable
members of society with an aim of providing them a minimum level of income security – is currently
being delivered in fourteen districts in Northern Uganda. As part of the SAGE program, regular cash
transfers are made to individuals or households under two separate schemes. The first is the Senior
Citizen Grant (SCG) targeting individuals who are above 65 years of age (or in the case of the
Karamoja region, above 60 years). The second is the Vulnerable Family Support Grant (VFSG) which
targets households with low labor capacity as a result of age or physical disability and high
dependency ratios, with district specific thresholds. The exact eligibility is determined through a
targeting exercise that takes place every two to three years. Under both schemes, each individual or
family receives about 25,000 UGX (approximately US$7.50) per month. This figure is revised on an
annual basis to ensure it is in line with inflation.
Northern Uganda Social Action Fund (NUSAF):
The second round of this program (NUSAF II) began in 2009 under the auspices of the Office of
the Prime Minister. It was established to support communities in previously war-torn Northern
Uganda, which remains one of the poorest regions of the country. Two programs under NUSAF are
focused on transferring cash and assets to vulnerable individuals: the Household Income Support
Programme (HISP) and the Public Works Programme (PWP). HISP finances income-generating activities
and supports livelihood and skills development initiatives that create further opportunities for self-
employment. Under this program, transfers of livestock or other productive assets are made to
groups of up to fifteen individuals. To be eligible, groups have to include the most vulnerable
members of society, determined by a community participatory wealth-ranking exercise, and they have
14 MoFPED (2016).
ECINEQ WP 2016 - 416 October 2016
9
to be comprised of at least 50 percent women. The overall value of the transfer can be up to
US$5000 per group. The government aims to target 8000 groups with these transfers.
PWP targets beneficiaries geographically based on a set of pre-determined poverty and socio-
economic indicators. This program supports labor intensive interventions to provide poor household
with additional income support that can help them weather the impact of rising food prices. On
average, each project employs up to 250 people for the period of one month. The maximum funding
is US$20,000 per district and US$10,000 per project. The target under NUSAF II is to fund 1000
such projects, generating about 5.5 million employment days, over a period of five years.
2.1.3 Indirect Subsidies
Water and Electricity:
In urban areas, heavy direct subsidies of water and electricity consumption had been phased out by
the time of the Uganda National Household Survey (UNHS) 2012/13 (our primary source for micro-
data; see below), but both utility sectors still receive indirect subsidies in the form of infrastructure
investment contributions. In the case of water, tariffs in urban areas are set to cover operating and
maintenance costs, so consumption of water in urban areas is only subsidized indirectly by lowering
the investment cost component that would otherwise have to be recovered through higher tariffs. In
rural areas, water supply is directly subsidised from the national budget, which funds part of the
operating costs of water delivery.
The situation is slightly different in the case of electricity where some cross subsidization occurs;
while serving rural customers is more expensive than serving urban customers, both pay the same
tariff, and no direct government subsidies of operating costs are in place, not even in rural areas. This
cross subsidization (enforced by government contracting, but not funded from government revenues
directly) is not included in the Uganda CEQ Assessment. Similar to the water sector, the government
also provides indirect subsidies of infrastructure to expand rural electrification. These expenditures
are counted as indirect subsidies and are included in the Uganda CEQ Assessment.
National Agricultural Advisory Services (NAADS):
NAADS is a semi-autonomous public agency under the Ministry of Agriculture, Animal Industries,
and Fisheries that is responsible for the provision of extension services to farmers across the
country. NAADS organizes the distribution of a range of agricultural inputs to support interventions
along the value chain, for example seeds, seedlings, and farming equipment such as hoes. The
government is currently planning an expansion of NAADS, so it likely that the importance of
indirect subsidies of agricultural inputs will increase in the years to come.
2.2 Revenues
Table 2 provides a snapshot of public revenue sources in the fiscal year 2012/13. Uganda’s revenues
come largely from indirect taxes like a VAT, excise taxes (including on petroleum products), and
trade taxes. Direct taxes – the pay as you earn (PAYE) personal income tax and various corporate
ECINEQ WP 2016 - 416 October 2016
10
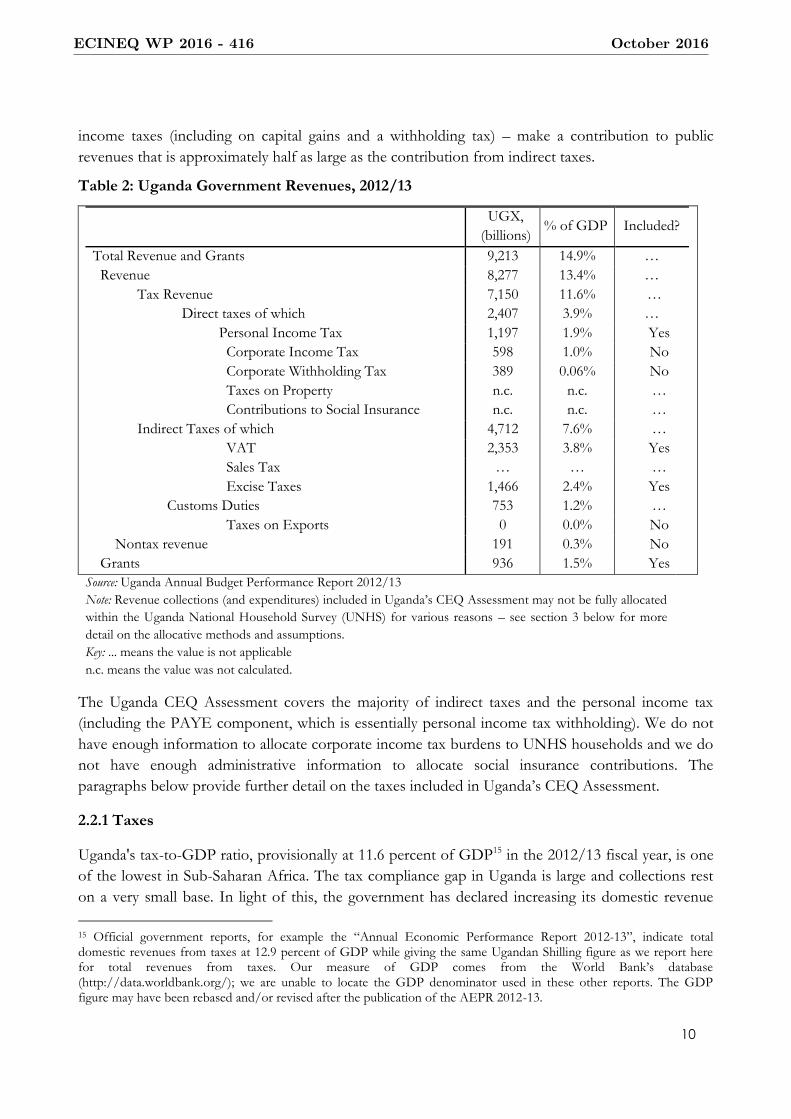
income taxes (including on capital gains and a withholding tax) – make a contribution to public
revenues that is approximately half as large as the contribution from indirect taxes.
Table 2: Uganda Government Revenues, 2012/13
UGX,
(billions) % of GDP Included?
Total Revenue and Grants 9,213 14.9% …
Revenue 8,277 13.4% …
Tax Revenue 7,150 11.6% …
Direct taxes of which 2,407 3.9% …
Personal Income Tax 1,197 1.9% Yes
Corporate Income Tax 598 1.0% No
Corporate Withholding Tax 389 0.06% No
Taxes on Property n.c. n.c. …
Contributions to Social Insurance n.c. n.c. …
Indirect Taxes of which 4,712 7.6% …
VAT 2,353 3.8% Yes
Sales Tax … … …
Excise Taxes 1,466 2.4% Yes
Customs Duties 753 1.2% …
Taxes on Exports 0 0.0% No
Nontax revenue 191 0.3% No
Grants 936 1.5% Yes
Source: Uganda Annual Budget Performance Report 2012/13
Note: Revenue collections (and expenditures) included in Uganda’s CEQ Assessment may not be fully allocated
within the Uganda National Household Survey (UNHS) for various reasons – see section 3 below for more
detail on the allocative methods and assumptions.
Key: ... means the value is not applicable
n.c. means the value was not calculated.
The Uganda CEQ Assessment covers the majority of indirect taxes and the personal income tax
(including the PAYE component, which is essentially personal income tax withholding). We do not
have enough information to allocate corporate income tax burdens to UNHS households and we do
not have enough administrative information to allocate social insurance contributions. The
paragraphs below provide further detail on the taxes included in Uganda’s CEQ Assessment.
2.2.1 Taxes
Uganda's tax-to-GDP ratio, provisionally at 11.6 percent of GDP15 in the 2012/13 fiscal year, is one
of the lowest in Sub-Saharan Africa. The tax compliance gap in Uganda is large and collections rest
on a very small base. In light of this, the government has declared increasing its domestic revenue
15 Official government reports, for example the “Annual Economic Performance Report 2012-13”, indicate total domestic revenues from taxes at 12.9 percent of GDP while giving the same Ugandan Shilling figure as we report here for total revenues from taxes. Our measure of GDP comes from the World Bank’s database (http://data.worldbank.org/); we are unable to locate the GDP denominator used in these other reports. The GDP figure may have been rebased and/or revised after the publication of the AEPR 2012-13.
ECINEQ WP 2016 - 416 October 2016

11
base as a policy priority. Under the National Budget Framework, the government declared the goal to
raise the tax-to-GDP ratio at a rate of 0.5 percent per annum with the goal of achieving a ratio of
16.3 percent by the 2020/21 fiscal year. To achieve this goal, reforms targeted at improving
efficiency (rather than increasing rates) are planned: increasing investment in revenue collection,
saving on costs and modernizing systems, and integrating tax systems operating at different levels of
government (inter alia).
The main domestic taxes in Uganda are the following:
--- Income taxes:
--- The personal income tax (including PAYE withholding); marginal rates range from 0
to 40 percent16
--- Corporate tax: the standard rate is 30 percent
--- Withholding tax on corporate income: 6 percent
--- Presumptive income tax: 1.5 percent of gross turnover or a flat fee depending on the
bracket
--- Consumption taxes:
--- VAT: 18 percent
--- Excise duties (including on fuels)
--- Customs duties
Although the VAT has a uniform rate, there are various exemptions and zero-rated products. These
are targeted at goods that have been identified to be consumed by the poor and represent an attempt
to make the consumption tax less regressive. Examples of exempt goods are unprocessed foodstuffs
and agricultural products (except for wheat grain) and supply of various agricultural inputs. Customs
duties are applied at common external tariff (CET) rates specified in the East African Community
(EAC) framework; the EAC-CET specifies zero percent rates for raw materials, capital goods,
agricultural inputs, and medicines and medical equipment and lower rates (than the CET rate) for
intermediate goods and other essential industrial inputs, and finished goods.
2.3 International Perspective on Fiscal Magnitudes and Composition
Based on figures 18-2 and 18-3 below, it is clear that Uganda´s domestic revenue collections effort
are below similar low-income countries such as Ethiopia and Tanzania (figure 2) and the broader
trend for twenty-nine low- and middle-income countries (figure 3). In fact, Uganda raises revenues
16 Technically, the PAYE rate converges to 40 percent with income; the 40 percent marginal rate is only applied to income over 120 million UGX.
ECINEQ WP 2016 - 416 October 2016
12
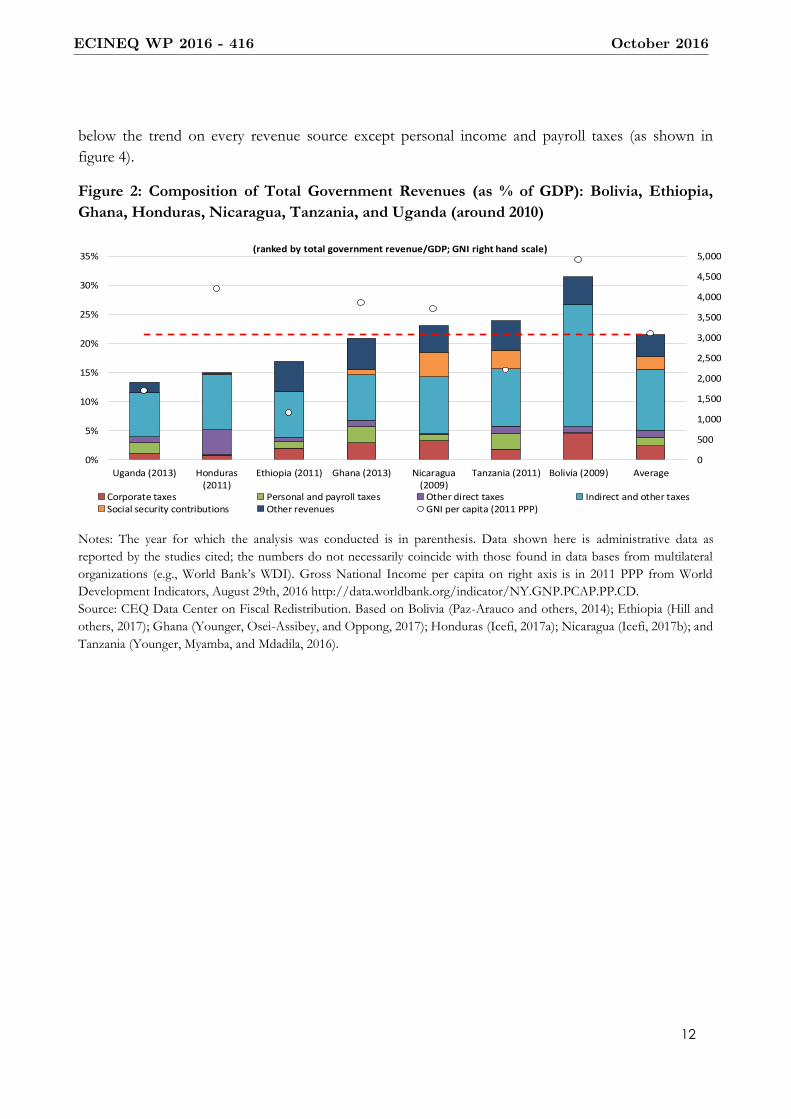
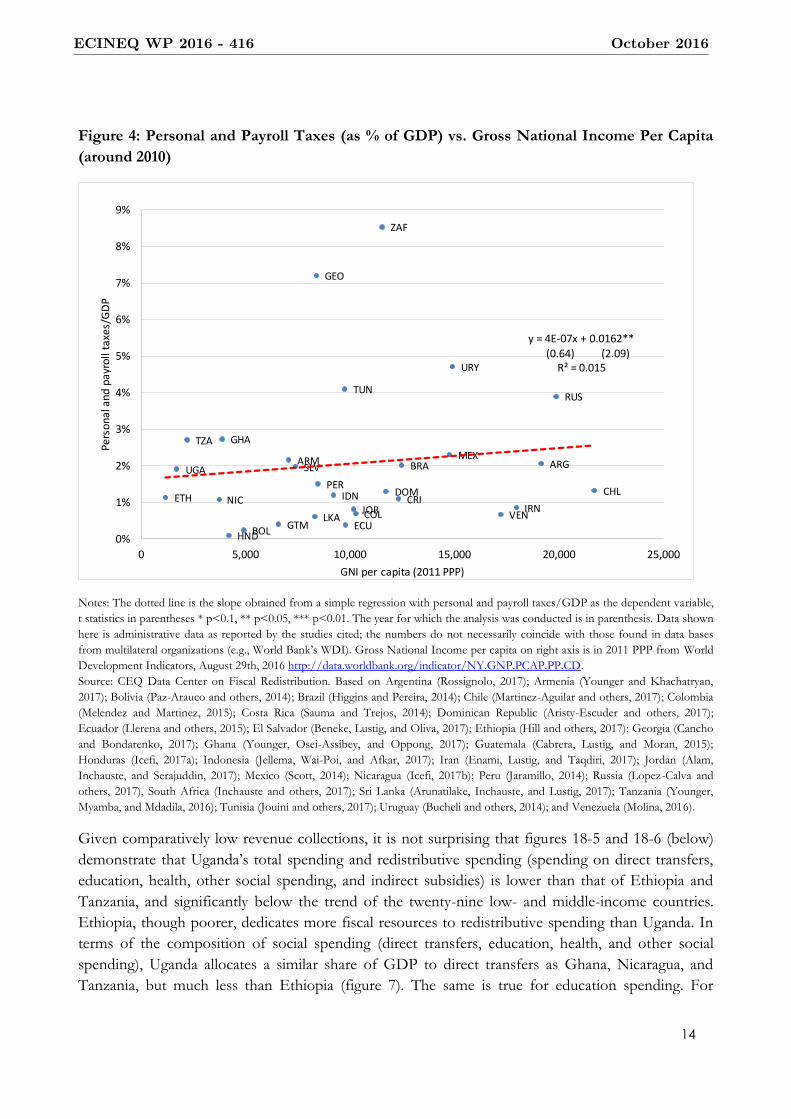
below the trend on every revenue source except personal income and payroll taxes (as shown in
figure 4).
Figure 2: Composition of Total Government Revenues (as % of GDP): Bolivia, Ethiopia,
Ghana, Honduras, Nicaragua, Tanzania, and Uganda (around 2010)
Notes: The year for which the analysis was conducted is in parenthesis. Data shown here is administrative data as
reported by the studies cited; the numbers do not necessarily coincide with those found in data bases from multilateral
organizations (e.g., World Bank’s WDI). Gross National Income per capita on right axis is in 2011 PPP from World
Development Indicators, August 29th, 2016 http://data.worldbank.org/indicator/NY.GNP.PCAP.PP.CD.
Source: CEQ Data Center on Fiscal Redistribution. Based on Bolivia (Paz-Arauco and others, 2014); Ethiopia (Hill and
others, 2017); Ghana (Younger, Osei-Assibey, and Oppong, 2017); Honduras (Icefi, 2017a); Nicaragua (Icefi, 2017b); and
Tanzania (Younger, Myamba, and Mdadila, 2016).
0
500
1,000
1,500
2,000
2,500
3,000
3,500
4,000
4,500
5,000
0%
5%
10%
15%
20%
25%
30%
35%
Uganda (2013) Honduras(2011)
Ethiopia (2011) Ghana (2013) Nicaragua(2009)
Tanzania (2011) Bolivia (2009) Average
(ranked by total government revenue/GDP; GNI right hand scale)
Corporate taxes Personal and payroll taxes Other direct taxes Indirect and other taxesSocial security contributions Other revenues GNI per capita (2011 PPP)
ECINEQ WP 2016 - 416 October 2016

13
Figure 3: Total Revenue (as % of GDP) vs. Gross National Income Per Capita (around 2010)
Notes: The dotted line is the slope obtained from a simple regression with total revenue/GDP as the dependent variable,
t statistics in parentheses * p<0.1, ** p<0.05, *** p<0.01. Gross National Income per capita is in 2011 PPP from World
Development Indicators, August 29th, 2016:
http://data.worldbank.org/indicator/NY.GNP.PCAP.PP.CD.
Source: CEQ Data Center on Fiscal Redistribution. Based on Argentina (Rossignolo, 2017); Armenia (Younger and
Khachatryan, 2017); Bolivia (Paz-Arauco and others, 2014); Brazil (Higgins and Pereira, 2014); Chile (Martinez-Aguilar
and others, 2017); Colombia (Melendez and Martinez, 2015); Costa Rica (Sauma and Trejos, 2014); Dominican Republic
(Aristy-Escuder and others, 2017); Ecuador (Llerena and others, 2015); El Salvador (Beneke, Lustig, and Oliva, 2017);
Ethiopia (Hill and others, 2017); Georgia (Cancho and Bondarenko, 2017); Ghana (Younger, Osei-Assibey, and Oppong,
2017); Guatemala (Cabrera, Lustig, and Moran, 2015); Honduras (Icefi, 2017a); Indonesia (Jellema, Wai-Poi, and Afkar,
2017); Iran (Enami, Lustig, and Taqdiri, 2017); Jordan (Alam, Inchauste, and Serajuddin, 2017); Mexico (Scott, 2014);
Nicaragua (Icefi, 2017b); Peru (Jaramillo, 2014); Russia (Lopez-Calva and others, 2017), South Africa (Inchauste and
others, 2017); Sri Lanka (Arunatilake, Inchauste, and Lustig, 2017); Tanzania (Younger, Myamba, and Mdadila, 2016);
Tunisia (Jouini and others, 2017); Uruguay (Bucheli and others, 2014); and Venezuela (Molina, 2016).
ARG
ARM
BOL
BRA
CHL
COL
CRI
DOM
ECU
SLV
ETH
GEO
GHA
GTM
HNDIDN
IRN
JOR
MEXNICPER
RUS
ZAF
LKA
TZATUN
UGA
URY VENy = 6E-06x + 0.1747***
(2.89) (7.69)R² = 0.2359
0%
5%
10%
15%
20%
25%
30%
35%
40%
0 5,000 10,000 15,000 20,000 25,000
Tota
l rev
enue
/GD
P
GNI per capita (2011 PPP)
ECINEQ WP 2016 - 416 October 2016
14
Figure 4: Personal and Payroll Taxes (as % of GDP) vs. Gross National Income Per Capita
(around 2010)
Notes: The dotted line is the slope obtained from a simple regression with personal and payroll taxes/GDP as the dependent variable,
t statistics in parentheses * p<0.1, ** p<0.05, *** p<0.01. The year for which the analysis was conducted is in parenthesis. Data shown
here is administrative data as reported by the studies cited; the numbers do not necessarily coincide with those found in data bases
from multilateral organizations (e.g., World Bank’s WDI). Gross National Income per capita on right axis is in 2011 PPP from World
Development Indicators, August 29th, 2016 http://data.worldbank.org/indicator/NY.GNP.PCAP.PP.CD.
Source: CEQ Data Center on Fiscal Redistribution. Based on Argentina (Rossignolo, 2017); Armenia (Younger and Khachatryan,
2017); Bolivia (Paz-Arauco and others, 2014); Brazil (Higgins and Pereira, 2014); Chile (Martinez-Aguilar and others, 2017); Colombia
(Melendez and Martinez, 2015); Costa Rica (Sauma and Trejos, 2014); Dominican Republic (Aristy-Escuder and others, 2017);
Ecuador (Llerena and others, 2015); El Salvador (Beneke, Lustig, and Oliva, 2017); Ethiopia (Hill and others, 2017); Georgia (Cancho
and Bondarenko, 2017); Ghana (Younger, Osei-Assibey, and Oppong, 2017); Guatemala (Cabrera, Lustig, and Moran, 2015);
Honduras (Icefi, 2017a); Indonesia (Jellema, Wai-Poi, and Afkar, 2017); Iran (Enami, Lustig, and Taqdiri, 2017); Jordan (Alam,
Inchauste, and Serajuddin, 2017); Mexico (Scott, 2014); Nicaragua (Icefi, 2017b); Peru (Jaramillo, 2014); Russia (Lopez-Calva and
others, 2017), South Africa (Inchauste and others, 2017); Sri Lanka (Arunatilake, Inchauste, and Lustig, 2017); Tanzania (Younger,
Myamba, and Mdadila, 2016); Tunisia (Jouini and others, 2017); Uruguay (Bucheli and others, 2014); and Venezuela (Molina, 2016).
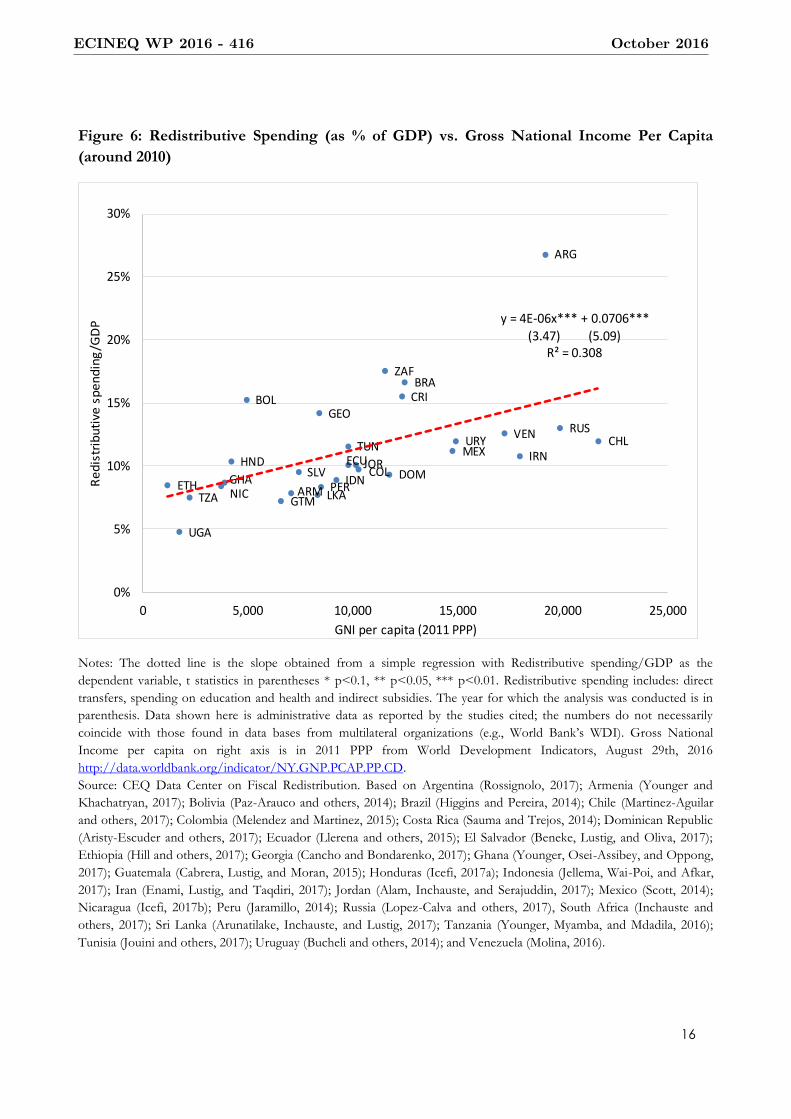
Given comparatively low revenue collections, it is not surprising that figures 18-5 and 18-6 (below)
demonstrate that Uganda’s total spending and redistributive spending (spending on direct transfers,
education, health, other social spending, and indirect subsidies) is lower than that of Ethiopia and
Tanzania, and significantly below the trend of the twenty-nine low- and middle-income countries.
Ethiopia, though poorer, dedicates more fiscal resources to redistributive spending than Uganda. In
terms of the composition of social spending (direct transfers, education, health, and other social
spending), Uganda allocates a similar share of GDP to direct transfers as Ghana, Nicaragua, and
Tanzania, but much less than Ethiopia (figure 7). The same is true for education spending. For
ARGARM
BOL
BRA
CHL
COL
CRIDOM
ECU
SLV
ETH
GEO
GHA
GTMHND
IDNIRNJOR
MEX
NIC
PER
RUS
ZAF
LKA
TZA
TUN
UGA
URY
VEN
y = 4E-07x + 0.0162**(0.64) (2.09)
R² = 0.015
0%
1%
2%
3%
4%
5%
6%
7%
8%
9%
0 5,000 10,000 15,000 20,000 25,000
Per
son
al a
nd
pay
roll
taxe
s/G
DP
GNI per capita (2011 PPP)
ECINEQ WP 2016 - 416 October 2016

15
health, however, Uganda spends a share similar to Ghana and Tanzania, and a slightly higher share
than Ethiopia.
Figure 5: Total Primary and Redistributive Spending Plus Contributory Pensions (as % of
GDP): Bolivia, Ethiopia, Ghana, Honduras, Nicaragua, Tanzania, and Uganda (around
2010)
Notes: The year for which the analysis was conducted is in parenthesis. Redistributive spending includes: direct transfers,
spending on education and health and indirect subsidies. Data shown here is administrative data as reported by the
studies cited; the numbers do not necessarily coincide with those found in data bases from multilateral organizations (e.g.,
World Bank’s WDI). Gross National Income per capita on right axis is in 2011 PPP from World Development
Indicators, August 29th, 2016
http://data.worldbank.org/indicator/NY.GNP.PCAP.PP.CD.
Source: CEQ Data Center on Fiscal Redistribution. Based on Bolivia (Paz-Arauco and others, 2014); Ethiopia (Hill and
others, 2017); Ghana (Younger, Osei-Assibey, and Oppong, 2017); Honduras (Icefi, 2017a); Nicaragua (Icefi, 2017b); and
Tanzania (Younger, Myamba, and Mdadila, 2016).
0
1,000
2,000
3,000
4,000
5,000
0%
5%
10%
15%
20%
25%
30%
35%
Uganda (2013) Ethiopia (2011) Honduras (2011) Ghana (2013) Nicaragua(2009)
Tanzania (2011) Bolivia (2009) Average
(ranked by primary spending / GDP; GNI right hand scale)
Redistributive spending Contributory pensions GNI per capita (2011 PPP)
ECINEQ WP 2016 - 416 October 2016
16
Figure 6: Redistributive Spending (as % of GDP) vs. Gross National Income Per Capita
(around 2010)
Notes: The dotted line is the slope obtained from a simple regression with Redistributive spending/GDP as the
dependent variable, t statistics in parentheses * p<0.1, ** p<0.05, *** p<0.01. Redistributive spending includes: direct
transfers, spending on education and health and indirect subsidies. The year for which the analysis was conducted is in
parenthesis. Data shown here is administrative data as reported by the studies cited; the numbers do not necessarily
coincide with those found in data bases from multilateral organizations (e.g., World Bank’s WDI). Gross National
Income per capita on right axis is in 2011 PPP from World Development Indicators, August 29th, 2016
http://data.worldbank.org/indicator/NY.GNP.PCAP.PP.CD.
Source: CEQ Data Center on Fiscal Redistribution. Based on Argentina (Rossignolo, 2017); Armenia (Younger and
Khachatryan, 2017); Bolivia (Paz-Arauco and others, 2014); Brazil (Higgins and Pereira, 2014); Chile (Martinez-Aguilar
and others, 2017); Colombia (Melendez and Martinez, 2015); Costa Rica (Sauma and Trejos, 2014); Dominican Republic
(Aristy-Escuder and others, 2017); Ecuador (Llerena and others, 2015); El Salvador (Beneke, Lustig, and Oliva, 2017);
Ethiopia (Hill and others, 2017); Georgia (Cancho and Bondarenko, 2017); Ghana (Younger, Osei-Assibey, and Oppong,
2017); Guatemala (Cabrera, Lustig, and Moran, 2015); Honduras (Icefi, 2017a); Indonesia (Jellema, Wai-Poi, and Afkar,
2017); Iran (Enami, Lustig, and Taqdiri, 2017); Jordan (Alam, Inchauste, and Serajuddin, 2017); Mexico (Scott, 2014);
Nicaragua (Icefi, 2017b); Peru (Jaramillo, 2014); Russia (Lopez-Calva and others, 2017), South Africa (Inchauste and
others, 2017); Sri Lanka (Arunatilake, Inchauste, and Lustig, 2017); Tanzania (Younger, Myamba, and Mdadila, 2016);
Tunisia (Jouini and others, 2017); Uruguay (Bucheli and others, 2014); and Venezuela (Molina, 2016).
ARG
ARM
BOL
BRA
CHL
COL
CRI
DOMECU
SLVETH
GEO
GHA
GTM
HND
IDN
IRNJOR
MEX
NICPER
RUS
ZAF
LKATZA
TUN
UGA
URYVEN
y = 4E-06x*** + 0.0706***
(3.47) (5.09)R² = 0.308
0%
5%
10%
15%
20%
25%
30%
0 5,000 10,000 15,000 20,000 25,000
Re
dis
trib
uti
ve s
pe
nd
ing
/GD
P
GNI per capita (2011 PPP)
ECINEQ WP 2016 - 416 October 2016

17
Figure 7: Composition of Social Spending (as % of GDP): Bolivia, Ethiopia, Ghana,
Honduras, Nicaragua, Tanzania, and Uganda (around 2010)
Notes:
The year for which the analysis was conducted is in parenthesis. Data shown here is administrative data as reported by
the studies cited; the numbers do not necessarily coincide with those found in data bases from multilateral organizations
(e.g., World Bank’s WDI). Figure for OECD average (includes only advanced countries) was directly provided by the
statistical office of the organization. Other social spending includes expenditures in housing and community amenities;
environmental protection; and recreation, culture and religion. Gross National Income per capita on right axis is in 2011
PPP from World Development Indicators, August 29th, 2016:
http://data.worldbank.org/indicator/NY.GNP.PCAP.PP.CD.
Source: CEQ Data Center on Fiscal Redistribution. Based on Bolivia (Paz-Arauco and others, 2014); Ethiopia (Hill and
others, 2017); Ghana, (Younger, Osei-Assibey, and Oppong, 2017); Honduras, (Icefi, 2017a); Nicaragua (Icefi, 2017b);
and Tanzania, (Younger, Myamba, and Mdadila, 2016).
3. Methods and Data
The following sections describe the CEQ fiscal incidence assessment methodology in general as well
as the specific methodological choices made for the Uganda CEQ Assessment.
3.1 Methodological Summary
The CEQ Assessment takes specific fiscal policy elements, programs, expenditures, or revenue
collections – such as those described above – and allocates them to individuals and households
appearing in a micro-level socio-economic survey. Once the allocations are made, the CEQ analytical
program consists of calculating different measures of poverty and impoverishment, inequality and
progressiveness, and the amount of redistribution accomplished (inter alia) on the measures of
income – or “income concepts” – that exclude (“pre-fiscal”) and include (“post-fiscal”) these fiscal
policy elements. Figure 8 summarizes the construction of these income concepts.
The Uganda CEQ Assessment incorporates every type of fiscal policy element listed in figure 8.
However, as the income module in the UNHS was judged to be unreliable and would likely lead to
underreporting of income for those with little-to-no income from the sources listed in the UNHS as
0
500
1,000
1,500
2,000
2,500
3,000
3,500
4,000
4,500
5,000
0%
2%
4%
6%
8%
10%
12%
14%
16%
18%
20%
Uganda (2013) Tanzania (2011) Ghana (2013) Ethiopia (2011) Nicaragua (2009) Honduras (2011) Bolivia (2009) Average OECD (2011)
(ranked by social spending / GDP; GNI right hand scale)
Direct transfers Education Health Other social spending GNI per capita (2011 PPP)
ECINEQ WP 2016 - 416 October 2016

18
well as for those with very high incomes (from any source), we chose to use consumption
expenditure as our measure of primary income.17 We assumed total consumption expenditures –
including the value of imputed rent for those living in owner-occupied housing as well as the implied
value of any auto-production/auto-consumption – were equal to the CEQ disposable income
concept (approximately in the middle of the flowchart in figure 8) and work “backwards” and
“forwards” from disposable income to other CEQ income concepts.18
17 See Bollinger and Hirsch (2013); Bollinger and Hirsch (2007). These examples include thorough treatments of the difficulties created by recall error and item non-response in socio-economic survey income modules. 18 As consumption expenditure is our primary income measure, and as all other income concepts including market
income are derived from consumption expenditure, we do not create a taxable income concept; other CEQ Assessments
do produce this income concept when relevant. Creating a taxable income concept requires knowledge of the
composition of market income, a Ugandan household’s expenditure profile (in the UNHS) cannot provide any
information in the composition of income. Relatedly, we are unable to say anything about the savings or current asset
profile UNHS households for the same reason: a current consumption expenditure profile does not provide any
information on investment spending nor on the returns accruing to any households assets.
ECINEQ WP 2016 - 416 October 2016

19
Figure 8: CEQ Income Concepts and Fiscal Policy Elements
Source: Higgins and Lustig (2017b)
3.2 Data Sources
The primary micro-level dataset providing the individual- and household-level information necessary
to allocate fiscal policy elements is the UNHS 2012/13.19 The Uganda Bureau of Statistics carries out
two nationally representative surveys that cover consumption and income behavior on a regular
19 The allocations – including the assumptions and choices implicit in them – are described in the following section.
Market Income
+ Direct transfers
Direct taxes
Gross Income Net Market Income
Market Income plus Pensions
-
Disposable Income
Direct transfers
+
Direct taxes
-
Indirect subsidies
+ Indirect taxes
-
Monetized value of
education and health
services
+
Co-payments and user
fees for education and
health services
-
Consumable Income
Final Income
-
ECINEQ WP 2016 - 416 October 2016

20
basis, the Uganda National Panel Survey (UNPS) and UNHS. The UNHS has twice the sample size
of the UNPS (6887 households surveyed in the UNHS vs 3188 households in the UNPS) and
provides better statistical power at sub-national levels, which is especially important for allocating
direct transfers in Uganda (see below). The UNHS is conducted approximately every three years
using a two-stage stratified sample design that allows for reliable estimations of key indicators at the
national, rural-urban, regional and separately for the sub-regional level. Apart from coverage of in-
kind transfers received, the survey contains detailed information about income sources and
consumption levels that enable imputations of effective taxation, as well as the imputation of
effective indirect transfers and subsidies.
The source for total revenues collected by the government from households – via the PAYE, VAT,
and excise taxes – is the Annual Budget Performance Report (ABPR) 2012/13 published by the
Ministry of Finance, Planning and Economic Development (MoFPED). To impute “effective” or
actually prevailing rates (which may differ from statutory rates), we first scale down the expected tax
take from UNHS households so that the ratio of VAT (for example) revenues in the ABPR to
Private Final Household Consumption Expenditure in Uganda National Accounts data is equivalent
to the ratio of VAT collections from UNHS households to the value of cumulative UNHS
household consumption expenditure. For VAT and the excise taxes, the total revenue figure from
the ABPR we use includes revenues via the application of those taxes (when applicable) to
domestically-produced goods and services.20
Government expenditure on indirect subsidies for water and electricity, and in-kind transfers of
healthcare and education services are also taken from the ABPR 2012/13. Expenditures on
agricultural input subsidies (delivered by the NAADS agency – see above) were provided by the
MoFPED. These subsidies and in-kind transfers are scaled in a manner equivalent to the scaling of
taxes. The ABPR also provides aggregate expenditure information for the government agency
responsible for the two programs that feature direct transfers, NUSAF and SAGE (as explained in
the previous section). We use operational reports, program characteristics, and rules to allocate
uniform transfer magnitudes to all households that are imputed to be eligible (or to households
deemed to host at least one eligible individual) for these programs. The total amount of direct
transfer expenditure allocated, then, is not scaled in the way that the other fiscal policy elements
described above are.
3.3 Allocation Assumptions
When and where possible, CEQ Assessments allocate fiscal policy elements to individuals or
households based on direct observation. For example, when an individual queried in a socio-
economic survey is asked to recall how much she has paid in VAT on all her purchases in the last 7
days, or is asked to provide receipts detailing VAT payments, then we directly “observe” the total
VAT collection from that individual. These VAT payments recorded by individuals are then assumed
to be the same VAT revenues listed in the executive, administrative, and other budget reporting for
20 While imported goods also attract VAT and excise (potentially), we are unable to determine which UNHS household expenditures are for imported goods and which for domestic goods.
ECINEQ WP 2016 - 416 October 2016

21
the same year. In Uganda, however, very few fiscal policy elements could be allocated via direct
observation; the subheadings below provide a summary of allocation assumptions and decisions for
various fiscal policy elements.
2.3.1 Personal Income Taxes
PAYE income tax collections allocated in the UNHS were scaled such that the ratio of total PAYE
revenues in administrative records to National Accounts Household Final Consumption Expenditure
was equivalent to the ratio of PAYE collected from UNHS households to total UNHS Consumption
Expenditures. The PAYE rate schedule was adjusted so that the marginal change in PAYE rates
between PAYE brackets remained intact while total PAYE collections remained equal to the amount
described above. Taxpayer status was imputed based on a combination of (a) having recorded taxable
income above the PAYE policy threshold, (b) the respondent indicating positively that he or she had
made either PAYE payments or social security payments (or had them made on his or her behalf),
and (c) the respondent having a higher score of two or greater on a “formality of employment” scale
if and when there were no determinate answers to the questions listed in (b). The “formality of
employment” score was generated within the household survey and is additive across seven
characteristics including the receipt of paid sick leave and vacation, the duration of the contract, and
other benefits.
2.3.2 Simulated Direct Transfers
Both of the umbrella programs under which Uganda’s direct transfers are executed – the Social
Assistance Grants for Empowerment and the Northern Uganda Social Action Fund – operate in
limited areas and there is no question in the UNHS that records receipts of any direct transfers.
Instead, we use program reports (from the Ugandan executing agency as well as multilateral
development agencies) to understand eligibility, (annual) coverage, and (annual) benefit levels. We
then parameterize eligibility and generate transfer-eligible populations within the household survey
and randomly allocate program-specific benefits to program-specific eligible household pools until
we reach (approximately) the average number of beneficiaries and benefits delivered yearly according
to program reporting.
2.3.3 VAT, Excise, and Fuel Excise: Based on Expenditure Records
We cannot directly identify VAT or excise tax amounts paid, so instead we back out, for each
purchased item, the share of the item’s value that is a VAT or excise charge. In order to determine
this share, these taxes are scaled in two ways. The first scale factor involves selecting the proportion
of the total tax collection we expect to be generated by household expenditure. For VAT, non-fuel
excise, and fuel excise, these first scale factors are 0.5, 1.0, and 0.1 (respectively).21 When this first
21 These first factors are not chosen arbitrarily. For VAT we had a preview of estimates (generated by the Uganda Revenue Authority) of sector-level VAT collections: over 80 percent of VAT collections (in the 2012/13 fiscal year) were generated from just two sectors: manufacturing and electricity/gas/steam and air-conditioning supply. As final consumers in these sectors need not be exclusively households or private citizens, we guessed that less than 100 percent of VAT collections were coming from direct purchases by households. We then chose a proportion of VAT to allocate
ECINEQ WP 2016 - 416 October 2016

22
scale factor is less than one, it indicates our assumption that the tax in question is not collected
exclusively from households. For example, the 0.1 factor on the fuel excise indicates we assume 90
percent of the fuel excise collection total (listed in table 1 above) is coming from the
commercial/industrial/enterprise and government/NGO sectors. We do not assume the fuel excise
collected from the non-household sectors does not create a burden for households (through higher
prices of other goods and services consumed); however in this report we only allocate the direct
burden of indirect taxes like VAT and the excise tax.22
The second scale factor is generated in the following way: we calculate the ratio of revenues collected
(per indirect tax) in the ABPR to Household Final Consumption Expenditure in the National
Accounts and set it equal to the ratio of revenues collected from UNHS households (per tax) to
cumulative UNHS consumption expenditure. We then create categories of goods in the UNHS
consumption module which, according to tax statutes, attract the tax in question. For example, the
only good listed in the UNHS consumption module which attracts the fuel excise tax is fuel itself;
only UNHS households who record nonzero expenditure on fuel are allocated a fuel excise tax.23 For
the VAT, we created within the UNHS consumption expenditure records a measure of “VAT-able”
consumption expenditure, and applied our imputed effective VAT rate to those expenditures only.
We decided which items were “VAT-able” according to policy and statutes.
We then determine the share of the tax in the total expenditure value of the taxed good (or good
category). From this share we determine what “effective” rate of taxation would, when applied to the
value of the good, net of the indirect tax paid, give us back the actual sales value of the good as
recorded by households in the UNHS.
The “effective” rate, or the on-average actual rate, so calculated allows us to take care not to allocate
indirect taxes to purchases of goods or services which are exempt from the tax. We also implicitly
exclude any informal purchases that are not included in the sales over which an indirect tax is
collected. However, because we do not directly observe informal purchases, the reduction in taxes
collected (and therefore the reduction in taxes allocated to UNHS households) due to informal
purchases or weak tax administration is allocated to all households purchasing the good (or category
of goods) which is taxed.
to households based on the effective rate that it implied (14.6 percent) compared with the statutory rate (18 percent). For the fuel excise, we knew that only 6 percent of UNHS households recorded positive fuel purchases. As for VAT, we chose the first fuel excise factor, 0.1, based on the effective rate of taxation (on fuel) that it implied (217 percent) compared to the statutory rate (217 percent). The non-fuel excise is collected primarily from alcoholic beverages, tobacco, chewing gum, sweets, chocolate, and other comestibles as well as from furniture, cosmetics and perfumes, banking fees and money transfers, and cement. All of these items (save for cement) are plausibly purchased by households. 22 See Jellema and Inchauste (2017) for a theoretical model and estimation tools and procedures for estimating the indirect effects of indirect taxes within the CEQ Assessment framework. 23 We do not have access to the sales value of the VAT-able base by sector or good/service category, so we instead assume that VAT was collected at the same rate (proportional to net-of-VAT price) over all goods that attract the VAT. Uganda’s excise tax applies to sugar, alcoholic beverages, tobacco, cell phone minutes, cement, cosmetics, and the statutory excise rates occupy a range, but because excise collections are not available by sector, the total excise collection from UNHS households is accomplished in a manner similar to that for VAT; that is, we assume that excise is collected at the same rate (proportional to net-of-excise price) over all goods attracting the excise.
ECINEQ WP 2016 - 416 October 2016

23
3.3.4 Electricity and Water Subsidies
As the previous section indicates, water and electricity tariffs are not directly subsidized, but the
Rural and Urban Water Supply programs and the Rural Electrification program provide (to the utility
operators) a fixed, on-budget sum annually that is meant to cover network maintenance, investment,
and upgrading costs. In other words, without this budget support, utility operators would raise prices
so that total revenues collected privately covered these costs as well. For these programs, we divide
the total (scaled) expenditure on these programs by the total number of eligible users in the UNHS
to get a per-user subsidy. We are allocating to eligible households an amount that would cover, for
example, a fixed “connection charge”; this in turn means more intensive utility users receive the same
total subsidy as less intensive users.
3.3.5 Agricultural Input Subsidy
The NAADS Agricultural Input Subsidy provides beneficiaries with (some) free agricultural inputs.
The UNHS does not record the source of the purchase for those individuals who purchase
agricultural inputs. We turn to Uganda’s National Service Delivery Survey (NSDS) to generate a
propensity score (at the household level) for acquiring NAADS-subsidized inputs (conditional on
having purchased any agricultural inputs). We then generate that propensity score (again at the
household level) for UNHS households and select households with the highest propensity scores
until the number of NAADS-subsidy beneficiaries in the UNHS (as a percent of the agricultural-
input-purchasing pool of households in the UNHS) matches the number of NAADS-subsidy
beneficiaries in the NSDS (as a percent of agricultural-input-purchasing pool of households in the
NSDS). Given the technique we use to allocate NAADS expenditures, this allocation can be
described as the expected allocation of expected benefits available under the NAADS program.
3.3.6 In-Kind Transfers
Uganda’s expenditures on education and health are allocated to those UNHS households where at
least one member utilizes the public education or public healthcare service system (respectively). As
for the water and electricity subsidies, scaled in-kind spending is divided by the total number of
UNHS users in order to get a “per student” or “per patient” subsidy; this uniform subsidy amount is
then allocated to all directly-identified users. So a single household with an enrolled primary school
student, an enrolled secondary school student, one visit to a (public) hospital, and two visits to the
(public) outpatient clinic, would receive five different in-kind subsidies for the five service types
utilized.
4. Results
The following sections summarize the impact of Ugandan fiscal policy on contemporaneous poverty
and inequality.
4.1 Does Fiscal Policy have an Impact on Inequality and Poverty?
Overall, inequality would be higher in Uganda if the fiscal policy elements covered here (see tables
18-1 and 18-2) were eliminated; in other words, Uganda fiscal policy does reduce inequality. For
ECINEQ WP 2016 - 416 October 2016
24
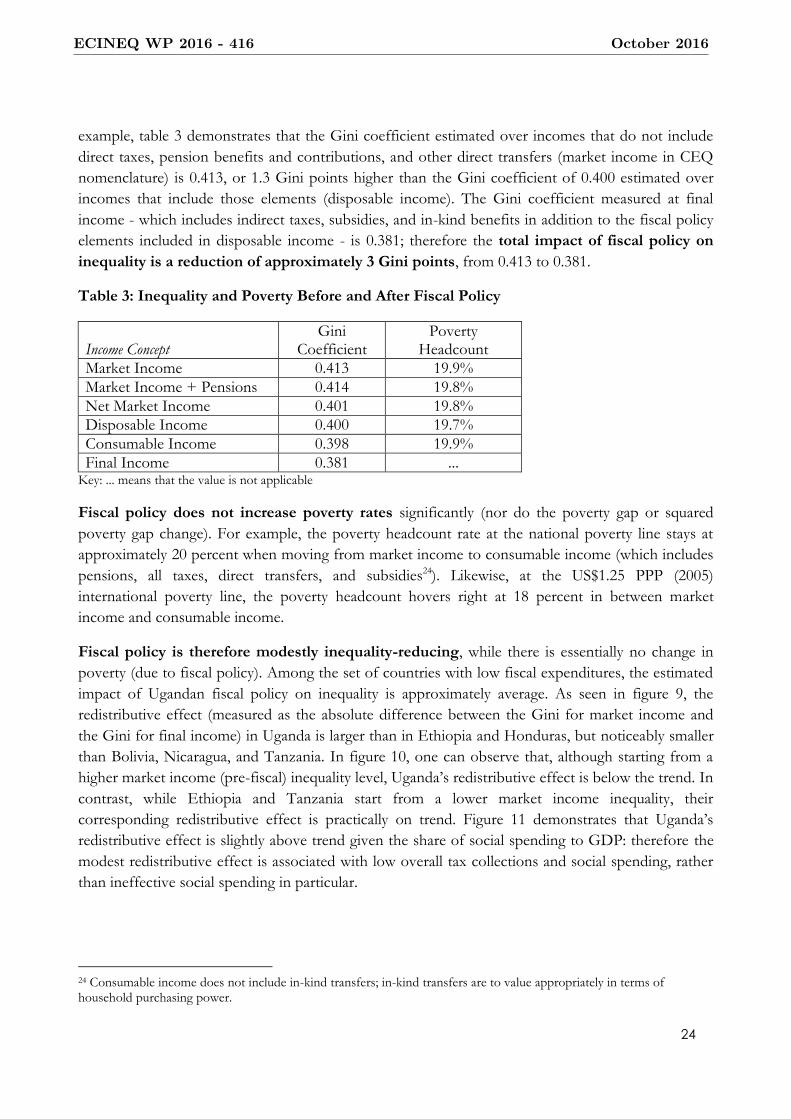
example, table 3 demonstrates that the Gini coefficient estimated over incomes that do not include
direct taxes, pension benefits and contributions, and other direct transfers (market income in CEQ
nomenclature) is 0.413, or 1.3 Gini points higher than the Gini coefficient of 0.400 estimated over
incomes that include those elements (disposable income). The Gini coefficient measured at final
income - which includes indirect taxes, subsidies, and in-kind benefits in addition to the fiscal policy
elements included in disposable income - is 0.381; therefore the total impact of fiscal policy on
inequality is a reduction of approximately 3 Gini points, from 0.413 to 0.381.
Table 3: Inequality and Poverty Before and After Fiscal Policy
Income Concept Gini
Coefficient Poverty
Headcount
Market Income 0.413 19.9%
Market Income + Pensions 0.414 19.8%
Net Market Income 0.401 19.8%
Disposable Income 0.400 19.7%
Consumable Income 0.398 19.9%
Final Income 0.381 ... Key: ... means that the value is not applicable
Fiscal policy does not increase poverty rates significantly (nor do the poverty gap or squared
poverty gap change). For example, the poverty headcount rate at the national poverty line stays at
approximately 20 percent when moving from market income to consumable income (which includes
pensions, all taxes, direct transfers, and subsidies24). Likewise, at the US$1.25 PPP (2005)
international poverty line, the poverty headcount hovers right at 18 percent in between market
income and consumable income.
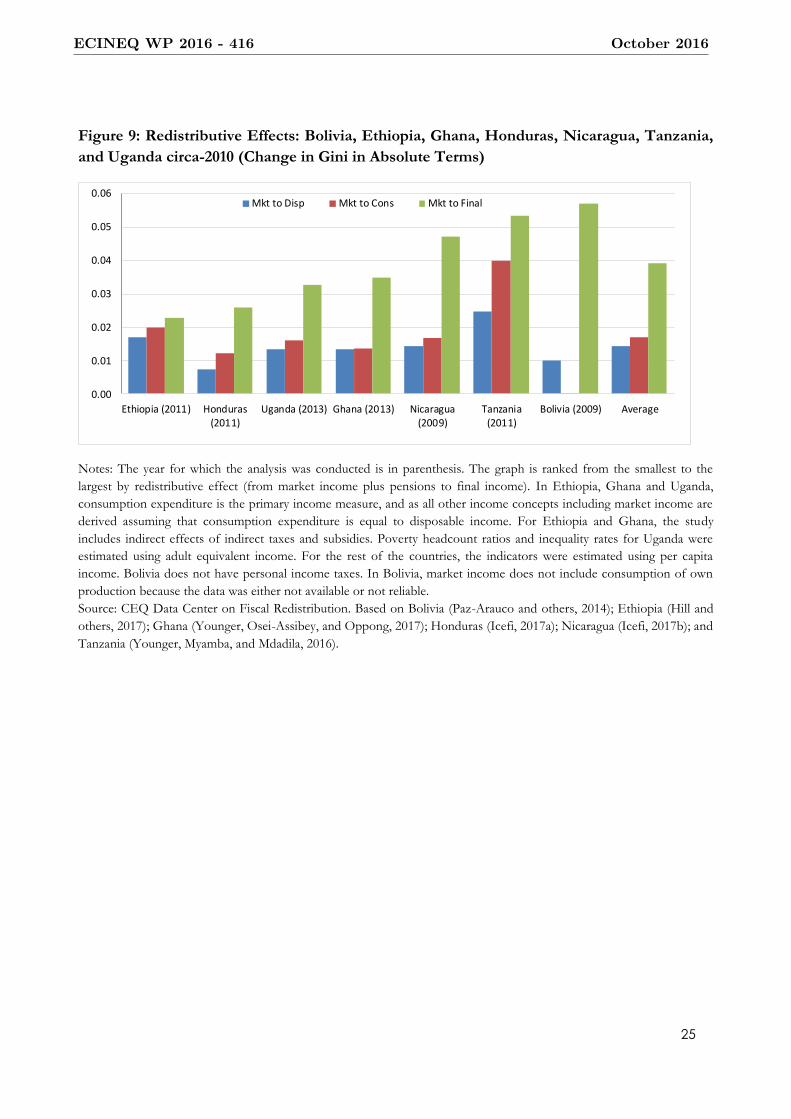
Fiscal policy is therefore modestly inequality-reducing, while there is essentially no change in
poverty (due to fiscal policy). Among the set of countries with low fiscal expenditures, the estimated
impact of Ugandan fiscal policy on inequality is approximately average. As seen in figure 9, the
redistributive effect (measured as the absolute difference between the Gini for market income and
the Gini for final income) in Uganda is larger than in Ethiopia and Honduras, but noticeably smaller
than Bolivia, Nicaragua, and Tanzania. In figure 10, one can observe that, although starting from a
higher market income (pre-fiscal) inequality level, Uganda’s redistributive effect is below the trend. In
contrast, while Ethiopia and Tanzania start from a lower market income inequality, their
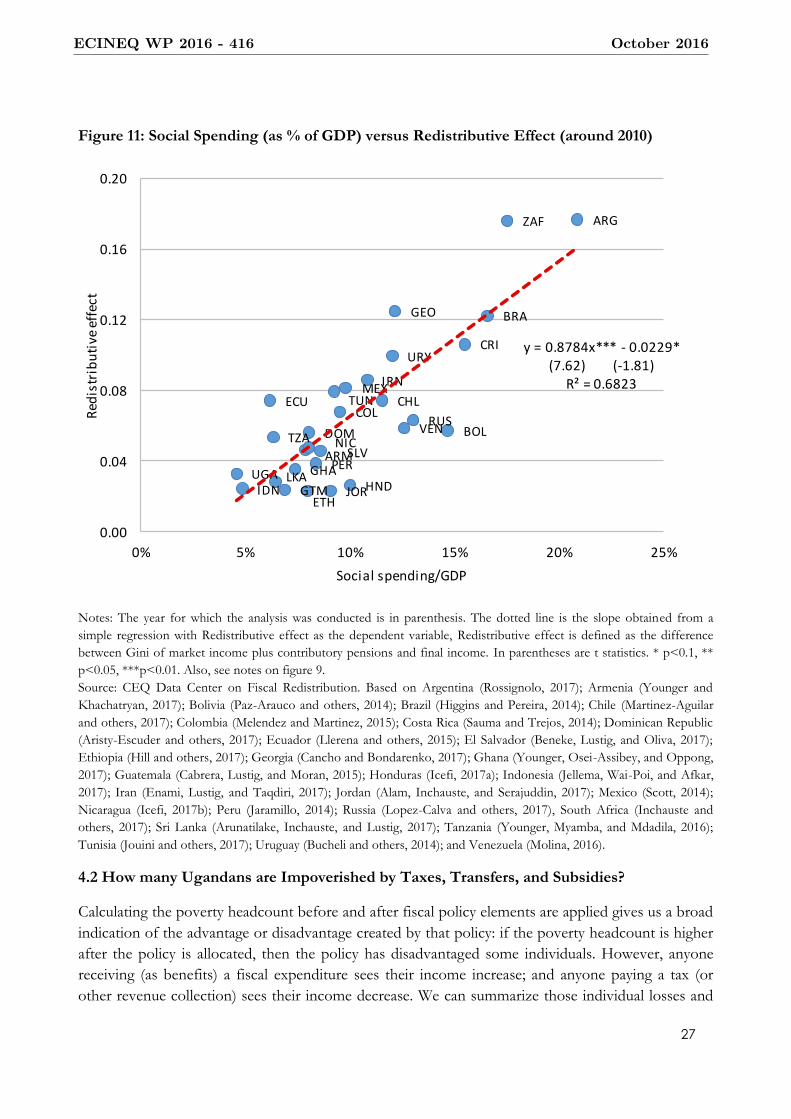
corresponding redistributive effect is practically on trend. Figure 11 demonstrates that Uganda’s
redistributive effect is slightly above trend given the share of social spending to GDP: therefore the
modest redistributive effect is associated with low overall tax collections and social spending, rather
than ineffective social spending in particular.
24 Consumable income does not include in-kind transfers; in-kind transfers are to value appropriately in terms of household purchasing power.
ECINEQ WP 2016 - 416 October 2016
25
Figure 9: Redistributive Effects: Bolivia, Ethiopia, Ghana, Honduras, Nicaragua, Tanzania,
and Uganda circa-2010 (Change in Gini in Absolute Terms)
Notes: The year for which the analysis was conducted is in parenthesis. The graph is ranked from the smallest to the
largest by redistributive effect (from market income plus pensions to final income). In Ethiopia, Ghana and Uganda,
consumption expenditure is the primary income measure, and as all other income concepts including market income are
derived assuming that consumption expenditure is equal to disposable income. For Ethiopia and Ghana, the study
includes indirect effects of indirect taxes and subsidies. Poverty headcount ratios and inequality rates for Uganda were
estimated using adult equivalent income. For the rest of the countries, the indicators were estimated using per capita
income. Bolivia does not have personal income taxes. In Bolivia, market income does not include consumption of own
production because the data was either not available or not reliable.
Source: CEQ Data Center on Fiscal Redistribution. Based on Bolivia (Paz-Arauco and others, 2014); Ethiopia (Hill and
others, 2017); Ghana (Younger, Osei-Assibey, and Oppong, 2017); Honduras (Icefi, 2017a); Nicaragua (Icefi, 2017b); and
Tanzania (Younger, Myamba, and Mdadila, 2016).
0.00
0.01
0.02
0.03
0.04
0.05
0.06
Ethiopia (2011) Honduras(2011)
Uganda (2013) Ghana (2013) Nicaragua(2009)
Tanzania(2011)
Bolivia (2009) Average
Mkt to Disp Mkt to Cons Mkt to Final
ECINEQ WP 2016 - 416 October 2016

26
Figure 10: Initial Inequality and Redistributive Effect (around 2010)
Notes: The year for which the analysis was conducted is in parenthesis. The dotted line is the slope obtained from a
simple regression with Redistributive effect as the dependent variable, Redistributive effect is defined as the difference
between Gini of market income plus contributory pensions and final income. In parentheses are t statistics. * p<0.1, **
p<0.05, ***p<0.01. Also, see notes on figure 9.
Source: CEQ Data Center on Fiscal Redistribution. Based on Argentina (Rossignolo, 2017); Armenia (Younger and
Khachatryan, 2017); Bolivia (Paz-Arauco and others, 2014); Brazil (Higgins and Pereira, 2014); Chile (Martinez-Aguilar
and others, 2017); Colombia (Melendez and Martinez, 2015); Costa Rica (Sauma and Trejos, 2014); Dominican Republic
(Aristy-Escuder and others, 2017); Ecuador (Llerena and others, 2015); El Salvador (Beneke, Lustig, and Oliva, 2017);
Ethiopia (Hill and others, 2017); Georgia (Cancho and Bondarenko, 2017); Ghana (Younger, Osei-Assibey, and Oppong,
2017); Guatemala (Cabrera, Lustig, and Moran, 2015); Honduras (Icefi, 2017a); Indonesia (Jellema, Wai-Poi, and Afkar,
2017); Iran (Enami, Lustig, and Taqdiri, 2017); Jordan (Alam, Inchauste, and Serajuddin, 2017); Mexico (Scott, 2014);
Nicaragua (Icefi, 2017b); Peru (Jaramillo, 2014); Russia (Lopez-Calva and others, 2017), South Africa (Inchauste and
others, 2017); Sri Lanka (Arunatilake, Inchauste, and Lustig, 2017); Tanzania (Younger, Myamba, and Mdadila, 2016);
Tunisia (Jouini and others, 2017); Uruguay (Bucheli and others, 2014); and Venezuela (Molina, 2016).
ARG
ARM BOL
BRA
CHL COL
CRI
DOM
ECU
SLVETH
GEO
GHA
GTM HNDIDN
IRN
JOR
MEX
NIC PER
RUS
ZAF
LKA
TZA
TUN
UGA
URY
VEN
y = 0.2823x*** - 0.0656*(3.86) (-1.88)
R² = 0.3551
0.00
0.04
0.08
0.12
0.16
0.20
0.20 0.35 0.50 0.65 0.80
Redi
strib
utiv
e ef
fect
Gini market income plus pensions
ECINEQ WP 2016 - 416 October 2016
27
Figure 11: Social Spending (as % of GDP) versus Redistributive Effect (around 2010)
Notes: The year for which the analysis was conducted is in parenthesis. The dotted line is the slope obtained from a
simple regression with Redistributive effect as the dependent variable, Redistributive effect is defined as the difference
between Gini of market income plus contributory pensions and final income. In parentheses are t statistics. * p<0.1, **
p<0.05, ***p<0.01. Also, see notes on figure 9.
Source: CEQ Data Center on Fiscal Redistribution. Based on Argentina (Rossignolo, 2017); Armenia (Younger and
Khachatryan, 2017); Bolivia (Paz-Arauco and others, 2014); Brazil (Higgins and Pereira, 2014); Chile (Martinez-Aguilar
and others, 2017); Colombia (Melendez and Martinez, 2015); Costa Rica (Sauma and Trejos, 2014); Dominican Republic
(Aristy-Escuder and others, 2017); Ecuador (Llerena and others, 2015); El Salvador (Beneke, Lustig, and Oliva, 2017);
Ethiopia (Hill and others, 2017); Georgia (Cancho and Bondarenko, 2017); Ghana (Younger, Osei-Assibey, and Oppong,
2017); Guatemala (Cabrera, Lustig, and Moran, 2015); Honduras (Icefi, 2017a); Indonesia (Jellema, Wai-Poi, and Afkar,
2017); Iran (Enami, Lustig, and Taqdiri, 2017); Jordan (Alam, Inchauste, and Serajuddin, 2017); Mexico (Scott, 2014);
Nicaragua (Icefi, 2017b); Peru (Jaramillo, 2014); Russia (Lopez-Calva and others, 2017), South Africa (Inchauste and
others, 2017); Sri Lanka (Arunatilake, Inchauste, and Lustig, 2017); Tanzania (Younger, Myamba, and Mdadila, 2016);
Tunisia (Jouini and others, 2017); Uruguay (Bucheli and others, 2014); and Venezuela (Molina, 2016).
4.2 How many Ugandans are Impoverished by Taxes, Transfers, and Subsidies?
Calculating the poverty headcount before and after fiscal policy elements are applied gives us a broad
indication of the advantage or disadvantage created by that policy: if the poverty headcount is higher
after the policy is allocated, then the policy has disadvantaged some individuals. However, anyone
receiving (as benefits) a fiscal expenditure sees their income increase; and anyone paying a tax (or
other revenue collection) sees their income decrease. We can summarize those individual losses and
ARG
ARM
BOL
BRA
CHLCOL
CRI
DOM
ECU
SLV
ETH
GEO
GHA
GTM HNDIDN
IRN
JOR
MEX
NIC
PER
RUS
ZAF
LKA
TZA
TUN
UGA
URY
VEN
y = 0.8784x*** - 0.0229*(7.62) (-1.81)
R² = 0.6823
0.00
0.04
0.08
0.12
0.16
0.20
0% 5% 10% 15% 20% 25%
Red
istr
ibu
tive
eff
ect
Social spending/GDP
ECINEQ WP 2016 - 416 October 2016
28
gains through the fiscal impoverishment (FI) and fiscal gains to the poor (FGP) indices (first
proposed by Higgins and Lustig25).
The FI index “tracks” each individual who becomes poor upon the execution of a fiscal policy (or a
collection of fiscal policies) to determine how much their income decreased and therefore by how
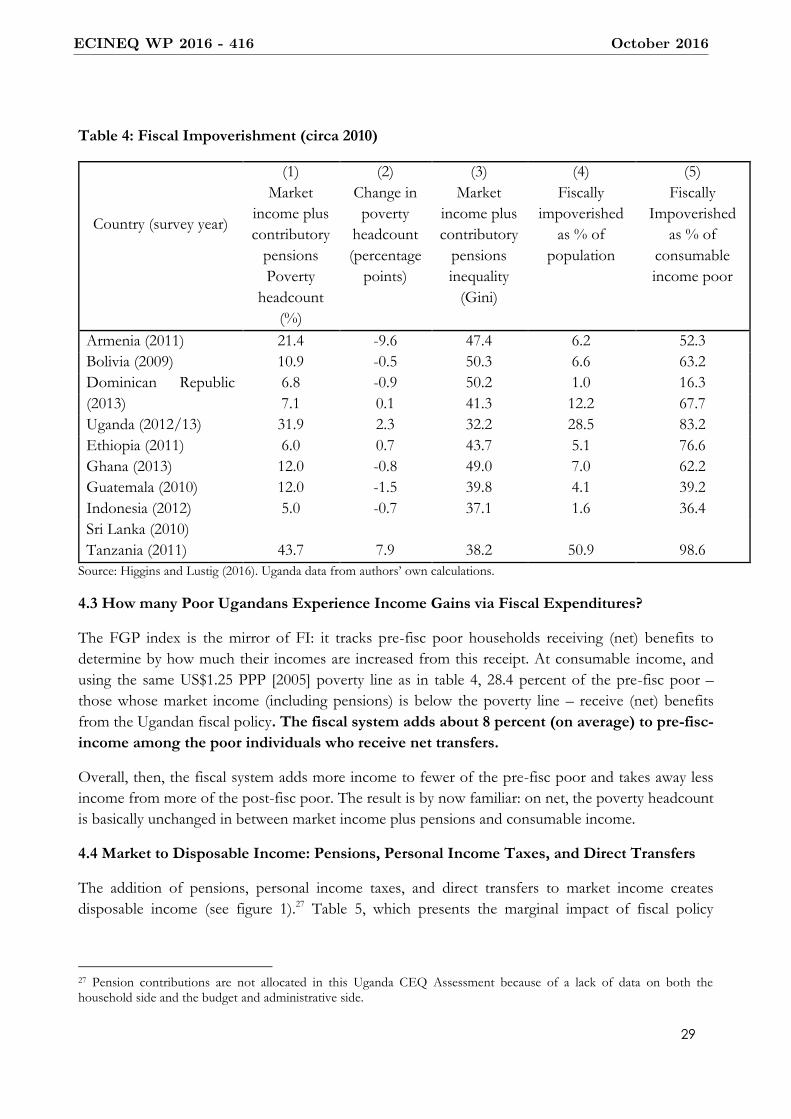
much they were impoverished. Table 4 shows that in Uganda, the net position of all households after
the addition of the PAYE income tax, direct transfers, the indirect VAT, excise, and fuel excise taxes,
and the water, electricity, and agricultural input subsidies to market income is such that 12 percent of
the population is impoverished (column 4) if poverty is measured using the US$1.25 PPP [2005] line.
In other words, 12 percent of the population would not have become impoverished (on net) had
there been no net fiscal-policy adjustment to their market incomes.26
Table 4 indicates that Uganda’s FI index (for poverty measured at the US$1.25 PPP [2005] line) puts
it in the middle of the distribution of FI performance in lower-middle income countries. Sri Lanka
and the Dominican Republic generate significantly less FI through their fiscal systems while Ghana
and Ethiopia generate significantly more; Armenia, Bolivia, and Guatemala all have somewhat lower
levels of FI through their fiscal systems. Column 5, which presents FI among the individuals who are
poor (rather than in the population at large), shows that even in Sri Lanka, where FI is negligible
when measured as a percent of the total population, about one-third of the consumable-income poor
have been impoverished by the (net) fiscal system.
25 Higgins and Lustig (2016). 26 That additional 12 percent of the Ugandan population represents approximately 68 percent of the consumable-income-poor.
ECINEQ WP 2016 - 416 October 2016
29
Table 4: Fiscal Impoverishment (circa 2010)
Country (survey year)
(1)
Market
income plus
contributory
pensions
Poverty
headcount
(%)
(2)
Change in
poverty
headcount
(percentage
points)
(3)
Market
income plus
contributory
pensions
inequality
(Gini)
(4)
Fiscally
impoverished
as % of
population
(5)
Fiscally
Impoverished
as % of
consumable
income poor
Armenia (2011)
Bolivia (2009)
Dominican Republic
(2013)
Uganda (2012/13)
Ethiopia (2011)
Ghana (2013)
Guatemala (2010)
Indonesia (2012)
Sri Lanka (2010)
Tanzania (2011)
21.4 -9.6 47.4 6.2 52.3
10.9 -0.5 50.3 6.6 63.2
6.8 -0.9 50.2 1.0 16.3
7.1 0.1 41.3 12.2 67.7
31.9 2.3 32.2 28.5 83.2
6.0 0.7 43.7 5.1 76.6
12.0 -0.8 49.0 7.0 62.2
12.0 -1.5 39.8 4.1 39.2
5.0 -0.7 37.1 1.6 36.4
43.7 7.9 38.2 50.9 98.6
Source: Higgins and Lustig (2016). Uganda data from authors’ own calculations.
4.3 How many Poor Ugandans Experience Income Gains via Fiscal Expenditures?
The FGP index is the mirror of FI: it tracks pre-fisc poor households receiving (net) benefits to
determine by how much their incomes are increased from this receipt. At consumable income, and
using the same US$1.25 PPP [2005] poverty line as in table 4, 28.4 percent of the pre-fisc poor –
those whose market income (including pensions) is below the poverty line – receive (net) benefits
from the Ugandan fiscal policy. The fiscal system adds about 8 percent (on average) to pre-fisc-
income among the poor individuals who receive net transfers.
Overall, then, the fiscal system adds more income to fewer of the pre-fisc poor and takes away less
income from more of the post-fisc poor. The result is by now familiar: on net, the poverty headcount
is basically unchanged in between market income plus pensions and consumable income.
4.4 Market to Disposable Income: Pensions, Personal Income Taxes, and Direct Transfers
The addition of pensions, personal income taxes, and direct transfers to market income creates
disposable income (see figure 1).27 Table 5, which presents the marginal impact of fiscal policy
27 Pension contributions are not allocated in this Uganda CEQ Assessment because of a lack of data on both the household side and the budget and administrative side.
ECINEQ WP 2016 - 416 October 2016

30
elements on inequality and poverty, demonstrates that pensions reduce inequality and poverty
slightly, indicating that some pension benefits are received by poorer households.28
Uganda’s PAYE personal income tax also reduces inequality slightly while leaving the
poverty headcount unchanged. As any tax collection from an individual necessarily reduces that
individual’s purchasing power over all other goods and services, then a tax (whether direct or
indirect) considered individually will always at best leave the poverty headcount unchanged (relative
the to pre-tax poverty headcount), so the Ugandan PAYE result could not be any better. The lack of
an impact on poverty is likely a result of the decision to impute taxpayer status by developing a
“formality” scale for contracted labor and allocating simulated tax amounts only to those who claim
to have paid PAYE (or to have had it deducted) or who score high on the formality scale, and have
reported taxable income above the tax threshold. There are very few poor or near-poor households
who are either formally employed or who claim to have paid PAYE with taxable income greater than
the tax threshold.29
Direct transfers in Uganda are minimal and thinly spread. The direct transfers covered here –
the HISP and the PWP, both delivered under the NUSAF, and the SCG and the VFSG under the
SAGE – cover few individuals or households. The cumulative value of these transfers is
approximately 0.1 percent of cumulative market income. NUSAF is, as its name implies, targeted to a
specific region while the SAGE program was still a pilot program in 2012. As a result, there is no
significant impact of any one of these programs on either poverty or inequality (table 5); their joint
impact is to reduce both poverty and inequality but by very small amounts.
The bottom two deciles are estimated to receive over 50 percent of the transfers available; transfers
received represent about 7 percent of the pre-fisc income of transfer beneficiaries or 9.5 percent of
the pre-fisc income of poor beneficiaries. In other words, direct transfers in Uganda are well
targeted and make a significant difference to those who receive them, but overall less than 3
percent of Ugandan households receive these transfers (in a given year). The nationwide
distribution of income is largely unchanged even after these programs are executed, meaning that
though they do reduce poverty and inequality their impact on nationwide indicators is minimal.
28 In the UNHS, we find one poor household who records receipt of pension income. 29 Our imputation gave us only two observations where a household was poor and paid PAYE; they were both rural households and they were imputed to be in the lowest tax bracket where the effective marginal rate was determined to be about 8.5 percent. Both these households are also estimated to be poor households at market income and market income + pensions income concepts, meaning they would have been poor whether or not there was a PAYE system and whether or not they actually contributed to PAYE revenues.
ECINEQ WP 2016 - 416 October 2016
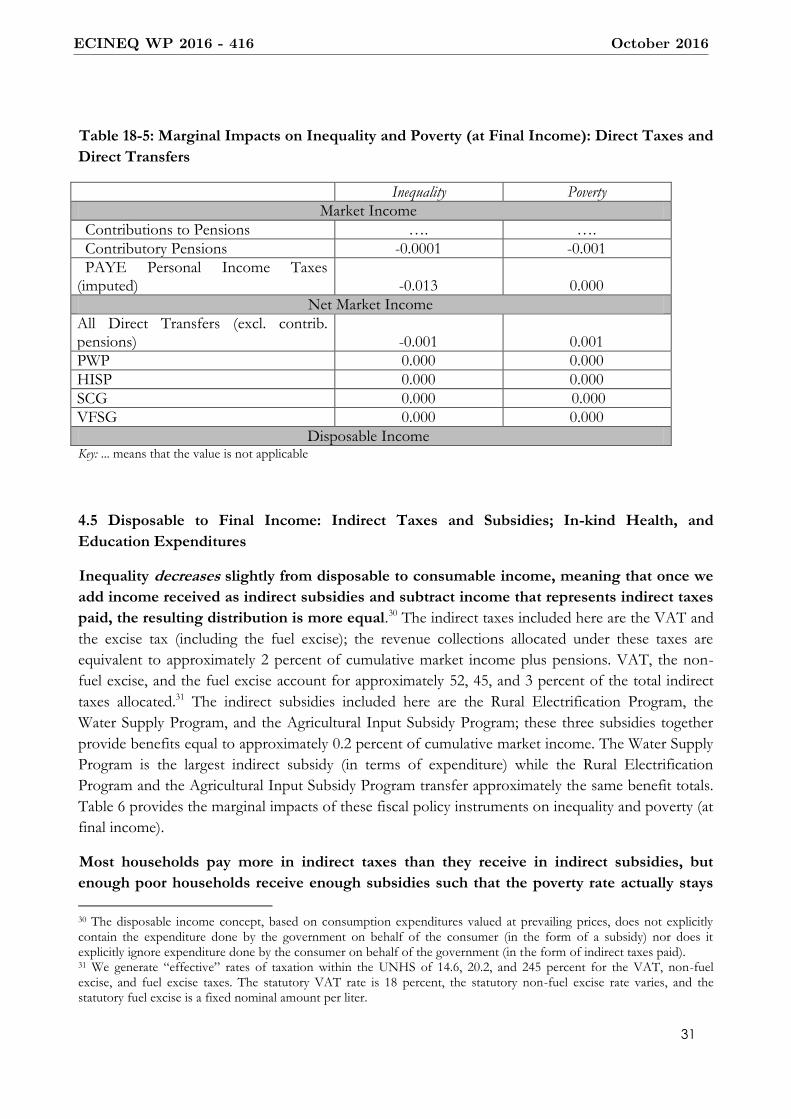
31
Table 18-5: Marginal Impacts on Inequality and Poverty (at Final Income): Direct Taxes and
Direct Transfers
Inequality Poverty
Market Income
Contributions to Pensions …. ….
Contributory Pensions -0.0001 -0.001
PAYE Personal Income Taxes (imputed) -0.013 0.000
Net Market Income
All Direct Transfers (excl. contrib. pensions) -0.001 0.001
PWP 0.000 0.000
HISP 0.000 0.000
SCG 0.000 0.000
VFSG 0.000 0.000
Disposable Income Key: ... means that the value is not applicable
4.5 Disposable to Final Income: Indirect Taxes and Subsidies; In-kind Health, and
Education Expenditures
Inequality decreases slightly from disposable to consumable income, meaning that once we
add income received as indirect subsidies and subtract income that represents indirect taxes
paid, the resulting distribution is more equal.30 The indirect taxes included here are the VAT and
the excise tax (including the fuel excise); the revenue collections allocated under these taxes are
equivalent to approximately 2 percent of cumulative market income plus pensions. VAT, the non-
fuel excise, and the fuel excise account for approximately 52, 45, and 3 percent of the total indirect
taxes allocated.31 The indirect subsidies included here are the Rural Electrification Program, the
Water Supply Program, and the Agricultural Input Subsidy Program; these three subsidies together
provide benefits equal to approximately 0.2 percent of cumulative market income. The Water Supply
Program is the largest indirect subsidy (in terms of expenditure) while the Rural Electrification
Program and the Agricultural Input Subsidy Program transfer approximately the same benefit totals.
Table 6 provides the marginal impacts of these fiscal policy instruments on inequality and poverty (at
final income).
Most households pay more in indirect taxes than they receive in indirect subsidies, but
enough poor households receive enough subsidies such that the poverty rate actually stays
30 The disposable income concept, based on consumption expenditures valued at prevailing prices, does not explicitly contain the expenditure done by the government on behalf of the consumer (in the form of a subsidy) nor does it explicitly ignore expenditure done by the consumer on behalf of the government (in the form of indirect taxes paid). 31 We generate “effective” rates of taxation within the UNHS of 14.6, 20.2, and 245 percent for the VAT, non-fuel excise, and fuel excise taxes. The statutory VAT rate is 18 percent, the statutory non-fuel excise rate varies, and the statutory fuel excise is a fixed nominal amount per liter.
ECINEQ WP 2016 - 416 October 2016

32
constant when indirect taxes and subsidies are allocated. Rural households, primarily, may be
lifted out of poverty when the government spends to deliver goods and services (water, electricity,
and agricultural inputs) at below market prices (table 6). Among poor households only, total
subsidies received represent about 0.8 percent of their (cumulative) disposable income, but the share
of total subsidies received rises with income. Subsidies can have a poverty-reduction impact, but
relative to direct transfers they are an inefficient way to assist poor and vulnerable households as
subsidies are targeted towards higher-volume users by design.
Table 6: Marginal Impacts on Inequality and Poverty (at Final Income): Indirect Taxes,
Subsidies and Spending on Education and Health
Inequality Poverty
Disposable Income
Indirect Subsidies -0.0005 -0.002
Water -0.0003 -0.001
Electricity 0.0000 0.000
NAADS – Ag. Inputs -0.0002 0.000
Indirect Taxes -0.002 0.005
VAT -0.0013 0.0032
Excise -0.0007 0.0025
Fuel excise -0.0003 0.0000
Consumable Income
In-kind spending -0.017 n.c.
Education -0.010 n.c.
Primary school -0.010 n.c.
Secondary -0.002 n.c.
Tertiary 0.002 n.c.
Health -0.006 n.c.
Clinic-based care -0.005 n.c.
Hospital-based care -0.001 n.c.
Final Income
Key: n.c. means the value was not calculated
In the CEQ framework, only those who utilize the public service provision system can benefit from
publicly-financed outputs in health and education. Even so, in Uganda, these “in-kind” services
make the largest impact on inequality: the Gini index of inequality drops by 1.7 points in between
consumable and final income, and the marginal contribution of in-kind spending is approximately
double that of the fiscal policy element with the next largest marginal contribution (personal income
taxes). Education makes a larger marginal contribution to inequality reduction – see the
international comparisons in table 7 – but there are higher total expenditures in the public education
system.
ECINEQ WP 2016 - 416 October 2016

33
The impact of public education expenditures depends on rates of enrollment – is enrollment higher
among poorer or richer households, and does the difference vary across schooling levels? The impact
of public education expenditure also depends on the generosity of the benefits provided – typically,
the education benefit level rises with the level of schooling, such that public university enrollees will
receive an in-kind transfer with a larger monetary value than will primary school enrollees. In
Uganda, education benefits do rise with education levels: the capitation grant (alone) is five to six
times as large for secondary school students as for primary school students, for example (see section
1 above).32 However, poorer household enrollment is weighted heavily toward primary school, so
poorer households have a larger share of the available primary school benefits but smaller shares of
the available secondary and tertiary school benefits. Overall, the public education benefit share of the
poorest decile (ranked by market income) is roughly 7.5 percent while the same share for the middle
and richest deciles are 9.5 and 15.5 percent (respectively). Compare this to health benefits, where the
poorest decile has a 10.5 percent share of the total public health benefits available, the middle decile a
9.7 percent share, and the top decile a 10.3 percent share.
However, the education benefits received by the poorest decile represent 6.7 percent of market
income in that group, while the education benefits received by the richest decile represent 1.1 percent
of market income in that group. For health benefits the analogous numbers are 6.5 percent (for the
poorest decile) and 0.5 percent (for the richest decile). Even though shares of total public health
spending are more equitably distributed (than education benefits), nonetheless public health benefits
are of smaller magnitude (than education benefits) and the total impact on inequality from public
health is less than that from public education spending.
As can be seen from table 7, the profile of impacts from in-kind spending in Uganda is slightly better
than average: primary education is pro-poor in that per-capita amounts spent fall as income rises,
secondary education is progressive only in relative terms and health is (approximately) neutral in
absolute terms. Only tertiary education is unequalizing (benefits as a share of market income rise as
income rises) in Uganda, but that is true in Ethiopia, Ghana, and Tanzania as well.
32 Encouragingly, we find that total education expenditures – including capital spending and other supplies, administrative costs, teacher salaries, and others – per pupil are approximately five times as large for a secondary school student as for a primary school student, and approximately three times as large for a tertiary school student as for a secondary school student. In the Uganda CEQ Assessment, we allocate to each household with one or more publicly-enrolled students a uniform benefit equal to total education expenditure (by schooling level) per enrolled student (at that level).
ECINEQ WP 2016 - 416 October 2016
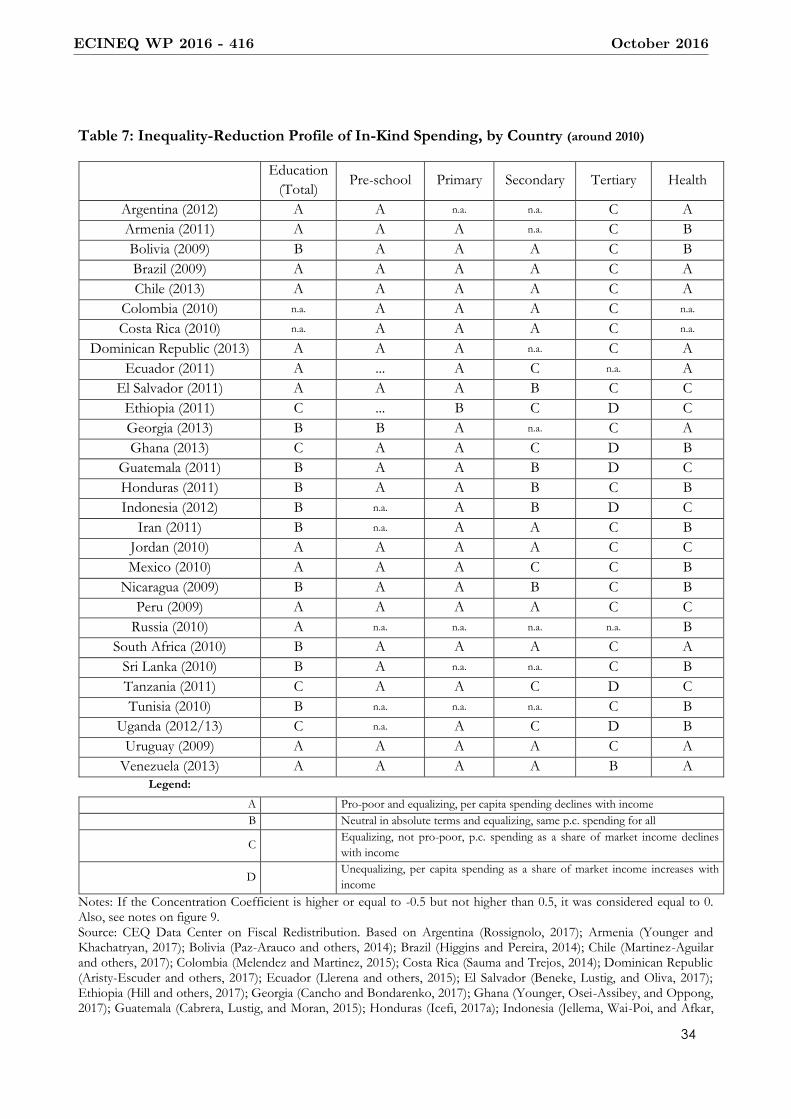
34
Table 7: Inequality-Reduction Profile of In-Kind Spending, by Country (around 2010)
Education
(Total) Pre-school Primary Secondary Tertiary Health
Argentina (2012) A A n.a. n.a. C A
Armenia (2011) A A A n.a. C B
Bolivia (2009) B A A A C B
Brazil (2009) A A A A C A
Chile (2013) A A A A C A
Colombia (2010) n.a. A A A C n.a.
Costa Rica (2010) n.a. A A A C n.a.
Dominican Republic (2013) A A A n.a. C A
Ecuador (2011) A ... A C n.a. A
El Salvador (2011) A A A B C C
Ethiopia (2011) C ... B C D C
Georgia (2013) B B A n.a. C A
Ghana (2013) C A A C D B
Guatemala (2011) B A A B D C
Honduras (2011) B A A B C B
Indonesia (2012) B n.a. A B D C
Iran (2011) B n.a. A A C B
Jordan (2010) A A A A C C
Mexico (2010) A A A C C B
Nicaragua (2009) B A A B C B
Peru (2009) A A A A C C
Russia (2010) A n.a. n.a. n.a. n.a. B
South Africa (2010) B A A A C A
Sri Lanka (2010) B A n.a. n.a. C B
Tanzania (2011) C A A C D C
Tunisia (2010) B n.a. n.a. n.a. C B
Uganda (2012/13) C n.a. A C D B
Uruguay (2009) A A A A C A
Venezuela (2013) A A A A B A
Legend:
A Pro-poor and equalizing, per capita spending declines with income B Neutral in absolute terms and equalizing, same p.c. spending for all
C Equalizing, not pro-poor, p.c. spending as a share of market income declines
with income
D Unequalizing, per capita spending as a share of market income increases with
income
Notes: If the Concentration Coefficient is higher or equal to -0.5 but not higher than 0.5, it was considered equal to 0. Also, see notes on figure 9. Source: CEQ Data Center on Fiscal Redistribution. Based on Argentina (Rossignolo, 2017); Armenia (Younger and Khachatryan, 2017); Bolivia (Paz-Arauco and others, 2014); Brazil (Higgins and Pereira, 2014); Chile (Martinez-Aguilar and others, 2017); Colombia (Melendez and Martinez, 2015); Costa Rica (Sauma and Trejos, 2014); Dominican Republic (Aristy-Escuder and others, 2017); Ecuador (Llerena and others, 2015); El Salvador (Beneke, Lustig, and Oliva, 2017); Ethiopia (Hill and others, 2017); Georgia (Cancho and Bondarenko, 2017); Ghana (Younger, Osei-Assibey, and Oppong, 2017); Guatemala (Cabrera, Lustig, and Moran, 2015); Honduras (Icefi, 2017a); Indonesia (Jellema, Wai-Poi, and Afkar,
ECINEQ WP 2016 - 416 October 2016
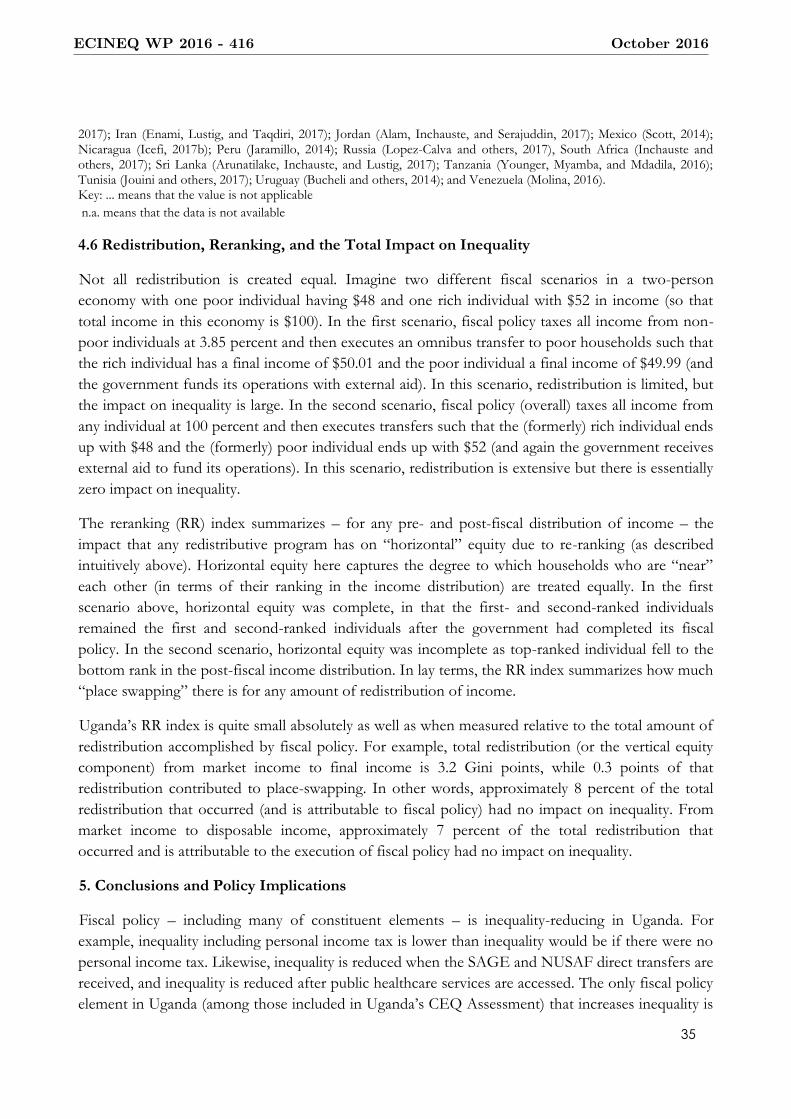
35
2017); Iran (Enami, Lustig, and Taqdiri, 2017); Jordan (Alam, Inchauste, and Serajuddin, 2017); Mexico (Scott, 2014); Nicaragua (Icefi, 2017b); Peru (Jaramillo, 2014); Russia (Lopez-Calva and others, 2017), South Africa (Inchauste and others, 2017); Sri Lanka (Arunatilake, Inchauste, and Lustig, 2017); Tanzania (Younger, Myamba, and Mdadila, 2016); Tunisia (Jouini and others, 2017); Uruguay (Bucheli and others, 2014); and Venezuela (Molina, 2016). Key: ... means that the value is not applicable
n.a. means that the data is not available
4.6 Redistribution, Reranking, and the Total Impact on Inequality
Not all redistribution is created equal. Imagine two different fiscal scenarios in a two-person
economy with one poor individual having $48 and one rich individual with $52 in income (so that
total income in this economy is $100). In the first scenario, fiscal policy taxes all income from non-
poor individuals at 3.85 percent and then executes an omnibus transfer to poor households such that
the rich individual has a final income of $50.01 and the poor individual a final income of $49.99 (and
the government funds its operations with external aid). In this scenario, redistribution is limited, but
the impact on inequality is large. In the second scenario, fiscal policy (overall) taxes all income from
any individual at 100 percent and then executes transfers such that the (formerly) rich individual ends
up with $48 and the (formerly) poor individual ends up with $52 (and again the government receives
external aid to fund its operations). In this scenario, redistribution is extensive but there is essentially
zero impact on inequality.
The reranking (RR) index summarizes – for any pre- and post-fiscal distribution of income – the
impact that any redistributive program has on “horizontal” equity due to re-ranking (as described
intuitively above). Horizontal equity here captures the degree to which households who are “near”
each other (in terms of their ranking in the income distribution) are treated equally. In the first
scenario above, horizontal equity was complete, in that the first- and second-ranked individuals
remained the first and second-ranked individuals after the government had completed its fiscal
policy. In the second scenario, horizontal equity was incomplete as top-ranked individual fell to the
bottom rank in the post-fiscal income distribution. In lay terms, the RR index summarizes how much
“place swapping” there is for any amount of redistribution of income.
Uganda’s RR index is quite small absolutely as well as when measured relative to the total amount of
redistribution accomplished by fiscal policy. For example, total redistribution (or the vertical equity
component) from market income to final income is 3.2 Gini points, while 0.3 points of that
redistribution contributed to place-swapping. In other words, approximately 8 percent of the total
redistribution that occurred (and is attributable to fiscal policy) had no impact on inequality. From
market income to disposable income, approximately 7 percent of the total redistribution that
occurred and is attributable to the execution of fiscal policy had no impact on inequality.
5. Conclusions and Policy Implications
Fiscal policy – including many of constituent elements – is inequality-reducing in Uganda. For
example, inequality including personal income tax is lower than inequality would be if there were no
personal income tax. Likewise, inequality is reduced when the SAGE and NUSAF direct transfers are
received, and inequality is reduced after public healthcare services are accessed. The only fiscal policy
element in Uganda (among those included in Uganda’s CEQ Assessment) that increases inequality is
ECINEQ WP 2016 - 416 October 2016

36
tertiary education spending, but this result, too, would be overturned if there were a greater number
of students from poor households in upper education levels.
However, the impact of fiscal policy on current-year inequality is modest: fiscal policy achieves a
reduction of approximately 3 Gini points in Uganda. The impact magnitude is tied to low levels of
spending in Uganda generally. For example, Ethiopia33, a country with a similar per-capita income
level, spends approximately twice as much as Uganda does overall, twice as much on redistributive
spending (so that Ethiopia’s redistributive spending as a share of total spending is approximately
equal to Uganda’s), and approximately twice as much on direct transfers as well as education (relative
to GDP). The impact of fiscal policy in Ethiopia (relative to pre-fisc inequality levels) is
approximately average, while in Uganda the impact of fiscal policy (relative to pre-fisc inequality
levels) is below average. In other words, the redistributive spending that Uganda executes, and the
targeting of both social expenditures as well as the revenue collections that support them, help
reduce inequality. The small impact is due to low revenue collection and spending overall.
The impact of fiscal policy on poverty is negligible. While an insignificant number of poor or near-
poor households are burdened by the personal income tax, it is also true that very few households
receive any of the direct transfers available under the SAGE or NUSAF programs. The net income
position of most households after indirect taxes are paid and indirect subsidies are received is slightly
lower than before those fiscal policy elements are allocated. However, the poor households that do
receive net additions to their incomes receive more (as a percent of their pre-fiscal income) than the
poor households that become net payers into the fiscal system.
Poverty-neutral fiscal policy looks very good relative to African countries with similar income levels.
The execution of fiscal policy in Ethiopia, Ghana, and Tanzania (for example) leaves the post-fiscal
poverty rate higher than the pre-fiscal poverty rate.
Recent directions in fiscal policy have focused on increasing revenues without concurrent social
spending increases. For example, the tax-to-GDP ratio has risen since the 2012/13 fiscal year, but
total direct and indirect benefit expenditure has increased at a slower rate during the same period.
Since 2012/13-era personal income tax thresholds were high enough to protect poor households, if
the increased revenues have come primarily from more efficient personal income tax collection, then
it is likely that poor households are no worse off in 2015/16 than in 2012/13.
On the other hand, in 2012/13, Uganda’s tax collections came primarily from VAT, excise, and
customs duties. If the increase in revenues (from taxes) since 2012/13 has proceeded proportionally
to 2012/13 tax instrument shares – if in other words most of the increase to 2015/16 is coming from
the indirect tax instruments mentioned above – then it is likely the case that poor and near-poor
households face greater disadvantage today. The VAT and excise taxes were widespread – over 95
percent of households paid at least one of the indirect taxes and the burden they create is
approximately neutral with respect to consumption expenditure. So if the increase in revenues has
been achieved by closing exemptions for particular goods – unprocessed agricultural goods, for
33 2011 Ethiopia (Uganda) GNI per-capita (2011 PPP factor): $1160 ($1620)
ECINEQ WP 2016 - 416 October 2016

37
example, or health and education services – then poor households will face a proportionally-greater
burden in 2015/16 than in 2012/13.
If in the future indirect taxes on “luxury goods” – or a set of products and services which are
primarily consumed by non-poor households – can contribute the bulk of marginal revenues from
indirect taxes, then poor households may remain (marginally) unaffected by the drive to increase
revenues. For example, the fuel excise does not create a direct burden for poor or near-poor
households, and therefore does not contribute to an increase in the poverty headcount, because
lower-income households in Uganda purchase no fuel directly. Targeting marginal revenue increases
from indirect taxes to “luxury” good purchases would similarly protect poor households and unlike
fuel would not create an indirect burden for households as long as the luxury goods targeted were
not themselves important inputs for the production of other goods and services.
Recent budgets have allocated more resources towards investment in the productive sectors and
infrastructure. If this focus on infrastructure were broadened to include human-capital-enhancing
infrastructure like schools, health facilities, and low-cost, high-quality housing, the impact on
inequality of fiscal policy would likely be enhanced. As the Uganda CEQ Assessment has
demonstrated, the equalization of access to public education and healthcare services provides over
half of the reduction in inequality from fiscal policy overall.
However, public services alone cannot create a more equal future for Ugandans; despite relatively
high enrolment numbers, Uganda’s results in standardized assessments of education performance are
below average. In addition, tertiary education appears to be out of reach for most low- and middle-
income households in Uganda. Likewise, current investments in electricity should continue increasing
the rate of access among poor and disadvantaged households, but the impact of this access on
inequality will depend on the (regulated) tariff-setting procedures that the government decides.
Increasing public service provision reduces inequality in the short-term, but longer-term impacts will
depend also on how the public service delivery and public capital investment are managed.
Capital spending (or other infrastructure investment) may also have a salutary effect on poverty and
inequality in the short-term when it is channelled through a broad-coverage PWP like the Productive
Safety Net Program in Ethiopia, the Vision 2020 Umurenge Program in Rwanda, or the Program
Nasional Pemberdayaan Masyarakat (PNPM) community-driven development program in Indonesia.
These programs allocate public expenditures for infrastructure investment at least partially to poor or
vulnerable households through the payment of wages for labor contributions on the infrastructure
projects themselves. While in the longer-term the areas receiving infrastructure and other physical
capital may benefit more generally, in the short-term poor and vulnerable individuals benefit directly
from paid employment for labor contributed. Uganda already has experience with such a program –
the community-based PWP in NUSAF II – and could adapt operational lessons learned to a national,
broad-coverage PWP program.
These recent fiscal policy developments – increased revenue collections and an emphasis on
infrastructure spending – are general in that they affect nearly all Ugandans. Specifically-
disadvantaged populations (the elderly poor; the jobless or under-employed poor) may require
ECINEQ WP 2016 - 416 October 2016
38
specifically-targeted programs, and Uganda already has a few such instruments in place. The planned
increases in the SAGE program – for example – will likely further reduce inequality as well as the
poverty headcount. However, as SAGE was previously donor-financed, any increase in SAGE
expenditures will require a concurrent increase in revenue collections (at least in present-value terms),
and the source of these additional revenues will determine whether on net the fiscal system is
poverty- and inequality-reducing.
ECINEQ WP 2016 - 416 October 2016
39
References
Alam, Shamma A., Gabriela Inchauste, and Umar Serajuddin. 2017. “The Distributional
Impact of Fiscal Policy in Jordan,” in The Distributional Impact of Fiscal Policy: Experience
from Developing Countries, edited by Gabriela Inchauste and Nora Lustig (Washington:
World Bank).
Aristy-Escuder, Jaime, Maynor Cabrera, Blanca Moreno-Dodson, and Miguel Sanchez-Martin.
2017. “Fiscal Policy and Redistribution in the Dominican Republic,” Chapter 13 in
Commitment to Equity Handbook. Estimating the Impact of Fiscal Policy on Inequality and Poverty,
edited by Nora Lustig (Brookings Institution Press and CEQ Institute, Tulane
University).
Arunatilake, Nisha, Gabriela Inchauste, and Nora Lustig. 2017. “The Incidence of Taxes and
Spending in Sri Lanka,” in The Distributional Impact of Fiscal Policy: Experience from Developing
Countries, edited by Gabriela Inchauste and Nora Lustig (Washington: World Bank).
Aziz, Imran, Edward Hedger, Fiona Davies, and Tim Williamson. 2016. Budget Support to
Uganda 1998-2012: A review. Overseas Development Institute Draft Research Report.
London, March.
Bardhan, Pranab K. 2005. Scarcity, Conflicts, and Cooperation: Essays in the Political and Institutional
Economics of Development. (Cambridge, Massachusetts: MIT Press).
Beneke, Margarita, Nora Lustig, and Jose A. Oliva. 2017. “The Impact of Taxes and Social
Spending on Inequality and Poverty in El Salvador,” Chapter 14 in Commitment to Equity
Handbook. Estimating the Impact of Fiscal Policy on Inequality and Poverty, edited by Nora
Lustig (Brookings Institution Press and CEQ Institute, Tulane University).
Berg, Andrew G. and Jonathan D. Ostry. 2011. “Inequality and Unsustainable Growth: Two
Sides of the Same Coin?,” Staff Discussion Note SDN/11/09 (Washington:
International Monetary Fund).
Bollinger, Christopher and Barry Hirsch. 2007. “How Well are Earnings Measured in the
Current Population Survey? Bias from Nonresponse and Proxy Respondents,” Working
Paper (Lexington: University of Kentucky and Trinity University).
Bollinger, Christopher and Barry Hirsch. 2013. “Is Earnings Nonresponse Ignorable?”. Journal
of Labor Economics 24, no. 3. doi: 10.2139/ssrn.1717151.
Bucheli, Marisa, Nora Lustig, Maximo Rossi, and Florencia Amabile. 2014. “Social Spending,
Taxes and Income Redistribution in Uruguay,” in The Redistributive Impact of Taxes and
Social Spending in Latin America, edited by Nora Lustig, Carola Pessino, and John Scott,
special issue, Public Finance Review 42, no. 3, pp. 413-433.
Cabrera, Maynor, Nora Lustig, and Hilcias E. Moran. 2015. “Fiscal Policy, Inequality and the
ECINEQ WP 2016 - 416 October 2016

40
Ethnic Divide in Guatemala.” World Development 76 (C), pp. 263–279.
Cancho, Cesar and Elena Bondarenko. 2017. “The Distributional Impact of Fiscal Policy in
Georgia," in: The Distributional Impact of Fiscal Policy: Experience from Developing Countries,
edited by Gabriela Inchauste and Nora Lustig (Washington: World Bank).
Duponchel, Marguerite, Andy McKay, and Sarah Ssewanyana. 2015. “Poverty dynamics in
Uganda (2005/6 to 2011/12),” IGC presentation to Ministry of Finance, Kampala,
February.
Enami, Ali, Nora Lustig, and Alireza Taqdiri. 2017. “Measuring the Effectiveness of Taxes and
Transfers in Fighting Poverty and Reducing Inequality in Iran,” Chapter 16 in
Commitment to Equity Handbook. Estimating the Impact of Fiscal Policy on Inequality and Poverty,
edited by Nora Lustig (Brookings Institution Press and CEQ Institute, Tulane
University).
Higgins, Sean. 2017. “Producing Indicators and Results, and Completing Sections D and E of
CEQ Master Workbook using the CEQ Stata Package,” Chapter 7 in Commitment to
Equity Handbook. Estimating the Impact of Fiscal Policy on Inequality and Poverty, edited by Nora
Lustig (Brookings Institution Press and CEQ Institute, Tulane University).
Higgins, Sean and Claudiney Pereira. 2014. “The Effects of Brazil’s Taxation and Social
Spending on the Distribution of Household Income,” in The Redistributive Impact of Taxes
and Social Spending in Latin America, edited by Nora Lustig, Carola Pessino, and John
Scott, special issue, Public Finance Review 42, 3, pp. 346–67.
Higgins, Sean and Nora Lustig. 2016. “Can a Poverty-Reducing and Progressive Tax and
Transfer System Hurt the Poor?” Journal of Development Economics 122, pp. 63-75.
______. 2017. “Allocating Taxes and Transfers, Constructing Income Concepts, and
Completing Sections A, B, and C of CEQ Master Workbook,” Chapter 5 in Commitment
to Equity Handbook. Estimating the Impact of Fiscal Policy on Inequality and Poverty, edited by
Nora Lustig (Brookings Institution Press and CEQ Institute, Tulane University).
Hill, Ruth, Gabriela Inchauste, Nora Lustig, Eyasu Tsehaye, and Tassew Woldehanna. 2017.
“A Fiscal Incidence Analysis for Ethiopia,” in The Distributional Impact of Fiscal Policy:
Experience from Developing Countries, edited by Gabriela Inchauste and Nora Lustig
(Washington: World Bank).
Icefi. 2017a. “Incidencia de la politica fiscal en el ambito rural de Centro America: el caso de
Honduras,” CEQ Working Paper 51 (CEQ Institute, Tulane University, IFAD and
Instituto Centroamericano de Estudios Fiscales).
ECINEQ WP 2016 - 416 October 2016

41
______. 2017b. “Incidencia de la politica fiscal en la desigualdad y la pobreza en Nicaragua,”
CEQ Working Paper 52 (CEQ Institute, Tulane University, IFAD and Instituto
Centroamericano de Estudios Fiscales).
Inchauste, Gabriela, Nora Lustig, Mashekwa Maboshe, Catriona Purfield, Ingrid Woolard, and
Precious Zikhali. 2017. “The Distributional Impact of Fiscal Policy in South Africa,” in
The Distributional Impact of Fiscal Policy: Experience from Developing Countries, edited by
Gabriela Inchauste and Nora Lustig. (Washington: World Bank).
Jaramillo, Miguel. 2014. “The Incidence of Social Spending and Taxes in Peru,” in The
Redistributive Impact of Taxes and Social Spending in Latin America, edited by Nora Lustig,
Carola Pessino, and John Scott, special issue, Public Finance Review 42, no.3, pp. 391-412.
Jellema, Jon and Gabriela Inchauste. 2017. “Constructing Consumable Income: Including the
Direct and Indirect Effects of Indirect Taxes and Subsidies,” Chapter 6 in Commitment to
Equity Handbook. Estimating the Impact of Fiscal Policy on Inequality and Poverty, edited by
Nora Lustig (Brookings Institution Press and CEQ Institute, Tulane University).
Jellema, Jon, Matthew Wai-Poi, and Rythia Afkar. 2017. “The Distributional Impact of Fiscal
Policy in Indonesia,” in The Distributional Impact of Fiscal Policy: Experience from
Developing Countries, edited by Gabriela Inchauste and Nora Lustig (Washington:
World Bank).
Jouini, Nizar, Nora Lustig, Ahmed Moummi, and Abebe Shimeles. 2017. “Fiscal Incidence and
Poverty Reduction: Evidence from Tunisia,” Chapter 17 in Commitment to Equity
Handbook. Estimating the Impact of Fiscal Policy on Inequality and Poverty, edited by Nora
Lustig (Brookings Institution Press and CEQ Institute, Tulane University).
Kuteesa, Florence, Emmanuel Tumusiime-Mutebile, Alan Whitworth, and Tim Williamson.
2009. Uganda's Economic Reforms Insider Accounts (Oxford University Press).
Llerena Pinto, Freddy P., Maria C. Llerena Pinto, Roberto C. Saa Daza, and Maria Andrea
Llerena Pinto. 2015. “Social Spending, Taxes and Income Redistribution in Ecuador,”
CEQ Working Paper 28 (Center for Inter-American Policy and Research and
Department of Economics, Tulane University and Inter-American Dialogue), February.
Lopez-Calva, Luis F., Nora Lustig, Mikhail Matytsin, and Daria Popova. 2017. “Who Benefits
from Fiscal Redistribution in Russia?,” in The Distributional Impact of Fiscal Policy: Experience
from Developing Countries, edited by Gabriela Inchauste and Nora Lustig. (Washington:
World Bank).
Lustig, Nora, ed. 2017. Commitment to Equity Handbook. Estimating the Impact of Fiscal Policy on
Inequality and Poverty. Brookings Institution Press and CEQ Institute, Tulane University,
ECINEQ WP 2016 - 416 October 2016

42
June 2017. Online Edition: http://www.commitmentoequity.org/publications-ceq-
handbook/.
Lustig, Nora and Sean Higgins. 2017a. “The CEQ Assessment: Measuring the Impact of Fiscal
Policy on Inequality and Poverty,” Chapter 1 in Commitment to Equity Handbook. Estimating
the Impact of Fiscal Policy on Inequality and Poverty, edited by Nora Lustig (Brookings
Institution Press and CEQ Institute, Tulane University).
Martinez-Aguilar, Sandra, Alan Fuchs, Eduardo Ortiz-Juarez, and Giselle del Carmen. 2017.
“The Impact of Fiscal Policy on Inequality and Poverty in Chile,” Chapter 12 in
Commitment to Equity Handbook. Estimating the Impact of Fiscal Policy on Inequality and Poverty,
edited by Nora Lustig (Brookings Institution Press and CEQ Institute, Tulane
University).
Melendez, Marcela and Valentina Martinez. 2015. “CEQ Master Workbook: Colombia.
Version: December 17, 2015,” CEQ Data Center on Fiscal Redistribution (CEQ
Institute, Tulane University and Inter-American Development Bank).
Ministry of Finance, Planning, and Economic Development. 2014. “Poverty Status Report
2014 – Structural Change and Poverty Reduction in Uganda,” Uganda, November.
_____. 2016. “National Budget Framework Paper FY 2016/17,” Uganda, December.
Molina, Emiro. 2016. “CEQ Master Workbook: Venezuela. Version: November 15, 2016,”
CEQ Data Center on Fiscal Redistribution (CEQ Institute, Tulane University).
Ostry, Jonathan D., Andrew Berg, and Charalambos G. Tsangarides. 2014. “Redistribution,
Inequality, and Growth,” IMF Staff Discussion Note SDN/14/02 (Washington:
International Monetary Fund).
Paz Arauco, Veronica, George Gray-Molina, Wilson Jimenez, and Ernesto Yañez. 2014.
“Explaining Low Redistributive Impact in Bolivia,” in The Redistributive Impact of Taxes and
Social Spending in Latin America, edited by Nora Lustig, Carola Pessino, and John Scott,
special issue, Public Finance Review 42, no 3, pp. 326-345.
Rossignolo, Dario. 2017. “Taxes, Expenditures, Poverty, and Income Distribution in
Argentina,” Chapter 10 in Commitment to Equity Handbook. Estimating the Impact of Fiscal
Policy on Inequality and Poverty, edited by Nora Lustig (Brookings Institution Press and
CEQ Institute, Tulane University).
Sauma, Pablo and Juan D. Trejos. 2014. “Social Public Spending, Taxes, Redistribution of
Income, and Poverty in Costa Rica,” CEQ Working Paper 18 (Center for Inter-
American Policy and Research and Department of Economics, Tulane University and
Inter-American Dialogue), January.
ECINEQ WP 2016 - 416 October 2016
43
Scott, John. 2014. “Redistributive Impact and Efficiency of Mexico’s Fiscal System,” in The
Redistributive Impact of Taxes and Social Spending in Latin America, edited by Nora
Lustig, Carola Pessino, John Scott, special issue, Public Finance Review 42, no.3, pp.368-
390.
Ssewanyana, Sarah and Ibrahim Kasirye. 2015. “Progressivity or regressivity in Uganda’s tax
system: Implications for the Fy2014/15 Tax Proposals,” in Economic Policy Research
Centre Research Series no. 123. Kampala, June.
Uganda Ministry of Education and Sports. 2013. “2012 Education Statistical Abstract,”
Kampala, Uganda.
Younger, Stephen and Artsvi Khachatryan. 2017. “Fiscal Incidence in Armenia,” in The
Distributional Impact of Fiscal Policy: Experience from Developing Countries, edited by Gabriela
Inchauste and Nora Lustig. (Washington: World Bank).
Younger, Stephen, Flora Myamba, and Kenneth Mdadila. 2016a. “Fiscal Incidence in
Tanzania.” African Development Review 28, no. 3, pp. 264-276. DOI: 10.1111/1467-
8268.12204
Younger, Stephen, Eric Osei-Assibey, and Felix Oppong. 2016. “Fiscal Incidence in Ghana.”
Review of Development Economics. Published electronically January 11, 2017. DOI:
10.1111/rode.12299.
ECINEQ WP 2016 - 416 October 2016