working paper the impact of continual exposure to direct
TRANSCRIPT

1
Working Paper
The Impact of Continual Exposure to Direct Instruction in the Elementary Years:
Results from Three Charter School Systems
J. Stockard, Ph.D., Professor Emerita
Department of Planning, Public Policy and Management, University of Oregon
June 2, 2018
This brief report examines the impact on student achievement of exposure to Direct Instruction
(DI) throughout the elementary years and, specifically, the extent to which the achievement of
students taught with DI from grades K-5 differs from those taught with the program in only
grades K-2. It compares data from three charter school systems: schools associated with the
Baltimore Curriculum Project (BCP) in inner-city Baltimore, the Arthur schools in the Portland,
Oregon area, and the IDEA school system based in Texas. All systems serve students with
relatively high levels of poverty and who begin kindergarten with skills that are lower than the
national average. Both BCP and Arthur schools implement Direct Instruction curricular
programs using a school-wide implementation model in which DI programs are used as the core
programs for instruction from kindergarten through grade 5 (NIFDI, 2012).The IDEA schools use
DI within grades K-2 but other programs for core instruction in the higher grades.
Data on nationally normed assessments were available for each system. Analyses focused on
the percentage of students who fell at or above an average level of achievement, defined as
scoring at the 40th percentile or higher, and at high levels, defined as the 80th percentile or
higher. Results indicated no long-term differences between the systems in mathematics
achievement, but significant long-term advantages in reading achievement for students in the
schools with continuous exposure to DI. These differences were most marked at higher levels.
The first section of this report explains the methodology, the second section presents results,
and the third summarizes and discusses the findings. Figures, tables, and references cited in the
text are at the end of the document.
Methodology
Settings: Each of the charter systems includes multiple schools and serves students who enter
with achievement scores that are well below the national average and would traditionally be
considered at risk of academic failure. The BCP schools serve students from very high poverty
backgrounds. Students in the analysis reported here came from schools with an average of 82%
receiving free or reduced lunch (FRL) (range of .74 to .90). About two-thirds of students in the
BCP schools are African American. The rate of FRL for IDEA schools is also high, with an average
value of 89% reported for the system as a whole. The majority of IDEA students are of Latino/a
heritage. The average percentage of FRL for Arthur schools (44%) is higher than the national
average, but lower than that for BCP or IDEA and the surrounding communities. The Arthur
students are predominantly Caucasian.

2
Each of the systems is reported to have high levels of fidelity to the guidelines for
implementation of DI programs. The BCP and IDEA systems receive implementation support
from the National Institute for Direct Instruction (NIFDI), which was founded by the developer
of DI programs and noted for promoting strict adherence to guidelines of the programs.1 The
Arthur schools were founded by an educator with strong ties to the developer, includes authors
of DI programs on its governing board, and is noted for strong adherence to the programs’
guidelines.
Measures: This report is a secondary analysis of student scores on nationally normed
achievement tests. Data for IDEA schools were for the Renaissance Star Test for 2016-17 and
were provided in aggregate form to the author. Data for the Arthur schools were from Stanford
Achievement Tests (SAT) for 2007-2013 and also provided in aggregate form. They were
previously examined in Arthur and Stockard (2014). Data for BCP were individual level data on
the Comprehensive Test of Basic Skills (CTBS) for 1997-98 to 2002-03 and were previously
examined in Stockard (2010a, b). Because each of the tests is nationally normed, they allow
comparisons of students’ scores to those of national peers at the time that they took the
examination. The analysis below focuses on those comparisons, thus obviating concerns
regarding different exams and years of testing within the three systems.
Data were available from all three systems on the percentage of students reaching the 40th and
80th percentile in composite scores of mathematics and reading achievement. The 40th
percentile can be seen as a benchmark that indicates “average” performance as the majority of
the nation’s students (60%) fall at or above this level. The 80th percentile can be seen as
indicating high levels of achievement, those needed for success in demanding careers and
institutions of higher education. By definition, 20% of the nation’s students fall at or above that
level.
Designs: The data for IDEA are a cohort comparison design, in which achievement for one
cohort is compared to that of another. The analysis compares results for fifth graders in a given
year with first graders in that year and implicitly assumes that the sample of fifth graders (who
were first graders four years earlier) is largely similar to the current cohort of first graders in
background and ability. The classic research design literature, as well as contemporary analyses,
note that such cohort comparisons are especially useful in institutional settings such as schools
and that comparisons from such designs are usually quite valid (e.g. Shadish, Cook, & Campbell,
2002; Stockard, 2013; Stockard & Wood, 2017). Data for Baltimore involve a panel design with
data on individual students’ achievement in both grades 1 and 5. Data for Arthur involved both
a panel design (for kindergarten) and a cohort comparison design (for the higher grades).
1 Previous publications using the BCP data (Stockard, 2010a,b) included students from schools that used DI with implementation support from other providers. Those schools were implemented from the present analysis to provide a sample that would be expected to have the highest level of fidelity and thus be most likely to indicate the potential for change with exposure to the program.

3
Analysis: In the analysis below z-scores, or effect sizes, are used to compare percentages within
each school system to national norms. These comparisons involve a simple application of the
binomial distribution and comparisons of sample proportions to those within a population. An
example follows:
By definition, .6 of a population (e.g. the set of students comprising the national normative
group for a standardized test) score at or above the 40th percentile. This is typically denoted as
Pu = .6,
Where Pu is the proportion within the universe or population.
The standard deviation of this population distribution is defined as
u = (PuQu) = (.6*.4) = (.24) = .49,
where Qu = 1 – Pu, or the complement of Pu.
Again, by definition, the z-score associated with a sample proportion (Ps) is
Z = (Ps-Pu)/u.
For instance, if the proportion in the sample were lower than in the population as in Ps = .5
Z = (.5-.6)/.49 = (-.10)/.49 =-.20;
In contrast, if the sample proportion were larger, as in Ps = .65,
Z = (.65-.60)/.49 = +.05/.49 = +.10
In short, the z-score is the difference of the sample proportion from the population proportion
in standard deviation terms and thus can simply be seen as an effect size. The analysis below
reports these z-scores or effect sizes comparing results for each sample (school system) to the
national population at the time the students completed the test. Because all z-scores use the
same metric they can be compared across grades and over time.
Effect sizes are commonly used to denote the substantive significance of differences between
groups, such as the impact of an educational innovation. Traditionally effect sizes of .25 or
larger have been deemed educationally significant (Tallmadge, 1977). More recent writers have
suggested that this level is too high and that effects of .25 and larger in educational research
should be considered large and those of .50 or higher should be considered “huge” (Lipsey,
Puzio, Yun, Hebert, et al., 2012, p. 4). Data were available on sample size for the Arthur and BCP
data and these data were used to calculate tests of significance for results for those systems.
Results
The first analysis below compares results for math and reading from all three systems. The
second presents more detailed results for BCP, examining the extent to which changes in

4
achievement from first to fifth grade were statistically and educationally significant and the
extent to which they occurred when analyses were limited to students who began their work
with DI in the earliest grades and in the schools with the highest rates of poverty. The second
sub-section provides additional details on the Arthur system including data from the start of
Kindergarten. The third sub-section includes additional analyses for data from the IDEA system,
examining trends in student performance relative to the nation across all grades and comparing
compares results for two IDEA schools reported to be especially well managed to those for
other schools in the system.
Comparing the Three Systems
Results are presented first for mathematics and then for reading.
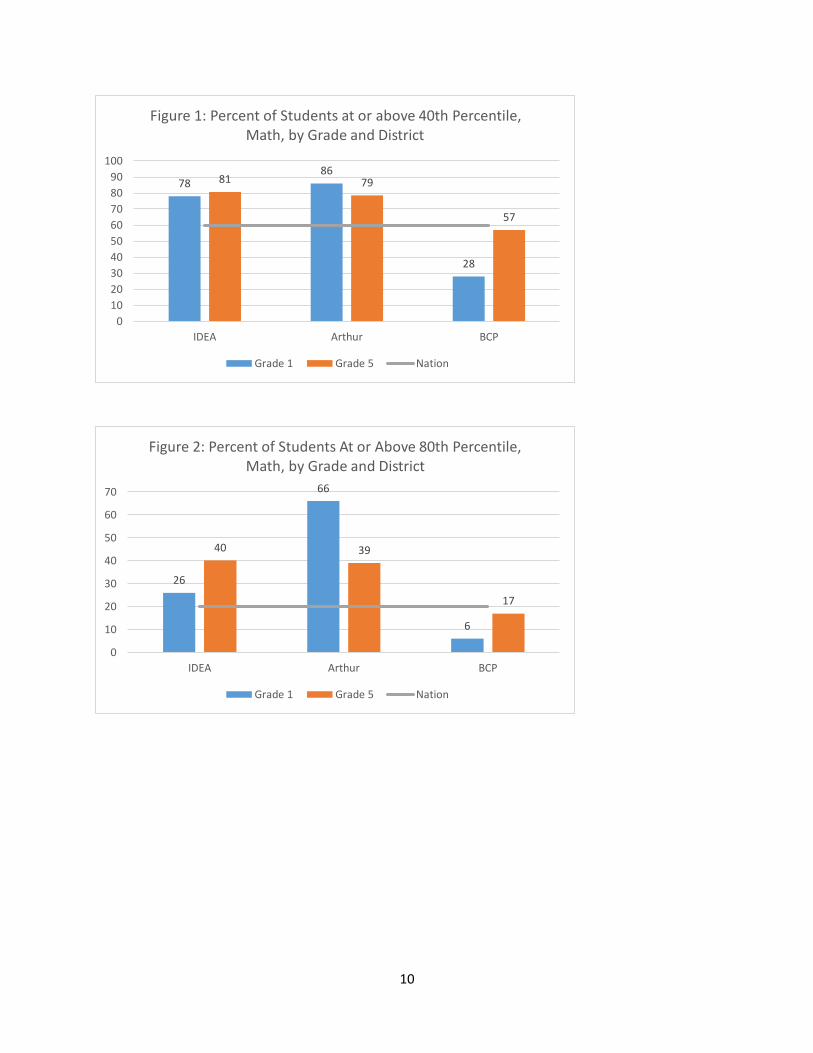
Mathematics. Figure 1 shows the percentage of students who scored at and above the 40th
percentile in mathematics at first and fifth grade in the three systems and Figure 2 shows the
same data for the 80th percentile. The vertical bars in the figures show the percentages for each
school, and the horizontal lines denote the values for the nation as a whole (60% for the 40th
percentile and 20% for the 80th percentile). Results are positive for all three systems and similar
for the two benchmarks. However, the patterns of differences between years varies between
the systems. At the end of both first and fifth grade students in the IDEA and Arthur systems
were more likely than those in the nation to score above the “average,” 40th percentile, level as
well as the high achieving, 80th percentile, mark. In contrast, at the end of first grade less than
half of the BCP students met either comparison level. But, by the end of fifth grade, their
performance was, on average, very similar to the national norm.
Table 1 presents the data used to construct Figures 1 and 2 and z-scores comparing results for
each school to the nation as well as changes over time. The first two columns show results for
first grade, the next two show results for fifth grade, and the final column shows the effect size
associated with the change from first to fifth. As would be expected from the figures, the z-
scores for Arthur and IDEA are positive for both grades. The change over time was positive for
IDEA indicating increased proportions scoring at the benchmark levels in fifth grade. In contrast
the difference between grades was negative for the Arthur system, probably reflecting the
extraordinarily high values in first grade and simple regression to the mean. The results for BCP
indicate strong and educationally significant changes in the percentage of students meeting
both benchmark levels.
Reading. Figures 3 and 4 display results for reading and statistical details are given in Table 2.
The patterns differ markedly between the three systems. First-graders at IDEA slightly
outperformed the nation with effect sizes of .18 and .10 for the two levels. In contrast, fifth
graders had lower scores than their national peers. The difference was especially marked at the
upper end of the distribution (at or above the 80th percentile), with an associated effect size of
-.42. The effect sizes associated with the difference between first and fifth grade IDEA results

5
(-.29 for the 40th percentile and -.42 for the 80th percentile) would be considered educationally
significant.
The patterns in BCP and Arthur were strikingly different. Arthur students had significantly
higher levels than national peers in all comparisons, with effect sizes consistently exceeding .50.
Differences between first and fifth grade results would not be considered educationally
significant, indicating that this high relative performance did not differ across grade levels. In
contrast, BCP students had markedly lower scores than national peers at first grade, but, by
fifth grade, were more likely to score at or above the average level and only slightly less likely
than national peers to exhibit the top levels of achievement. This increased achievement over
time was educationally significant (effect sizes of .49 for the 40th percentile level and .28 for the
80th percentile level).
Additional Analyses for BCP
Three sets of analyses, summarized in Table 3, were conducted to examine the possibility that
the results for BCP students did not hold across subgroups within the analysis. Findings are
given for 3 groups: 1) all students for whom data were available for both first and fifth grade, 2)
only students who had DI in the earliest grades (K for reading and K or first for math), and 3)
students in group 2 who in schools with the highest levels of poverty (average rates of FRL of
87%, range 82 to 90%). A number of studies have found that students who begin their studies
with DI in the earliest grades have higher rates of achievement, and this is tested by comparing
results in groups 1 and 2. Results with group 3 are included to see if the positive changes simply
reflected the slightly lower rate of disadvantage among the total group. All analyses involve
paired t-tests and, for effect sizes, calculations based on the average difference between scores
in grade 1 and grade 5.2
Results for each group are shown in each of the panels in Table 1. Within each panel results for
reading are presented in the first lines and those for math in the last lines. The first column of
data shows the percentage falling at or above a given percentile in first grade and the second
column shows the percentage at or above a given percentile in fifth grade. The 3rd column gives
a t-statistic, testing the extent to which the average change over time was greater than zero.
The final column gives the effect size associated with the average change over time.
All of the results indicate that the BCP students had higher rates of achievement relative to the
national norm in fifth grade than in first grade. There was no difference in results when only
high poverty schools were examined or when samples were limited to those who began DI
instruction in the earliest grades. All but one of the changes over time were highly significant
statistically and educationally. (The exception involved changes at the 80th percentile in math
2 Dummy variables for each student were created with 1 indicating if a student met a given benchmark (40th or 80th percentile) at a given grade. The t-tests and effect sizes then involved the average difference between these values using the logic and statistics associated with the binomial distribution.

6
for the very high poverty schools, where results were positive but failed to reach traditional
levels of significance.)
Additional Analyses: Arthur System
The first additional analysis of data from the Arthur schools tests the possibility that Arthur
students’ higher scores simply reflect entry level skills; in other words, the possibility that
Arthur students began kindergarten already scoring well above their national peers.3 The
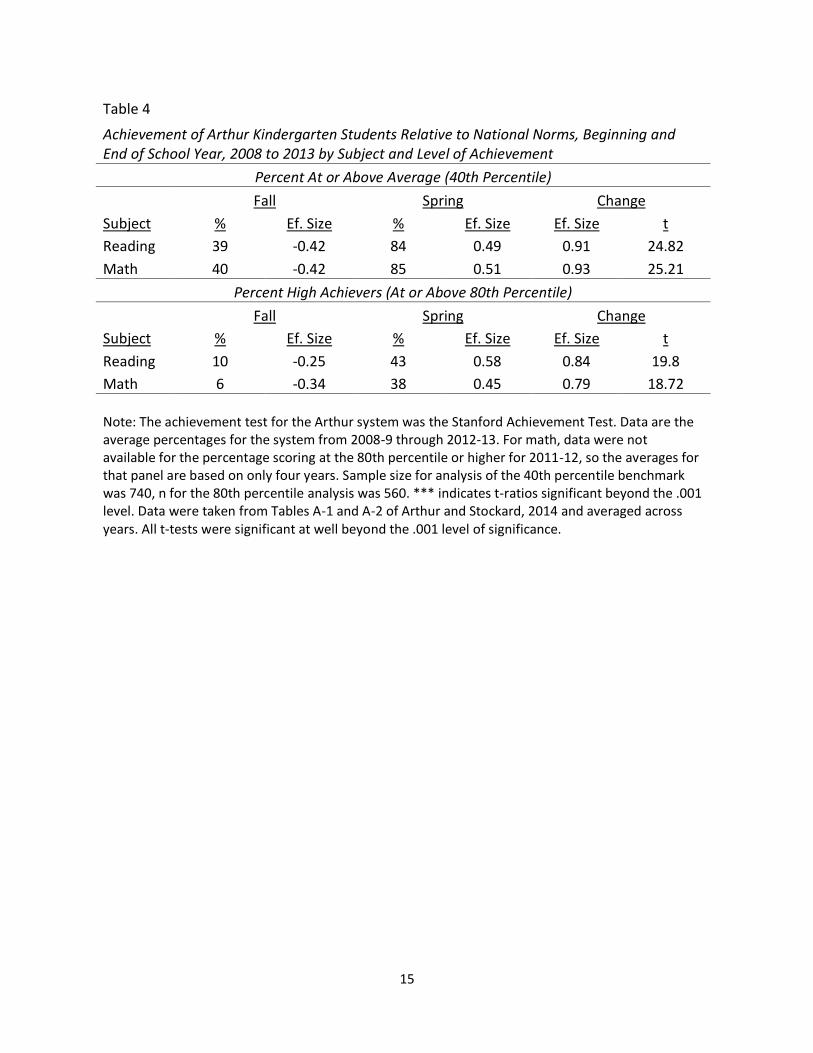
results, summarized in Figures 5 and 6 and Table 4, show that, Arthur students scored well
below national norms at the start of kindergarten, but by the end of that year, scored well
above the norms. The effect sizes associated with these changes were very large (ranging from
.79 to .93) and highly significant statistically.
Table 5 summarizes achievement of Arthur students over a period of 5 years for grades 1 to 5.
Results indicate that the high levels of achievement relative to the national norm remained
constant throughout that time period. Again associated effect sizes were large and all t-ratios
comparing Arthur students’ scores with national norms were statistically significant.
Variations within IDEA
Additional analyses with data from the IDEA system addressed two questions: First, at what
grade level do IDEA students begin to show lower levels of reading achievement? Second, does
this pattern appear across all schools? Might it not appear in schools thought to be especially
effective?
Tables 6 and 7 address the first question, reporting data regarding math and reading. The first
panel in each table reports the proportions of students scoring at or above selected deciles (1
to 3 and 7 to 9) and the expected proportion (e.g. 90% for the first decile, 80% for the second,
etc.). The second panel reports effect sizes associated with the comparison of the proportion to
the national norm. Results for each grade (first to fifth) are in the columns. Results for
mathematics (Table 6) indicate that IDEA students were more likely than their national peers to
score at the highest levels at all grades and this pattern was especially marked for those in fifth
grade. The results for reading are quite different. While first graders are more likely than their
national peers to score at the highest levels, the opposite patterns occurs with higher grades,
with IDEA students less likely than their national peers to score at higher levels at all grade
levels after first.
Table 8 addresses the second question, reporting the percentage of students scoring at or
above the 40th and 80th percentile in mathematics and reading for students in two IDEA schools
recommended as being especially effective and the remaining schools within the system. It also
includes effect sizes comparing the percentages to national norms. The top panel gives results
for reading and the bottom panel gives results for math. Within each panel results for first
3 Data for analyses in this section were obtained by averaging results presented in Tables A-1 and A-2 in Arthur and Stockard (2014). Results varied very little over the years deeming such averaging appropriate.

7
grade are on the left and results for fifth grade are on the right. The results indicate that the
pattern of lower reading achievement relative to national peers at the highest levels (the 80th
percentile mark) occurs in all schools, even those recommended as exemplary.
Summary and Discussion
This report examined data from three charter school systems that serve students believed to be
at risk for academic failure. Two of the systems (Arthur and BCP) use Direct Instruction curricula
for all students from kindergarten through fifth grade, while the third (IDEA) uses DI for
students in grades 1 and 2, but other curricula for core instruction in higher grades. The analysis
focused on the extent to which achievement at higher grades might differ between systems. All
data came from nationally normed tests and comparisons were made to expected results
within this norming population, thus controlling for differences across the samples in time of
data collection and tests used.
Results for math were relatively similar between the three settings. In all systems fifth graders
had mathematics scores that exceeded or were close to the national norm. These results
appear to counter summaries of the literature regarding DI and mathematics achievement,
which indicate that positive effects of the program occur at all grade levels (see Stockard,
Wood, Couglin, & Khoury, 2018 for a recent meta-analysis and summary). Understanding the
reasons for these discrepant results and the consistently high math achievement of IDEA
students, could be a fruitful avenue for further research.
Results for reading differed between the three systems. Scores for Arthur students were
significantly below national norms at the start of kindergarten, but significantly higher at the
end of kindergarten and remained at these high levels through the end of fifth grade. Students
at BCP had markedly lower scores than the nation at the end of first grade but scores that
approached national norms, at both the average and high achieving levels, by the end of fifth
grade. In other words, both Arthur and BCP seemed successful at closing the achievement gap
by the end of the elementary years. In contrast, while IDEA students had slightly higher reading
scores than national peers at the end of first grade this advantage disappeared in higher grades
and was especially marked at the highest levels of achievement. Only 7 percent of IDEA fifth
graders scored at or above the 80th percentile, compared to 18 percent of the BCP students and
45% of the Arthur students. These findings confirm results from numerous studies indicating
the positive impact of continuous exposure to DI programs on reading achievement (Stockard,
et al., 2018).
It is important to discuss possible criticisms of this analysis. First, some may ask why data were
limited to results for first and fifth grade. The simplest answer is that this allowed comparison
across the three charter systems, for data were only available for BCP for those two grades.
Another answer involves the importance of grade 5. That is often the last year of elementary
school. If students are not doing well academically by that point the chance that they will catch
up becomes ever smaller. In addition, this is often the last year in which students can be fully

8
exposed to DI and looking at the results at that point can provide a good estimate of the
cumulative effect of the programs.
A second possible criticism involves the lack of true baseline data for the BCP and IDEA
students, for results were only available for those systems starting at the end of grade 1.
Perhaps IDEA students began school with substantially more deficits than those in the other
systems and this can explain their lower reading achievement in later grades. While this
argument could certainly be considered with respect to the Arthur system, it seems harder to
justify with the comparison to BCP. The author knows of no evidence indicating that instruction
in BCP is inferior to that of IDEA schools, yet the BCP students had substantially lower levels of
achievement than the IDEA students by the end of first grade. This could suggest that the BCP
students may have faced even more severe circumstances at the start of their schooling than
the IDEA students and still faced the aftermath of those circumstances at the end of first
grade.4
One could also question the use of data from different research designs: cohort comparisons
for IDEA, a panel design for BCP, and both designs for Arthur. The panel design could be seen as
preferable, for it produces more precise estimates, even though sample sizes are often
relatively small. However, the cohort design is recommended by the methodological literature
for use in settings such as schools and has been found to produce very similar results within the
DI literature to studies using other designs (Stockard & Wood, 2017; Stockard, et al., 2018). In
addition, because the number of students involved in both the Arthur and IDEA data sets is
quite large, it is unlikely that the use of this design produced inaccurate results. The use of data
from multiple years for the Arthur system adds further credence to the findings. However, it
would of course be important to examine data for multiple years for IDEA, and this is another
important area for future research.
Critics might also ask why the benchmarks of the 40th and 80th percentile were used. This
decision reflects the nature of available data. But the levels also can and should be justified
substantively. As mentioned above, the 40th percentile level can be seen as representing
“average” results. Students at or above this level are doing as well as the average student in the
nation. The 80th percentile can be seen as representing “high” achievement. Students at this
level are those who are most likely to succeed at higher levels of schooling and potentially have
skills needed to thrive, not merely to survive, in high school, college, and beyond.
A related issue could involve the fact that the difference between first and fifth grade reading
achievement at IDEA schools is smaller at the 40th percentile level than the 80th percent. Is it
wrong to expect this higher level of achievement? Shouldn’t we be satisfied that IDEA students’
reading skills are almost as good as the average student in the nation? The response to this
question is as much moral or ethical as scientific. Do we want our students to be “almost
4 An alternative hypothesis that could bear investigation is that the first grade results for IDEA schools were inflated in some manner and that the results for later grades, which were more consistent, were more valid.

9
average” and to be satisfied if they fall to attain at the highest levels? The results from BCP and
Arthur indicate that students from deprived backgrounds can, in fact, do much better than the
national average. Moreover, results for IDEA first graders suggest that their reading skills can
match the highest scoring students in the nation.
Finally critics might say, “But the IDEA students are doing just fine in math. The declines only
seem to be in reading. Isn’t math more important?” In fact, even though the results in math are
certainly laudable, one could suggest that the opposite is probably true. Reading and all of the
associated vocabulary and conceptual skills are generally accepted as most important basis for
subsequent achievement and success. Moreover, IDEA students’ ability to score at the highest
levels in mathematics indicates that they should also be able to do so in other subjects. To
expect less is not in the best interest of the students, their parents, or their communities.
10
7886
28
81 79
57
0
10
20
30
40
50
60
70
80
90
100
IDEA Arthur BCP
Figure 1: Percent of Students at or above 40th Percentile, Math, by Grade and District
Grade 1 Grade 5 Nation
26
66
6
40 39
17
0
10
20
30
40
50
60
70
IDEA Arthur BCP
Figure 2: Percent of Students At or Above 80th Percentile, Math, by Grade and District
Grade 1 Grade 5 Nation

11
69
90
42
55
85
66
0
10
20
30
40
50
60
70
80
90
100
IDEA Arthur BCP
Figure 3: Percent of Students at or above 40th Percentile, Reading, by Grade and District
Grade 1 Grade 5 Nation
24
41
77
45
18
0
5
10
15
20
25
30
35
40
45
50
IDEA Arthur BCP
Figure 4: Percent of Students At or Above 80th Percentile, Reading by Grade and District
Grade 1 Grade 5 Nation

12
39
84 86
40
85 86
0
10
20
30
40
50
60
70
80
90
100
K- Start K - End End Gr 1 to 5
Per
cen
tFigure 5: Percent of Arthur Students and Nation Scoring
at or Above 40th Percentile by Subject and Time
Reading Math Nation
10
43 42
6
38
48
0
10
20
30
40
50
60
K- Start K - End End Gr 1 to 5
Figure 6: Percent of Arthur Students and Nation Scoring at or above 80th Percentile by Subject and Time
Reading Math Nation

13
Table 1
Percent of Students At or Above 40th and 80th Percentile and Z-Scores Comparing to Nation, Mathematics, 1st and 5th Grade, 3 Charter Systems
Grade 1 Grade 5
GE 40th %ile % Z from Nation %
Z from Nation Z Change
IDEA 78 0.37 81 0.42 0.06
Arthur 86 0.53 79 0.38 -0.15
BCP 28 -0.65 57 -0.06 0.59
GE 80th %ile Grade 1 Grade 5
IDEA 26 0.15 40 0.50 0.35
Arthur 66 1.15 39 0.48 -0.68
BCP 6 -0.35 17 -0.08 0.28
Note: BCP data are results for those who began DI math in K or 1 (the second panel in Table 3).
Table 2
Percent of Students At or Above 40th and 80th Percentile and Z-Scores Comparing to Nation, Reading, 1st and 5th Grade, 3 Charter Systems
Grade 1 Grade 5
GE 40th %ile % Z from Nation %
Z from Nation Z Change
IDEA 69 0.18 55 -0.10 -0.29
Arthur 90 0.61 85 0.50 -0.11
BCP 42 -0.37 66 0.12 0.49
GE 80th %ile
IDEA 24 0.10 7 -0.32 -0.42
Arthur 41 0.53 45 0.63 0.10
BCP 7 -0.33 18 -0.05 0.28
Note: BCP data are results for those who began DI reading in K (the second panel in Table 3).

14
Table 3
Percent of Students at or above 40th and 80th Percentiles, 1st and 5th grade, BCP NIFDI-Sponsored Schools, Panel Sample
All Students
Reading Grade 1 Grade 5 t-ratio Ef. Size
At or above 40th Percentile 40 62 6.35*** 0.39
At or above 80th Percentile 6 16 4.47*** 0.27
Math
At or above 40th Percentile 28 57 7.95*** 0.49
At or above 80th Percentile 7 18 4.06*** 0.26
Students Who Began DI Reading in K and DI Math in K or 1st
Reading Grade 1 Grade 5 t-ratio Ef. Size
At or above 40th Percentile 0.42 0.66 5.88*** 0.44
At or above 80th Percentile 0.07 0.18 3.51*** 0.25
Math
At or above 40th Percentile 0.28 0.57 6.48*** 0.52
At or above 80th Percentile 0.06 0.17 3.52*** 0.28
Students Who Began in Early Grades and in Very High Poverty Schools
Reading Grade 1 Grade 5 t-ratio Ef. Size
At or above 40th Percentile 0.37 0.6 4.55*** 0.41
At or above 80th Percentile 0.07 0.17 2.78** 0.92
Math
At or above 40th Percentile 0.31 0.49 3.33*** 0.35
At or above 80th Percentile 0.08 0.13 1.39 0.13 Note: T-tests were paired (dependent) t-ratios. Sample sizes for the analysis with all students were 269 for reading and 256 for math. Sample sizes for the analysis for students who had DI in the earliest grades (second panel) were 187 for reading and 155 for math. Sample sizes when the sample was reduced to schools with free and reduced lunch rates greater than 80% were 122 for reading and 91 for math. Differences in the first panel from data presented in Tables 1 and 2 reflect the fact that these data are limited to those with information for both grade levels (i.e. the data needed to calculate the paired t-tests).
15
Table 4
Achievement of Arthur Kindergarten Students Relative to National Norms, Beginning and End of School Year, 2008 to 2013 by Subject and Level of Achievement
Percent At or Above Average (40th Percentile)
Fall Spring Change
Subject % Ef. Size % Ef. Size Ef. Size t
Reading 39 -0.42 84 0.49 0.91 24.82
Math 40 -0.42 85 0.51 0.93 25.21
Percent High Achievers (At or Above 80th Percentile)
Fall Spring Change
Subject % Ef. Size % Ef. Size Ef. Size t
Reading 10 -0.25 43 0.58 0.84 19.8
Math 6 -0.34 38 0.45 0.79 18.72
Note: The achievement test for the Arthur system was the Stanford Achievement Test. Data are the average percentages for the system from 2008-9 through 2012-13. For math, data were not available for the percentage scoring at the 80th percentile or higher for 2011-12, so the averages for that panel are based on only four years. Sample size for analysis of the 40th percentile benchmark was 740, n for the 80th percentile analysis was 560. *** indicates t-ratios significant beyond the .001 level. Data were taken from Tables A-1 and A-2 of Arthur and Stockard, 2014 and averaged across years. All t-tests were significant at well beyond the .001 level of significance.

16
Table 5
Percentage of First to Fifth Grade Arthur Students Scoring At or Above 40th and 80th Percentiles, 2008-09 to 2012-13, by Subject and Grade
Reading
40th Percentile 80th Percentile
Grades % Ef. Size t-ratio % Ef. Size t-ratio
Grades 1-5 85 0.51 19.55 46 0.65 24.90
Grade 1 92 0.66 17.88 43 0.58 12.06
Grade 2 85 0.51 14.02 38 0.45 9.42
Grade 3 79 0.39 6.50 35 0.38 6.29
Grade 4 89 0.58 9.72 46 0.65 10.86
Grade 5 85 0.50 8.20 45 0.63 10.25
Mathematics
40th Percentile 80th Percentile
Grades % Ef. Size t-ratio % Ef. Size t-ratio
Grades 1-5 86 0.53 20.47 48 0.70 26.99
Grade 1 92 0.65 15.59 67 1.18 24.91
Grade 2 89 0.60 14.39 41 0.53 11.16
Grade 3 78 0.36 6.00 39 0.48 7.98
Grade 4 92 0.64 10.74 51 0.78 12.95
Grade 5 79 0.38 6.19 39 0.48 7.79
Note: Data were taken from Table A-2 of Arthur and Stockard, 2014 and averaged across years. Data were available for grades 1 to 5 as a group for spring 2008, 2009, and 2010. Separate data were available for Grades 1 and 2 for spring 2009 to 2013 for grades 1 and 2 and for grades 3 to 5 for spring 2009 to 2011. No data for the 80th percentile level were available for spring 2012. All t-ratios were significant at well beyond the .001 level of significance.

17
Table 6
Proportion of Students Scoring at Selected Deciles and Effect Sizes Relative to National Norms, Math, IDEA Schools, by Grade
Proportions Scoring at Each Level by Grade and Decile
Decile 1st 2nd 3rd 4th 5th Expecte
d
1st 0.97 0.90 0.94 0.96 0.96 0.90
2nd 0.93 0.82 0.89 0.91 0.91 0.80
3rd 0.87 0.73 0.82 0.87 0.86 0.70
7th 0.42 0.34 0.47 0.55 0.55 0.30
8th 0.26 0.22 0.35 0.42 0.40 0.20
9th 0.11 0.10 0.17 0.24 0.20 0.10
Effect Sizes Relative to National Norms by Grade and Decile
Decile Gr. 1 Gr.2 Gr. 3 Gr. 4 Gr. 5 1st 0.25 0.00 0.14 0.19 0.20 2nd 0.32 0.04 0.24 0.29 0.28 3rd 0.36 0.07 0.27 0.36 0.35 7th 0.27 0.08 0.38 0.54 0.54 8th 0.15 0.06 0.36 0.56 0.50 9th 0.03 0.00 0.23 0.48 0.33

18
Table 7
Proportion of Students Scoring at Selected Deciles and Effect Sizes Relative to National Norms, Reading, IDEA Schools, by Grade
Proportions Scoring at Each Level by Grade and Decile
Decile 1st 2nd 3rd 4th 5th Expected
1st 0.89 0.85 0.88 0.91 0.92 0.90
2nd 0.83 0.74 0.77 0.82 0.82 0.80
3rd 0.75 0.62 0.66 0.72 0.69 0.70
7th 0.38 0.20 0.23 0.24 0.16 0.30
8th 0.24 0.12 0.12 0.13 0.07 0.20
9th 0.12 0.04 0.05 0.04 0.02 0.10
Effect Sizes Relative to National Norms by Grade and Decile
Decile Gr. 1 Gr.2 Gr. 3 Gr. 4 Gr. 5
1st -0.04 -0.17 -0.06 0.03 0.06
2nd 0.07 -0.14 -0.07 0.04 0.05
3rd 0.12 -0.17 -0.08 0.04 -0.02
7th 0.17 -0.21 -0.15 -0.14 -0.31
8th 0.11 -0.21 -0.20 -0.18 -0.32
9th 0.05 -0.20 -0.16 -0.18 -0.26

19
Table 8
Percent Scoring at or above 40th and 80th Percentile and Effect Sizes Relative to National Norms, Reading and Math, Exemplary Schools and Other IDEA Schools
Reading
Grade 1 Grade 5
40th Percentile Percent Ef. Size Percent Ef. Size
Exemplary School A 80 0.41 72 0.24
Exemplary School B 80 0.41 47 -0.27
Other IDEA Schools 68 0.16 54 -0.12
80th Percentile
Exemplary School A 40 0.50 7 -0.33
Exemplary School B 29 0.23 9 -0.28
Other IDEA Schools 23 0.08 7 -0.33
Math
Grade 1 Grade 5
40th Percentile Percent Ef. Size Percent Ef. Size
Exemplary School A 84 0.49 89 0.59
Exemplary School B 89 0.59 77 0.35
Other IDEA Schools 78 0.37 80 0.41
80th Percentile
Exemplary School A 39 0.48 52 0.80
Exemplary School B 46 0.65 39 0.48
Other IDEA Schools 25 0.13 39 0.48

20
References
Arthur, C. & Stockard, J. (2014). An Analysis of Achievement Scores of Arthur Academy Schools,
2007 to 2013. NIFDI Technical Report 2014-2. Eugene, Oregon: NIFDI.
Lipsey, M.W., Puzio, K., Yun, C., Hebert, M. A., Steinka-Fry, K., Cole, M.W., . . . Busick, M.D.
(2012). Translating the statistical representation of the effects of education interventions into
more readily interpretable forms (NSER 2013-3000). Washington, DC: National Center for
Special Education Research, Institute of Education Sciences, U.S. Department of Education.
National Institute for Direct Instruction (NIFDI). (2012). Achieving success for every student with
the National Institute for Direct Instruction. Eugene, OR: NIFDI.
Shadish, W.R., Cook, T.D., Campbell, D.T. (2002). Experimental and Quasi-Experimental Designs
for Generalized Causal Inference. Houghton Mifflin, Boston (2002)
Stockard, J. (2010a). Promoting Reading Achievement and Countering the ‘Fourth-Grade
Slump’: The Impact of Direct Instruction on Reading Achievement in Fifth Grade, Journal of
Education for Students Placed at Risk, 15, 218-240
Stockard, J. (2010b). Improving Elementary Level Mathematics Achievement in a Large Urban
District: The Effects of Direct Instruction, Journal of Direct Instruction, 10, 1-16.
Stockard, J. (2013). Merging the Accountability and Scientific Research Requirements of the No
Child Left Behind Act: Using Cohort Control Groups. Quality and Quantity: International Journal
of Methodology, 47, 2225-2257.
Stockard, J. & Wood, T.W. (2017). The Threshold and Inclusive Approaches to Determining ‘Best
Available Evidence’: An Empirical Analysis, American Journal of Evaluation, 38, 471-492.
Stockard, J., Wood, T.W., Coughlin,C., & Khoury, C.R. (2018). The Effectiveness of Direct
Instruction Curricula: A Meta-Analysis of a Half Century of Research, Review of Educational
Research, DOI: 10.3102/0034654317751919, published in on-line first, January 7, 2018.
Tallmadge, G. K. (1977). The joint dissemination review panel idea book. Washington, DC:
National Institute of Education and U.S. Office of Education.