working paper - united nations escap no. 140.pdf · secretariat of the united nations concerning...
TRANSCRIPT

ASIA-PACIFIC RESEARCH AND TRAINING NETWORK ON TRADE
Working Paper NO.140 | FEBRUARY 2014
Determinants of export
intensity and propensity
among small and medium-
sized enterprises: The case
of the Philippines
Philip Tuaño
George Manzano
Isabela Villamil

The Asia-Pacific Research and Training Network on Trade (ARTNeT) is an open
regional network of research and academic institutions specializing in international
trade policy and facilitation issues. IDRC, UNCTAD, UNDP, ESCAP and WTO, as
core network partners, provide substantive and/or financial support to the network.
The Trade and Investment Division of ESCAP, the regional branch of the United
Nations for Asia and the Pacific, provides the Secretariat of the network and a direct
regional link to trade policymakers and other international organizations.
The ARTNeT Working Paper Series disseminates the findings of work in progress to
encourage the exchange of ideas about trade issues. An objective of the series is to
publish the findings quickly, even if the presentations are less than fully polished.
ARTNeT Working Papers are available online at www.artnetontrade.org. All material
in the Working Papers may be freely quoted or reprinted, but acknowledgment is
requested, together with a copy of the publication containing the quotation or reprint.
The use of the working papers for any commercial purpose, including resale, is
prohibited.
Disclaimer:
The designations employed and the presentation of the material in this Working
Paper do not imply the expression of any opinion whatsoever on the part of the
Secretariat of the United Nations concerning the legal status of any country, territory,
city or area, or of its authorities, or concerning the delimitation of its frontiers or
boundaries. Where the designation “country or area” appears, it covers countries,
territories, cities or areas. Bibliographical and other references have, wherever
possible, been verified. The United Nations bears no responsibility for the availability
or functioning of URLs. The views expressed in this publication are those of the
author(s) and do not necessarily reflect the views of the United Nations. The
opinions, figures and estimates set forth in this publication are the responsibility of
the author(s), and should not necessarily be considered as reflecting the views or
carrying the endorsement of the United Nations. Any errors are the responsibility of
the author(s). Mention of firm names and commercial products does not imply the
endorsement of the United Nations.
© ARTNeT 2014

NO.140 | FENBRUARY 2014
Determinants of export intensity and
propensity among small and medium-sized
enterprised: The case of the Philippines
Philip Tuaño, George Manzano and Isabela Villamil *
* are working at Ateneo de Manila University, the University of Asia and the Pacific, and the University of the Philippines, respectively. The authors gratefully acknowledge the comments and suggestions made by an anonymous reviewer. This work was carried out with the aid of a grant from the International Development Research Centre (IDRC), Canada, and is part of an ARTNeT Phase III Research Programme initiative. The technical support of the United Nations Economic and Social Commission for Asia and the Pacific and ARTNeT Secretariat is gratefully acknowledged. Any remaining errors are the responsibility of the authors who can be reached at [email protected].
WORKING PAPER
ASIA-PACIFIC RESEARCH AND TRAINING NETWORK ON TRADE
Please cite this paper as: Tuaño, Philip, George Manzano and Isabela Villamil
(2014). Determinants of export intensity and propensity among small and medium-
sized enterprised: The case of the Philippines
ARTNeT Working Paper Series, No. 137, January 2014, Bangkok, ESCAP
Available at www.artnetontrade.org.
i
Abstract: The small and medium enterprise (SME) sector in the Philippines is a significant
group within the economy in terms of firm numbers and total employment. However, the
SME sector’s share of exports is disproportionately small, which raises considerable policy
concerns. Prompted by the aforementioned policy issue, this study assesses the different
factors that affect SME decisions (a) to export (propensity) and (b) on how much to export
(intensity), i.e., export performance. The study utilizes data from the World Bank enterprise
surveys, which contain subjective elements concerning the impediments to conducting
business in general, e.g., concerns regarding labour regulations, shipping etc.
Using a Heckman selection model, the study finds that firm size is a robust determinant, both
of export propensity and intensity. It also suggests that while labour productivity is important
in determining the value of firm exports, there are certain firm qualities that are important to
the initial export decision, such as foreign ownership and the presence of informal
competition. Finding such determinants of SME export intensity and propensity provides the
direction for policy discussions.
JEL Classification code: F23, L25
Keywords: Small and medium-sized enterprises, export, propensity, intensity, performance,
the Philippines, manufacturing.

ii
Contents
Introduction ................................................................................................................................ 1 1. Review of the small and medium-sized enterprises sector in the Philippines ...................... 2
1.1. Constraints faced by Philippine SMEs ..................................................................... 10
2. Review of studies on export activity and SMEs .....................................................................12 2.1. Firm size.................................................................................................................. 12
2.2. Firm age and experience............................................................................................. 13
2.3. Productivity .............................................................................................................. 13
2.4. Firm ownership and networks .................................................................................. 14
2.5. Regulatory and infrastructure barriers ..................................................................... 14
2.6. Access to finance .................................................................................................... 14
2.7. Location, including transportation costs and industrial agglomeration ...................... 15
2.8. Capital and skills intensity ....................................................................................... 15
2.9. Managerial expertise and quality certification .......................................................... 16
3. Data utilized in this study.......................................................................................................16 4. Empirical model .................................................................................................................18 5. Empirical results .................................................................................................................21
5.1. Firm size.................................................................................................................. 26
5.2. Foreign ownership ................................................................................................... 26
5.3. Labour productivity .................................................................................................. 27
5.4. Quality certification and managerial education ........................................................ 27
5.5. Competition and access to finance and infrastructure.............................................. 27
6. Policy implications ..............................................................................................................28 6.1. Firm size.................................................................................................................. 28
6.2. Foreign ownership ................................................................................................... 30
6.3. Governance issues .................................................................................................. 32
6.4. Human capital and quality certification .................................................................... 34
6.5. State of infrastructure .............................................................................................. 35
Conclusion ................................................................................................................................37 References ...............................................................................................................................38 Annexes ....................................................................................................................................42

1
Introduction
One of the main issues in the Philippine’s trade and industrial policy concerns the existence
of considerable segmentation in the size structure of the country’s manufacturing firms
(Balisacan and Hill, 2003). A recent review of the number of firms by size from the 2011 List
of Establishments survey of the Philippine National Statistics Office shows that there are a
disproportionately small number of medium-sized enterprises operating in the country,
compared with the sizeable number of micro and small firms. Balisacan and Hill (2003)
traced this “missing middle” phenomenon to government trade and industrial policy
interventions in certain industries that do not have strong links to small enterprises. In
addition, these interventions contain features that penalize micro-sized firms that “graduate”
to larger business units in addition to restrictive labour market and land regulations, and
infrastructure constraints.
Notwithstanding these constraints, the small and medium-sized enterprise (SME) sector in
the Philippines clearly remains a significant group in the economy. Estimates from the 2008
Annual Survey of Philippine Business and Industry show that small-scale enterprises (with
less than 20 employees) total 113,366 with a total of Philippine peso (P) 951.7 billion in
revenue and P 221.5 billion in value-added, compared with 21,217 large enterprises (with
200 or more employees), P 6.3 trillion in revenue and P 2.08 trillion in value-added.
However, the SME sector’s share of exports is disproportionately diminutive. In the 2006
Census of Philippine Business and Industry, for example, small manufacturing firms
produced P 3.6 billion in total exports and P 58 billion in the domestic market, while large
enterprises produced P 1.1 trillion in exports and P 1.7 trillion in the domestic market.
During the past decade in particular, support for SME growth has been of important concern
for the Government as it tries to prepare the sector for participation more fully in a number of
bilateral and multilateral free trade agreements that the Philippines has signed (Micro, Small
and Medium-Scale Enterprise Development Council, 2011). Thus, identifying the specific
concerns of SME exporters is an important issue in formulating better and well-directed
government policies.
Numerous studies have been carried out that identify the factors that motivate firms to
export, (see, for example: Bernard and Jensen, 2004; Roberts and Tybout, 1997; and
Clerides and others, 1998), in the past few years. More specifically, a number of papers

2
have examined the participation of SME firms in exporting, particularly in Asian countries
(Amornkitvikai and others, 2012), in the case of Thailand, and Trung and others, Trung and
others, 2008, in the case of Viet Nam). Like the Thai study, this paper examines the
determinants of SME export activity in two parts, (a) the decision on whether or not to
participate in exporting, and (b) the decision on the volume of exports, using a Heckman
two-step selection model. This study utilizes a dataset of enterprises in selected regions of
the Philippines, taken from the World Bank Enterprise Survey for the Philippines (World
Bank, 2010).
This study assesses the different factors that affect the decisions made by SMEs to (a)
export (propensity) and (b) on how much to export (intensity), i.e., export performance, in
order to draw the appropriate policy implications. Section 1 provides a brief review of the
SME sector in the Philippines, followed in section 2 by a review the literature on the factors
that affect the SMEs’ propensity and intensity of trade. Sections 3 and 4 contain short
descriptions of the survey data used in the regression analysis, and the empirical model.
Section 5 discusses the empirical results. The policy implications for the SME sector are
described in section 6 followed by the conclusion in section 7.
1. Review of the small and medium-sized enterprises sector in the
Philippines
Micro, small and medium enterprises (MSMEs) in the Philippines are defined by the
Department of Trade and Industry (2011) as “any business activity/enterprise engaged in
industry, agri-business/services, whether single proprietorship, cooperative, partnership or
corporation whose total assets, inclusive of those arising from loans but exclusive of the land
on which the particular business entity's office, plant and equipment are situated,” and must
have less than P 100 million in assets and at least 200 employees. The Small and Medium
Enterprise Development Council, which is an attached agency of the Department of Trade
and Industry, is tasked with coordinating efforts by the Government to assist small
enterprises, defines firm size according to the following categories:
(a) Micro enterprise – with up to P 3 million in assets, and 1 to 9 employees;
(b) Small enterprise – P 3 million to P 15 million in assets, and 10-99 employees;
(c) Medium enterprise – P 15 million to P 100 million in assets, and 100-199 employees;
(d) Large enterprise – More than P 100 million in assets, and 200 or more employees.

3
According to the Updating List of Establishments Survey of the Philippine National Statistical
Office, in 2011 the number of micro, small and medium enterprises (SMEs 1 ) reached
774,644, comprising 99.7% of the total number of firms in the country. This number includes
709,899 micro enterprises (91.3% of the total number), 61,979 small enterprises (8%) and
2,786 medium enterprises (0.4%).
More than half of the SMEs are operating in the wholesale and retail trade sector, which also
contains approximately half of the total number of firms in the country. The sectors that
contain the highest share of SMEs in the total number of establishments include “other
service” activities (99.98%), followed by accommodation and food services (99.93%), and
wholesale and retail trade (99.91%). The sectors that contain the lowest share of SMEs
include the electricity, gas, steam and air-conditioning supply sectors (85.39%), followed by
mining and quarrying (93.81%) and construction (94.87%) (tables 1 and 2).
In terms of geographical distribution, in 2011 the National Capital Region contained the
highest number of SMEs (210,574 or 27.1% of the total). This was followed by the
Calabarzon Region (114.378 firms or 14.7%) and Central Luzon (79,219 or 10.2%);
interestingly, these regions are located close to Metro Manila and also host the highest
number of establishments. In terms of percentages of firms that are SMEs, the highest
proportions are in the Mimaropa Region (99.94%), Ilocos Region (99.92%) and Cagayan
Valley (99.91%); the regions with the lowest percentages of firms that are SME are National
Capital Region (99.36%), Central Visayas (99.37%) and the Calabarzon Region (99.51%).
Table 3 lists the number of firms by size and region.
1 The terms ‘MSME’ and ‘SME’ are used interchangeably in this paper.

4
Table 1. Number of firms by size and sector, 2011
Total Micro Small Medium Large
The Philippines 777 687 709 899 61 979 2 786 3 023
Agriculture, forestry and fishing 5112 3505 1306 145 156
Mining and quarrying 420 233 146 15 26
Manufacturing 111 846 100 779 9 334 809 924
Electricity, gas, steam and air-conditioning supplies 623 160 288 84 91
Water supply - sewerage waste management and remediation activities 994 482 456 37 19
Construction 2416 1284 883 125 124
Wholesale and retail trade - repair of motor vehicles and motorcycles 371 650 352 577 18 338 419 316
Transportation and storage 6 120 4 356 1 541 105 118
Accommodation and foodservice activities 97 055 87 634 9 197 160 64
Information and communications 11 808 10 652 993 66 97
Financial and insurance activities 26 485 21 491 4 766 93 135
Real estate activities 4 108 3 079 959 39 31
Professional, scientific and technical activities 18 273 16 464 1 692 60 57
Administrative and support service activities 18 720 15 952 2 072 207 489
Education 14 313 7 742 6 089 268 214
Human health and social work activities 31 174 29 546 1 398 110 120
Arts, entertainment and recreation 11 723 10 787 868 33 35
Other service activities 44 847 43 176 1 653 11 7
Source: National Statistics Office, 2012.

5
Table 2. Number of firms by size and sector, 2011 (percentage within the sector)
Industry Micro Small Medium Total SMEs
Large
The Philippines 91.28% 7.97% 0.36% 99.61% 0.39%
Agriculture, forestry and fishing 68.56% 25.55% 2.84% 96.95% 3.05%
Mining and quarrying 55.48% 34.76% 3.57% 93.81% 6.19%
Manufacturing 90.11% 8.35% 0.72% 99.17% 0.83%
Electricity, gas, steam and air-conditioning supplies 25.68% 46.23% 13.48% 85.39% 14.61%
Water supply - sewerage waste management and remediation activities 48.49% 45.88% 3.72% 98.09% 1.91%
Construction 53.15% 36.55% 5.17% 94.87% 5.13%
Wholesale and retail trade - repair of motor vehicles and motorcycles 94.87% 4.93% 0.11% 99.91% 0.09%
Transportation and storage 71.18% 25.18% 1.72% 98.07% 1.93%
Accommodation and food service activities 90.29% 9.48% 0.16% 99.93% 0.07%
Information and communications 90.21% 8.41% 0.56% 99.18% 0.82%
Financial and insurance activities 81.14% 18.00% 0.35% 99.49% 0.51%
Real estate activities 74.95% 23.34% 0.95% 99.25% 0.75%
Professional, scientific and technical activities 90.10% 9.26% 0.33% 99.69% 0.31%
Administrative and support services activities 85.21% 11.07% 1.11% 97.39% 2.61%
Education 54.09% 42.54% 1.87% 98.50% 1.50%
Human health and social work activities 94.78% 4.48% 0.35% 99.62% 0.38%
Arts, entertainment and recreation 92.02% 7.40% 0.28% 99.70% 0.30%
Other service activities 96.27% 3.69% 0.02% 99.98% 0.02%
Source: National Statistics Office, 2012.

6
Table 3. Number of firms by size and region
Total Micro Small Medium Large
The Philippines 777 687 709 899 61 979 2 786 3 023
National Capital Region 210 574 180 235 27 743 1 245 1 351
Cordillera Administrative Region 14 079 13 258 768 30 23
Ilocos Region 42 202 40 419 1 692 58 33
Cagayan Valley 23 723 22 856 821 25 21
Central Luzon 79 219 73 567 5 250 202 200
Calabarzon Region 114 378 106 478 6 992 389 519
Mimaropa Region 22 499 21 524 949 13 13
Bicol Region 27 428 25 866 1 477 51 34
Western Visayas 45 315 41 850 3 182 144 139
Central Visayas 45 609 40 977 4 123 222 287
Eastern Visayas 18 023 16 961 997 37 28
Zamboanga Peninsula 24 259 23 164 1 018 38 39
Northern Mindanao 28 454 26 138 2 145 89 82
Davao Region 36 719 33 882 2 552 146 139
Soccsksargen Reion 24 919 23 482 1 303 59 75
Caraga Region 12 298 11 466 777 25 30
Autonomous Region for Muslim Mindanao 7 989 7 776 190 13 10
Source: National Statistics Office, 2011.
In terms of employment, of the registered firms covered by the 2011 NSO survey, SMEs
employed 3.872 million workers out of a total of 6.345 million workers, or more than 60%.
The SME sector with the most workers was wholesale and retail trade, which registered 1.3
million employees; this included more than 792,000 workers in micro enterprises, some
361,000 in small-sized enterprises and more than 57,000 in medium-sized enterprises. This
was followed by more than 648,000 workers in the manufacturing sector, and more than
530,000 employees in the accommodation and food services sector. The sector with the
least number of workers employed by SME firms included mining and quarrying (less than
9,000) and the water supply and sewerage sector (approximately 20,000).
In terms of the percentage of workers with SME firms, the ratio was largest in the “other
services” activities (96.94%), and accommodation and food services (93.64%). The sector
with the lowest proportion of workers in the MSME sector was administrative and support
services (18.99%), followed by mining and quarrying (20.54%), and electricity, gas, steam
and air-conditioning supply (35.32%). Table 4 contains details of employment across
different firm sizes and sectors.

7
Table 4. Number of employees by firm size and sector, 2011
Industry Micro Small Medium Large Total
Agriculture, forestry and fishing 13 027 36 216 19 074 107 230 175 547
Mining and quarrying 1 354 5 059 2 353 33 916 42 682
Manufacturing 253 945 270 123 124 524 724 775 1 373
367
Electricity, gas, steam and air-conditioning supplies 991 11 149 14 633 49 020 75 793
Water supply - sewerage waste management and remediation activities 2 441 13 322 4 870 14 351 34 984
Construction 6 382 34 431 16 338 86 751 143 902
Wholesale and retail trade - repair of motor vehicles and motorcycles 806 164 430 900 75 987 174 630 1 487
681
Transportation and storage 16 298 46 532 17 300 74 099 154 229
Accommodation and food service activities 241 907 272 452 24 960 36 659 575 978
Information and communications 33 836 38 434 13 753 81 147 167 170
Financial and insurance activities 85 883 91 323 15 875 218 117 411 198
Real estate activities 15 857 30 477 6 801 16 327 69 462
Professional, scientific and technical activities 42 908 44 353 10 307 58 155 155 723
Administrative and support services activities 41 102 63 431 39 119 612 948 756 600
Education 33 583 158 971 41 840 98 089 332 483
Human health and social work activities 50 568 38 705 17 367 61 635 168 275
Arts, entertainment and recreation 28 354 19 467 4 091 20 969 72 881
Other service activities 103 753 37 147 2 369 4 518 147 787
Total 1 778
353 1 642
492 451 561
2 473 336
6 345 742
Source: National Statistics Office, 2011.

8
In terms of regional disaggregation (table 5), the National Capital Region contains the largest
number of workers in the SME sector (1.493 million, or 37%), followed by the Calabarzon
region (506,134 workers) and Central Luzon (353,872).
Table 5. Number of employees by firm size and region, 2011
Micro Small Medium Large Total
The Philippines 1 778
353 1 642
492 451 561
2 473 336
6 345 742
National Capital Region 496 685 740 981 201 609 1 303
819 2743
094
Cordillera Administrative Region 29 818 16 948 3 978 22 934 73 678
Ilocos Region 88 599 42 631 8 805 17 676 157 711
Cagayan Valley 48 808 19 574 3 826 7 700 79 908
Central Luzon 174 998 141 765 37 109 109 425 463 297
Calabarzon Region 251 208 190 549 64 377 441 366 947 500
Mimaropa Region 44 689 20 400 3 028 5 453 73 570
Bicol Region 60 708 35 509 7 653 16 996 120 866
Western Visayas 104 386 79 689 22 033 64 419 270 527
Central Visayas 113 141 110 885 33 986 222 733 480 745
Eastern Visayas 41 742 21 405 5 774 11 723 80 644
Zamboanga Peninsula 53 413 30 137 7 302 20 597 111 449
Northern Mindanao 66 315 56 100 16 206 62 117 200 738
Davao Region 90 994 72 467 22 271 89 198 274 930
Soccsksargen Region 65 001 39 074 8 147 51 044 163 266
Caraga Region 30 075 19 281 4 288 19 936 73 580
Autonomous Region for Muslim Mindanao 17 773 97 1 169 6 200 30 239
Source: National Statistics Office, 2011.
Data from the National Statistics Office (2008) show that SMEs contributed about 35.7%, or
P 751.9 billion, of the total census value-added (table 6) among all industries. Micro
enterprises contributed 4.9%, or P 103.9 billion, followed by small enterprises at 20.5% or P
431.3 billion, and medium-sized enterprises at 10.3% or P 216.7 billion.
The contribution by the SME sector to census value-added is highest in the manufacturing
sector (6.87% or P 144.9 billion), followed by the wholesale and retail trade (6.58% or P
138.7 billion) and financial intermediation (6.02% or P 126.9 billion).

9
Table 6. Census value-added, by firm size and industrial sector, in percentage of total, 2006
Total Micro Small Medium SMEs Large
Value-added (millions of pesos) 2 108 546
103 918 431 340 216 685 751 943 1 356 603
Agriculture, hunting and forestry 0.79 0.01 0.22 0.09 0.32 0.47
Fishing 0.15 0.01 0.02 0.02 0.04 0.1
Mining and quarrying 1.86 0.92 0.01 0.4 1.33 0.53
Manufacturing 32.91 0.28 3.82 2.77 6.87 26.05
Electricity, gas and water 8.35 0.02 2.92 1.92 4.86 3.49
Construction 1.64 0.02 0.46 0.23 0.72 0.92
Wholesale and retail trade 8.24 1.73 4.07 0.78 6.58 1.66
Hotels and restaurants 1.91 0.16 1.1 0.2 1.46 0.46
Transport, storage and communication 14.09 0.11 1.58 0.65 2.33 11.76
Financial intermediation 16.21 0.8 3.35 1.87 6.02 10.19
Real estate 7.67 0.62 1.56 0.71 2.88 4.78
Education 3.15 0.8 0.84 0.45 1.37 1.78
Health and social work 1.18 0.8 0.18 0.13 0.4 0.79
Other service activities 1.85 0.9 0.34 0.06 0.49 1.36
Total percentage 100 4.9 20.5 10.3 35.7 64.3
Source: National Statistics Office, 2008
According to the 2006 survey, SMEs accounted for 25% of the country’s total export
revenue. It was also estimated that 60% of all exporters in the country were in the SME
category. SMEs are able to contribute to exports either through subcontracting
arrangements with large firms or as suppliers to exporting companies.
Tables 7 and 8 show that the SME sector in the manufacturing industry has suffered
significant declines in the number of firms and employees in the past several years. The
same is true for the large enterprises. The total number of MSME firms declined from
129,609 in 1999 to 111,765 in 2011. The total number of employees also declined from
883,185 in 1999 to 648,592 in 2011.

10
Table 7. Number of firms in the manufacturing sector, by firm size, 1999-2011
Year Micro Small and
Medium Large Total
1999 113 861 15 748 1 322 130 931
2000 108 998 15 231 1 238 125 467
2001 108 986 13 615 1 194 123 795
2002 108 847 13 148 982 122 977
2003 107 398 12 763 1 024 121 185
2004 103 926 13 081 1 120 118 127
2005 103 982 12 392 1 008 117 382
2006 105 083 11 278 985 117 346
2008 100 605 10 703 1 069 112 377
2009 101 208 10 779 953 112 940
2010 100 779 10 143 924 111 846
2011 100 837 10 928 1 024 112 789
Source: National Statistics Office, 2012.
Table 8. Number of employees in the manufacturing sector, by firm size, 1999-2011
Year Micro Small and
Medium Large Total
1999 366 689 516 506 791 277 1 674 472
2000 354 025 505 062 730 127 1 589 214
2001 353 415 446 600 734 088 1 534 103
2002 353 255 437 490 676 443 1 467 188
2003 360 576 403 923 698 173 1 462 672
2004 327 112 432 869 775 969 1 535 950
2005 323 510 408 100 731 736 1 463 346
2006 259 664 385 263 727 984 1 372 911
2008 255 021 379 999 794 350 1 429 370
2009 259 534 377 990 674 012 1 311 536
2010 258 117 352 728 680 459 1 291 304
2011 253 945 394 647 724 775 1 373 367
Source: National Statistics Office, 2012.
1.1. Constraints faced by Philippine SMEs
SMEs in the Philippines face several institutional and legal impediments to their growth.
According to a recent survey of literature on SMEs (Aldaba and others, 2010), several
constraints exist that may explain the lack of growth among MSMEs in the Philippines:
(a) Financing constraints – because SMEs have limited track records, inadequate
financial records and limited collateral, and because banks are generally averse to

11
lending to large numbers of small-sized businesses, the flow of funds to these firms
is generally limited;
(b) Technology and information – SMEs, which generally produce labour-intensive
goods, are constrained in accessing the latest advances in production technology
and, consequently, do not generally invest enough in upgrading their standards.
Thus, output usually suffers from poor quality as these firms operate at low levels
of productivity;
(c) SMEs usually face barriers in undertaking firm registration procedures as well as
constraints in undertaking customs clearance procedures (also in Tecson, 2004);
(d) SMEs have inadequate access to human capital and technical training.
In addition, SMEs face constraints in overcoming infrastructure problems such as access to
transport and other utilities (power and water). As a result, access to different markets is
curtailed by escalating costs of doing business. A number of regulatory issues exist,
particularly with regard to taxation, which act as disincentives for firms to expand beyond a
certain size. For example, the marginal cost of labour spikes as firms “graduate” from micro
status (20 workers) because they lose exemption from having to pay minimum wages (Hill,
2003).
The study by Aldaba and others (2010), which utilized a dataset of 101 firms in Metro Manila
and neighbouring regions, pointed out that “integrated firms” (those with links with producers
abroad) were more concerned with product and price barriers and in maintaining
relationships with partners, while “non-integrated firms” were concerned with tax and tariff
barriers as well as the general business environment.
The issues that SMEs in the Philippines face are the same as those faced by heir
counterparts in the Asian region. Harvie and others (2010) reported the results of a survey
on the determinants of the participation by Asian SMEs in international production networks.
The survey results showed that the major problems confronting the SME sector in Asia were
the lack of (a) access to finance, (b) skills and expertise in operational management and (c)
sustainable entrepreneurship drive due to weak innovation. Other factors included
overdependence on foreign technology and the lack of networking, which affected the state
of financial and technological resources.

12
2. Review of studies on export activity and SMEs
In the past 15 years, a number of studies have examined the factors that affect the decision
of firms to engage in international trade. Those studies, often using information at the
enterprise level, showed that the decision to export varied across different producers within
industrial sectors. Moreover, the studies provided a richer explanation of intra-industry trade
compared to traditional comparative advantage and increasing returns-to-scale theories. For
example, one of the early studies done at the firm level by Bernard and Jensen (2004)
identified the differences in the characteristics of exporters and non-exporters. Exporters
were found to be more productive, larger in terms of employment and to use capital more
intensively than non-exporters. Such studies have spurred increasing interest in
understanding the factors that affect the decision of firms to export as well as in the over-all
size of export volumes, i.e., the intensive and extensive margins.
Some of the firm and industry variables that affect export behaviour among companies are
examined below. These factors include firm size, age, labour productivity, type of ownership,
access to finance, and constraints to registration and legal procedures.
2.1. Firm size
Several studies have already found that firm size is a significant variable that affects export
behaviour; this is due to the fact that there are significant sunk costs in exporting, and firms
have to generate significant profits before they are able to export. Roberts and Tybout
(1997) found that in Colombia, firm size (as measured by the amount of capital stock),
increases the possibility of exporting. Dueñas- Caparas (2006) found a non-linear but
positive relationship between a firm’s export decision and enterprise size, in terms of the
number of employees, in the clothing sector in the Philippines. However, this relationship
was not significant in the electronics and food processing sectors. Jongwanich and
Kohpaiboon (2008), by using sales data as a proxy for firm size, also showed a significant
positive relationship in the export decision in Thai manufacturing firms; however, but unlike
the Philippine study, they showed that the relationship was linear.
Several recent studies on SMEs have shown similar results. Amornkitvikai and others (2012)
found a non-linear relationship between export participation and firm size. Trung and others

13
(2008) also found that SMEs were more likely to participate in export markets, compared to
micro firms.
2.2. Firm age and experience
It is not clear whether or not there is a positive relationship between firm age and the
decision to export, see for example Moen and Servais (2002). Nevertheless, Roberts and
Tybout (1997) found a positive relationship between firm age and exporting decision. Using
data from a set of Columbian plants, they explained that because older firms had experience
and familiarity with the production process, they were more efficient than younger firms.
However, it is also possible that younger firms, established during a period of greater trade
openness, are more likely to undertake export activities. In the Philippines, Dueñas-Caparas
(2006) found that although non-linear, the export-age relationship was robust in the clothing
sector but was not present in the electronics and the food processing sectors.
2.3. Productivity
Roberts and Tybout (1997) found evidence that high-productivity firms were more likely to
export rather than low-productivity firms. Since there are sunk costs of entry into export
markets, only the more profitable, and therefore more productive, firms are able to hurdle the
constraints posed by sunk costs. Aldaba (2012b) provided data from the Philippines that
showed this relationship also worked in the opposite way, i.e., that trade liberalization and
greater opportunities for export lead to higher productivity.
Conversely, trade protection results in productivity losses. This is consistent with findings
that show trade liberalization leads to greater availability, and subsequently lower transaction
costs for intermediate goods and raw materials. Amornkitvikai and others (2012) found a
non-linear relationship between export participation and performance, and labour
productivity. Trung and others (2008) also found that SMEs were more likely to participate in
export markets. Using Tobit and probit regressions, Rasiah and others (2010) undertook an
analysis of the participation of Malaysian SMEs in export markets, and found that labour
productivity has an impact on export intensity.

14
2.4. Firm ownership and networks
Using the fragmentation theory of Jones and Keirzkowski (1990), Tranh and others (2010)
noted that production networks were important in the East Asian perspective (Ando and
Kimura, 2005). Thus, particularly in Asia, international trade is also tied to membership in
production networks or value chains within and around the region, and the relationship is
strong across the countries within the region. They found that foreign ownership increased
the likelihood of firm participation in such networks. Trung and others (2008) also found that
foreign investment enterprises were positively and significantly related to exporting.
Athukorala and others (1995) found that while affiliation with a multinational enterprise
increased the propensity for exporting, it did not increase its intensity.
2.5. Regulatory and infrastructure barriers
Suarez-Ortega (2003) noted that, based on Ramaswami and Yang (1990), burdensome
regulations and poor infrastructure acted as barriers to exporting by SMEs. These
constraints can be varied and complex, and include bureaucratic rules and regulations such
as those concerned with quality control procedures and safety standards. In addition, the
existence of corruption, tariff and non-tariff barriers, transportation and infrastructure raises
the costs incurred by SMEs when engaging in export activities.
2.6. Access to finance
Beck and Demirguc- Kunt (2006) examined the literature on the relationship between
financial variables and the growth of SMEs, and found that a lack of access to formal
sources of finance placed constraints on SME growth. Thus, strengthening the development
of financial institutions should be a priority for policy reform as these institutions are crucial to
improving trade flows, as several studies have pointed out. Berman and Hericourt (2008)
studied the relationship between financial variables and trade, and found that access to
finance had an impact on the decision to export but not on the volume of exports. They also
noted that access to finance removed the constraints affecting the connection between
productivity and trade.
In addition, Harvie and others (2010) found that financial leverage variables had an impact
on the decision by SMEs to participate in international production networks in Asia.

15
However, Trung and others (2008) did not find any significant relationship between the
decision to trade and the availability of credit for small Vietnamese firms.
2.7. Location, including transportation costs and industrial agglomeration
The presence of transportation and communication infrastructure makes it more likely that
firms will undertake export activities. Because efficient infrastructure services reduce the
cost of trading, they enhance the competitiveness of firms. In China, for example, Zhao and
Zhou (2002) found that firms located in the coastal regions (where the infrastructure is better
developed) were able to provide more timely deliveries as well as respond better to changing
economic and market conditions. Trung and others (2008) and Amornkitvikai and others
(2012) found that regional variables were also important in terms of explaining the decision
among Vietnamese and Thai firms to export.. Regional variables could thus serve as
indicators of the state of the infrastructure.
2.8. Capital and skills intensity
Bernard and Jensen (2004) showed that exporters in developed countries are more capital-
intensive and skill-intensive than non-exporters; this is consistent with the standard
Hecksher-Ohlin-Samuelson theory which states that more capital-abundant countries will
export capital-intensive goods. But it is more difficult to apply the theory in developing
countries, which is said to be more labour-abundant, since exporters in these countries are,
like their developed country counterparts, are also more capital- and skill- intensive.
Bernard, Redding, Jensen and Schott (2011) acknowledged that this may be explained by
capital-skill complementarities in the production of goods and quality upgrading among
exporting firms.
In many empirical papers examining developing countries, the evidence regarding the
existence of capital and skills premium among exporters had been mixed. Athukorala and
others (1995) found a positive relationship between capital intensity and export activity, but
Amornkitvikai and others (2012) found a negative relationship. Xeugong and Xueyan (2010)
observed that the skill intensity of an SME was a positive factor as it had an impact on
participation in production networks. In the Philippines, Dueñas-Caparas (2006) found that
skill intensity, as measured by the share of skilled workers in the total number of workers,

16
and capital intensity, as measured by the ratio of value of capital stock to total wages, had a
positive relationship with the decision to export.
2.9. Managerial expertise and quality certification
Holzmuller and Kasper (1991) also observed that certain characteristics of firm managers
had an impact on a firm’s ability to export; the orientation of managers towards international
trade has been identified as a critical performance factor for export propensity among SMEs.
Araujo and Niera (2006) suggested that several managerial factors affected this trade view,
including education level, number of languages spoken, length of experience (especially
internationally) and risk-taking attitudes. On the other hand, quality certification has been
found to be an important factor in the growth of services exporting industries in India, i.e.,
Arora and Asundi (1999). Terlaak and King (2006) noted that certification acted as a “signal”
for firm managers seeking to credibly communicate their ability to produce quality goods to
their customers, thereby reducing information costs. Certification thus addresses partially
problems arising from asymmetry issues.
3. Data utilized in this study
The present study utilized the 2008 Enterprise Survey for the Philippines, undertaken by the
World Bank (2010) as part of the World Bank’s “East Asia and Pacific Enterprise Survey”
and utilized as inputs to their “Costs of Doing Business Surveys”. The survey operations
were undertaken between May and December 2008.
A total of 1,326 firms were surveyed in Manila City, Metro Manila (outside of Manila),
Southern Tagalog, Central Luzon and Metro Cebu. The sample was taken from the 2007
NSO Updated List of Establishments. The survey responses were self-reports by managers
or staff. In the survey, more than 100 variables covered the following aspects: (a) basic firm
information for productivity and accounting analysis (e.g., value of sales and exports; and
number of workers); (b) objective data on certain firm processes (e.g., amount of time
needed to get permits, and time to export); and (c) subjective information on business
constraints (e.g., perception of corruption and infrastructure as obstacles).
17
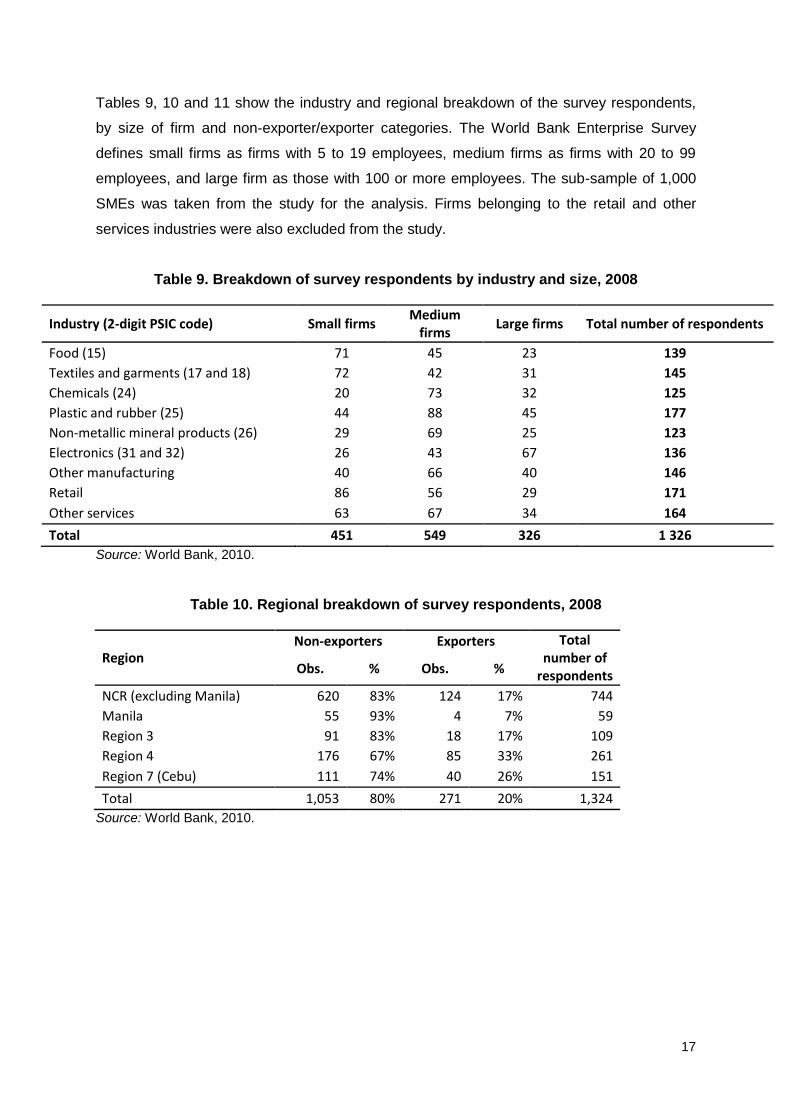
Tables 9, 10 and 11 show the industry and regional breakdown of the survey respondents,
by size of firm and non-exporter/exporter categories. The World Bank Enterprise Survey
defines small firms as firms with 5 to 19 employees, medium firms as firms with 20 to 99
employees, and large firm as those with 100 or more employees. The sub-sample of 1,000
SMEs was taken from the study for the analysis. Firms belonging to the retail and other
services industries were also excluded from the study.
Table 9. Breakdown of survey respondents by industry and size, 2008
Industry (2-digit PSIC code) Small firms Medium
firms Large firms Total number of respondents
Food (15) 71 45 23 139
Textiles and garments (17 and 18) 72 42 31 145
Chemicals (24) 20 73 32 125
Plastic and rubber (25) 44 88 45 177
Non-metallic mineral products (26) 29 69 25 123
Electronics (31 and 32) 26 43 67 136
Other manufacturing 40 66 40 146
Retail 86 56 29 171
Other services 63 67 34 164
Total 451 549 326 1 326
Source: World Bank, 2010.
Table 10. Regional breakdown of survey respondents, 2008
Region Non-exporters Exporters Total
number of respondents Obs. % Obs. %
NCR (excluding Manila) 620 83% 124 17% 744
Manila 55 93% 4 7% 59
Region 3 91 83% 18 17% 109
Region 4 176 67% 85 33% 261
Region 7 (Cebu) 111 74% 40 26% 151
Total 1,053 80% 271 20% 1,324
Source: World Bank, 2010.

18
Table 11. Industry breakdown of exporting survey respondents, 2008
Industry (2-digit PSIC code) Small exporters Medium exporters Large exporters
Obs % Obs % Obs %
Food (15) 4 6% 4 9% 7 30%
Textiles and garments (17 and 18) 7 10% 8 19% 22 71%
Chemicals (24) 1 5% 10 14% 6 19%
Plastic and rubber (25) 6 14% 20 23% 17 38%
Non-metallic mineral products (26) 1 3% 13 19% 12 48%
Electronics (31 and 32) 5 19% 15 35% 48 73%
Other manufacturing 2 5% 21 32% 23 58%
Retail 1 1% 1 2% 0 0%
Other services 2 3% 9 13% 6 18%
Total 29 6% 101 18% 141 43%
Source: World Bank, 2010.
4. Empirical model
This paper assesses the factors that determine the decision by SMEs in the Philippines to
export (export propensity) as well as the variables that affect export value (export intensity).
The empirical model has to take into consideration the possibility that the sub-sample of
firms with positive export value is not random, i.e., the unobservable factors determining
export propensity are correlated with the unobservable variables affecting export value
(Estrin and others, 2008). To correct for this possible sample selection bias, the Heckman
selection model was used in this study.
The likelihood function for the Heckman selection model can be divided into two parts: (a) a
probit for the probability of being selected; and (b) an OLS regression for the expected value
of the outcome variable in the selected sub-sample (Correa and others, 2007)
The structural model applied in this study is:
(1)
(2)
(1)

19
(3)
(4)
where equation (1) represents a firm’s export participation decision (propensity) and is
associated with the indicator function in equation (3). Equation (2) describes the latent
variable, i.e., the export value of a firm. The observed export value is positive if the firm
decides to export, and is zero if the firm decides not to export. The Heckman selection model
is used to estimate both equations to avoid the problem of sample selection bias.
The variables utilized in this study are given in table 12. Other variables in the firm dataset
are also explored in conjunction with this study. For example, other finance variables are
available in the dataset, including the proportion of working capital and fixed assets coming
from different sources (internal generation, banking sources, non-bank sources and supplier
credit), the value of loans in the previous year, necessity of collateral for borrowing, the
provision of trade credit, among others. In addition, the years of experience and gender of a
manager are available. Similarly, numerous “obstacle” variables are available in the dataset,
including the perceptions of firms’ informants of the presence of crime, access to
infrastructure (such as power and electricity), and customs and trade regulations. However,
the only variables that are significantly related to the export propensity and export value are
reported in table 12; the choice of these variables is based on the significance of this
relationship.
The descriptive statistics and correlation matrix of the variables are also provided in annexes
1 and 2, respectively. See annexes 3a and 3b for the measures of the relationship.

20
Table 12. Definition of variables
Dependent variables
Export propensity Dummy variable taking the value 1 if the firm was an exporter in 2008, and 0 if the firm did not export.
Export Valua Export value of firm, in Philippine pesos, in natural logarithm form.
Independent Variables:
Small Dummy variable taking the value of 1 if firm size is small (5 to 19 employees), and 0 if firm size is medium (20 to 99 employees).
Foreign Ownership Percentage of firm owned by private foreign individuals, companies, or organizations.
Labour Productivity Ratio of sales over number of employees, in natural logarithm form
Age Firm age (in years).
Managerial Education Qualitative variable denoting the education level of firm manager; has a value of 0 if no education completed, 1 if completed primary education, 2 if secondary education, 3 if vocational education, 4 if tertiary education and 5 if graduate education.
Quality Certification Export value of firm, in Philippine pesos, in natural logarithm form.
Overdraft Facility Presence of an overdraft facility, i.e., arrangement with bank to fund withdrawals without sufficient deposits.
Obstacles: Dummy variable taking the value of 1 if the firm perceived the item to be a moderate, major, or very severe obstacle to operations, and 0 if the firm perceived the item to be a minor or no obstacle to operations. The following are the seven elements for which observations on the obstacles have been surveyed:
Transportation Administration Administration and management of shipping ports and airports
Foreign Ownership Practices of competitors in the informal sector
Finane Access to finance, including availability and cost of credit, interest rates, fees/ other charges and collateral requirements
Regional Dummy Dummy variable taking the value of 1 if the firm is located in Manila/ Central Luzon/ Southern Tagalog/ Cebu, and 0 if the firm is not located in the regions. Comparator is National Capital Region (ex- Manila).
Industry Dummy Dummy variables that take on the value of 1 if the firm is part of the following industries: textiles and garments, chemicals, plastics and rubber, non-metallic mineral, electronics, and other manufacturing. The comparator is other manufacturing.
Orientation Dummy Dummy variables that take on the value of 1 if the firm is part of a sub- sector which exhibits a specific trade orientation: exportable, importable, mixed or non-traded; these are based on their Philippine Standard Industrial Code (PSIC) code. This dummy is at the sub-industry level so that sub-industries belonging to the same industry may have different trade orientation levels. The comparator is exportable. See Aldaba (2010) for the specific definition of the variables, and the classification of the sectors

21
5. Empirical results
The results for the following independent models are provided in this section: (a) the probit
model and the logit model for export propensity, and (b) the OLS for export value. In
addition, for the export propensity and export value (intensity) regressions, the regional,
industry and trade orientation dummies are utilized in order to check for the robustness of
the results.
The results for the export propensity regressions are shown in table 13. The signs for all
variables, except for labour productivity, are correct; however, only foreign ownership, quality
certification and competition obstacle variables are significant across different specifications.
Firm size (small) only becomes significant only when industry dummies were included. The
full results are replicated in annex 4.
The results for the export value (intensity) regressions are shown in table 14. Size, labour
productivity and firm age are the only variables that are significant. Other variables, such as
quality certification, managerial education, foreign ownership, and firm perception of poor
performance of ports and airports as well as access to finance are not significant in any of
the specifications below. The full results are replicated in annex 5.
Table 13. Export propensity regressions
Export as dependent variable
Regressors (1) (2) (3) (4) (5)
Foreign ownership 0.00949*** 0.00984*** 0.00855*** 0.00907*** 0.00887***
(0.001850) (0.001900) (0.001930) (0.001910) (0.001970)
Labor productivity (in logs) -0.0165 -0.0214 0.0181 -0.013 0.0132
(0.0488) (0.0491) (0.0489) (0.0485) (0.0493)
Firm size (small) -0.286 -0.287 -0.323* -0.27 -0.330*
(0.1520) (0.1530) (0.1590) (0.1530) (0.1600)
Managerial education 0.209 0.202 0.216 0.227 0.207
(0.1340) (0.1370) (0.1380) (0.1400) (0.1420)
Quality certification 0.445** 0.469** 0.461** 0.442** 0.485**
(0.1570) (0.1590) (0.1610) (0.1600) (0.1640)
Overdraft facilities 0.00343 0.00486 0.033 0.0342 0.0388
(0.1600) (0.1590) (0.1630) (0.1620) (0.1620)
Competition as Obstacle -0.329* -0.349* -0.352* -0.342* -0.370*
(0.1460) (0.1450) (0.1490) (0.1480) (0.1490)
Constant -1.654* -1.571* -2.008** -1.536 -1.952*

22
(0.7290) (0.7510) (0.7570) (0.8820) (0.7810)
With regional dummies N Y N N Y
With industry dummies N N Y N Y
With trade orientation dummies N N N Y N
N 530 530 530 510 530
pseudo R-sq 0.150 0.153 0.173 0.150 0.178
Asterisks denote level of signifiance: *, p<0.05; **, p<0.01; ***, p<0.001. Y and N signify presence and absence of dummy variables, respectively. Note: Probit regression marginal effects reported; robust standard errors in parentheses.
Table 14. Export intensity regressions
Log value of exports as dependent variable
Regressors -1 -2 -3 -4 -5
Firm size (small) -0.736* -0.711* -0.711* -0.700* -0.719*
(0.3240) (0.3090) (0.3490) (0.3360) (0.3380)
Labor productivity (in logs) 0.906*** 0.961*** 0.878*** 0.883*** 0.941***
(0.1050) (0.1050) (0.0979) (0.1120) (0.1000)
Age 0.0715* 0.0657* 0.0685* 0.0701* 0.0640*
(0.0319) (0.0298) (0.0316) (0.0327) (0.0301)
Age squared -
0.00186*** -
0.00183*** -
0.00186*** -
0.00182** -
0.00182***
(0.0005) (0.0005) (0.0005) (0.0006) (0.0005)
Quality certification -0.126 -0.132 -0.236 -0.0189 -0.191
(0.3320) (0.3310) (0.3220) (0.3520) (0.3190)
Managerial education 0.0785 0.0238 0.0344 0.145 -0.0169
-0.2440 -0.2250 -0.2710 -0.2650 -0.2650
Foreign ownership 0.001 -0.000659 -0.00068 0.000495 -0.00178
(0.0032) (0.0033) (0.0030) (0.0034) (0.0032)
Ports and airports 0.104 0.0711 -0.00234 0.0868 -0.0164
administration as obstacle (0.3400) (0.2770) (0.3190) (0.3470) (0.2800)
Finance as obstacle -0.0422 0.0707 -0.0243 -0.0209 0.11
(0.4050) (0.3120) (0.3960) (0.4290) (0.3270)
Constant 3.665* 2.953 5.060** 4.117* 4.187*
(1.7080) (1.7530) (1.6850) (1.7380) (1.7930)
With regional dummies N Y N N Y
With industry dummies N N Y N Y
With trade orientation dummies N N N Y N
N 91 91 91 88 91
adj. R-sq 0.557 0.625 0.589 0.541 0.644
Asterisks denote level of signifiance:*, p<0.05; **, p<0.01; ***, p<0.001. Y and N signify presence and absence of dummy variables, respectively. Note: Robust standard errors are in parenthesis.
The Heckman selection model was then applied to the 2008 Enterprise Survey in order to
investigate constraints to export propensity and export value (intensity) at the firm level in the
Philippines. Table 15 shows the outcome of the Heckman estimation. Firms make two

23
interdependent decisions: (a) whether to export or not; and (b) how much to export. The
linear regression results for export value are shown in column (1), while those of the probit
model estimates for export propensity are given in column (2).
The Heckman two-stage model explicitly addresses bias caused by correlation of the
regressor with omitted variables. This is done through the addition of the inverse Mills ratio
that represents the non-zero expectation of the error term in the regression. A common
interpretation of this term is to consider it as private information driving the selection decision
to export. The results of the selection mode are specified in table 15; the alternative
specifications of the Heckman estimation are also given in annex 6.
Table 15. Heckman estimation of export propensity and intensity
Specification (1) (2) (3)
Export value (logs) Export propensity
Outcome Selection Mills
Firm size (small) -0.762* -0.345*
(0.3180) (0.1430)
Labour productivity (logs) 0.967***
(0.0942)
Foreign ownership
0.00973***
-0.00173
Quality certification
0.479**
-0.15
Presence of overdraft facility
-0.011
-0.164
Competition as obstacle
-0.330*
-0.14
Lambda
-0.352
-0.346
Constant 4.031** -1.123***
-1.496 -0.119
Standard errors in parenthesis. Number of asterisks denote level of significance: *,p<0.05; **, p<0.01; ***, p<0.001. Note: Heckman two-step maximum likelihood estimation method.
In order to further check the robustness of the results, particularly in assessing the
robustness of quality certification and managerial education variables, regional and industry
indices have been utilized for managerial education and quality certification. In addition,
regional-industry indices have been created by utilizing the mean of the regressors by region
or industry and then applying the results as the values for these variables in each of the
firms. Lanzona and Evenson (1997) used this procedure in analysing the effects of
transaction costs on labour participation and earnings.

24
Table 16 assesses the effect of various quality certification and managerial education indices
on export propensity. Firm size, foreign ownership and competition variables are still
significant and have the correct signs; however, only the industry index for quality
certification has the correct sign and is significant. Annex 7 shows the export propensity
regressions with the same indices; there are no indices for quality certification and
managerial education that are significant in this regression.
Table 16. Export propensity regressions with indices for quality certification and
managerial education
Export propensity as the dependent variable
Regressors (1) (2) (3) (4) (5)
Firm size (small) -0.286 -0.391** -0.429** -0.380* -0.431**
(0.1520) (0.1470) (0.1500) (0.1480) (0.1510)
Foreign ownership 0.00949*** 0.0106*** 0.00989*** 0.0102*** 0.00970***
(0.0019) (0.0018) (0.0019) (0.0019) (0.0019)
Labour productivity (ln) -0.0165 0.0305 0.052 0.03 0.0494
(0.0488) (0.0444) (0.0447) (0.0439) (0.0451)
Managerial education 0.209
(0.1340)
Quality certification 0.445**
(0.1570)
Presence of overdraft facilities 0.00343 0.0618 0.0559 0.055 0.0689
(0.1600) (0.1600) (0.1610) (0.1600) (0.1600)
Competition as an obstacle -0.329* -0.330* -0.314* -0.325* -0.336*
(0.1460) (0.1410) (0.1430) (0.1430) (0.1410)
Regional index - quality certification
-0.313
-0.716
(0.6480)
(0.8360)
Regional index - managerial education
0.956
0.895
(0.8970)
(1.0100)
Industry index - quality certification
3.073*
3.071
(1.4620)
(1.6080)
Industry index - managerial education
-3.077*
-3.510*
(1.4110)
(1.5770)
Regional-industry index - quality certification
0.227 0.358
(0.4100) (0.6590)
Regional-industry index - managerial education
-0.0854 0.153
(0.34) (0.44)
Constant -1.654* -5.017 9.758 -1.018 7.453
(0.7290) (3.5620) (5.1600) (1.4060) (6.6130)
N 530 546 546 546 546
pseudo R-sq 0.15 0.127 0.134 0.126 0.138
Number of asterisks denote level of signifiance:*, p<0.05; **, p<0.01; ***, p<0.001. Note: Probit regression marginal effects reported; robust standard errors in parentheses.

25
Table 17 assesses the effect of various quality certification and managerial education indices
on export intensity. Only firm size and labour productivity are still significant and have the
correct signs; however, only the regional and regional industry for managerial education
indices have the correct sign and are significant. Annex 8 shows the export intensity
regressions with the same indices.
Table 17. Export intensity regressions with indices for quality certification and
managerial education
Export intensity as the dependent variable
Regressors -1 -2 -3 -4
Firm size (small) -0.810* -0.837** -0.776* -0.871**
(0.3410) (0.3140) (0.3190) (0.3150)
Labour productivity (ln) 0.975*** 0.951*** 0.907*** 0.929***
(0.1040) (0.0863) (0.0937) (0.0857)
Age 0.0487 0.0471 0.0444 0.05
(0.0359) (0.0318) (0.0311) (0.0320)
Age squared -0.00124 -0.00124 -0.00128 -0.00124
(0.0008) (0.0006) (0.0007) (0.0007)
Quality certification -0.234
(0.3200)
Managerial education 0.105
(0.2390)
Foreign ownership 0.00238 0.00163 0.00244 0.00238
(0.0031) (0.0032) (0.0029) (0.0031)
Regional index - quality certification
0.673
(1.3000)
Regional index - managerial education
3.903**
(1.2670)
Industry index - quality certification
-4.752
(2.8300)
Industry index - managerial education
5.633
-2.842
Regional- industry index - quality certification
-0.746
(0.7830)
Regional-industry index- managerial education
1.768**
-0.667
Constant 2.709 -12.39* -16.92 -3.195
(1.6270) (5.1140) (10.1300) (2.6460)
N 100 106 106 106
adj. R-sq 0.575 0.608 0.587 0.607
Number of asterisks denote level of signifiance:*, p<0.05; **, p<0.01; ***, p<0.001. Note: Robust standard errors are in parenthesis.
26
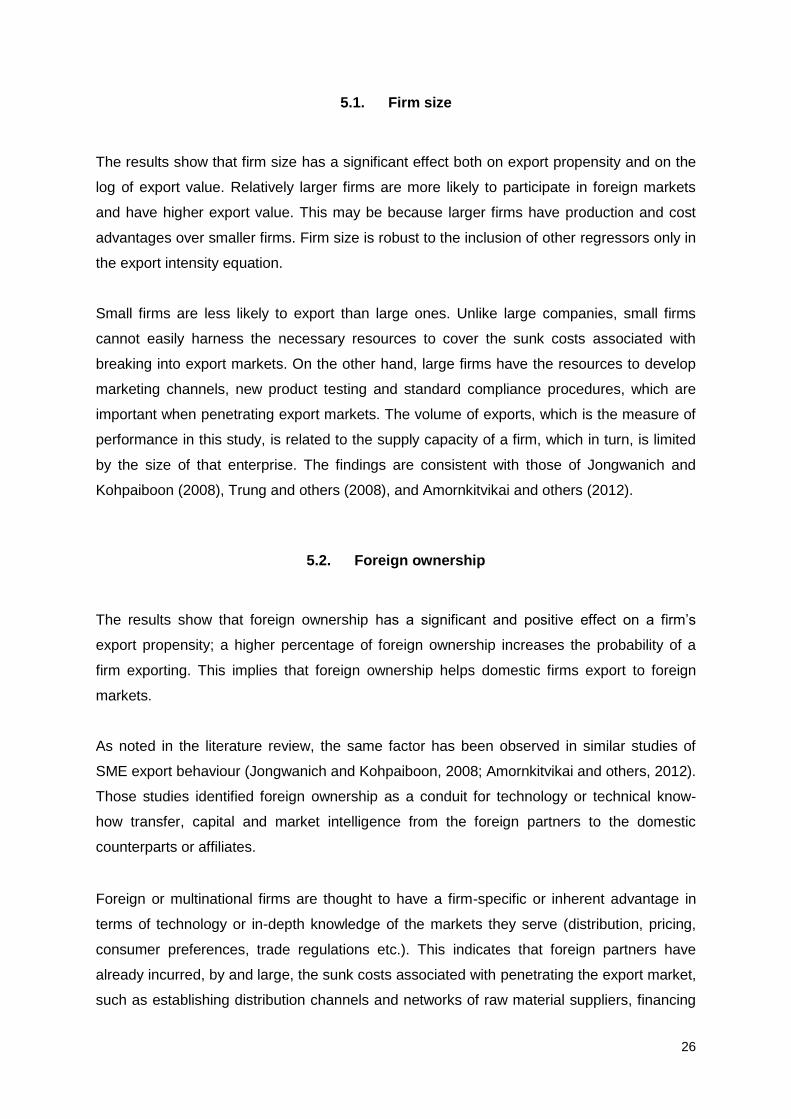
5.1. Firm size
The results show that firm size has a significant effect both on export propensity and on the
log of export value. Relatively larger firms are more likely to participate in foreign markets
and have higher export value. This may be because larger firms have production and cost
advantages over smaller firms. Firm size is robust to the inclusion of other regressors only in
the export intensity equation.
Small firms are less likely to export than large ones. Unlike large companies, small firms
cannot easily harness the necessary resources to cover the sunk costs associated with
breaking into export markets. On the other hand, large firms have the resources to develop
marketing channels, new product testing and standard compliance procedures, which are
important when penetrating export markets. The volume of exports, which is the measure of
performance in this study, is related to the supply capacity of a firm, which in turn, is limited
by the size of that enterprise. The findings are consistent with those of Jongwanich and
Kohpaiboon (2008), Trung and others (2008), and Amornkitvikai and others (2012).
5.2. Foreign ownership
The results show that foreign ownership has a significant and positive effect on a firm’s
export propensity; a higher percentage of foreign ownership increases the probability of a
firm exporting. This implies that foreign ownership helps domestic firms export to foreign
markets.
As noted in the literature review, the same factor has been observed in similar studies of
SME export behaviour (Jongwanich and Kohpaiboon, 2008; Amornkitvikai and others, 2012).
Those studies identified foreign ownership as a conduit for technology or technical know-
how transfer, capital and market intelligence from the foreign partners to the domestic
counterparts or affiliates.
Foreign or multinational firms are thought to have a firm-specific or inherent advantage in
terms of technology or in-depth knowledge of the markets they serve (distribution, pricing,
consumer preferences, trade regulations etc.). This indicates that foreign partners have
already incurred, by and large, the sunk costs associated with penetrating the export market,
such as establishing distribution channels and networks of raw material suppliers, financing

27
arrangements etc. The domestic affiliates/partners are thus spared from having to provide
the necessary resources to meet the fixed costs incurred in exporting.
5.3. Labour productivity
Labour productivity, on the other hand, has a significant and positive relationship with the log
of export value. This implies that more efficient firms have a better export performance. This
is consistent with the principle that the export premium of firms is linked to their superior
productivity compared to domestically-oriented firms.
5.4. Quality certification and managerial education
The presence of international quality certification among firms has been found to be a
significant determinant of export activity. However, when assessed by transforming the
quality certification variable into regional and industry indices to control for exogeneity, the
relationship disappears. Thus, this shows that the “signalling” relationship that affects firm
performance, as observed in several articles, may also be present for this sample of Filipino
firms. Managerial education was significant in some of the export propensity equations (see
annex 4), but the results were not robust to the inclusion of several other regressors.
5.5. Competition and access to finance and infrastructure
For the analysis of the effects of obstacles to business operations, the perception of firms on
the severity of these obstacles has been used. The obstacles included in the model are:
(a) Competition – significant and negatively-related to export propensity;
(b) Management of ports and airports – significant and positively-related to the log of
export value, but not robust to the presence of additional regressors;
(c) Finance – significant and negatively-related to the log of export value, but not robust
to presence of additional regressors.
The only variable that is significant in the regressions is the “obstacles” cited as practices of
competitors from the informal sector. It is interesting to note that the sign is negative,
implying that the probability of increasing export volumes declines with the frequency of
citations of this obstacle. As in the previous observation, as the export volume expands, the

28
linkage of a firm with the informal sector diminishes – be it in contractual labour or a
subcontracting arrangement. As operations expand, the demands for compliance with
regulations – accounting, labour arrangements, taxes and documentation – usually increase.
The documentation required for exporting activities are, of course, much more stringent.
The empirical results indicate that some concern exists over the administration of port and
airport shipping services in the Philippines, since this affects the amount of trade being
undertaken by the country. Radelet and Sachs (1998) showed that the quality of ports
administration affects shipping costs; the better the management of trading ports, the less
are the bureaucratic impediments to trade and the greater are the volumes that can be
traded.
Access to finance is an important concern of exporters. The results of this study partially
support recent research in the Philippines (Aldaba, 2012a; Aldaba and others, 2010) that
examined the channels through which finance supports SME growth. SMEs are relatively
more liquidity-constrained due to fewer contacts in the formal banking industry and a relative
shorter history in their relationship with the financial sector. The provision of finance also
affects innovation and the opening of new markets, which, in turn, have an impact on a
company’s ability to trade overseas. As indicated above, the literature is replete with works
identifying financing as a major constraint for SMEs in general, particularly when exporting.
However, ports administration and access to finance only have an impact on export intensity
in individual cases.
6. Policy implications
6.1. Firm size
The size of an enterprise is also a significant determinant in deciding whether or not to
export as well as in export performance. Small firms are less likely to export than large ones.
Unlike large companies, small firms cannot easily harness the necessary resources to cover
the sunk costs associated with breaking into the export market. On the other hand, large
firms have the resources to develop marketing channels, new product testing and standard
compliance procedures, among other factors, all of which are important in successfully
penetrating the export market. The volume of exports, which is the measure of performance

29
in this study, is related to the supply capacity of a firm; this, in turn, is limited by the size of
enterprise.
Given the empirical results, policy action to promote SME exports should be directed
towards increasing the size of firms. From the supply side perspective, increasing firm size
among SMEs is associated with increasing capacity. Expanding capacity, in turn, is
tantamount to investment. What, then, impedes investment spending by SMEs?
Given that markets work well, it is natural to expect firms that are competitive to grow.
However, if there are market failures (that impede the natural course of firm growth), there is
scope for policy action. Thus, Tecson (2004) argued that since small firms faced growth
constraints that were specific to them, they might require the provision of specialized
institutions or instruments that were perhaps inadequate in prevailing market conditions.
Such conditions call for government intervention.
As discussed above, the literature on the policy environment surrounding SMEs in the
Philippines is replete with references to financing constraints. The impediments to financing
for SMEs appear to be a major obstacle to growth in terms of size (Japan Organization for
Small and Medium Enterprises and Regional Innovation, 2008; Aldaba, 2010 and 2012a;
Tranh and others, 2010). Aldaba (2012a) stated that SMEs had been unable to access
needed funds due to their limited track record, limited acceptable collateral, and inadequate
financial statements and business plans, all of which are normally required by banks to
determine the creditworthiness of SMEs.
Policymakers are well aware of the problems experienced by SMEs in accessing financing.
Government programmes, together with international aid agencies, have embarked on a
number of programmes and project interventions designed to address credit and financing
bottlenecks. Microcredit schemes and government-mandated guidelines for SME financing
by commercial banks are some of the initiatives being pursued in this area. It appears
however, that the performance of many such programmes has not been on a par with
expectations (Japan Organization for Small and Medium Enterprises and Regional
Innovation, 2008).
Because financing constraints arise from information asymmetry, Aldaba (2012a)
recommended the implementation of the Central Credit Information Corporation. She pointed
out that there was scope for training and capacity-building programmes for SMEs to improve
their financial literacy and management capacity. Improving the capacity of SMEs to

30
construct prepare financial statements at a level of quality that is acceptable to financing
institutions would lower the transaction costs of financing.
6.2. Foreign ownership
The present study has found that the presence of foreign ownership is a consistently
significant factor in affecting both export participation and export performance. As noted in
the literature review, the same factor has been observed in similar studies of SME export
behaviour (Jongwanich and Kohpaiboon, 2008; Amornkitvikai and others, 2012).
The presence of foreign ownership, as stated above, contributes to improved firm
performance through the provision of better access to technology, finance and market
information. Multinational corporations would likely have made significant investments in
developing distribution and supplier networks as well as financial channels, which their local
partners can utilize in producing and marketing their products.
Aldaba (2012c) investigated the determinants of survivability or resiliency of manufacturing
firms in the Philippines. The results indicated that higher levels of foreign equity participation
were associated with greater survivability. Further, the study claimed that firms with foreign
ownership were generally more export-oriented, and had higher productivity levels. Such
observations are consistent with the findings of the present study.
If foreign participation is an important factor in the extensive and intensive margins of the
firms covered in this study, then policy action directed at facilitating foreign investments
should be promoted. There are a number of avenues through which this can be done. The
first approach is the creation of an environment that encourages foreign direct investment
(FDI), especially export-oriented FDI. Another approach is to promote or facilitate the
matching of foreign interests with local companies with the objective of forming a joint
venture or partnership. Investment incentives have a role in the former, while matching
programmes based on databases and accreditations can be designed for the latter.
There are already a number of provisions that extend incentives to export-oriented SME
exporters. For example, the Bureau of Small Medium Establishment Development (2004)
reported that the EO 226 Omnibus Investments Code of 1987 and RA 7918, an Act
Amending Article 39 of EO 226 extended trade-tied incentives. These provisions enable:

31
(a) The exemption of exporters from the requirement for advance payment of customs
duties and taxes;
(b) Duty-free importation of machinery and equipment, raw materials and packaging;
(c) Tax credit for imported inputs and raw materials that are primarily used in the
production and packaging of export goods and which are not readily available locally;
(d) A tax credit of 25% of duties paid on raw materials and capital equipment and/or
spare parts. The credit is available to exporters of non-traditional products that use or
substitute locally- produced inputs.
Tecson (2004) further reported that if they were located in the Philippine Economic Zone
Authority, Clark Special Economic Zone Authority and the Subic Special Economic and
Freeport Zone Authority, export-oriented SMEs were eligible to apply for incentives such as:
(a) Exemption from corporate income tax from four to eight years, duties and taxes on
imported capital equipment, spare parts, raw materials and supplies, and national
and local taxes (including value-added tax for certain exporting industries); and
(b) Tax credit for import substitution, domestic capital equipment.
These sets of existing incentives could also conceivably attract FDI from SMEs wanting to
use the Philippines as an export platform. Alternatively, these incentives would improve the
prospects for domestic SMEs being able to match with a foreign interest in a joint venture or
partner agreement.
A related programme area concerns the identification of a suitable foreign partner or joint
venture counter party. Tecson (2004) stated that it was difficult for SMEs to find suitable
foreign partners to engage in joint ventures, networks or alliances for internationalization. A
lack of adequate information for prospective foreign interests on the capability and quality
standards of domestic SMEs could be a hurdle. Therefore, the ability of SMEs to
demonstrate their production capability at acceptable quality standards, using accreditation
instruments, will be an important factor in securing contracts or partnership arrangements.
Another programme to overcome inadequate information on domestic SMEs, according to
Tecson (2004), was the use of appropriate databases that match SMEs with specific
capabilities with subcontractors in need of such services.

32
6.3. Governance issues
Governance is an important enabler for all industries to prosper, particularly SMEs engaged
in exporting. Although specific governance variables do not explicitly appear in the
regression, they should be considered in policy discussions. General governance issues
arise in the context of the growth of the SMEs. For example, as export volume expands, the
linkage of a firm with the informal sector – be it through contractual labour or a
subcontracting arrangement – will diminish. Furthermore, as operations expand, the
demands for compliance with regulations – accounting, labour arrangements, taxes and
documentation – usually increase. The documentation required for exporting activities are, of
course, much more stringent. Thus, governance issues such as regulation could become a
constraint to SMEs growth, depending on how SMEs deal with it.
The Government of the Philippines is aware of the above-mentioned governance issues that
are affecting SMEs. Legislation, such as the “Magna Carta” for MSMEs, and various
initiatives undertaken by international bodies such as the Canada International Development
Agency and the German aid agency, GIZ, have been introduced with the aim of improving
the business environment for SMEs. In addition, the Micro, Small and Medium-Scale
Enterprise Development Council, which was established to coordinate and facilitate national
efforts to develop SMEs, has produced the MSME Development Plan for 2011-2016. The
Plan outlines the various programmes and projects designed to improve the following areas:
(a) the business environment; (b) access to finance; (c) access to markets; and (d)
productivity and efficiency.
To what extent has the business environment improved as a result of all the regulations,
programmes and projects designed to develop the SMEs? Fortunately, a number of
indicators have been developed by the international agencies concerned to enable to
improvements in governance to be tracked. For example, partly with the objective of
promoting awareness of improving governance, the World Bank launched the “Doing
Business Project” in 2002. The project provides objective measures of business regulations
and their enforcement across 185 economies. More importantly, the project has a focus on
domestic SMEs, and analyses the regulations affecting them throughout their life cycle. By
ranking countries against a set of objective criteria, it is hoped that the project will encourage
policymakers to promote efficient and effective regulation.

33
Using the indicators in “Doing Business’, the frontier analysis is an approach to monitoring
improvements in a country’s regulatory standards. According to the World Bank, 1 “this
measure shows the distance of each economy to the ‘frontier’, which represents the highest
performance observed for each of the indicators across all economies covered in ‘Doing
Business’, since each indicator was included in ‘Doing Business’. An economy’s distance to
the frontier is indicated on a scale of zero to 100, with zero representing the lowest
performance and 100 the frontier. For example, a score of 75 in Doing Business 2012
means an economy was 25 percentage points away from the frontier, constructed from the
best performances across all economies and across time. A score of 80 in Doing Business
2013 would indicate the economy is improving. In this way, the distance to frontier measure
complements the yearly ease of doing business ranking, which compares economies with
one another at a point in time”.
It would thus be interesting to study how the business environment in the Philippines has
improved by using the governance indicators developed by the World Bank. Table 18 shows
the performance of the Philippines, using frontier analysis only for a subset of the full range
of indicators in Doing Business.
Table 18. Doing business: Distance to frontier analysis
Indicators DB 2006
DB 2010
DB 2013
Overall 50.4 50.7 51.7
Starting a business 62.4 63.5 65.3
Dealing with Construction Permit 60.2 60.8 62.4
Registering Property 64.1 64.1 64.1
Getting Credit 43.8 43.8 43.8
Trading Across Borders 67.6 68.2 71
Enforcing Contracts 52 51.6 51.6
Resolving Insolvencies 5.3 5.7 6.2
Source: World Bank “Doing Business”, available at www.doingbusiness.org/data/distance-to-frontier.
The analysis indicates that the relative performance of the Philippines in matters dealing with
permits, as shown in the indicators for (a) starting a business, (b) dealing with construction
permits and (c) registering property, showed only a slight improvement from 2006 to 2013. In
legal matters, the indicators to look at are enforcing contracts and resolving insolvencies. In
this regard, there have been improvements in resolving insolvencies but a very slight
deterioration in enforcing contracts. The indicator for trading on time, represented by the
1 See www.doingbusiness.org/data/distance-to-frontier.

34
number of days it takes to transport cargo from factory gate to ship. Overall, there has been
an improvement in the Philippines over time, given the movements in the indicators of Doing
Business, albeit moderately.
6.4. Human capital and quality certification
The empirical results suggest that human capital factors play an important role in the
performance of exporters. Firms with high levels of labour productivity usually have higher
levels of export volume. This observation implies that one of the sources of competitiveness
in exports is the quality of human resources.
According to Aldaba and others (2010), labour productivity of SMEs in the Philippines has, in
general, remained at only about half that of large enterprises. In addition, Fukumoto (1998)
noted that most SMEs in the Philippines suffered from a lack of skilled labour, insufficient
technical training, a lack of information about market opportunities and limited market
access. These factors could contribute to the low levels found in firm productivity in
manufacturing during the period covered by the study.
These observations and findings clearly indicate the need for human resource development,
particularly training. At the firm level, SMEs can be encouraged to conduct training
programmes. The Government can provide incentives for these activities by making them
tax-deductible. Skills upgrading, through better delivery of vocational programmes should be
supported by a government budget. Public-private-academe partnerships in designing
curricula, taking into account the evolving demand for competencies, should be pursued in
order to make the products of the educational institutions adequately prepared for the
workplace.
Firms could also be encouraged to participate in quality certification programmes. This could
have an effect similar to that gained from improving efficiency processes within a firm
because the programmes would indicate to potential customers outside the Philippines that
the company produces “good” products. The criteria for quality certification developed by
Philippine Bureau of Product Standards are also important guidelines for exporters.

35
6.5. State of infrastructure
The state of the infrastructure is recognized as having a direct impact on export
competitiveness. Especially with regard to the international production networks, the ability
to respond to market requirements and deliver products at the least cost is a premium
attribute. Inefficiencies, brought about by the poor state of infrastructure, could act as an
indirect or “hidden” tax on exporters. A number of infrastructure-related factors, such as the
availability, cost and efficiency of international shipping services (excluding air services), and
locational factors, have been found to have a significant influence on the performance of
exporters.
The empirical results of this study indicate that firms that voice concern over the port
administration services in the Philippines tend to have higher export volumes than those
businesses that have not registered complaints. This is rather perplexing. One interpretation
is that when firms start to show concern over the quality of international shipping services,
then they are already recording adequate levels of export volume.
The general quality of the infrastructure in the Philippines leaves much to be desired. In
order to address such limitations, industrial estates and export processing zones have been
established. These zones have privately-operated infrastructure services, e.g., ports, power
plants, customs offices etc. However, unless they are well-capitalized, SMEs cannot easily
afford to be located in export processing zones. Hence, the upgrading of infrastructure of the
whole economy becomes an important consideration, particularly for SMEs.
The World Bank has embarked on projects that seek to assess the quality of logistics for 155
countries. To monitor the development of the logistics per country, the World Bank has
developed a Logistics Performance Index (LPI). The LPI is based on a worldwide survey of
logistics users, such as global freight forwarders and express carriers, which evaluates the
”friendliness” of the countries in which they operate. Thus, it provides a useful benchmark in
assessing the progress of a country’s logistical development over time, or rankings across
countries. Table 18 presents the comparative LPI of the Philippines compared with certain
countries. Germany is the highest-ranked country for LPI, followed by Singapore. The
Philippines is ranked at 44, ahead of its ASEAN neighbours, Viet Nam, Indonesia and
Myanmar. The Philippines performs quite well against other upper middle income countries
in the sample. However, while it does not score satisfactorily in quality of infrastructure
relative to Thailand or Malaysia, it does score reasonably well in international shipments,
which captures the ease of arranging competitively-priced shipments.

36
Table 19. Logistical performance Index
Int. Country
LPI Customs Infrastructure International
shipments Logistics
competence Tracking and
tracing Timeliness
LPI Rank
1 Germany 4.11 4 4.34 3.66 4.14 4.18 4.48
2 Singapore 4.09 4.02 4.22 3.86 4.12 4.15 4.23
29 Malaysia 3.44 3.11 3.5 3.5 3.34 3.32 3.86
35 Thailand 3.29 3.02 3.16 3.27 3.16 3.41 3.73
44 Philippines 3.14 2.67 2.57 3.4 2.95 3.29 3.83
53 Viet Nam 2.96 2.68 2.56 3.04 2.89 3.1 3.44
75 Indonesia 2.76 2.43 2.54 2.82 2.47 2.77 3.46
133 Myanmar 2.33 1.94 1.92 2.37 2.01 2.36 3.29
Regions
3 East Asia and
Pacific 2.73 2.41 2.46 2.79 2.58 2.74 3.33
Income groups
1 High income:
all 3.55 3.36 3.56 3.28 3.5 3.65 3.98
2 Upper middle
income 2.82 2.49 2.54 2.86 2.71 2.89 3.36
4 Low income 2.43 2.19 2.06 2.54 2.25 2.47 2.98 Source: World Bank, available at www1.worldbank.org/PREM/LPI/tradesurvey/mode1b.asp.

37
Conclusion
This paper briefly reviews the different determinants of export propensity and intensity
among SMEs in the Philippines. It utilizes the data from the World Bank enterprise surveys,
which contain subjective elements concerning the impediments to conducting business in
general (e.g., concerns over labour regulations, shipping etc.). Firm size is shown to be a
robust determinant, both of export propensity and intensity. It is also suggested that while
labour productivity is important in determining the value of firm exports, there are certain
qualities that are important to the initial decision to export, such as foreign ownership as well
as the presence of informal competition that acts as a barrier to initial export efforts. This
suggests that there are fixed costs that firms have to surmount before they can export.
These findings share many similarities with other studies on the exporting behaviour of
SMEs in other countries.
The study likewise discusses the policy implications of the findings and suggests that policy
focus should be accorded to firm ownership, governance and human capital (training).
Addressing the issue of infrastructure improvements is also recommended as an enabling
factor in promoting competitiveness.
A review of the various programmes and development plans of the Government of the
Philippines as well as various international aid agencies that are aimed at addressing the
needs of SMEs reveals that the Government is cognizant of the challenges that SMEs face.
The fact that SME concerns still persist suggests that the implementation of related policies
can still be strengthened. Enabling SMEs to export is particularly important if trade activities
are to be truly inclusive.

38
References
Aldaba, R.M. (2012a). “Small and medium enterprises’ access to finance: Philippines”,
Philippine Institute for Development Studies Discussion Paper No. 2012-05. Makati City.
——— (2012b). “Trade reforms, competition and innovation in the Philippines”, Philippine
Institute for Development Studies Discussion Paper Series No. 2012-06. Makati City.
——— (2010). “Does trade protection improve firm productivity? Evidence from Philippine
Micro Data”, Philippine Institute for Development Studies Discussion Paper Series No.
2010-32. Makati City.
Aldaba, R.M., E. Medalla, F. del Prado and R. Yasay (2010). “Integrating SMEs into the East
Asian region: Philippines”, in V.T. Tranh, D. Narjoko and S. Oum (eds.), Integrating
Small and Medium Enterprises into the more Integrated East Asia, ERIA Project Report
2009, No. 8. Economic Research Institute for ASEAN and East Asia, Jakarta.
Amornkitvikai, Y., C. Harvie and T. Charoenrat (2012). “Factors affecting the participation
and performance of Thai manufacturing small and medium-sized firms”, paper presented
at fifty-seventh International Council for Small Business World Conference. International
Council for Small Business, Wellington, New Zealand.
Ando, M. and F. Kimura (2005). “The formation of international production and distribution
networks in East Asia”, in T. Ito and A. Rose (eds.), International Trade in East Asia,
National Bureau of Economic Research, East Asia Seminar on Economics. University of
Chicago Press, IL, United States.
Araujo, M. L. del Rio and M. C. V. Niera (2006). “Managerial characteristics and export
performance in Spanish SMEs”, ESIC Market vol. 37, No. 1; pp 191-222.
Arora, A. and J. Asundi (1999). “Quality certification and the economics of contract software
development: A study of the Indian software industry”, NBER Working Paper No. 7260.
National Bureau of Economic Research, Cambridge, MA, United States.
Athukorala, P-C., S. Jayasuriya and E. Oczkowski (1995). “Multinational firms and export
performance in developing countries: Some analytical issues and new empirical
evidence”, Journal of Development Economics, vol. 46, No. 1; pp 109-122.
Balisacan, A. and H. Hill (2003). The Philippine Economy: Developments, Policies and
Challenges. Ateneo de Manila University Press, Quezon City, the Philippines.
Beck, T. and A. Demirguc-Kunt (2006). “Small and medium-size enterprises: Access to
finance as a growth constraint”, Journal of Banking and Finance, vol. 30; pp. 2931-2943.

39
Berman, N. and J. Hericourt (2008). “Financial factors and the margins of trade: Evidence
from cross-country firm-level data”, CES Working Paper No. 50. Centre d’Economie de
la Sorbonne, Paris.
Bernard, A. and B. Jensen (2004). “Why firms export”, Review of Economics and Statistics,
vol. 86, No. 2; pp. 561-569.
Bureau of Micro, Small and Medium Enterprise Development (2004). SME Development
Plan 2004-2010. Department of Trade and Industry, Makati City, the Philippines.
Clerides, S., S. Lach and N. Tybout (1998). "Is ‘learning-by-exporting’ important? Micro-
dynamic evidence from Colombia, Mexico and Morocco", NBER Working Paper No.
5715. National Bureau of Economic Research, Cambridge, MA, United States.
Correa, P., M. Dayoub and M. Francisco (2007). “Identifying supply-side constraints to
export performance in Ecuador: An exercise with investment climate survey data”, World
Bank Policy Research Working Paper No. 4179. Washington, D.C.
Dueñas-Caparas, Ma. T. (2006). “Determinants of export performance in the Philippine
manufacturing sector”, Philippine Institute for Development Studies Discussion Paper
Series No. 2006-18. Makati City.
Estrin, S., K. Meyer, M. Wright, and F. Foliano (2008). “Export propensity and intensity of
subsidiaries in emerging economies”, International Business Review, vol. 17, No. 5; pp.
574-586.
Fukumoto, M. (1998). “Development policies for small and medium enterprises in APEC – in
the case of the Philippines”, APEC Study Centre – Institute of Developing Economies,
Chiba, Chiba Prefecture, Japan. Available at
www.ide.go.jp/English/Publish/Download/Apec/pdf/1998_04.pdf.
Harvie, C., D. Narjoko and S. Oum (2010). “Constraints to growth and firm characteristics
[and] determinants of SME participation in production networks,” in V. T. Tranh, D.
Narjoko and S. Oum (eds.), Integrating Small and Medium Enterprises into the More
Integrated East Asia. Economic Research Institute for ASEAN and East Asia, Jakarta,
Indonesia.
Hill, H. (2003). “Industry,” Balisacan, A. and H. Hill (2003). The Philippine Economy:
Developments, Policies and Challenges. Ateneo de Manila University Press, Quezon
City, the Philippines. Holzmuller, H. and H. Kasper (1991). “On a theory of export
performance: Personal and organizational determinants of export trade activities
observed in small and medium-sized firms”, Management International Review, vol. 31,
pp. 45-70.
40
Japan Organization for Small & Medium Enterprises and Regional Innovation (2008). “Small
and medium enterprise development policies in 6 ASEAN countries”. Tokyo. Available at
www.smrj.go.jp/keiei/dbps_data/_material_/common/chushou/b_keiei/keieikokusai/pdf/S
ME_in_ASEAN_E1_0803.pdf (accessed 29 September 2012).
Jones, R. and H. Kierzkowski (1990). “The role of services in production and international
trade: A theoretical framework”, in R. Jones and A. Kreuger (eds.), The Political
Economy of International Trade. Basil Blackwell, Oxford, United Kingdom.
Jongwanich, J. and A. Kohpaiboon (2008). “Export performance, foreign ownership and
trade policy regime: Evidence from Thai manufacturing,” ADB Economics Working Paper
Series No. 140. Asian Development Bank, Manila.
Lanzona, L. and R. Evenson (1997). “The effects of transactions costs on labor market
participation and earnings: Evidence from rural Philippine markets”, Economic Growth
Center Discussion Paper 790. Yale University, Connecticut, United States.
Micro, Small and Medium-Scale Enterprise Development Council (2011). Micro, Small
and Medium Enterprise Development Plan for 2011-2016. Department of Trade and
Industry, Manila.
National Statistics Office (2012). 2011 Updating List of Establishments Survey. Manila.
——— (2011). 2010 Updating List of Establishments Survey. Manila.
——— (2008). 2006 Census of Philippine Business and Industry. Manila.
Radelet, S. and J. Sachs (1998). “Shipping costs, manufactured exports and economic
growth,” paper presented at the annual of the American Economic Association, 3-5
January 1998, Chicago, United States.
Ramaswami, S. N. and Y. Yang (1990). “Perceived barriers to exporting and export
assistance requirements,” in S. T. Cavusgil and M. R. Czinkota (eds.), International
Perspectives on Trade Promotion and Assistance. Quorum Books, Westport, CT, United
States.
Rasiah, R., M. Rosli and P. Sanjivee (2010). “The significance of production networks in
productivity, exports and technological upgrading: Small and medium-scale enterprises
in electric-electronics, textile-garments, automotives and wood products in Malaysia”, in
V.T. Tranh, D. Narjoko and S. Oum (eds.), Integrating Small and Medium Enterprises
into the More Integrated East Asia. Economic Research Institute for ASEAN and East
Asia, Jakarta.
Roberts, M. and J. Tybout (1997). “The decision to export in Colombia: An empirical model
of entry with sunk costs”, American Economic Review, vol. 87, No. 5; pp. 545-564.

41
Suarez-Ortega, S. (2003). “Export barriers: Insights from small and medium-sized firms”,
International Small Business Journal, vol. 21, No. 4; pp. 403-419.
Tecson, G. (2004). “Review of existing policies affecting micro, small and medium
enterprises in the Philippines”, Small and Medium Enterprise Development for
Sustainable Employment Programme, German Technical Agency, Bonn, Germany.
Terlaak A. and A. King (2006). “The effect of certification with the ISO 9000 standard: A
signalling approach,” Journal of Economic Behavior and Organization, vol. 60, No. 4; pp.
579-602.
Tranh, V. T., D. Narjoko and S Oum (2010). “Integrating small and medium enterprises into
the More Integrated East Asia”, ERIA Project Report 2009, No. 8. Economic Research
Institute for ASEAN and East Asia, Jakarta.
Trung, T. Q., N. T. Tung, T. D. Dong and P. H. Duong (2008). “Performance of export-
oriented small and medium-sized manufacturing enterprises in Vietnam”, ARTNeT
Working Paper Series No. 54. Asia-Pacific Research and Training Network on Trade,
United Nations ESCAP, Bangkok.
World Bank (2010). “Philippine Country Profile: 2009 Enterprise Survey”. Washington, D.C.
Xeugong, S. and L. Xueyan (2010). “Integrating China’s small and medium enterprises into
international production networks in East Asia,” in V.T. Tranh, D. Narjoko and S. Oum
(eds.), Integrating Small and Medium Enterprises into the More Integrated East Asia.
Economic Research Institute for ASEAN and East Asia, Jakarta.
Zhao, H. and S. Zou (2002). “The impact of industry concentration and firm location on
export propensity and intensity: An empirical analysis of Chinese manufacturing firms,”
Journal of International Marketing, vol. 10, No. 1; pp. 52-71.
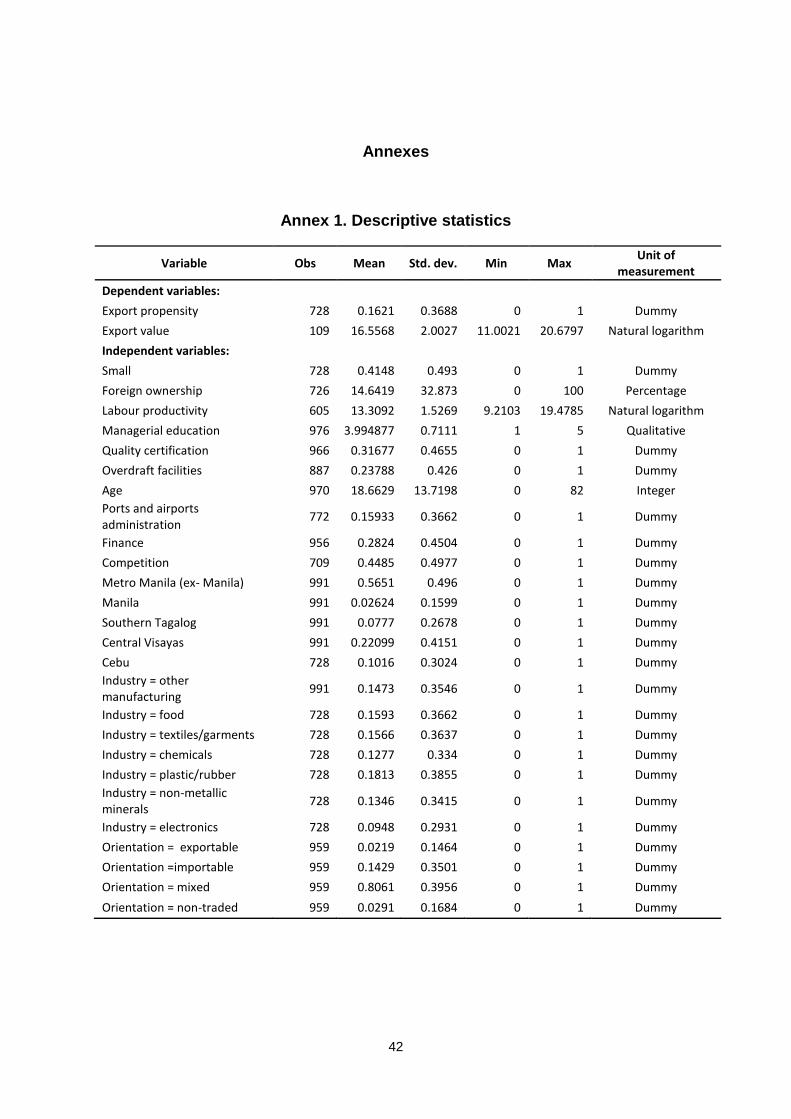
42
Annexes
Annex 1. Descriptive statistics
Variable Obs Mean Std. dev. Min Max Unit of
measurement
Dependent variables:
Export propensity 728 0.1621 0.3688 0 1 Dummy
Export value 109 16.5568 2.0027 11.0021 20.6797 Natural logarithm
Independent variables:
Small 728 0.4148 0.493 0 1 Dummy
Foreign ownership 726 14.6419 32.873 0 100 Percentage
Labour productivity 605 13.3092 1.5269 9.2103 19.4785 Natural logarithm
Managerial education 976 3.994877 0.7111 1 5 Qualitative
Quality certification 966 0.31677 0.4655 0 1 Dummy
Overdraft facilities 887 0.23788 0.426 0 1 Dummy
Age 970 18.6629 13.7198 0 82 Integer
Ports and airports administration
772 0.15933 0.3662 0 1 Dummy
Finance 956 0.2824 0.4504 0 1 Dummy
Competition 709 0.4485 0.4977 0 1 Dummy
Metro Manila (ex- Manila) 991 0.5651 0.496 0 1 Dummy
Manila 991 0.02624 0.1599 0 1 Dummy
Southern Tagalog 991 0.0777 0.2678 0 1 Dummy
Central Visayas 991 0.22099 0.4151 0 1 Dummy
Cebu 728 0.1016 0.3024 0 1 Dummy
Industry = other manufacturing
991 0.1473 0.3546 0 1 Dummy
Industry = food 728 0.1593 0.3662 0 1 Dummy
Industry = textiles/garments 728 0.1566 0.3637 0 1 Dummy
Industry = chemicals 728 0.1277 0.334 0 1 Dummy
Industry = plastic/rubber 728 0.1813 0.3855 0 1 Dummy
Industry = non-metallic minerals
728 0.1346 0.3415 0 1 Dummy
Industry = electronics 728 0.0948 0.2931 0 1 Dummy
Orientation = exportable 959 0.0219 0.1464 0 1 Dummy
Orientation =importable 959 0.1429 0.3501 0 1 Dummy
Orientation = mixed 959 0.8061 0.3956 0 1 Dummy
Orientation = non-traded 959 0.0291 0.1684 0 1 Dummy

43
Annex 2. Correlation matrix Export Export
Small Foreign Labour Manager
education Quality
certification Overdraft facilities
Age Ports
admin Finance Competition
propensity value ownership productivity
Export propensity 1
Export . 1
value -1
Small -0.1736 -0.2585 1
0 -0.0067
Foreign 0.4473 0.4014 -0.1667 1
ownership 0 0 0
Labour 0.1053 0.6408 -0.2073 0.2047 1
productivity -0.0023 0 0 0
Manager education 0.16 0.1469 -0.1544 0.1599 0.2625 1
0 -0.0246 0 0 0
Quality certification 0.3163 0.3627 -0.174 0.4017 0.275 0.1957 1
0 0 0 0 0 0
Overdraft facilities 0.0713 0.0762 -0.1439 -0.0023 0.1091 0.14 0.1064 1
-0.0338 -0.2649 -0.0002 -0.9451 -0.0026 0 -0.0017
Age -0.0481 -0.1302 -0.1598 -0.194 0.0327 0.0709 -0.0038 0.0916 1
-0.1344 -0.0462 0 0 -0.3479 -0.0285 -0.9079 -0.0069
Ports administration 0.0297 -0.1173 0.0106 0.0062 0.0309 0.07 0.0235 0.0507
-0.0184
1
-0.411 -0.00784 -0.8069 -0.8637 -0.4262 -0.0534 -0.5199 -0.1864 -0.612
Finance -0.0562 -0.1772 0.0051 -0.1269 -0.1185 -0.0243 -0.1586 -0.024 0.0345 0.1345 1
-0.0825 -0.0066 -0.893 -0.0001 -0.0007 -0.4556 0 -0.9447 -
0.2904 -
0.0002
Competition
-0.1336 -0.0563 -0.0038 -0.1673 0.016 0.022 -0.0903 0.0719 0.1015 0.0982 0.1864 1
0 -0.3958 -0.9199 0 -0.6484 -0.499 -0.0057 -0.0348 -
0.0018 -
0.0069 0
Note: Significance level in parentheses.

44
Annex 3a. Probit regressions for individual regressors
Regressors (1) (2) (3) (4) (5) (6) (7) (8) (9) (10)
Firm size (small) -0.579*** (0.123) Foreign ownership
0.0143***
(0.00110) Quality certification
0.883***
(0.0927) Managerial education
0.357***
(0.0836) Labor productivity
0.0903**
(0.0294) Competition as an obstacle
-0.379***
(0.0914) Overdraft facilities
0.220*
(0.105) NCR (ex- Manila)
-0.364
(0.328) Central Luzon
0.107
(0.169) Southern Tagalog
0.514***
(0.105) Cebu
0.420**
(0.138) Food industry
-0.756***
(0.179) Textiles and garments
-0.177
(0.156)

45
Chemicals
-0.617***
(0.177)
Plastics and rubber
-0.215
(0.149)
Non-metallic industries
-0.292
(0.166)
Electronics
0.491**
(0.153)
Importable
-0.520
(0.319)
Mixed
-0.0291
(0.294)
Non-traded
0.200
(0.378)
Constant -0.786*** -1.062*** -0.986*** -2.104*** -0.513*** -1.825*** -0.707*** -0.834*** -0.482*** -0.566
(0.0681) (0.0561) (0.0585) (0.347) (0.0558) (0.401) (0.0529) (0.0603) (0.108) (0.290)
N 728 987 965 975 959 837 887 990 990 958 *, p<0.05; **, p<0.01; ***, p<0.001. Note: Probit regression marginal effects reported; robust standard errors in parentheses.
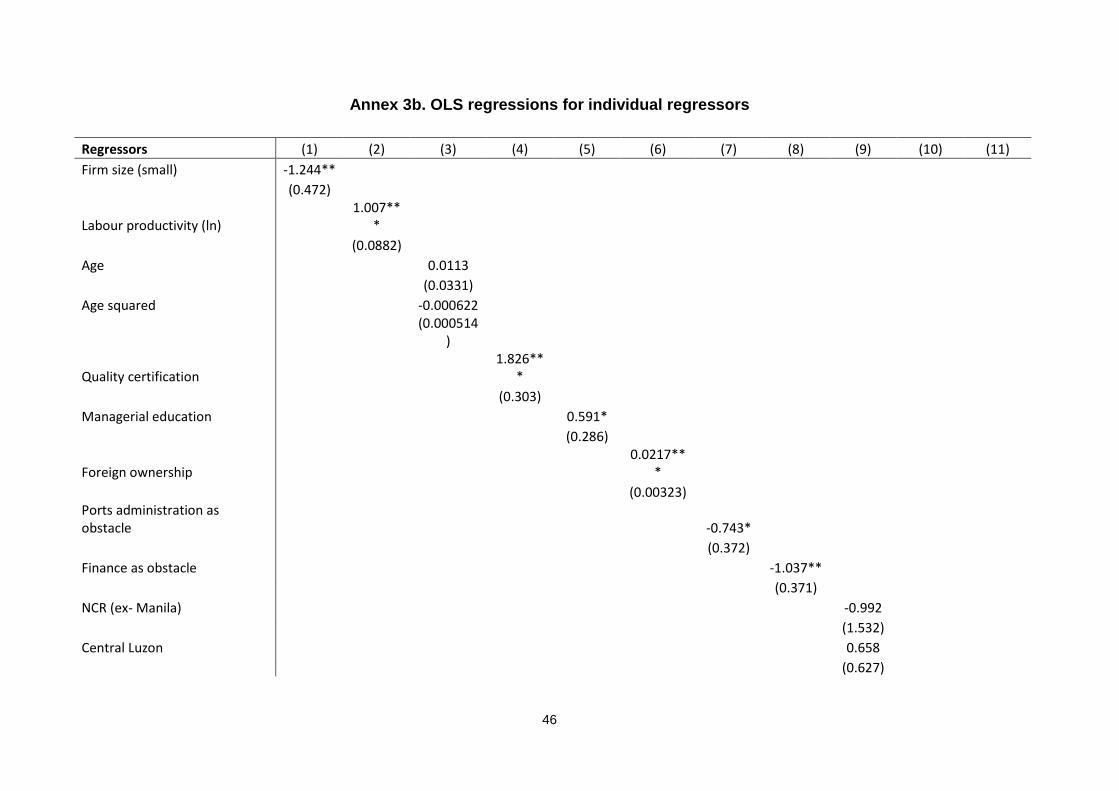
46
Annex 3b. OLS regressions for individual regressors
Regressors (1) (2) (3) (4) (5) (6) (7) (8) (9) (10) (11)
Firm size (small) -1.244** (0.472)
Labour productivity (ln)
1.007***
(0.0882) Age
0.0113
(0.0331) Age squared
-0.000622
(0.000514)
Quality certification
1.826***
(0.303) Managerial education
0.591*
(0.286)
Foreign ownership
0.0217***
(0.00323) Ports administration as
obstacle
-0.743*
(0.372)
Finance as obstacle
-1.037**
(0.371)
NCR (ex- Manila)
-0.992
(1.532)
Central Luzon
0.658
(0.627)

47
Southern Tagalog
1.076**
(0.379)
Cebu
0.776
(0.416)
Food industry
-1.511
(0.967)
Textiles and garments
-0.959*
(0.486)
Chemicals
-1.104
(0.586)
Plastics and rubber
-1.148*
(0.457)
Non-metallic industries
-1.673**
(0.544)
Electronics
0.936*
(0.467)
Importable
-0.747
(0.497)
Mixed
0.905**
(0.311)
Non-traded
2.632*
(1.051)
Constant 16.83**
* 4.051**
* 17.96*** 16.85**
* 15.36**
* 16.65*** 18.06**
* 18.09**
* 17.35**
* 18.26**
* 17.05**
*
(0.206) (1.214) (0.411) (0.212) (1.232) (0.223) (0.184) (0.188) (0.255) (0.329) (0.256)
N 109 228 235 232 234 237 226 234 238 238 233 * p<0.05, ** p<0.01, *** p<0.001. Note: Robust standard errors are in parenthesis

48
.
Annex 4. Export propensity (logit/probit) results
(1) (2) (3) (4) (5) (6) (7)
Regressors Logit Probit Logit Probit Logit Probit Logit Probit Logit Probit Logit Probit Logit Probit
Firm size (small) -0.773** -0.428** -0.611* -0.347* -0.482 -0.286 -0.481 -0.287 -0.568 -0.323* -0.451 -0.270 -0.575 -0.330*
(0.259) (0.139) (0.266) (0.142) (0.279) (0.152) (0.281) (0.153) (0.291) (0.159) (0.281) (0.153) (0.295) (0.160)
Foreign ownership 0.0171*** 0.0101*** 0.0155*** 0.00918*** 0.0160*** 0.00949*** 0.0165*** 0.00984*** 0.0145*** 0.00855*** 0.0153*** 0.00907*** 0.0150*** 0.00887***
(0.00283) (0.00167) (0.00301) (0.00176) (0.00319) (0.00185) (0.00326) (0.00190) (0.00330) (0.00193) (0.00329) (0.00191) (0.00335) (0.00197)
Labour productivity (ln) 0.0650 0.0381 0.000909 -0.0000603 -0.0304 -0.0165 -0.0334 -0.0214 0.0290 0.0181 -0.0214 -0.0130 0.0262 0.0132
(0.0780) (0.0431) (0.0857) (0.0468) (0.0892) (0.0488) (0.0897) (0.0491) (0.0883) (0.0489) (0.0884) (0.0485) (0.0889) (0.0493)
Managerial education
0.438 0.195 0.518 0.209 0.510 0.202 0.542 0.216 0.570 0.227 0.537 0.207
(0.248) (0.122) (0.286) (0.134) (0.299) (0.137) (0.296) (0.138) (0.313) (0.140) (0.312) (0.142)
Quality certification
0.648* 0.383** 0.760** 0.445** 0.787** 0.469** 0.762** 0.461** 0.749** 0.442** 0.796** 0.485**
(0.263) (0.149) (0.277) (0.157) (0.283) (0.159) (0.292) (0.161) (0.281) (0.160) (0.297) (0.164)
Overdraft facilities
0.0542 0.00343 0.0585 0.00486 0.0970 0.0330 0.0925 0.0342 0.111 0.0388
(0.289) (0.160) (0.290) (0.159) (0.301) (0.163) (0.292) (0.162) (0.300) (0.162) Competition as an obstacle
-0.648* -0.329* -0.679* -0.349* -0.678* -0.352* -0.676* -0.342* -0.708* -0.370*
(0.277) (0.146) (0.279) (0.145) (0.284) (0.149) (0.283) (0.148) (0.287) (0.149)
NCR (ex- Manila)
0.777 0.404
0.802 0.394
(0.809) (0.473)
(0.797) (0.460)
Central Luzon
0.0181 -0.0721
0.00171 -0.0760
(0.443) (0.255)
(0.469) (0.265)
Southern Tagalog
-0.0857 -0.0791
-0.132 -0.0949
(0.325) (0.176)
(0.330) (0.178)
Cebu
0.388 0.200
0.556 0.285
(0.381) (0.214)
(0.397) (0.223)
Food industry
-0.573 -0.321
-0.647 -0.344
(0.544) (0.284)
(0.540) (0.286)
Textiles and garments
0.405 0.199
0.499 0.255
(0.456) (0.256)
(0.462) (0.260)

49
Chemicals
-1.273* -0.744**
-1.217* -0.704*
(0.539) (0.280)
(0.536) (0.280)
Plastics and rubber
-0.0328 -0.0411
0.0504 0.00846
(0.404) (0.227)
(0.400) (0.227)
Non-metallic industries
-0.344 -0.169
-0.366 -0.170
(0.478) (0.262)
(0.482) (0.263)
Electronics
0.0522 0.00754
0.139 0.0716
(0.440) (0.251)
(0.442) (0.252)
Importable
-0.659 -0.395
(0.844) (0.467)
Mixed
-0.261 -0.196
(0.767) (0.422)
Non-traded
-0.403 -0.333
(1.031) (0.580)
Constant -2.540* -1.508* -3.666** -1.902** -3.420* -1.654* -3.400* -1.571* -4.086** -2.008** -3.407 -1.536 -4.128** -1.952*
(1.060) (0.586) (1.372) (0.702) (1.444) (0.729) (1.521) (0.751) (1.493) (0.757) (1.840) (0.882) (1.571) (0.781)
N 605 605 582 582 530 530 530 530 530 530 510 510 530 530
pseudo R-sq 0.103 0.105 0.123 0.123 0.151 0.150 0.155 0.153 0.174 0.173 0.153 0.150 0.180 0.178
* p<0.05, ** p<0.01, *** p<0.001. Note: Probit and logit regression marginal effects reported; robust standard errors in parentheses.

50
Annex 5. Export value (OLS)
Regressors (1) (2) (3) (4) (5) (6) (7)
Firm size (small) -0.871** -0.810* -0.736* -0.711* -0.711* -0.700* -0.719*
(0.315) (0.341) (0.324) (0.309) (0.349) (0.336) (0.338)
Labour productivity (ln) 0.971*** 0.975*** 0.906*** 0.961*** 0.878*** 0.883*** 0.941***
(0.0855) (0.104) (0.105) (0.105) (0.0979) (0.112) (0.100)
Age 0.0351 0.0487 0.0715* 0.0657* 0.0685* 0.0701* 0.0640*
(0.0341) (0.0359) (0.0319) (0.0298) (0.0316) (0.0327) (0.0301)
Age squared -0.00104 -0.00124 -
0.00186*** -
0.00183*** -
0.00186*** -
0.00182** -
0.00182***
(0.000737) (0.000754) (0.000544) (0.000479) (0.000519) (0.000566) (0.000488)
Quality certification
-0.234 -0.126 -0.132 -0.236 -0.0189 -0.191
(0.320) (0.332) (0.331) (0.322) (0.352) (0.319)
Managerial education
0.105 0.0785 0.0238 0.0344 0.145 -0.0169
(0.239) (0.244) (0.225) (0.271) (0.265) (0.265)
Foreign ownership
0.00238 0.00100 -0.000659 -0.000680 0.000495 -0.00178
(0.00310) (0.00319) (0.00328) (0.00295) (0.00339) (0.00319) Ports administration as obstacle
0.104 0.0711 -0.00234 0.0868 -0.0164
(0.340) (0.277) (0.319) (0.347) (0.280)
Finance as obstacle
-0.0422 0.0707 -0.0243 -0.0209 0.110
(0.405) (0.312) (0.396) (0.429) (0.327)
NCR (ex- Manila)
-1.380
-1.833
(1.682)
(1.572)
Central Luzon
0.401
0.238
(0.483)
(0.532)
Southern Tagalog
0.467
0.501
(0.281)
(0.287)
Cebu
1.347***
1.035**
(0.272)
(0.302)
Food industry
0.105
-0.333
(0.660)
(0.676)
Textiles and garments
-1.107*
-0.906
(0.539)
(0.586)
Chemicals
-0.365
-0.476
(0.646)
(0.536)
Plastics and rubber
-0.898**
-0.867*
(0.322)
(0.375)
Non-metallic industries
-1.248*
-1.218*
(0.513)
(0.484)
Electronics
-0.447
-0.425
(0.364)
(0.423)
Importable
-0.558
(0.651)
Mixed
-0.469
(0.533)
Non-traded
0.217
(0.616)

51
Constant 3.366** 2.709 3.665* 2.953 5.060** 4.117* 4.187*
(1.202) (1.627) (1.708) (1.753) (1.685) (1.738) (1.793)
N 106 100 91 91 91 88 91
adj. R-sq 0.581 0.575 0.557 0.625 0.589 0.541 0.644 * p<0.05, ** p<0.01, *** p<0.001. Note: Robust standard errors are in parenthesis.
Annex 6. Alternative Heckman specifications
Regressors (1) (2) (3) (4) (5) (6) (7) (8)
Export intensity/ Export value (log)
Firm size (small) -0.738* -0.768** -0.686* -0.677* -0.719* -0.715* -0.709* -0.700*
(0.315) (0.291) (0.317) (0.321) (0.282) (0.281) (0.285) (0.286)
Labour productivity (ln) 0.963*** 1.009*** 0.955*** 0.963*** 1.023*** 1.021*** 1.020*** 1.017***
(0.0964) (0.0909) (0.0994) (0.0991) (0.0917) (0.0917) (0.0926) (0.0926)
NCR (ex- Manila)
-1.333
-1.644* -1.666* -1.635* -1.658*
(0.855)
(0.816) (0.813) (0.817) (0.814)
Central Luzon
0.496
0.641 0.658 0.638 0.660
(0.490)
(0.499) (0.493) (0.498) (0.493)
Southern Tagalog
0.460
0.560 0.558 0.555 0.556
(0.302)
(0.292) (0.291) (0.291) (0.289)
Cebu
1.377***
1.502*** 1.480*** 1.501*** 1.463***
(0.378)
(0.383) (0.392) (0.382) (0.396)
Food industry
-0.836
-1.401** -1.399** -1.357* -1.346*
(0.575)
(0.534) (0.534) (0.549) (0.549)
Textiles and garments
-0.395
-0.214 -0.211 -0.214 -0.218
(0.453)
(0.420) (0.420) (0.419) (0.418)
Chemicals
-0.942
-1.139 -1.139 -1.066 -1.057
(0.640)
(0.581) (0.581) (0.609) (0.605)
Plastics and rubber
-0.974*
-0.875* -0.876* -0.870* -0.877*
(0.387)
(0.364) (0.364) (0.364) (0.365)
Non-metallic industries
-1.160*
-1.098** -1.097** -1.071* -1.068*
(0.468)
(0.422) (0.421) (0.430) (0.429)
Electronics
-0.719
-0.565 -0.570 -0.569 -0.585
(0.416)
(0.414) (0.414) (0.415) (0.419)
Importable
-0.437
(0.859)
Mixed
-0.573
(0.752)
Non-traded
0.195
(1.155)
Constant 4.084** 2.792 4.969** 4.661** 3.185* 3.231* 3.248* 3.325*
(1.524) (1.472) (1.577) (1.677) (1.471) (1.468) (1.478) (1.483)
Export propensity
Firm size (small) -0.297* -0.297* -0.297* -0.280 -0.297* -0.301* -0.332* -0.344*
(0.146) (0.146) (0.146) (0.146) (0.146) (0.146) (0.152) (0.153)
Labour productivity (ln) 0.00970*** 0.00970*** 0.00970*** 0.00920*** 0.00970*** 0.0101*** 0.00871*** 0.00907***
(0.00176) (0.00176) (0.00176) (0.00178) (0.00176) (0.00184) (0.00186) (0.00193)

52
Quality certification 0.469** 0.469** 0.469** 0.487** 0.469** 0.486** 0.496** 0.514**
(0.152) (0.152) (0.152) (0.153) (0.152) (0.154) (0.156) (0.158)
Managerial education 0.203* 0.203* 0.203* 0.200* 0.203* 0.187 0.212* 0.193
(0.0977) (0.0977) (0.0977) (0.0978) (0.0977) (0.0986) (0.101) (0.102)
Overdraft facilities 0.00721 0.00721 0.00721 0.0227 0.00721 0.0171 0.0492 0.0604
(0.167) (0.167) (0.167) (0.168) (0.167) (0.168) (0.170) (0.172)
obs_competition -0.318* -0.318* -0.318* -0.327* -0.318* -0.339* -0.349* -0.368*
(0.142) (0.142) (0.142) (0.143) (0.142) (0.144) (0.145) (0.147)
NCR (ex- Manila)
0.296
0.271
(0.482)
(0.495)
Central Luzon
-0.253
-0.265
(0.271)
(0.280)
Southern Tagalog
-0.0392
-0.0588
(0.176)
(0.180)
Cebu
0.204
0.281
(0.219)
(0.228)
Food industry
-0.418 -0.422
(0.278) (0.284)
Textiles and garments
0.0339 0.102
(0.239) (0.244)
Chemicals
-0.732* -0.691*
(0.300) (0.303)
Plastics and rubber
-0.0641 -0.0209
(0.222) (0.225)
Non-metallic industries
-0.270 -0.249
(0.247) (0.250)
Electronics
-0.0158 0.0687
(0.253) (0.259)
Constant -1.943*** -1.943*** -1.943*** -1.942*** -1.943*** -1.884*** -1.788*** -1.758***
(0.408) (0.408) (0.408) (0.408) (0.408) (0.413) (0.457) (0.462)
Mills
Lambda -0.369 -0.0970 -0.470 -0.421 -0.112 -0.128 -0.140 -0.166
(0.321) (0.320) (0.336) (0.337) (0.313) (0.308) (0.327) (0.323)
N 616 616 616 613 616 616 616 616 * p<0.05, ** p<0.01, *** p<0.001. Note: Heckman two-step maximum likelihood estimation method. Standard errors in parenthesis.

53
Annex 7. Export propensity with regional and industry indices for quality certification and managerial education
Regressors (1) (2) (3) (4) (5) (6) (7) (8) (9) (10) (11) (12) (13) (14)
Firm size (small) -0.773** -0.428** -0.611* -0.347* -0.482 -0.286 -0.699* -0.391** -0.769** -0.429** -0.674* -0.380* -0.768** -0.431**
(0.259) (0.139) (0.266) (0.142) (0.279) (0.152) (0.272) (0.147) (0.276) (0.150) (0.274) (0.148) (0.279) (0.151)
Foreign ownership 0.0171*** 0.0101*** 0.0155*** 0.00918*** 0.0160*** 0.00949*** 0.0178*** 0.0106*** 0.0166*** 0.00989*** 0.0169*** 0.0102*** 0.0162*** 0.00970***
(0.00283) (0.00167) (0.00301) (0.00176) (0.00319) (0.00185) (0.00313) (0.00184) (0.00315) (0.00186) (0.00322) (0.00191) (0.00326) (0.00194)
Labour productivity (ln) 0.0650 0.0381 0.000909 -0.0000603 -0.0304 -0.0165 0.0565 0.0305 0.0892 0.0520 0.0524 0.0300 0.0873 0.0494
(0.0780) (0.0431) (0.0857) (0.0468) (0.0892) (0.0488) (0.0796) (0.0444) (0.0795) (0.0447) (0.0785) (0.0439) (0.0803) (0.0451)
Quality certification
0.438 0.195 0.518 0.209
(0.248) (0.122) (0.286) (0.134)
Managerial education
0.648* 0.383** 0.760** 0.445**
(0.263) (0.149) (0.277) (0.157)
Overdraft facilities
0.0542 0.00343 0.144 0.0618 0.125 0.0559 0.124 0.0550 0.148 0.0689
(0.289) (0.160) (0.289) (0.160) (0.290) (0.161) (0.289) (0.160) (0.290) (0.160)
Competition as an obstacle
-0.648* -0.329* -0.603* -0.330* -0.577* -0.314* -0.598* -0.325* -0.614* -0.336*
(0.277) (0.146) (0.263) (0.141) (0.264) (0.143) (0.264) (0.143) (0.262) (0.141)
Regional index - quality certification
-0.424 -0.313
-1.159 -0.716
(1.153) (0.648)
(1.498) (0.836)
Regional index - managerial education
1.816 0.956
1.726 0.895
(1.574) (0.897)
(1.804) (1.010)
Industry index - quality certification
5.442* 3.073*
5.468 3.071
(2.634) (1.462)
(2.885) (1.608)
Industry index - managerial education
-5.401* -3.077*
-6.180* -3.510*
(2.570) (1.411)
(2.853) (1.577)
Regional-industry index - quality certification
0.474 0.227 0.609 0.358
(0.725) (0.410) (1.179) (0.659)

54
Regional- industry index - managerial education
-0.123 -0.0854 0.276 0.153
(0.620) (0.338) (0.798) (0.443)
Constant -2.540* -1.508* -3.666** -1.902** -3.420* -1.654* -9.359 -5.017 17.22 9.758 -1.837 -1.018 12.53 7.453
(1.060) (0.586) (1.372) (0.702) (1.444) (0.729) (6.290) (3.562) (9.417) (5.160) (2.598) (1.406) (12.05) (6.613)
N 605 605 582 582 530 530 546 546 546 546 546 546 546 546
pseudo R-sq 0.103 0.105 0.123 0.123 0.151 0.150 0.126 0.127 0.132 0.134 0.125 0.126 0.136 0.138
* p<0.05; ** p<0.01; *** p<0.001. Note: Probit regression marginal effects reported. Robust standard errors in parentheses.

55
Annex 8. Export intensity with regional and industry indices for quality
certification and managerial education
Regressors (1) (2) (3) (4) (5)
Firm size (small) -0.871** -0.810* -0.837** -0.776* -0.871**
(0.315) (0.341) (0.314) (0.319) (0.315)
Labour productivity (ln) 0.971*** 0.975*** 0.951*** 0.907*** 0.929***
(0.0855) (0.104) (0.0863) (0.0937) (0.0857)
Age 0.0351 0.0487 0.0471 0.0444 0.0500
(0.0341) (0.0359) (0.0318) (0.0311) (0.0320)
Age squared -0.00104 -0.00124 -0.00124 -0.00128 -0.00124
(0.000737) (0.000754) (0.000643) (0.000655) (0.000673)
Quality certification
-0.234
(0.320)
Managerial education
0.105
(0.239)
Foreign ownership
0.00238 0.00163 0.00244 0.00238
(0.00310) (0.00321) (0.00287) (0.00307)
Regional index - quality certification
0.673
(1.300)
Regional index - managerial education
3.903**
(1.267)
Industry index - quality certification
-4.752
(2.830)
Industry index - managerial education
5.633
(2.842)
Regional-industry index - quality certification
-0.746
(0.783) Regional- industry index - managerial education
1.768**
(0.667)
Constant 3.366** 2.709 -12.39* -16.92 -3.195
(1.202) (1.627) (5.114) (10.13) (2.646)
N 106 100 106 106 106
adj. R-sq 0.581 0.575 0.608 0.587 0.607
* p<0.05; ** p<0.01; *** p<0.001. Note: Robust standard errors reported in parenthesis.

ARTNeT Working Paper Series
is available at www.artnetontrade.org
ARTNeT Secretariat
United Nations
Economic and Social Commission
for Asia and the Pacific
Trade and Investment Division
United Nations Building
Rajadamnern Nok Avenue
Bangkok 10200, Thailand
Tel: +66 (0)2-288-2251
Fax: +66(0)2-288-1027
Email: [email protected]
Website: www.artnetontrade.org