working paper zimbabwe case study on trade negotiations · pdf fileworking paper zimbabwe case...
TRANSCRIPT
Working Paper
ZIMBABWE CASE STUDY ON TRADE NEGOTIATIONS
Richard Hess
October 2001
Overseas Development Institute111 Westminster Bridge Road
London SE1 7JDUK
2
ISBN 0085003 565 1
© Overseas Development Institute 2001
All rights reserved. No part of this publication may be reproduced, stored in a retrievalsystem, or transmitted in any form or by any means, electronic, mechanical, photocopying,recording or otherwise, without the prior permission of the publishers.
3
Contents
Acknowledgements ................................................................................................................... 5
Acronyms .................................................................................................................................. 6
1. Zimbabwe Background ......................................................................................................... 7
1.1 Zimbabwe’s economic structure 7
Agriculture 7
Manufacturing 7
Mining 7
Transport and Communications 8
The Financial Sector 8
Current situation 9
1.2 Trade strategy 11
1.3 Time series trade and investment data 12
Exports 13
Export products 14
Export markets 15
Imports 16
By product 16
By source 17
Investment 18
1.4 Overview of existing trade agreements 21
World Trade Organization 21
ACP/EU Partnership Agreement 22
Common Market for Eastern and Southern Africa 23
Southern African Development Community (SADC) 24
Zimbabwe/South Africa Bilateral Agreement 25
Zimbabwe’ Bilateral Agreements with Botswana, Malawi and Namibia 27
2. Trade Negotiations in the Last 10 Years ............................................................................. 29
2.1 Key issues and interests 29
GATT/WTO 29
Lomé Convention 30
Regional agreements 31
Bilateral agreements 32
2.2. Formation and composition of negotiating team 32
2.3 Consultation and lobbying processes 34
2.4 Negotiation positions and processes 35
4
2.5 Zimbabwe’s actual participation in the negotiations 35
2.6 Outcome of the negotiations 37
3. Lessons Learned .................................................................................................................. 39
References ............................................................................................................................... 41
TablesTable 1: Selected development indicators for Zimbabwe, together with equivalent values forAfrica as a whole and globally. ..................................................................................................9Table 2: Gross capital formation by industry at current prices, US$ Million ..........................19Table 3: Investment summary, US$ Million 1996-1998 .......................................................20Table 4: Zimbabwe’s obligations under different agreements .................................................38
5
Acknowledgements
I am grateful to the Department of International Development, UK, for financing this study.This paper forms part of the Effective Participation by Developing Countries in InternationalGovernance, Institutions and Negotiations study which is in turn part of the Globalisation andPoverty programme, which now includes fourteen projects on the relationship between theglobal economy, and global institutions, and poverty, and on how the developing countriescan influence this. For further information on this project, please contact Sheila Page,[email protected]. For further information on the Globalisation and Poverty Programme,see www.gapresearch.org or email [email protected].
6
Acronyms
COMESA The Common Market for Eastern and Southern AfricaDFID Department for International Development, UKEDF European Development FundESAP Economic Structural Adjustment ProgrammeFTA Free Trade AreaGATT General Agreement on Tariffs and TradeLDCs Less Developed CountriesLMG Like Minded GroupNECF National Economic Consultation ForumNRZ The National Railways of ZimbabwePTA Preferred Trade AreaPTC Post and Telecommunications CorporationSADC Southern Africa Development CommunitySAP Structural Adjustment ProgrammeSEATINI Southern and Eastern Trade and Information InitiativeSPA Special Programme of ActionTERC Trade and Economic Relations CommitteeTRIPS Trade Related Intellectual RightsUNCTAD United Nations Council for Trade and DevelopmentUNDP United Nations Development ProgrammeWTO World Trade OrganisationZIMPREST Zimbabwe Programme for Economic and Structural Transition
7
1. Zimbabwe Background
1.1 Zimbabwe’s economic structure
Zimbabwe has one of the most diversified economic structures within Africa. This diversityimpacts on the extent of issues with which Zimbabwe needs to be concerned in internationaltrade negotiations. In turn this calls for a heavier involvement in such negotiations than wouldbe required by many other less diversified developing economies. While it has the secondstrongest economy after South Africa within southern Africa, it is relatively very small incomparison. Zimbabwe has enjoyed a good reputation by developing country standards;however, recent developments in the economy have undermined that image.
The most important sector within the economy is Agriculture, followed by mining,manufacturing and construction.
Agriculture
The agricultural sector is the most important revenue earner for the country. Althoughagriculture encompasses no more than 15% of GDP, it is responsible for 40% of total exportearnings. It is also the largest employment sector, with 74% of the labour force accrued withinthis sector. As such, it is not difficult to see that the current land redistribution exercise, if itcontinues on its current basis could place the whole economy in jeopardy. The most importantcommodities in terms of revenue generation are tobacco, maize and cotton. AlthoughZimbabwe had to import food commodities during the 1982, 1987 and 1992 droughts, upuntil the current land redistribution exercise it was the largest net food exporter within theregion and was fully able to meet its own food requirements under normal conditions.
Manufacturing
The manufacturing sector is one of the largest and most diversified sub-sectors in sub-Saharan Africa, and has traditionally accounted for roughly a quarter of GDP. Zimbabweanindustry is to a large extent a captive market where small companies produce a modest part ofthe total production. There has been a strong history of market collusion among majorproducers and price setting that has resulted in a business culture unconcerned with efficiencyand competitiveness. This culture has been reinforced by Government and parastatalmonopolies in a number of key sub-sectors. This sector has declined significantly in recentyears, primarily due to the policies adopted by Government regarding macro economic policyand the land issue. This sector has been badly affected by down turn in the economy in recentyears and the major restructuring that is currently taking place in the sector. Many companiesface closure and the pressure on wage increases and price freezes will cause this situation toworsen. The current shortage of foreign currency has affected this sector badly and willcontinue to do so for the foreseeable future.
Mining
The mining sector is a major foreign exchange earner for the country. Over 90% of itsproduction is exported, most of it in crude commodity form. The potential for semi-finished
8
to finished goods production in this sector is enormous. Zimbabwe has relatively rich mineraldeposits. Mining accounts for 45% of the country's foreign earnings yet only 9% of GDP.Gold and nickel have accounted for over half the value of mining output in the last ten years.Zimbabwe is the largest producer of gold in Africa after South Africa and Ghana. Other majorminerals are asbestos, coal, copper, chrome, iron, tin, silver, phosphate, limestone, cobalt,lithium and platinum. The lowering of mineral prices in world markets and the down turn inthe Zimbabwean economy, combined with the foreign exchange shortage and the fixedexchange rate, have adversely affected the sector. All companies in this sector arerestructuring and attempting to reduce costs in order to survive the changes, some will faceclosure and this will have a major effect on the economy overall.
Transport and Communications
The transport and communications sector is one of the fastest growing sectors in theZimbabwean economy. Telecommunication services, provided by the state-owned Post andTelecommunications Corporation (PTC), remain notoriously bad. This remains a seriousobstacle to investment and expansion. However with the advent of the cellular telephonenetworks this has been partly resolved. Nevertheless, the services provided are sometimesunreliable due to poor reception, maintenance and theft.
The transport infrastructure is good by regional standards, with good roads servicing all majorcities and towns within the country. Zimbabwe has an excellent road network of over 17,000kilometres of surfaced roads and 19,000 kilometres of un-surfaced roads. However, becauseof excessive spending in the recurrent budget, at the expense of capital investment, the roadnetwork is in danger of serious deterioration. The National Railways of Zimbabwe (NRZ)once operated one of the most efficient rail systems in sub-Saharan Africa; however in recentyears this has declined significantly and this is causing problems with importation of rawmaterials and with general transportation in the country. Air transport is carried out by AirZimbabwe, the national airline, and a number of freight airlines, providing regularlyscheduled links to major regional centres, as well as providing an air transport system withinthe country. The efficiency of the air transport system has deteriorated significantly over thepast two years with a number of major carriers refusing to come to Zimbabwe because offears over the standards of safety and problems with the supply of fuel, as well as lack ofdemand.
The Financial Sector
In terms of market share of the financial sector, commercial banks are the strongest players inthe financial sector (43.8%), followed by building societies (21.5%), whilst finance houseshave the smallest market share (6.2%). There has been considerable reform in the financialsector in recent years, which has resulted in increased market competition as differentinstitutions can now enter markets that were previously barred to them due to regulations.However, the sector has been subject to a number of problems starting in 1998 with thecollapse of one merchant bank and the ongoing fall out resulting. Combined with thechanging economic situation and the sector’s vulnerability to farmers as a result of theuncertainty over the land reform programme this sector is increasingly likely to facehardships.
9
Current situation
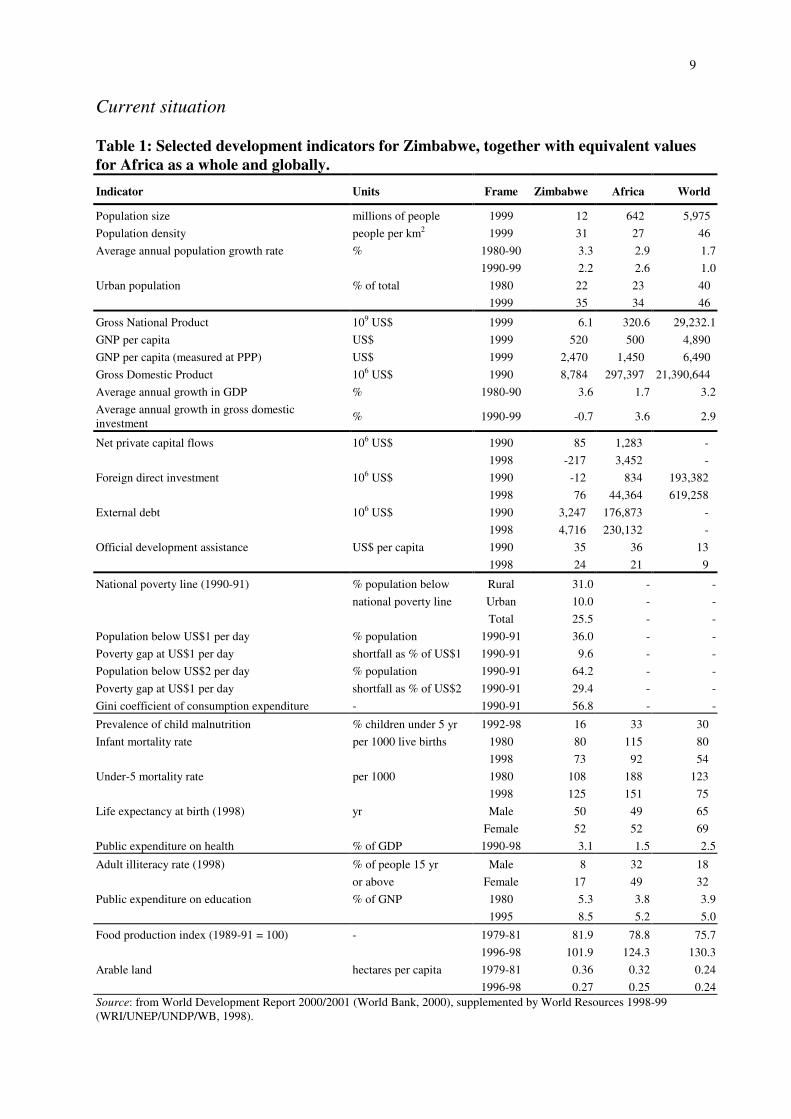
Table 1: Selected development indicators for Zimbabwe, together with equivalent valuesfor Africa as a whole and globally.
Indicator Units Frame Zimbabwe Africa World
Population size millions of people 1999 12 642 5,975
Population density people per km2 1999 31 27 46
Average annual population growth rate % 1980-90 3.3 2.9 1.7
1990-99 2.2 2.6 1.0
Urban population % of total 1980 22 23 40
1999 35 34 46
Gross National Product 109 US$ 1999 6.1 320.6 29,232.1
GNP per capita US$ 1999 520 500 4,890
GNP per capita (measured at PPP) US$ 1999 2,470 1,450 6,490
Gross Domestic Product 106 US$ 1990 8,784 297,397 21,390,644
Average annual growth in GDP % 1980-90 3.6 1.7 3.2
Average annual growth in gross domesticinvestment
% 1990-99 -0.7 3.6 2.9
Net private capital flows 106 US$ 1990 85 1,283 -
1998 -217 3,452 -
Foreign direct investment 106 US$ 1990 -12 834 193,382
1998 76 44,364 619,258
External debt 106 US$ 1990 3,247 176,873 -
1998 4,716 230,132 -
Official development assistance US$ per capita 1990 35 36 13
1998 24 21 9
National poverty line (1990-91) % population below Rural 31.0 - -
national poverty line Urban 10.0 - -
Total 25.5 - -
Population below US$1 per day % population 1990-91 36.0 - -
Poverty gap at US$1 per day shortfall as % of US$1 1990-91 9.6 - -
Population below US$2 per day % population 1990-91 64.2 - -
Poverty gap at US$1 per day shortfall as % of US$2 1990-91 29.4 - -
Gini coefficient of consumption expenditure - 1990-91 56.8 - -
Prevalence of child malnutrition % children under 5 yr 1992-98 16 33 30
Infant mortality rate per 1000 live births 1980 80 115 80
1998 73 92 54
Under-5 mortality rate per 1000 1980 108 188 123
1998 125 151 75
Life expectancy at birth (1998) yr Male 50 49 65
Female 52 52 69
Public expenditure on health % of GDP 1990-98 3.1 1.5 2.5
Adult illiteracy rate (1998) % of people 15 yr Male 8 32 18
or above Female 17 49 32
Public expenditure on education % of GNP 1980 5.3 3.8 3.9
1995 8.5 5.2 5.0
Food production index (1989-91 = 100) - 1979-81 81.9 78.8 75.7
1996-98 101.9 124.3 130.3
Arable land hectares per capita 1979-81 0.36 0.32 0.24
1996-98 0.27 0.25 0.24Source: from World Development Report 2000/2001 (World Bank, 2000), supplemented by World Resources 1998-99(WRI/UNEP/UNDP/WB, 1998).
10
The structural adjustment programmes loosely implemented throughout the 1990s followedthe policies of the ‘Washington Consensus’ of trade and structural liberalisation. Althoughsubstantial reforms did occur, such as the implementation of a market determined exchangerate, the programmes were not hailed as a success, and of late much of the successfulliberalisation completed is being undone by the re-imposition of state controls. In particularthe overvalued and pegged Zimbabwe dollar has led to severe foreign currency shortages. Thegovernment’s continuous borrowing from the banking sector has spearheaded inflation andinterest rates to an unprecedented level. The persistent budget deficits have the effects ofreducing investment, interfering with the functioning of the domestic markets and increasingthe country’s debt burden. Previous efforts on the part of the government to reduce its deficitwere not adequate and were often delayed by red tape and unbudgeted expenditure.
In February 2000, the government unveiled the Millennium Economy Recovery Plan. Thiswas in response to the challenges of high inflation, a large balance of payments deficit, lowexport growth, high government expenditure and the land reform issue. The major objectiveof the Plan was to remove the fundamental causes of inflation and to restore macro-economicstability in order to create an economic environment conducive to low interest rates,sustainable investment, stable real incomes and poverty alleviation. Implementation of theplan has not taken place, as yet, and it is not likely to have any meaningful effect on the slideof the Zimbabwean economy in the short term future.
The recent 2001 budget proposed the introduction of some significant reforms, includingmore stringent controls on expenditure and greater revenue collection. It is hoped to reducethe 2000 budget deficit of 23% of GDP to 15.5% of GDP. Consumer inflation is projected at70% for 2001. The Government estimates that the economy declined 4.2% in 2000 and willdecline by 2.8% in 2001. However, other estimates of the 2000 decline are in the region of 5to 6 percent, or 10% over the two years 2000/01. Employment was estimated to havedecreased by 100,000 jobs in 2000. Interest rates are expected to rise above 70% in the firstquarter of 2001, however, the government is taking action to artificially curtail the rate ofinterest. The balance-of-payments deficit for 2000 is estimated at US$ 600 million (10.5% ofGDP). Although the Ministry of Finance has stressed that there will be no immediatedevaluation of the Zimbabwean dollar, the deteriorating balance-of-payments situationcombined with the persistent real exchange rate appreciation anticipates accelerated currencydepreciation. By November 2000, four months after the devaluation of the Zimbabwe dollar,the real exchange rate appreciated by 15%, effectively nullifying the 10% export incentiveincluded in the budget. Domestic debt is estimated to have averaged $107 billion over theyear 2000 at a cost of $52 billion or 48.6%. The debt is expected to escalate to $220 billion atthe end of 2001, or 41% of GDP.
Without major changes to the macro economic situation in the country a worsening situationwill continue. This will be exacerbated by the continued fuel and foreign exchange shortages.The critical shortages of fuel supply to the nation and the continuous rise in all commodityprices have increased costs at all levels in the economy and have reduced productivity - due tothe constant need to queue, lowering the standard of living of most levels of the populationand eroding the disposable income of the consumers. This has brought pressure for wageincreases, which only further fuel inflation.
11
1.2 Trade strategy
Zimbabwe embarked on a new trade strategy from 1990 as a result of adopting an EconomicStructural Adjustment Policy (ESAP). The ESAP had three core objectives and pillars:macroeconomic policy reform, trade liberalisation and deregulation. According to this neweconomic direction, trade liberalisation was intended as an instrument for creating a high andsustainable level of export growth and opening the economy to external competition, thusboth earning the country foreign exchange and increasing productivity, along with economicgrowth and employment and consequently resulting in poverty reduction. A point worthnoting nevertheless is that at the time of adoption and subsequent implementation of thestructural adjustment policies, the government did not demonstrate any deliberateunderstanding of or intention to use the interrelationship between the wider economicdevelopmental strategy and the specific role of trade in achieving that goal. In other words,while trade liberalisation was made one of the major objectives of reform, and wasunderstood as important and instrumental to the achievement of the overall goal, this strategywas limited to the generation of export earnings to finance the programme. The strategy didnot target any specific trade policy direction, e.g. specific trade negotiations for externalmarket access for Zimbabwe’s exports, or a strategy to diversify Zimbabwe’s markets throughnegotiating new trade agreements. Neither was there any incentive programme for thecountry’s exporters, nor any defined regional or international trade strategy.
ESAP was a five-year programme. Following the end of its life-span in 1995/6, Governmentintroduced a successor structural adjustment programme called ZIMPREST- the ZimbabweProgramme for Economic and Structural Transformation. In general the objectives of the newprogramme were similar to those under the first SAP, namely the promotion of high andsustainable economic growth and development, and consequently increased employmentcreation and reduced poverty levels. This time round there was a better appreciation of thepotential contribution by trade, particularly in light of globalisation and trade liberalisationprocesses which had already manifested themselves in the emergence of the WTO-ledmultilateral trading system and increasing regionalism around the globe. Nevertheless, therewas a similarity between the two programmes in that there was no detailed and direct co-relation made between the pursuit of specific trade policy instruments and the achievement ofthe programmes’ objectives or goals.
The ZIMPREST document confirms that the ESAP-led trade liberalisation was basicallydirected at:
• “Personal foreign currency banking accounts, …• Corporate foreign currency banking accounts, …• Licensing of foreign exchange bureaux;• Unification of official and interbank market exchange rates”
In other words, while ESAP considered that “trade liberalisation would constitute thecornerstone of the strategy for liberalizing the economy and forging mature relationships withour trading partners”, the eventual scope of this activity did not go beyond the domesticexchange market liberalisation. Under ZIMPREST, “outward orientation” was stated as oneof the guiding economic principles of this new reform programme: “For a country with a
12
small domestic market, rapid growth requires outward-looking trade and investmentpolicies”! In the operative part concerning specific policies and programmes to beimplemented this “outward orientation” is however limited to regional trading arrangementsand achieving “ low and uniform tariffs with the rest of the world”.
The linkage between national economic development and international trade (whetherregional or global) is more explicitly recognized in some policy frameworks adopted byGovernment, in particular in the “Policy Framework for Industrial Development, Trade andInvestment in Zimbabwe” adopted in 1999. Nonetheless, this recognition is principallydirected at SADC, the ACP/EU relationship, tariff regime reform and export performance. Ofsignificance is the fact that Government adopted both the ZIMPREST and the PolicyFramework for Industrial Development in the midst of the WTO-led global tradeliberalisation phenomenon, but neither the challenges of these developments nor the possibleobjectives or strategies by the country are mentioned in these policy documents.
Perhaps the simplest indication of the lack of direct strategy that government has adopted toensure that trade is a recognized and defined factor in the achievement of the wider economicgoal of growth, development and poverty eradication is the absence of a formulated ordocumented Trade Policy. During the implementation of ESAP, let alone at its introductionor negotiation, this issue did not arise. ZIMPREST was also ushered in without this factorhaving been defined. It was in 1996 that initial steps were taken to craft a national tradepolicy framework and this process led into further attempts by the National EconomicConsultative Forum (NECF) to produce a document. Regrettably these efforts have still toresult in the desired product.
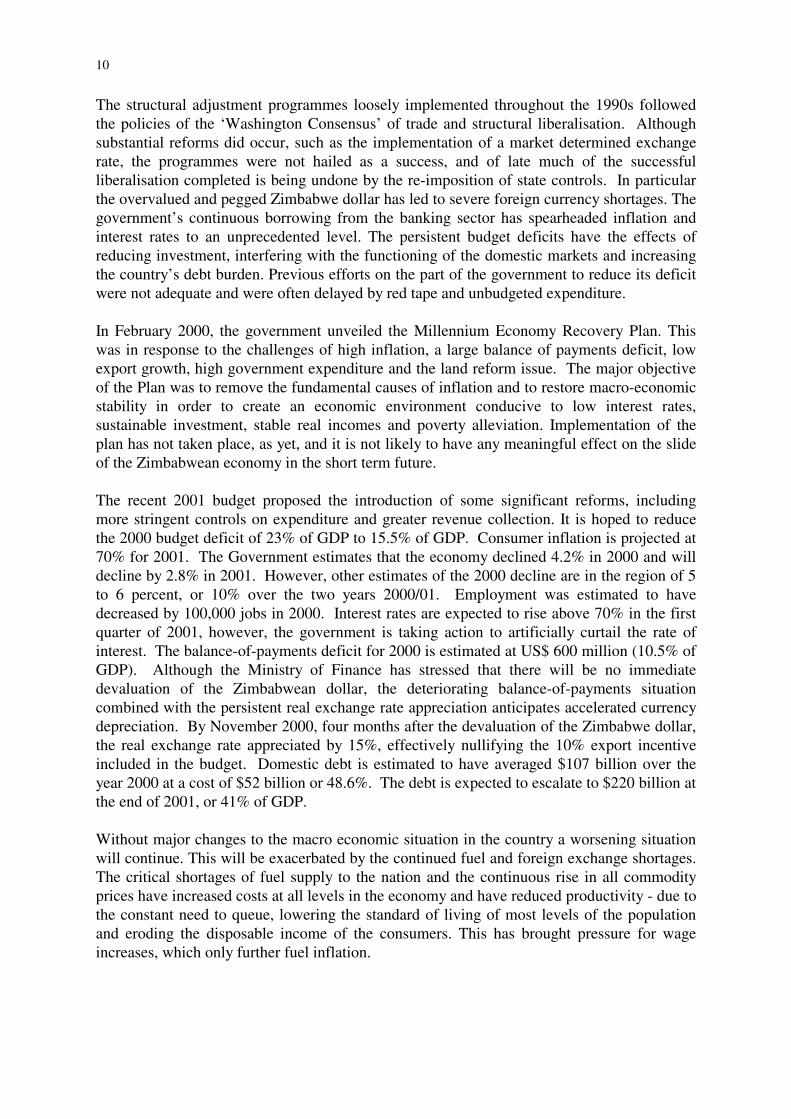
1.3 Time series trade and investment data
During the decade of the 1990s, exports increased in nominal terms by US$ 386 million, or28.1%. Imports have increased similarly by 27.6% over this period. However, this has notbeen a steady increase, as the graph below illustrates:
Exports and Imports US$
0500000
10000001500000200000025000003000000
1990
1992
1994
1996
1998
Year
US$
'000
s
Exports
Imports
13
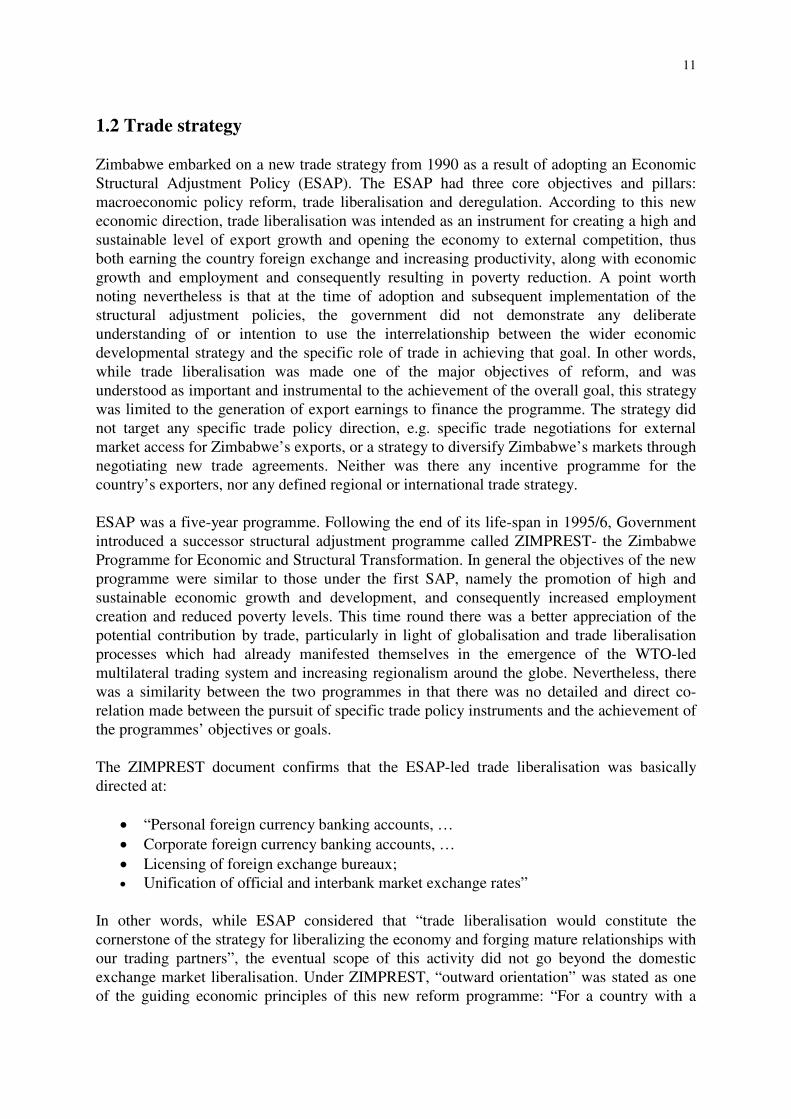
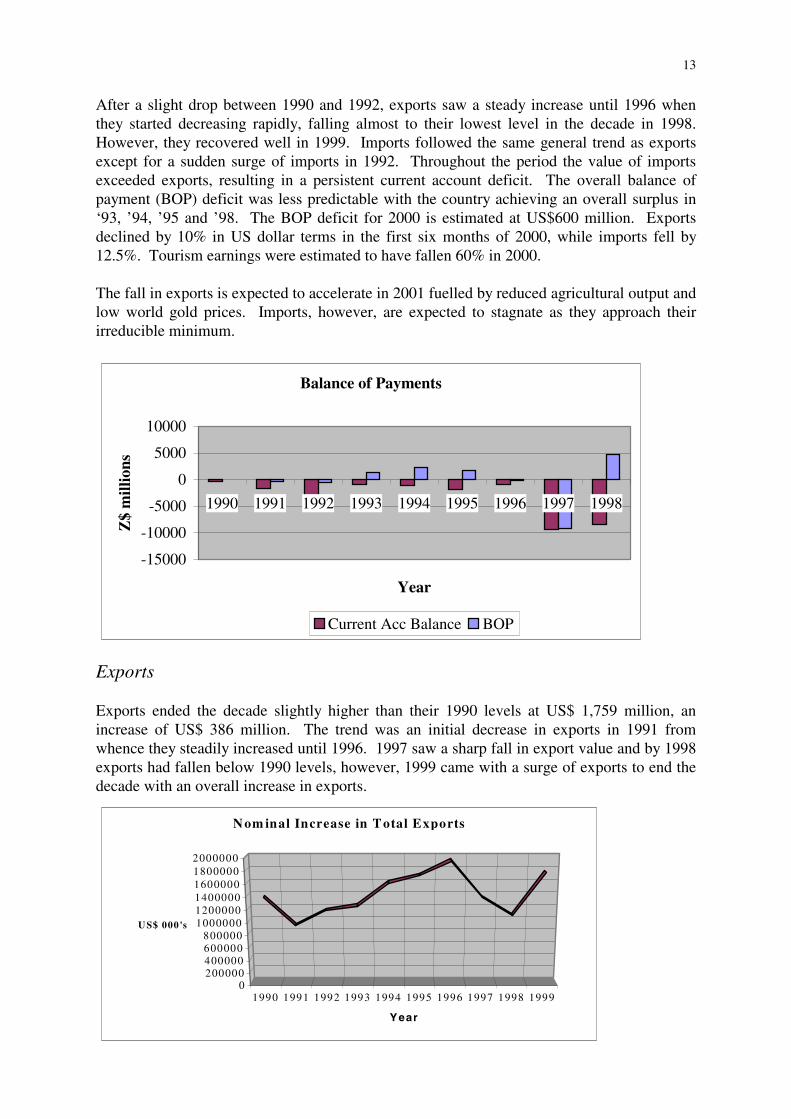
After a slight drop between 1990 and 1992, exports saw a steady increase until 1996 whenthey started decreasing rapidly, falling almost to their lowest level in the decade in 1998.However, they recovered well in 1999. Imports followed the same general trend as exportsexcept for a sudden surge of imports in 1992. Throughout the period the value of importsexceeded exports, resulting in a persistent current account deficit. The overall balance ofpayment (BOP) deficit was less predictable with the country achieving an overall surplus in‘93, ’94, ’95 and ’98. The BOP deficit for 2000 is estimated at US$600 million. Exportsdeclined by 10% in US dollar terms in the first six months of 2000, while imports fell by12.5%. Tourism earnings were estimated to have fallen 60% in 2000.
The fall in exports is expected to accelerate in 2001 fuelled by reduced agricultural output andlow world gold prices. Imports, however, are expected to stagnate as they approach theirirreducible minimum.
Balance of Payments
-15000
-10000
-5000
0
5000
10000
1990 1991 1992 1993 1994 1995 1996 1997 1998
Year
Z$
mill
ions
Current Acc Balance BOP
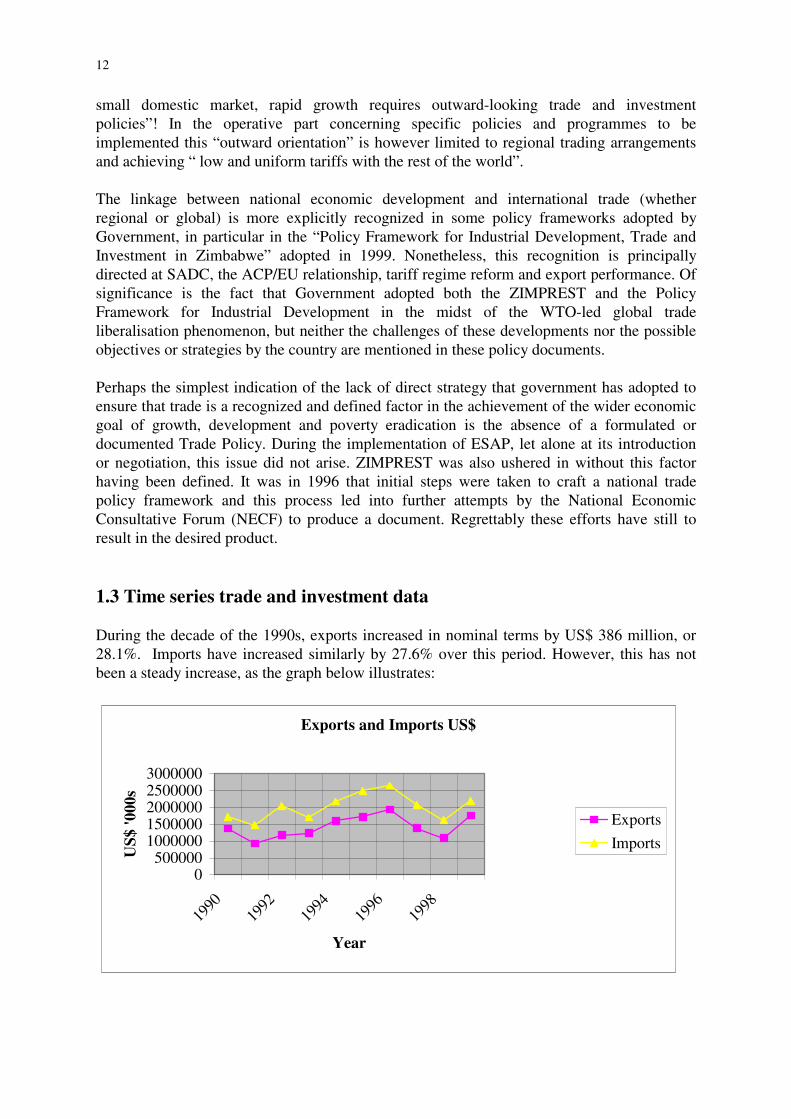
Exports
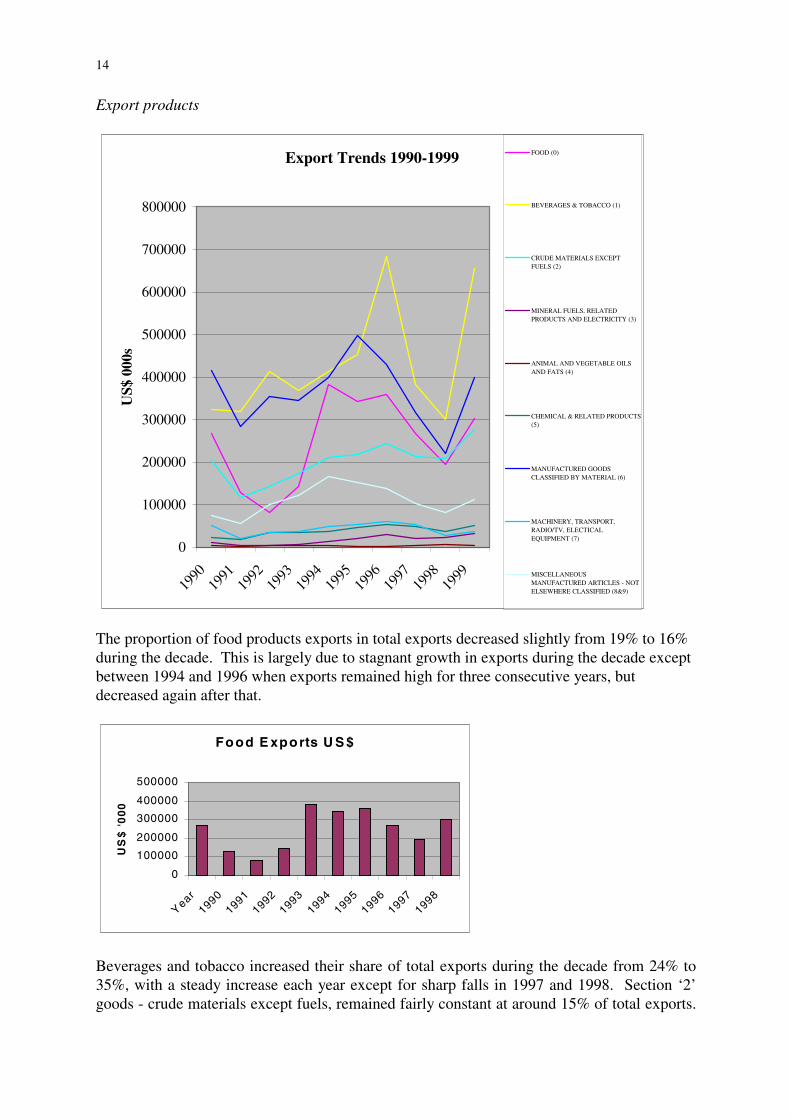
Exports ended the decade slightly higher than their 1990 levels at US$ 1,759 million, anincrease of US$ 386 million. The trend was an initial decrease in exports in 1991 fromwhence they steadily increased until 1996. 1997 saw a sharp fall in export value and by 1998exports had fallen below 1990 levels, however, 1999 came with a surge of exports to end thedecade with an overall increase in exports.
1990 1991 1992 1993 1994 1995 1996 1997 1998 19990
200000400000600000800000
100000012000001400000160000018000002000000
U S$ 000's
Year
N om inal Increase in T otal Exports
14
Export products
Export Trends 1990-1999
0
100000
200000
300000
400000
500000
600000
700000
800000
1990
1991
1992
1993
1994
1995
1996
1997
1998
1999
US$
000
s
FOOD (0)
BEVERAGES & TOBACCO (1)
CRUDE MATERIALS EXCEPTFUELS (2)
MINERAL FUELS, RELATEDPRODUCTS AND ELECTRICITY (3)
ANIMAL AND VEGETABLE OILSAND FATS (4)
CHEMICAL & RELATED PRODUCTS(5)
MANUFACTURED GOODSCLASSIFIED BY MATERIAL (6)
MACHINERY, TRANSPORT,RADIO/TV, ELECTICALEQUIPMENT (7)
MISCELLANEOUSMANUFACTURED ARTICLES - NOTELSEWHERE CLASSIFIED (8&9)
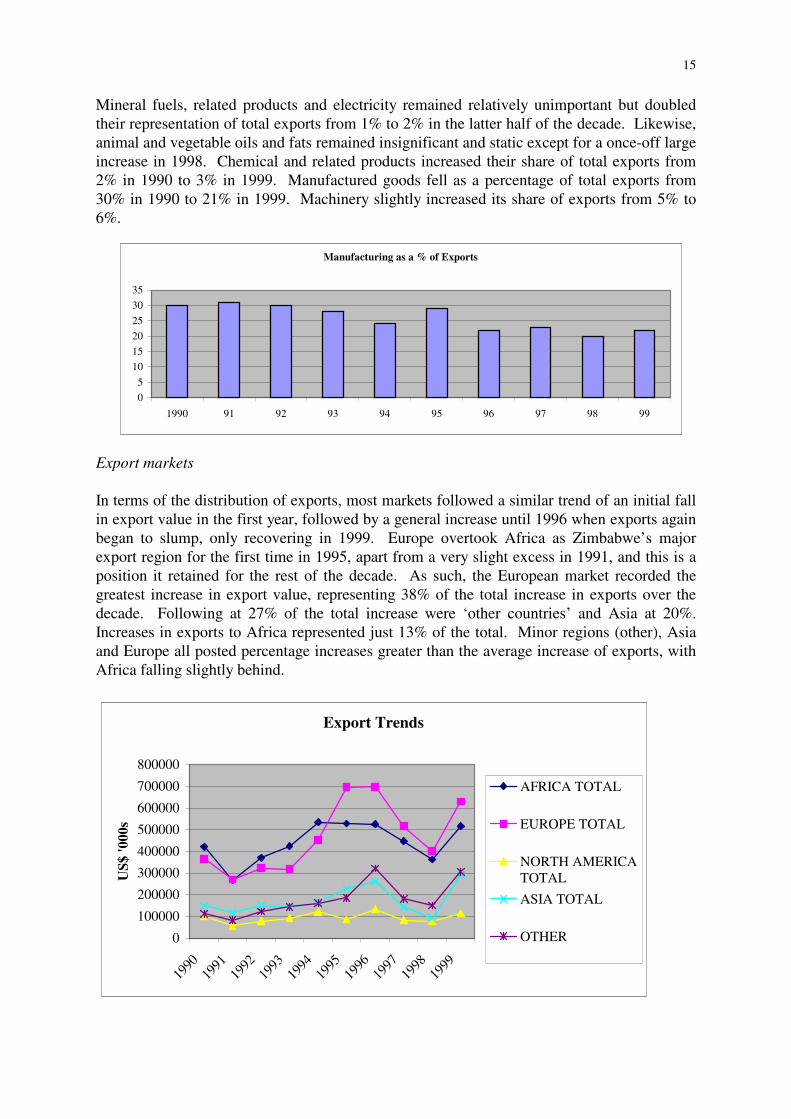
The proportion of food products exports in total exports decreased slightly from 19% to 16%during the decade. This is largely due to stagnant growth in exports during the decade exceptbetween 1994 and 1996 when exports remained high for three consecutive years, butdecreased again after that.
Food E xports U S $
0
100000
200000
300000
400000
500000
Year
19901991
19921993
19941995
19961997
1998
US
$ '
00
0
Beverages and tobacco increased their share of total exports during the decade from 24% to35%, with a steady increase each year except for sharp falls in 1997 and 1998. Section ‘2’goods - crude materials except fuels, remained fairly constant at around 15% of total exports.
15
Mineral fuels, related products and electricity remained relatively unimportant but doubledtheir representation of total exports from 1% to 2% in the latter half of the decade. Likewise,animal and vegetable oils and fats remained insignificant and static except for a once-off largeincrease in 1998. Chemical and related products increased their share of total exports from2% in 1990 to 3% in 1999. Manufactured goods fell as a percentage of total exports from30% in 1990 to 21% in 1999. Machinery slightly increased its share of exports from 5% to6%.
Export markets
In terms of the distribution of exports, most markets followed a similar trend of an initial fallin export value in the first year, followed by a general increase until 1996 when exports againbegan to slump, only recovering in 1999. Europe overtook Africa as Zimbabwe’s majorexport region for the first time in 1995, apart from a very slight excess in 1991, and this is aposition it retained for the rest of the decade. As such, the European market recorded thegreatest increase in export value, representing 38% of the total increase in exports over thedecade. Following at 27% of the total increase were ‘other countries’ and Asia at 20%.Increases in exports to Africa represented just 13% of the total. Minor regions (other), Asiaand Europe all posted percentage increases greater than the average increase of exports, withAfrica falling slightly behind.
Export Trends
0
100000
200000
300000
400000
500000
600000
700000
800000
1990
1991
1992
1993
1994
1995
1996
1997
1998
1999
US$
'000
s
AFRICA TOTAL
EUROPE TOTAL
NORTH AMERICATOTAL
ASIA TOTAL
OTHER
Manufacturing as a % of Exports
0
5
10
15
20
25
30
35
1990 91 92 93 94 95 96 97 98 99
16
% of Total Increase in Exports
13%
38%
2%
20%
27%
Africa
Europe
NorthAmerica
Asia
Other
Imports
By product
Imports by SITC
0
200000
400000
600000
800000
1000000
1200000
1990
1991
1992
1993
1994
1995
1996
1997
1998
1999
US$
'000
s
FOOD (0)
BEVERAGES & TOBACCO (1)
CRUDE MATERIALS EXCEPTFUELS (2)
MINERAL FUELS, RELATEDPRODUCTS ANDELECTRICITY (3)
ANIMAL AND VEGETABLEOILS AND FATS (4)
CHEMICAL & RELATEDPRODUCTS (5)
MANUFACTURED GOODSCLASSIFIED BY MATERIAL (6)
MACHINERY, TRANSPORT,RADIO/TV, ELECTICALEQUIPMENT (7)
MISCELLANEOUSMANUFACTURED ARTICLES -NOT ELSEWHERECLASSIFIED (8&9)
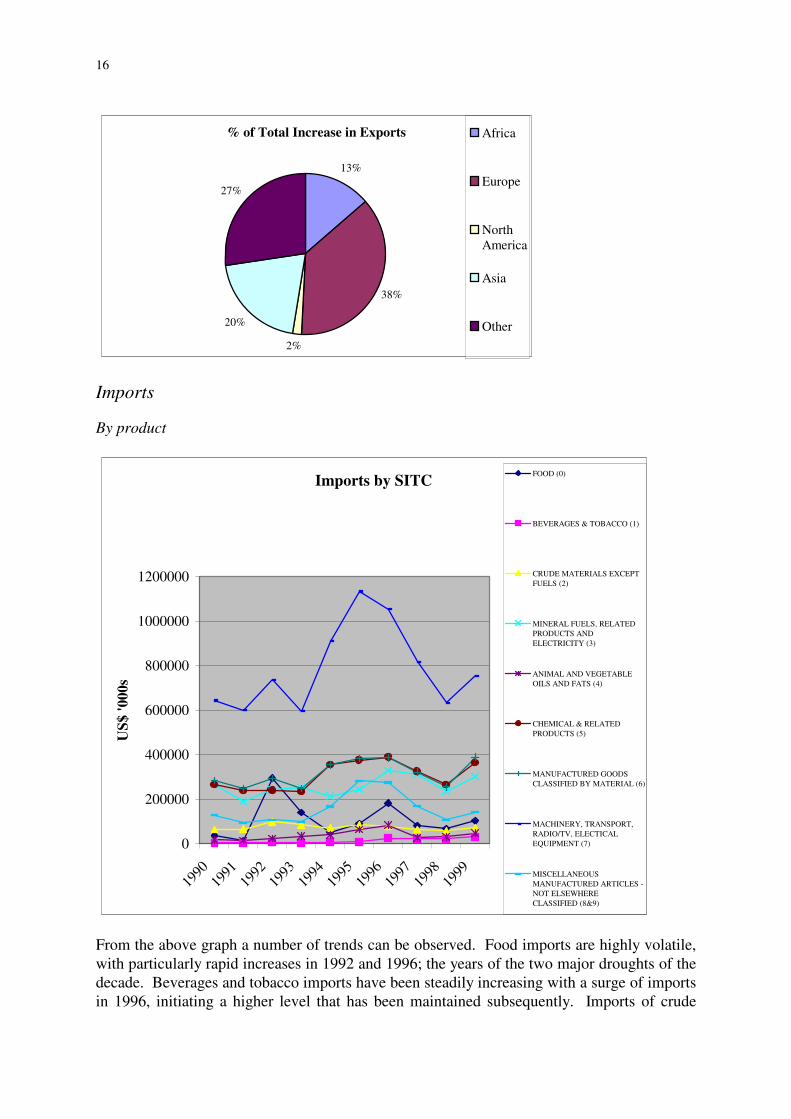
From the above graph a number of trends can be observed. Food imports are highly volatile,with particularly rapid increases in 1992 and 1996; the years of the two major droughts of thedecade. Beverages and tobacco imports have been steadily increasing with a surge of importsin 1996, initiating a higher level that has been maintained subsequently. Imports of crude
17
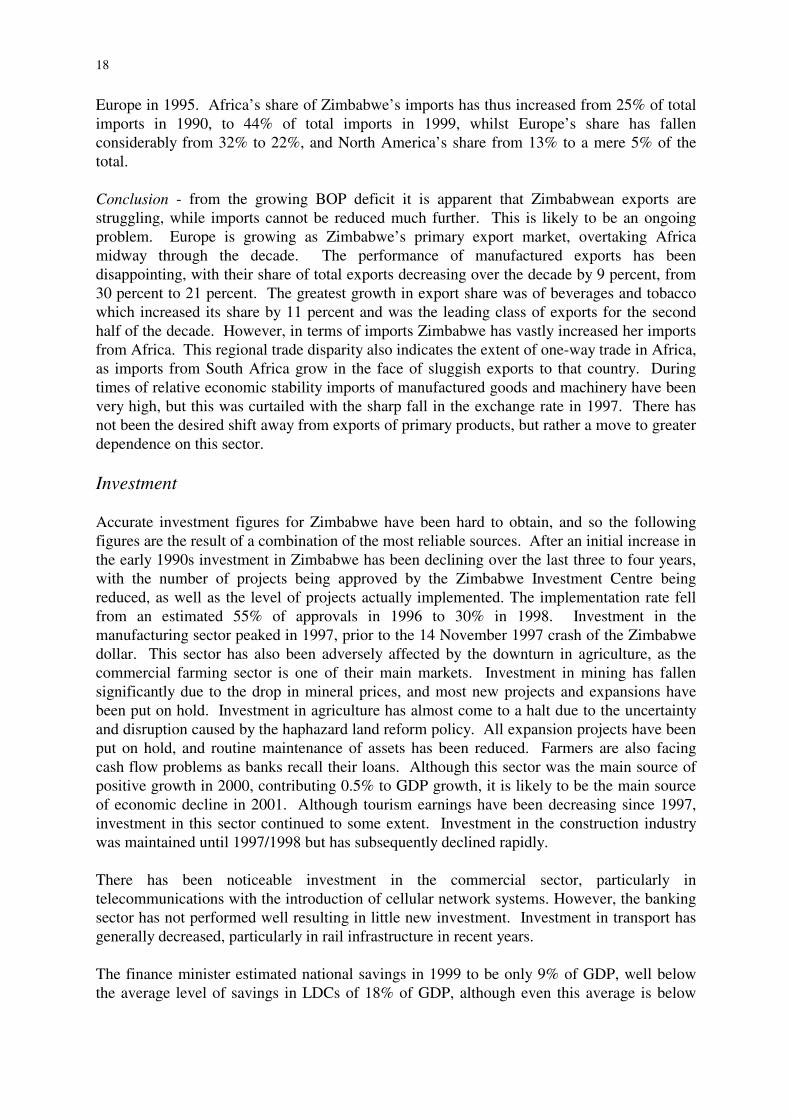
materials have remained fairly constant, as have mineral fuels, related products andelectricity. Imports of animal and vegetable oils and fats increased from 1991 to a peak in1996 but fell sharply in 1997 only rising again in 1999. Imports of chemical and relatedproducts remained fairly constant between 1990 and 1993 but recorded significant levels ofgrowth in 1994-1996 as well as in 1999. Imports of manufactured goods followed a verysimilar trend to that of chemical products, with the result that their trend lines are almostidentical, with the exception of slightly greater growth in 1992 and 1999 of manufacturedgoods. Imports of machinery, transport, radio/TV and electrical equipment shot up to a peakin 1995 and have subsequently fallen each year since except 1999. Likewise, miscellaneousmanufactured articles peaked in 1995 and stayed at a similar level for 1996 but after that fellto almost pre-1995 levels. Overall, imports have increased over the decade, with particularlylarge increases in 1995 and 1996. This reflected the liberalisation of the current account.
By source
Import Trends 1990-1999
0
200000
400000
600000
800000
1000000
1200000
1990 1991 1992 1993 1994 1995 1996 1997 1998 1999
US$
'000
s
AFRICA TOTAL
EUROPE TOTAL
ASIA TOTAL
NORTH AMERICA TOTAL
OTHER
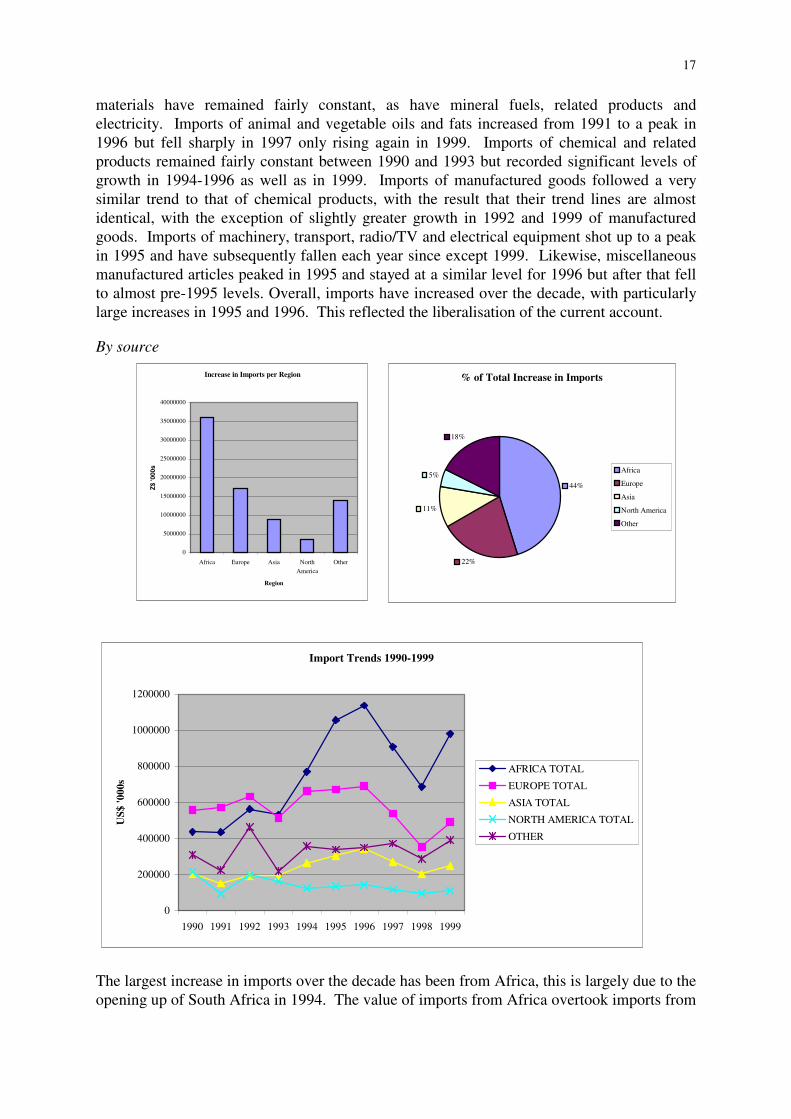
The largest increase in imports over the decade has been from Africa, this is largely due to theopening up of South Africa in 1994. The value of imports from Africa overtook imports from
Increase in Imports per Region
0
5000000
10000000
15000000
20000000
25000000
30000000
35000000
40000000
Africa Europe Asia North
America
Other
Region
Z$
'000
s
% of Total Increase in Imports
44%
22%
11%
5%
18%
Africa
Europe
Asia
North America
Other
18
Europe in 1995. Africa’s share of Zimbabwe’s imports has thus increased from 25% of totalimports in 1990, to 44% of total imports in 1999, whilst Europe’s share has fallenconsiderably from 32% to 22%, and North America’s share from 13% to a mere 5% of thetotal.
Conclusion - from the growing BOP deficit it is apparent that Zimbabwean exports arestruggling, while imports cannot be reduced much further. This is likely to be an ongoingproblem. Europe is growing as Zimbabwe’s primary export market, overtaking Africamidway through the decade. The performance of manufactured exports has beendisappointing, with their share of total exports decreasing over the decade by 9 percent, from30 percent to 21 percent. The greatest growth in export share was of beverages and tobaccowhich increased its share by 11 percent and was the leading class of exports for the secondhalf of the decade. However, in terms of imports Zimbabwe has vastly increased her importsfrom Africa. This regional trade disparity also indicates the extent of one-way trade in Africa,as imports from South Africa grow in the face of sluggish exports to that country. Duringtimes of relative economic stability imports of manufactured goods and machinery have beenvery high, but this was curtailed with the sharp fall in the exchange rate in 1997. There hasnot been the desired shift away from exports of primary products, but rather a move to greaterdependence on this sector.
Investment
Accurate investment figures for Zimbabwe have been hard to obtain, and so the followingfigures are the result of a combination of the most reliable sources. After an initial increase inthe early 1990s investment in Zimbabwe has been declining over the last three to four years,with the number of projects being approved by the Zimbabwe Investment Centre beingreduced, as well as the level of projects actually implemented. The implementation rate fellfrom an estimated 55% of approvals in 1996 to 30% in 1998. Investment in themanufacturing sector peaked in 1997, prior to the 14 November 1997 crash of the Zimbabwedollar. This sector has also been adversely affected by the downturn in agriculture, as thecommercial farming sector is one of their main markets. Investment in mining has fallensignificantly due to the drop in mineral prices, and most new projects and expansions havebeen put on hold. Investment in agriculture has almost come to a halt due to the uncertaintyand disruption caused by the haphazard land reform policy. All expansion projects have beenput on hold, and routine maintenance of assets has been reduced. Farmers are also facingcash flow problems as banks recall their loans. Although this sector was the main source ofpositive growth in 2000, contributing 0.5% to GDP growth, it is likely to be the main sourceof economic decline in 2001. Although tourism earnings have been decreasing since 1997,investment in this sector continued to some extent. Investment in the construction industrywas maintained until 1997/1998 but has subsequently declined rapidly.
There has been noticeable investment in the commercial sector, particularly intelecommunications with the introduction of cellular network systems. However, the bankingsector has not performed well resulting in little new investment. Investment in transport hasgenerally decreased, particularly in rail infrastructure in recent years.
The finance minister estimated national savings in 1999 to be only 9% of GDP, well belowthe average level of savings in LDCs of 18% of GDP, although even this average is below
19
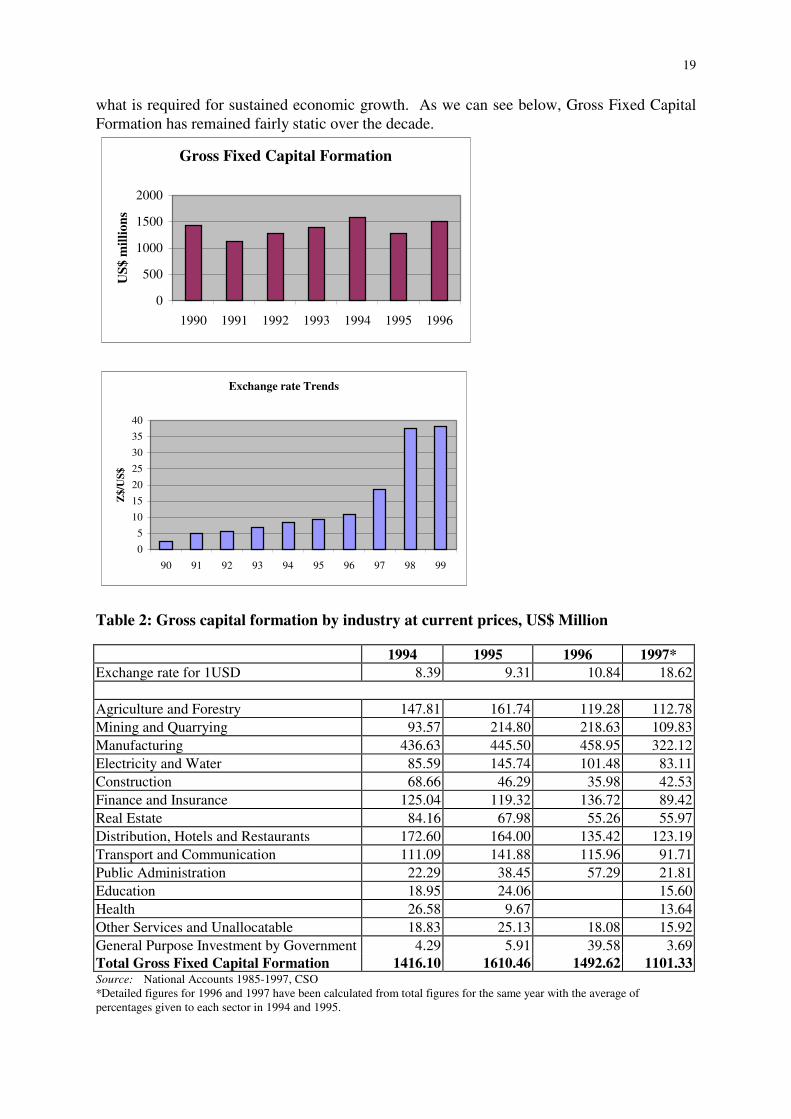
what is required for sustained economic growth. As we can see below, Gross Fixed CapitalFormation has remained fairly static over the decade.
Gross Fixed Capital Formation
0
500
1000
1500
2000
1990 1991 1992 1993 1994 1995 1996
US$
mill
ions
Exchange rate Trends
0
5
10
15
20
25
30
35
40
90 91 92 93 94 95 96 97 98 99
Z$/
US$
Table 2: Gross capital formation by industry at current prices, US$ Million
1994 1995 1996 1997*Exchange rate for 1USD 8.39 9.31 10.84 18.62
Agriculture and Forestry 147.81 161.74 119.28 112.78Mining and Quarrying 93.57 214.80 218.63 109.83Manufacturing 436.63 445.50 458.95 322.12Electricity and Water 85.59 145.74 101.48 83.11Construction 68.66 46.29 35.98 42.53Finance and Insurance 125.04 119.32 136.72 89.42Real Estate 84.16 67.98 55.26 55.97Distribution, Hotels and Restaurants 172.60 164.00 135.42 123.19Transport and Communication 111.09 141.88 115.96 91.71Public Administration 22.29 38.45 57.29 21.81Education 18.95 24.06 15.60Health 26.58 9.67 13.64Other Services and Unallocatable 18.83 25.13 18.08 15.92General Purpose Investment by Government 4.29 5.91 39.58 3.69Total Gross Fixed Capital Formation 1416.10 1610.46 1492.62 1101.33Source: National Accounts 1985-1997, CSO*Detailed figures for 1996 and 1997 have been calculated from total figures for the same year with the average ofpercentages given to each sector in 1994 and 1995.

20
Table 3: Investment summary, US$ Million 1996-1998
Foreign Asset / company based investment1996 1997 1998
Investment approvedManufacturing 68.3 126.2 154.9
Mining 324.7 47.4 113.7
Agriculture 62.5 5.7 1.9Tourism 243.5 27.3 83.5
Construction 87.5 115.1 293.6
Commercial 92.9 112.0 932.4
Transport 4.3 2.7 31.3
Other
883.7 436.4 1,611.2Actual investment to dateManufacturing 37.6 63.1 38.7
Mining 178.6 23.7 34.1
Agriculture 34.4 2.9 0.6
Tourism 133.9 13.6 25.1
Construction 48.1 57.5 58.7
Commercial 51.1 56.0 93.2
Transport 2.4 1.4 9.4
Other
486.0 218.2 259.8Portfolio InvestmentShares Purchased 92.2 255.2 54.9
Shares Sold 92.8 76.0 46.0
(0.5) 179.1 9.0
Total net investment 485.5 397.3 268.7
Local EPZ1996 1997 1998
Investment approvedManufacturing 42.5 42.2 29.2
Mining - 5.1 -
Agriculture 17.6 13.0 41.2
Tourism
Construction - - 161.8
Commercial
Transport
Other 0.2 8.3 4.5
60.3 68.7 236.7Actual investment to dateManufacturing 6.8 21.0 -
Mining - - -
Agriculture 3.7 2.7 1.6
Tourism
Construction - - -
Commercial
Transport
Other - 8.3 1.3
10.6 32.0 2.9
21
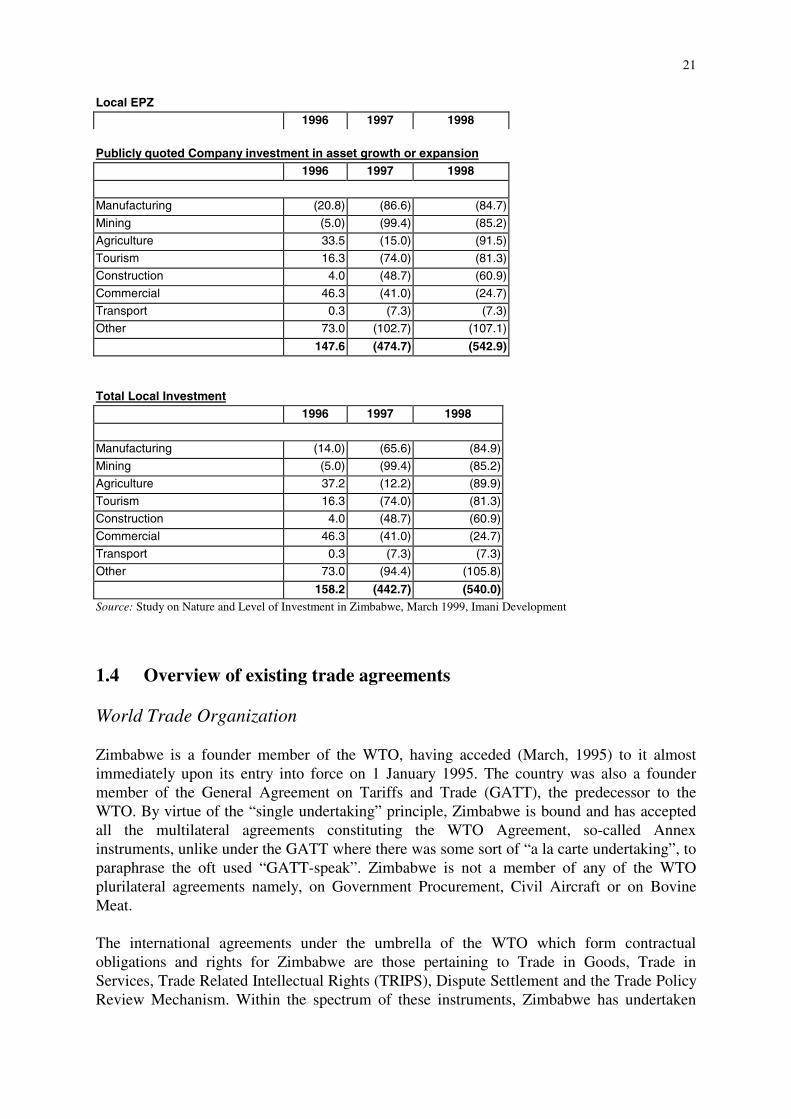
Local EPZ1996 1997 1998
Publicly quoted Company investment in asset growth or expansion1996 1997 1998
Manufacturing (20.8) (86.6) (84.7)
Mining (5.0) (99.4) (85.2)
Agriculture 33.5 (15.0) (91.5)
Tourism 16.3 (74.0) (81.3)
Construction 4.0 (48.7) (60.9)
Commercial 46.3 (41.0) (24.7)
Transport 0.3 (7.3) (7.3)
Other 73.0 (102.7) (107.1)
147.6 (474.7) (542.9)
Total Local Investment1996 1997 1998
Manufacturing (14.0) (65.6) (84.9)
Mining (5.0) (99.4) (85.2)
Agriculture 37.2 (12.2) (89.9)
Tourism 16.3 (74.0) (81.3)
Construction 4.0 (48.7) (60.9)
Commercial 46.3 (41.0) (24.7)
Transport 0.3 (7.3) (7.3)
Other 73.0 (94.4) (105.8)
158.2 (442.7) (540.0)Source: Study on Nature and Level of Investment in Zimbabwe, March 1999, Imani Development
1.4 Overview of existing trade agreements
World Trade Organization
Zimbabwe is a founder member of the WTO, having acceded (March, 1995) to it almostimmediately upon its entry into force on 1 January 1995. The country was also a foundermember of the General Agreement on Tariffs and Trade (GATT), the predecessor to theWTO. By virtue of the “single undertaking” principle, Zimbabwe is bound and has acceptedall the multilateral agreements constituting the WTO Agreement, so-called Annexinstruments, unlike under the GATT where there was some sort of “a la carte undertaking”, toparaphrase the oft used “GATT-speak”. Zimbabwe is not a member of any of the WTOplurilateral agreements namely, on Government Procurement, Civil Aircraft or on BovineMeat.
The international agreements under the umbrella of the WTO which form contractualobligations and rights for Zimbabwe are those pertaining to Trade in Goods, Trade inServices, Trade Related Intellectual Rights (TRIPS), Dispute Settlement and the Trade PolicyReview Mechanism. Within the spectrum of these instruments, Zimbabwe has undertaken
22
specific tariff liberalisation commitments, e.g. tariff cuts and bindings in the case of goods,and market access measures in the case of services on the one hand, and rules commitmentson the other, e.g. anti-dumping and subsidies and countervailing disciplines, trade-relatedinvestment measures and intellectual property rights norms. In both aspects, implementationof the commitments ranged from immediate, phased (in respect of tariff reductions) todelayed time frames. As at present however transitional periods for delayed implementationhave expired and therefore the country will be expected to abide by all the full obligationsunder the WTO.
In real terms however, Zimbabwe is in many respects not ready. The obligatory institutionaland legal mechanisms required under the various WTO agreements for a member to bedeemed, prima facie, as conforming, e.g. the requirement to bring or establish and notify thenecessary domestic legislation consistent with the relevant WTO disciplines, are just not yetthere. Nor is the country in a position to enjoy the flip-side of the bargain, namely fullyexercise its rights or enjoy any of the trade benefits expected to result from the UruguayRound package. Examples of this double dilemma are numerous: legislative instruments foranti-dumping and countervailing measures and TRIPS are still under preparation when thisshould have been done already and although the country has been affected or had interest in afew instances of trade disputes (eg on the asbestos issue), it could not participate in thedispute settlement processes in the WTO due to failure to make relevant submissions.Domestically, authorities have not been able to investigate allegations of dumping primarilybecause of the absence of enabling anti-dumping legislation that conforms to the WTOAgreement and which is still to be enacted by Parliament. At the same time, the country is inthe process of building, within the Tariff Commission, relevant capacity and expertise toensure that its rights to defend its trade interests under the appropriate WTO Agreements canbe fully exercised.
ACP/EU Partnership Agreement
Zimbabwe has been a member and beneficiary of the Lomé Conventions since attaining itsindependence in 1980. There are two aspects of its benefits, which constitute the essence ofthe relationship characterising the ACP-EU agreement: market access and development aid.With regard to the former, Zimbabwe has enjoyed either duty free or preferential duties andexport quotas for sugar and beef products in the EU market. Under developmental aid,Zimbabwe has accessed European Development Fund financial assistance for developmentprojects and export stabilisation support.
Over the past two years the parties to the Convention have negotiated a new and transitionalagreement (the Cotonou Agreement) to run for eight years beginning year 2000. At the end ofthat period, the central principle that has defined the ACP-EU trade, namely non-reciprocalpreferences offered by the developed EU side, is expected to be replaced essentially byreciprocity as far as the trade relationship will be concerned. In the meantime the PartnershipAgreement will offer the ACP countries similar treatment for their exports as that under theLomé framework.
The elements and general negotiating framework for the future trade and economicarrangements between the parties are defined in the said Partnership Agreement, and includethe following:
23
• The negotiation of new and WTO compatible trading arrangements for the Parties• The provision of financial assistance to ACP members for the purposes of debt relief,
structural reforms, institutional development and capacity building, humanitarian andemergency assistance and investment and private sector development, etc.
• The respect of certain political principles by both member states, specifically the so-called essential and fundamental elements of the Agreement, namely human rights,democracy, rule of law and good governance.
Common Market for Eastern and Southern Africa
The Common Market for Eastern and Southern Africa (COMESA) is a regional tradegrouping that comprises 20 countries of the southern, eastern and northern parts of thecontinent, namely: Angola, Burundi, Comoros, Democratic Republic of Congo, Djibouti,Egypt, Eritrea, Ethiopia, Kenya, Madagascar, Malawi, Mauritius, Namibia, Rwanda,Seychelles, Sudan, Swaziland, Uganda, Zambia and Zimbabwe. Since 1981 the membercountries had established a Preferential Trade Area (PTA) to promote regional integration andthey decided to transform the PTA into COMESA in 1994, so as to underline their ultimateobjective to create a common market and eventually an economic community in the region.
As defined in the Treaty establishing COMESA, the main objectives of the regional blockinclude: the creation of a free trade area (FTA), a customs union and eventually a commonmarket or community of states with a single monetary union and currency. Towards this end,COMESA has adopted and has been implementing a wide range of programmes coveringboth social and economic sectors, which are necessary to be accomplished in pursuit of theregional economic community. The principal ones are:
• Trade liberalisation: reduction and elimination of tariffs and non-tariff barriers; rulesof origin; customs facilitation procedures, management systems and harmonisation;and a common external tariff;
• Transportation and communication facilitation: e.g. harmonisation of road transitcharges, carriers licenses, vehicle dimensions and axle loads, insurance; and airtransport services liberalisation; as well as telecommunications liberalisation;
• Financial and monetary area: a harmonisation programme; restructuring of theclearing house and fuller utilisation of the PTA Bank; and the COMESA Re-InsuranceCompany (ZEP-RE); and
• In the areas of investment, standards and free movement of people.
Zimbabwe has been an active proponent of the objectives and development of the COMESAprogramme, and that of its predecessor- the PTA. The principal driving motive behind theGovernment’s strategy for this position has been that COMESA offers a natural market forwhich Zimbabwe could take advantage because of its relatively superior economicdevelopment. Zimbabwe is a small economy in terms of geographical and demographicindicators, and COMESA more than compensates for this “deficiency” by offering a marketof some 400 million people (Zimbabwe has 12 million). Accordingly the country hasimplemented and achieved the major milestones of the regional integration programme,particularly in the area of trade liberalisation: the reduction and recently the elimination ofcustoms duties as of 31 October 2000 with the adoption of the COMESA Free Trade Area;
24
the adoption of simplified rules of origin and the COMESA Certificate of Origin; and theinstallation of a customs management system (ASYCUDA) to facilitate trade. Zimbabwe isalso committed to the introduction of the COMESA Common External Tariff andestablishment of the Customs Union in 2004.
Southern African Development Community (SADC)
The Southern African Development Community (SADC) is the successor of the SouthernAfrican Development Coordination Conference (SADCC), which had been established in theearly eighties as an essentially counter- instrument of the southern African countries againstthe apartheid South Africa. When the latter joined the former countries as a full democracythe SADCC was transformed from its original anti-South Africa axis into an instrument ofregional cooperation and the SADC Treaty was signed in Windhoek, Namibia in 1992.Presently SADC comprises 14 countries namely: Angola, Botswana, the Democratic Republicof Congo, Lesotho, Malawi, Mauritius, Mozambique, Namibia, Seychelles, South Africa,Swaziland, Tanzania, Zambia and Zimbabwe. All but 5 of these 14 member states also belongto COMESA: the exceptions being Botswana, Lesotho, Mozambique, Tanzania and SouthAfrica. From Zimbabwe’s point of view, and for the region this poses a significant challengein terms of trade policy formulation and pursuit particularly in recent years when theobjectives and programmes of the two regional blocs are seemingly heading towards the samepoint: a single regional community.
Under SADC, regional economic co-operation is pursued through an essentially sectoral co-ordination approach. Up until now there have been 18 sectors constituting the SADCProgramme of Action (SPA) and which have been co-ordinated by each of the member statesby sector. For example Zimbabwe has been co-ordinating the agriculture and food securitysector, Namibia - fisheries, Botswana- Tourism, South Africa- Finance and Investment,Mauritius – tourism etc. From the viewpoint of trade, the relevant sector has been the Industryand Trade Sector which has been co-ordinated by Tanzania. It is under this sector that theSADC Trade Protocol was developed. Tanzania, as the co-ordinating country has beenresponsible for organisational and institutional aspects of the meetings and work related to theTrade Protocol.
However this structure is currently in the process of change. A new structure has been agreedupon under which professionally staffed Directorates will gradually be established at theSecretariat in Gaborone. The first of these new Directorates will be the EconomicsDirectorate that will cover the trade, finance and investment sectors. At the time of writing(August 2001) this Directorate is in the process of being established. This will henceforth takeover responsibility for trade from the Tanzania Sector Coordinating Department.
The Trade Protocol was signed by the SADC Heads of State and government in 1996 after atwo-year period of negotiations. Up until this juncture when member states decided tonegotiate a trade component in SADC, it had often been said that COMESA and SADC werecomplementary in that the former would be a regional trade organisation while the latterconcentrated on project and wider economic co-operation. It was therefore not surprising thatit soon became usual that member states belonging to both or either of the two organisationscalled for the examination of these organisations but primarily to avoid duplication. Thismatter has however still not been settled although it remains on the agenda of successive androtating Chairmen of the supreme Policy Organs of the two organisations.
25
The objectives of the Trade Protocol include the following:
• The liberalisation of intra-SADC trade in goods and services but with initial emphasison trade in goods
• The establishment of efficient production chains within SADC on the basis of currentand dynamic advantages in member states
• Enhancing the investment climate of SADC for both regional (cross-border) andinternational investors
• The establishment of a Free Trade Area within eight years of the entry into force ofthe Protocol.
The Protocol itself however did not contain the specific implementation arrangements. Itprovided the framework and objectives. The details have been worked out by the TradeNegotiating Forum that has been meeting regularly over the last few years.
Initially it had been projected that the eight years for implementation of the Protocol wouldcommence on 1 January 2000. However this was not to be since the Trade Protocol itself onlylegally entered into force on 25 January 2000, i.e. following its ratification by the requirednumber of member states (eight). The effective implementation of the Protocol was then setfor 1 September 2000 when it was considered that the necessary tariff schedules, rules oforigin documentation and the legal instruments would be ready to allow the exchange ofpreferential trade transactions among member states. Only South Africa and Mauritius werein fact ready by this date, having deposited the relevant instruments of ratification, by thatdate. Zimbabwe promised to join in this implementation soon thereafter but without giving aspecific date. At the time of writing (August 2001) Zimbabwe has deposited all the necessarydocumentation with the SADC Secretariat and has indicated its readiness to trade under theprotocol. There is however still a technical problem in that the official certificates of originthat are required in order for an exporter to be given tariff preferences by the SADCimporting country are not yet available due to a shortage of the necessary printing ink. It isassumed that this problem will be rectified in the not too distant future so that Zimbabweanexporters can get the benefit of preferential trade. All other signatories to the Trade Protocolhave by now complied with the necessary formalities. This means that the 11 signatorycountries can now (at least in theory) all trade under the terms of the Protocol. The TradeNegotiating Forum is however still working on finalising rules of origin for some contentioussectors. The most contentious sectors where agreement is still to be reached are in such areasas motor vehicles and components, plastic products and wheat products. Sugar is beingnegotiated in a separate protocol. Agreement has just been reached on the highly contentioustextiles and garments sector, although this has instituted a quota arrangement that is not verysatisfactory for some member States.
Zimbabwe/South Africa Bilateral Agreement
The two countries have a bilateral agreement that dates back to 1964 but has undergonevarious permutations of full or partial dormancy, partial implementation as well as re-negotiations over the years. Perhaps one of the lowest points in the history of this agreementwas in 1992 when the new “democratic” South Africa unilaterally abrogated it and steeplyhiked tariffs on Zimbabwean imports which had been enjoying zero or reduced customs
26
duties thus effectively pushing Zimbabwean products, especially textiles and clothing items,out of the South African market. Since then there have been negotiations between thecountries that only led to some agreement in 1997 and 1998 focusing on the following areas:
• Clothing and textiles• Agricultural goods• Other goods (manufactures goods).
When South Africa started causing problems with this agreement, Zimbabwe’s private sectorsoon experienced very negative impacts. This spurred the private sector into action and forthe first time in the area of trade negotiations saw the country’s private sector institutions(especially the Confederation of Zimbabwe Industries and the Commercial Farmers’ Union)take an active interest. The reason for this was simply that their members were experiencingserious loss of export market. Even with this involvement however, Zimbabwe was at aserious disadvantage in negotiating strength and capacity. The agreement is preferential, but not based on full reciprocity as is the case for other bilateralagreements that Zimbabwe has signed with the neighbouring countries of Botswana, Malawiand Namibia. Zimbabwe is granted under the agreement special quota and tariff concessionsfor its products to enter the South African market and these concessions do not have to bereciprocated. A huge trade balance in favour of South Africa has always marked Zimbabwe’s trade withSouth Africa, and this situation appears to have been exacerbated by the distressedperformance of the Zimbabwean economy, especially the textile and clothing industry, duringthe post-ESAP period. It is estimated that this imbalance has ranged between US$800millionto US$600million/year during 1996 to 1999. The dilemma facing Zimbabwe in its bilateral trade with its southern neighbour, is manifestedin various areas:
• South Africa is Zimbabwe’s largest single trading partner, for historical, geographicaland economic reasons
• Although the two countries may be considered the major economic powers in theregion, the South African economy is by far bigger and more industrialized than theZimbabwean one, thus creating an environment where the latter is dependent on theformer and unequally so
• South Africa’s export basket to Zimbabwe consists of capital and intermediate goodslike machinery, chemicals, transport equipment, and electrical products; as well asconsumer products that carry a high value tag. Zimbabwe’s major exports to SouthAfrica consist of such items as textiles and clothing, wood products, minerals,agricultural goods, tobacco, base metal products and furniture.
• While a significant share, if not the major one, of South Africa’s exports to Zimbabwefall outside the bilateral trade agreement, the opposite is the case for Zimbabwe: thecountry is heavily dependent on the trade agreement in order to export to SouthAfrica. Consequently, Zimbabwe has found itself in a situation where it is always the“demandeur” to negotiate an agreement with its neighbour.
27
The medium and especially the long-term future of the bilateral agreement will depend on theevolution of the SADC Trade Protocol. The Protocol allows member states to maintainexisting bilateral and preferential arrangements to operate in parallel with it until the affectedmember states consider the Protocol more favourable. For the Zimbabwe/South AfricaAgreement it would appear that this might not be the determining factor, but the willingnessof the parties to the Agreement to extend it.
Zimbabwe’ Bilateral Agreements with Botswana, Malawi and Namibia
Zimbabwe has entered into bilateral preferential trade agreements with three otherneighbouring countries (Botswana, Malawi and Namibia), which are essentially the sameboth in form and content. Zimbabwe has on the whole been the stronger partner in thesenegotiations, with more to gain for its exporters (although the other countries also have exportopportunities that have been significantly developed under the bilateral agreements.) Themain and common elements of these agreements are the following:
• Zero tariffs for goods meeting the rules of origin• 25% local content rule of origin• Cumulative rule of origin• Inclusion of articles from waste and scrap as qualifying manufactured products.
The Botswana Agreement originally dates back to 1956 when it was signed betweenRhodesia and Nyasaland, Basutoland, Bechuanaland and Swaziland. After Zimbabwe becameindependent, a new agreement was entered into between the two countries in 1988. Out of theabove listed main and common elements characterising Zimbabwe’s bilateral agreements,only the duty free access and the local content criterion of 25% were agreed in theZimbabwe/Botswana agreement of 1988. Even then clothing was partly excepted from theseconditions in that quantitative restrictions (quotas) were applied, in addition to the rule oforigin requirement.
The consistent trade imbalance in favour of Zimbabwe has over the years led to discontentfrom the Botswana side and eventual friction over bilateral trade. Botswana particularly raisedthe issue of cumulation when it established a huge Hyundai motor plant and targetedZimbabwe as the export market for vehicles. Zimbabwe on its part also pushed for theinclusion of the waste and scrap metals. These issues were only resolved between the partiesearly 2000 after protracted discussions and the intervention of the respective Heads of State.Currently this resolution has still to be formalized in an amended agreement.
Botswana for a long time occupied the second spot as Zimbabwe’s largest trading partner inthe region after South Africa. Beginning mid 90s it however lost this position to Zambiaalthough the latter did not have a bilateral preferential agreement with Zimbabwe, but theCOMESA (PTA) arrangement.
With Malawi, Zimbabwe concluded an MFN trade agreement in 1986 after abrogating anearlier free trade agreement, but this was subsequently re-negotiated into a preferentialagreement that came into effect in 1995. As was the case with Botswana, the trade balancebetween the two countries has always been heavily tilted in Zimbabwe’s favour, and this ledMalawi to demand amendments to the existing agreement. The cumulation principle would
28
be included in such a revised agreement, and other aspects to increase Malawi’s access to theZimbabwean market would be considered. The main reason for the imbalance in trade arisesform the fact that Zimbabwe exports manufactures to Malawi, e.g. fertilizers, iron and steelproducts, meal and flour while the latter supplies largely basic agricultural products: rice,pepper and sauce, oil seeds, etc.
Namibia was the latest country in the region to sign a preferential agreement with Zimbabwe-in 1992. As mentioned earlier, the agreement is standard when compared with the precedingtwo, and has also been amended to include cumulative principle and waste and scrap. Thesechanges are however still to be effected as the new agreement awaits signing.
The preferential bilateral agreements between Zimbabwe and Botswana, Malawi andNamibia exist within the context of other regional preferential arrangements in which thesecountries belong. All the four countries belong to SADC; Botswana and Namibia belong toSACU; and Zimbabwe, Malawi and Namibia are members of COMESA. Except for the ruleof origin of 25% local content, COMESA’s zero tariff regime is equivalent to the bilateralpreferential regime for Zimbabwe, Malawi and Namibia. For Botswana in particular theSADC Trade Protocol arrangement would be different from the bilateral regime in view of itsdifferent rules of origin and phased tariff reductions in some instances, but could eventuallyoffer equivalent treatment. This situation poses a challenge to the trade policy officials andtheir governments particularly as they are still finalize the bilateral agreements when theregional arrangements have been concluded and are being implemented.
29
2. Trade Negotiations in the Last 10 Years
2.1 Key issues and interests
Of the five categories of negotiations in which Zimbabwe participated in the last ten years,only two sets, namely SADC and COMESA, bear the positive signs of the country’sparticipation and influence. In one respect this could be explained by historicalcircumstances: in the case of the GATT/WTO and the Lomé Conventions, and to some extentthe bilateral agreements with Botswana, Malawi and South Africa, Zimbabwe had tonegotiate accession to, and not the terms of these arrangements since they already existedprior to its independence. Consequently, and as will be demonstrated the definition oridentification of negotiation issues for Zimbabwe was therefore largely predetermined byothers in the GATT/WTO, ACP/EU and some of the bilateral agreements. What was left wasfor the country to then define and identify its negotiation interests within these alreadyestablished frameworks and agendas. While this appeared a lesser task, in effect it provedinherently problematical and disadvantageous for a country that had no experience in suchnegotiations, did not have an established trade policy framework and whose immediatepriorities lay elsewhere. In contrast, the country is a co-founder, together with its regionalneighbours, of the two regional integration and trading arrangements of SADC and COMESAthat were born after Zimbabwe’s independence in 1980. In this instance Zimbabwe played asignificant and influential part in defining the negotiation agenda and subsequently theoutcomes of these negotiations. Indeed, these negotiations were the major priorities of boththe government authorities and the business sector.
GATT/WTO
Zimbabwe (then Southern Rhodesia) was an original signatory to the GATT, having been amember from 1948. As a consequence of that membership, the country had “bound” some ofits tariff lines (10% of total tariff lines), and subsequently signed onto one of the TokyoRound Codes (Customs Valuation) in 1987. The Uruguay Round, launched in 1986, saw anunprecedented expansion of trade issues well beyond those traditionally dealt with by GATT,and many developing countries, including Zimbabwe, were not prepared for thisdevelopment. There were fifteen issues formally allocated into individual negotiation groups:fourteen under the trade in goods category and one in the trade in services negotiating group.In addition there were negotiations on other related issues, including on “surveillance” andwhat was termed “coherence” between trade and monetary and financial policies. It would befair to state that Zimbabwe along with many countries in the developing world had no real sayin the determination of these negotiation issues. In fact Zimbabwe only established aPermanent Mission in Geneva in 1986, whereas the negotiations that eventually culminated inthe Uruguay Round agenda had been going on since 1982! In addition the Mission initiallydid not even have a trade official on its limited staff establishment (three people) whose“brief” included UNCTAD and other UN agencies. At the capital (Harare) level the situation was not any better. The responsible ministry of tradedid not have the required trade expertise to understand and analyse the issues on the UruguayRound agenda in order to provide government with the relevant advice. On the other hand,
30
the business sector did not show any awareness or interest in these negotiations. In thesecircumstances it was inevitable that the country’s “interests” in the Round were initiallydetermined solely by ideological criteria based on Developing Countries’ group versus theDeveloped Countries. On this basis the general stance of the GoZ was to echo the positions ofleading developing countries like India and Brazil on such issues as market access, servicesand intellectual property rights negotiations. As noted by representatives of the private sectorand civil society, the country had not carried out any research, workshops or otherbackground work on these issues in order to determine its own real and relevant interests.Negotiations were handled almost exclusively by government officials with practically noinvolvement from the private sector, which remained uninformed and on the whole were notconsulted. The private sector, for its part, showed little interest, being unaware of the issuesand their likely consequences. As it is well known, the Uruguay Round negotiations developed into a long drawn-outprocess, with the final package being concluded after seven years (1994). Zimbabwe officials,like many other developing countries, used their acquired knowledge and experience of thisprocess to improve their participation in the negotiations, by increasingly clarifying theirnational interests in the same negotiations. By the mid-term review of the Uruguay Round(1998), the country had identified such specific areas as agriculture, tariff and non-tariffbarriers, tropical products and MTN Agreements and arrangements as key issues of interest.The private sector was beginning to get involved by this stage, being prompted by NGOs andthe donor community. However the country’s interests in these issues were almost alwaysexpressed and pursued in the negotiations process entirely in general terms, again invariablyfollowing the queue of the more powerful developing countries.
Lomé Convention
In the context of the negotiations for the successor arrangement for the Lomé IV Convention,the “other party”, i.e. the EU, and not Zimbabwe, defined the agenda and issues. When theLomé IV was concluded between the ACP and EU in 1995, both parties knew there would benegotiations in 5 years’ time when the Convention expired. The ACP member statesnonetheless believed the future negotiations would be based on the aquis of the previousConventions, i.e. non-reciprocity. These countries were not prepared therefore when the EUproposed and achieved a re-negotiation agenda for a change in the future relationship of thetwo parties. The outcome of those negotiations, in the form of the Cotonou (Partnership)Agreement demonstrated the total un-preparedness of Zimbabwe along with the other theACP countries for this development. The core elements of the joint ACP-EU co-operation had always been non-reciprocal tradepreferences and developmental (financial) assistance for the ACP countries by the EuropeanCommunity. The EU proposed to renegotiate these two elements: the first objective being toalign (make compatible) the ACP-EU trade regime with the WTO principles, and the secondobjective was to reform the system of delivering EDF assistance to ACP states. TheConventions also contained other “framework” issues like democratic principles, rule of law,respect for human rights, etc. On the part of Zimbabwe, trade (market access) and financialassistance from the EU were always the two major issues for any negotiation in the context ofthe partnership. Specifically this related to the preferential export quotas for sugar and beef,reduced or zero customs duties for other products like tobacco, horticulture, minerals andmanufactures; and the extensive financial aid to several economic and social sectors like
31
agriculture, tourism, environment, education and health. Consequently, the country’s keyinterests were always to maintain these advantages, and they remain the same interests for thenew negotiations due to begin formally in September 2002.
Regional agreements
Zimbabwe’s objectives in both regional integration and bilateral relations at the technicallevel have been determined primarily by trade factors, with the exception of the forerunner ofSADC (i.e. SADCC) where there were also regional political considerations vis-à-visapartheid South Africa. Having said that however, it would appear that the initiative forregional integration has been driven at the highest level by political motivations rather thaneconomic. As earlier outlined, the majority of the trade arrangements in which the country got involvedin subsequent negotiations preceded Zimbabwe’s independence, and therefore tended tocircumscribe its autonomy and role to define the negotiation issues. This was the case withthe bilateral trade agreements with its powerful neighbour, South Africa, Botswana andMalawi where the old agreements came under re-negotiation. The exceptions were thedevelopment of COMESA and SADC, and the bilateral agreement with Namibia in the sensethat these arrangements came into being after independence and on the basis of increasedintervention by the country. The overwhelming observation by private sector stakeholders isthat these developments, whilst of interest and significance to them, were initiated anddominated by government, with the private sector being co-opted at subsequent andsometimes already advanced stages. It was pointed out that there were no industry or sectorspecific studies undertaken before political decisions were made to participate in thenegotiations, with the consequence that issues and national interests were not defined apriori. With specific reference to the SADC Trade Protocol, Zimbabwe together with other membersfeels that they were following South Africa’s defined agenda regarding the objectives of theProtocol, the scope and pace of liberalisation and rules of origin. To illustrate the point thatZimbabwe did not define and formulate its tactics or strategies for the Protocol negotiations,and indeed others like COMESA, the private sector pointed out that policy decisions taken bygovernment (without consulting the business sector) contradicted the country’s commitmentsunder the other negotiations. During the meetings of the SADC TNF, it was very apparenthow well prepared the South African negotiators were, often with strong private sectorparticipation, compared to Zimbabwe and the other countries. On the whole though, there were fewer complaints by business regarding Zimbabwe’snegotiations under COMESA than in the other areas, except until the recent accession ofEgypt to COMESA. A combination of factors could explain this: there were some regionalstudies undertaken on the proposed trade liberalisation; country specific analytical studieswere also carried out on the rules of origin; data were collected and analysed by regionalconsultants on the revenue impact of duty reductions, etc, and this provided some respectablebasis for carrying out the negotiations. Moreover, it was pointed out that the other COMESAcountries were significantly worse-off in terms of pre-negotiation preparations thanZimbabwe. In addition, it was assumed that the country’s relative economic supremacy in theregion provided it with some safeguard to seek changes, in future, in any provisions that laterproved adverse to its interests.
32
Bilateral agreements
With regard to the bilateral agreements, the Zimbabwe/South Africa Agreement perhaps bestillustrates the country’s fundamental weaknesses in the field of negotiations. The agreementis the oldest amongst the bilateral arrangements that Zimbabwe maintains, dating back to1964. However South Africa has invariably always dictated the terms of implementation ofthe agreement: at times unilaterally abrogating it; determining or adjusting the import quotasand the products; the rules of origin; and the duration of these preferences. According toprivate sector representatives, and some government officials Zimbabwe has always beenupstaged by the South Africans in all of the re-negotiations of the bilateral agreement. Caseswere mentioned of South Africa rejecting Zimbabwe’s demands, for example, when the latterrequested increased export quotas for its textiles and clothing products. South Africa wouldeven argue and proffer data to support claims that the Zimbabwean requests were beyond theindustry’s capacity to supply, and citing information gathered from the Zimbabwean industryitself. Alternatively the South Africans would offer Zimbabwe piecemeal concessions, e.g. onagricultural products at one time, and on textiles and clothing at another. The fact that this“stronger partner/ weaker partner” relationship has not fundamentally changed for such a longtime, and even after the coming in of a new and sympathetic South African government,underscores Zimbabwe’s continued failure to build relevant negotiating capacity, expertiseand strategy on one of its most important trade areas.
2.2. Formation and composition of negotiating team Government officials, predominantly from the Ministry of Industry and International Trade(formerly Industry and Commerce) have, until very recently, been the main negotiators for thecountry in multilateral, regional and bilateral trade negotiations. This scenario was the samewhether the negotiations were a continuous process requiring the permanent presence ofnegotiators, as was the case of the Uruguay Round under GATT or where the negotiationsrequired periodic participation (travel), e.g. ACP/EU, regional and bilateral tradenegotiations. In the past, the Trade and Economic Relations Committee (TERC), composedof representatives of various government departments, discussed the issues for thenegotiations and recommended to the Minister of Industry and Commerce the desirablecomposition of Zimbabwe’s government delegation. However these departments would maketheir own appointments regarding the persons to join the trade delegation, usually withoutreference to those persons’ negotiation skills, expertise or experience. With regard to the GATT/WTO the country’s Mission in Geneva automatically constitutedthe permanent negotiating “team”, even though in essence only the trade attachés took part inthe negotiations. The maximum number of such attachés at the Mission has been two at atime, while the negotiations covered more than 14 separate issues and negotiating groups!During the Uruguay Round negotiations, the country had two trade attachés permanentlybased in Geneva, in a Mission with twelve persons. The workload at the GATT wasoverwhelming even for an average delegation of approximately five people (i.e. incomparison with other developing countries) working full time on the Uruguay Roundnegotiations. These attachés also covered work in other international organisations at Geneva(UNCTAD, ITC) and Vienna (UNIDO), as well as export promotion in Italy, Austria andSwitzerland. It could therefore not be expected that Zimbabwe would have an “effectivepresence” in the negotiations process, let alone participation. This situation was exacerbated

33
by the lack of regular advice and directions from Harare on the issues at the negotiation table.Often the attachés had to recommend to the Trade Ministry draft positions, developedinformally with the assistance of UNCTAD, other groups, etc in order to get feedback.Zimbabwe’s market access offers on goods, i.e. tariff reductions and bindings subsequentlyannexed to the Marrakech Protocol, as well as under GATS (financial, telecommunicationsand tourism services) were developed in this manner. This was obviously a reversal of rolesas national positions, whether draft or final, are expected to emanate from capitals. An effortto change this situation began with the formation of the Standing Committee on WTO in1998 for the coordination of positions and issues among various government departments.Subsequently this committee evolved into a wider mechanism by including private sectororganisations but not yet the civil society. The most significant stage was reached in thepreparations for the Seattle Ministerial Meeting when the country organized, with thetechnical assistance of UNDP, UNCTAD and DFID, a consultative conference of allstakeholders in November 1999 and produced a position paper for Zimbabwe’s negotiators. In principle, the Geneva team was supposed to be backstopped by Ministry officials at HeadOffice, i.e. in the capital. In practice, this capital-based staff did not have the requisiteknowledge, analytical and institutional capacity or networking with the private sector thatwould enable the home-based “team” to provide vital operational support and guidance to thenegotiators in Geneva. It is the private sector’s point of view that government did notappreciate the importance of the negotiations to Zimbabwe’s economic interests, or the roleof the private sector in national development, hence its monopoly of the negotiations to theexclusion of other stakeholders. On the other hand, and according to some governmentrepresentatives, the Zimbabwean private sector did not show any interest in international orother markets outside the domestic and South African limits, a legacy from the pre-independence era. In the end, the negotiation of the various international, regional andbilateral trade arrangements was seen, by other stakeholders and indeed by government itself,as a responsibility of government. The private sector would cite lack of funds as an additionalreason for their inability to get involved. There is now ample evidence that the lack of active participation or involvement of theprivate sector, coupled with zero or negligible institutional support from home, seriouslyhandicapped the Geneva-based negotiators. This situation was replicated with regard to theACP-EU negotiations. In the context of regional trade negotiations and the bilateralarrangements (with the exception of Zimbabwe/South Africa), the country’s negotiators areconsidered to have fared better, mainly because these other parties adopted a similar approachof fielding government negotiators. In recent years, there has been a marked change ofapproach, with an increasing tendency and practice to involve the private sector in thepreparations for negotiations, and as members of the negotiating team or delegation to themeetings. The most significant of such cases are the negotiations for a successor agreement toLomé IV Convention, SADC Trade Protocol negotiations and the third WTO MinisterialMeeting (Seattle) where either officials or Ministerial delegations included members from thebusiness associations, trade/producer associations and councils. While this was a positivedevelopment, it also revealed the private sector’s own dearth of knowledge of wider tradeissues, their lack of appreciation of how negotiations can address business needs, and the lowcapacity of the sector to provide trade analysis, advice and other specialized support to thenegotiating team.
34
2.3 Consultation and lobbying processes In the aftermath of the Uruguay Round, and particularly towards the first WTO MinisterialMeeting at Singapore (1996) there emerged a strong domestic anti-WTO sentiment, largelyfrom the civil society. The rallying criticism was that Zimbabwe, like other developingcountries had signed and ratified the Uruguay Round Agreements without consulting its ownpeople. Certainly, in the case of these negotiations, government, private sector and the civilsociety confirm that no significant formal or informal internal consultations took place duringthe course of the Round. It was after the signing of the WTO Agreement that government andother international organisations (supported by donor finance) launched public awarenessprogrammes like workshops and seminars, on the agreements and their implications. In otherwords, this “consultative” process was undertaken post-facto, resulting in the widespreadcriticism that government itself did not understand the implications of the deal that it hadsigned. Due to the general absence of knowledge within the private sector on internationaltrade issues, such as the WTO, awareness raising had to start at a very basic level. Even theprivate sector organisations themselves had little to no capacity to understand these issues ordisseminate meaningful information to their members. At a global level, Zimbabwe officials participated in general consultations or exchange ofviews within the informal group of developing countries in the GATT, the Group of 77 inUNCTAD and Group of 15. As earlier noted, the country tended to follow and generallysupport the positions of the more powerful and articulate developing countries such as Brazil,India, Yugoslavia, etc. In the post Uruguay Round period, and particularly up to the ThirdWTO Ministerial Meeting, Zimbabwe officials (and to a lesser extent private sector)increasingly got involved in regional and intra-regional inter-governmental consultativegroupings: SADC, OAU, Africa Group at Geneva, the South Centre and the Like-MindedGroup (LMG), as well as mixed government-business-NGO forums such as SEATINI(Southern and Eastern African Trade and Information Initiative). The ACP-EU negotiations for a successor arrangement to Lomé IV had established formaland internal procedures for consultations, either within the ACP Group or jointly with the EU(eg ACP Summit and Council of Ministers, ACP Secretariat, Committee of Ambassadors;Joint Summits, Parliament, Councils and Committees). At the domestic level, there now werevarious consultations between government and other stakeholders, but again the dominantvehicle of these consultations were workshops and seminars. As with the WTO issues, thenature of consultations between government and other stakeholders has changed in the lastfew years. There are now more formal structures of dialogue and cooperation, particularlythrough the establishment of an ACP-EU negotiating committee that comprises all thestakeholder representatives. The major hurdle that still remains is how to build capacity,expertise and analytical skills of the members of these committees. At the regional negotiations’ level, the country experienced a better-organised and executedconsultative process. The private sector confirms that government consulted them to someextent regarding COMESA developments, although the same process was not followed withregard to the PTA – COMESA’s forerunner organisation. The consultations were usually inthe form of surveys and studies carried out by consultants, or workshops held on the effect ofdecisions either already taken or contemplated by the member governments. This wassimilarly the case for consultations regarding the negotiation of SADC. Examples are studies

35
on the impact of the removal of tariff barriers on intra-regional trade; customs revenue, outputand employment that were done in both COMESA and SADC after member states had signedthe FTA protocols. All stakeholders have emphasised that consultations should precede andcontinue simultaneously with negotiations. In this way the consultations become a forum forgenerating the objectives and proposals for the negotiations, and also serve as a monitoringmechanism during the negotiation process. Some improvement has been made in very recenttimes. Government and other stakeholders have created such a consultative process,principally in the form of the Standing Committee on Trade Policy, and special workinggroups or committees on such issues like SADC, COMESA, ACP-EU relations, AGOA, aswell as ad hoc committees on the bilateral agreements between Zimbabwe and neighbouringcountries. There has also been some dialogue through the Technical Working Group of theCBI, but again it was very limited. The major handicap facing these committees and their members continues to be lack ofknowledge, technical expertise and negotiating skills. In a way therefore, while the countryhas made some positive improvement by widening and deepening the consultativeenvironment, there remains a bigger challenge to translate this into achieving a moremeaningful and effective participation in the various trade negotiations.
2.4 Negotiation positions and processes The overall experience and assessment about the trade negotiations in which Zimbabwe hasbeen involved, especially the multilateral ones, show a tendency to develop negotiatingpositions only in reaction to other parties’ agendas, rather than on a “pro-active” basis. Withinthe regional negotiations, the agendas have often been set or driven by the Secretariat ratherthan the member States. As a result the country would be inherently disadvantaged in thesubsequent negotiations. On many other occasions, particularly during the Uruguay Round,Zimbabwe did not hold any negotiation stand at all, as none had been developed. Severalreasons have been advanced for this state of affairs: ranging from insufficient analyticalcapacity in both government and private sector to understand the issues and theirimplications; poor prioritisation of interests, leading to the direction of scarce human andmaterial resources to more political areas of the country’s foreign policy, rather than trade;and lack of a defined national policy framework and strategies addressing some of the tradechallenges.
2.5 Zimbabwe’s actual participation in the negotiations By all accounts, the level and quality of participation by Zimbabwe in the Uruguay Roundwas typical of many developing countries, in particular those in Sub-Saharan Africa:marginal. At any one time during the negotiation period there was a maximum of two personscovering the day-to-day process, who were augmented by capital based staff only atministerial stages of the negotiations: reviews, signings, etc. A more substantive factor thatcontributed to the country’s marginal participation stemmed from the low capacity andcompetence of those negotiators to effectively articulate and pursue issues of their interest inthe negotiations. GATT as an institution and a framework for regular trade negotiations hasbeen hailed as “member-driven” and based on contractual rights and obligations. In practice
36
this camouflages a “power-driven” institution where the stronger and more articulatemembers always prevail in setting the negotiation agenda and dictating the scope, pace anddirection of the negotiations. Moreover, apart from the complexity and wide-ranging nature ofthe negotiations, substantive discussions took place in both formal and informal meetings,including the “green room”. Zimbabwe therefore found itself “riding” along with the negotiations, until late in the processwhen the negotiators had acquired improved skills and understanding of the issues through avariety of training courses, studies and “learning-on-the-job” experience. Zimbabwe’scommitments on ceiling bindings (150%!) for agricultural products under the Agreement onAgriculture, market access liberalisation on industrial tariffs and the schedule ofcommitments under the GATS included in the Uruguay Round package were made late in1993 – a few months before the conclusion of the negotiations. In fact the earliest availablestudy on the service sector in Zimbabwe, (“Services in Zimbabwe’- CAPAS (UNCTAD)),whose objective was to “assist negotiators make optimal policy decisions within both thenational context and context of the Uruguay Round” was produced in 1994! The country’sparticipation profile and weight however increased gradually, with Zimbabwe playing a moreelevated role during preparations for and in the course of the 3rd WTO Ministerial Meeting.This was achieved through a combination of workshops, national studies and coordinationwith regional and interregional groups on the issues for the Meeting and the proposed newround. This process was facilitated by the donor and NGO community, without which suchinvolvement would not have happened. The negotiations for a successor agreement for the ACP-EU Lomé Convention officiallystarted in 1998. However, the ACP as a Group adopted a political decision that practicallycircumscribed these negotiations and resulted in the extension of the Lomé IV Convention.The fora for these negotiations have traditionally been rather rigid: with individual memberstates’ roles subsumed by collective groups of ACP Summits, Ministerial Councils and theACP Secretariat. This situation is likely to change in the future negotiations scheduled tobegin in the year 2002. Zimbabwe is presently carrying out preparatory work for theseforthcoming negotiations. In terms of regional negotiations, the country’s participation is obviously more prominent dueto its relatively stronger economic muscle when compared to its neighbours. The agreedCOMESA programmes on trade liberalisation, rules of origin, customs administration andother sectoral programmes in many ways reflect Zimbabwe’s negotiating positions, eventhough in certain instances Zimbabwe has subsequently failed to implement fully some ofthose programmes. In the case of SADC, the economic giant in the region-South Africa hastended to dominate the negotiations in terms of preparedness, articulation, defence andadvocacy of its national interests. Zimbabwe has however participated strongly in all thevarious negotiating structures of the Trade Protocol: the Committee of Ministers of Trade, theCommittee of Senior Officials, the Trade Negotiating Forum, the High level Committee onRules of Origin, and the specialised committees. Zimbabwe’s participants in these negotiatinggroups are drawn from government departments, trade and industry chambers, and specialsectoral and sub-sectoral interests (associations, companies) who constitute the nationalcommittee on the Trade Protocol.
37
2.6 Outcome of the negotiations At the conclusion of the Uruguay Round, there were various pro and counter views andstudies regarding the results of the WTO package. Most of the contentious issues concernedthe benefits of the Agreement to member countries, especially developing countries. With theexception of a few developing countries (e.g. India and ASEAN countries) many developingcountries could not carry out such assessment studies at that time. In Zimbabwe it was only late in 1999 that a country specific study was commissioned (withdonor funds) on the “impact of the Uruguay Round Agreements on the economy and externaltrade”. The aim of the study was to “assist government, business sector and other stakeholdersto better understand the overall impact of the Agreements on the country; facilitate adaptationto the agreements; and take maximum advantage of the trading opportunities….”. There hasnot been any study on the results of the Round vis-à-vis the original objectives of Zimbabweand other developing countries when they started the negotiations. One reason is that theevolution of the negotiations constantly changed these countries objectives. However anotherand more plausible reason is that these countries, as was the case for Zimbabwe did notestablish any clear-cut expectations or targets from the very beginning. At present the country is facing difficulties complying with the obligations of the WTOAgreements in the areas of aligning its domestic legislation, rules and standards; fulfillingnotification requirements, etc. It has not utilised any of its potential rights and benefits underthe Agreements, such as initiating anti-dumping measures. This is the reason the studiescarried out have mainly emphasised the impact and implications of the resultant package. Thecountry’s main and general negotiating line during the negotiations was that the outcomeshould safeguard its trade and economic interests that reflected its development level. Othercountries had specific targets regarding priority issues to be covered by the agreements, thelevel of tariff liberalisation and the specific markets, etc. During the last few years the appreciation and understanding within Zimbabwe on issuesrelated to the WTO, and especially in the context of the globalisation and liberalisationdebate, has significantly grown. It is clear that a polarisation of views is emerging,particularly between the business sector on one hand and the civil society on the other, on themerits or otherwise of the country’s membership of the WTO. Clearly government in futurewill need to define its objectives and strategies better and work together with all the otherstakeholders, whether in the preparation of the negotiations, participation or implementationof the results. Generally, the results of negotiations under COMESA and SADC have beenconsidered more positively by both business and the civil society. However, increasinglythere is concern regarding the real benefits for Zimbabwe from the COMESA Free TradeArea as well as the phased liberalisation under the SADC Trade Protocol in view of thecountry’s declining economic performance and capacity. The original set objectives, and theachieved targets now seem incongruent with the prevailing economic conditions, with theconsequent expressions of dissatisfaction with their implementation and utility.
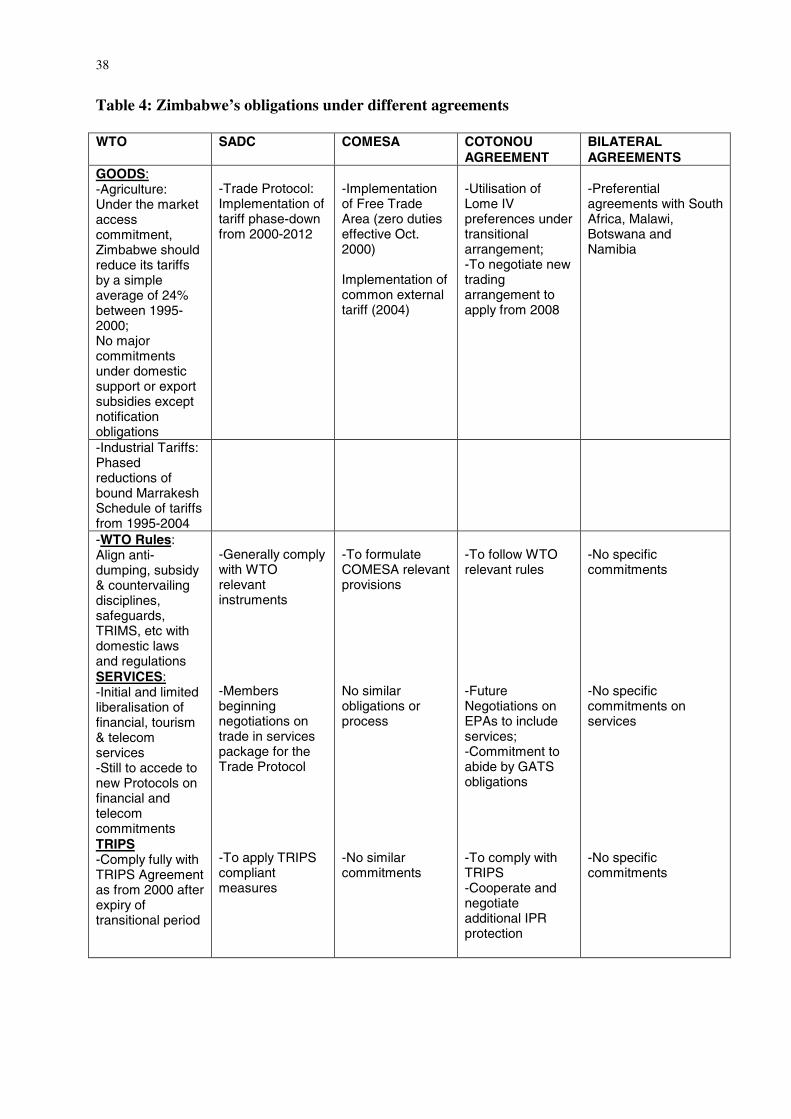
38
Table 4: Zimbabwe’s obligations under different agreements WTO SADC COMESA COTONOU
AGREEMENT BILATERALAGREEMENTS
GOODS: -Agriculture:Under the marketaccesscommitment,Zimbabwe shouldreduce its tariffsby a simpleaverage of 24%between 1995-2000; No majorcommitmentsunder domesticsupport or exportsubsidies exceptnotificationobligations
-Trade Protocol:Implementation oftariff phase-downfrom 2000-2012
-Implementationof Free TradeArea (zero dutieseffective Oct.2000) Implementation ofcommon externaltariff (2004)
-Utilisation ofLome IVpreferences undertransitionalarrangement; -To negotiate newtradingarrangement toapply from 2008
-Preferentialagreements with SouthAfrica, Malawi,Botswana andNamibia
-Industrial Tariffs:Phasedreductions ofbound MarrakeshSchedule of tariffsfrom 1995-2004
-WTO Rules:Align anti-dumping, subsidy& countervailingdisciplines,safeguards,TRIMS, etc withdomestic lawsand regulations SERVICES: -Initial and limitedliberalisation offinancial, tourism& telecomservices -Still to accede tonew Protocols onfinancial andtelecomcommitments TRIPS -Comply fully withTRIPS Agreementas from 2000 afterexpiry oftransitional period
-Generally complywith WTOrelevantinstruments -Membersbeginningnegotiations ontrade in servicespackage for theTrade Protocol -To apply TRIPScompliantmeasures
-To formulateCOMESA relevantprovisions No similarobligations orprocess -No similarcommitments
-To follow WTOrelevant rules -FutureNegotiations onEPAs to includeservices; -Commitment toabide by GATSobligations -To comply withTRIPS -Cooperate andnegotiateadditional IPRprotection
-No specificcommitments -No specificcommitments onservices -No specificcommitments
39
3. Lessons Learned
In conclusion, and based on the foregoing analysis of Zimbabwe’s participation in a numberof negotiations, there are a number of problems which are often symptomatic of policydevelopment in general in Zimbabwe. The following emerge as common problems to beaddressed:
• a poor understanding by Zimbabwe negotiators of the implications of the issues,especially on a sectoral economic basis. It was pointed out that in most casesnegotiations were entered into without a priori studying the development of keyeconomic sectors, e.g. textiles and clothing and the motor industry in the case ofSADC Trade Protocol negotiations.
• inadequate preparations devoted to the formulation of negotiation objectives: it wasnot unusual for the Zimbabwean delegation to go into negotiations without a plan,strategy or targets.
• shortage of adequately trained negotiators in Zimbabwe• little effort devoted to researching and understanding the concerns and positions of
other parties. The better-prepared countries would usually steer negotiations in theirdirection and interest.
• little thought to seeking partners and developing alliances with other like-mindedcountries on an issues-led basis.
• lack of adequate information and capacity within the business community to providerelevant information when required.
• inadequate consultations with the private sector or the broader civil society to helpformulate positions,
• lack of participation by the private sector or the broader civil society in the actualnegotiations
• lack of appreciation of the issues and the importance of the negotiations by the privatesector
• Shortage of financial and human resources to adequately participate in all the tradenegotiations that have been taking place
In addition to these there are a few problems specific to the development of trade policy:
• lack of adequate quantitative analysis of trade data and of factual argumentation. Themajority of negotiating positions were of a general, “sweeping” or political naturewhere others advanced economic arguments backed up with solid evidence, includingdraft written proposals.
• inadequate staffing at Zimbabwe’s mission in Geneva. The two trade attaches have anumber of functions other than WTO that restrict ability to be satisfactorily involvedin WTO issues
• lack of political will and appreciation of the importance of trade issues byGovernment Ministers. A point was made that very few ministers can hold acompetitive debate or discussions on such negotiation issues with their counterpartsfrom other countries.
40
Notwithstanding these problems, a number of positive changes and improvements, haveoccurred in recent times:
• the establishment of various consultative mechanisms between the government andother stakeholders, especially through the Standing Committee on Trade Policy andother sub-committees on specific matters
• an improvement in the availability and distribution of information on issues undernegotiation
• improved dialogue with stakeholders through the holding of workshops, seminars,company consultations and the media
• Improved preparations for some of the negotiations that were preceded by thecommissioning of country specific studies on targeted issues
• The donor community has recently shown keener interest to assist in capacitybuilding and with the national consultative process. This was especially apparent inthe preparations for the WTO 3rd Ministerial Meeting.
The summary conclusion is that the country needs to build capacity throughout the wholestakeholder spectrum, i.e. government, private sector, academia and non-governmentorganisations in such areas as analytical and policy-making skills, negotiations, etc. It has alsobeen emphasized in many quarters that the changed (i.e. negative) economic environment inthe country calls for a re-examination of priorities and a more efficient targeting of resources.
41
References
ACP-EU Partnership Agreement (Cotonou Agreement) (2000).
‘A Policy Framework for Industrial Development, Trade and Investment in Zimbabwe’(1999).
COMESA and the World Trade Organisation: (1999) ‘Challenges and Opportunities in theMultilateral Trading System’.
COMESA (1994) ‘Treaty Establishing the Common Market for Eastern and Southern Africa,Cross-Border Initiative’: Concept Paper, 1993 and various subsequent papers (1993-2000).
Commonwealth Business Council: (1999) ‘Developing Countries and the Millennium Roundof the World Trade Organisation- A compelling case for full participation’.
Commonwealth Secretariat: (1998) ‘Workshop Report on Legal Implementation of the WorldTrade Organisation Agreements’, Arusha.
GATT (1994) ‘Trade Policy Review Mechanism: Zimbabwe’.
GATT (1994) ‘The Results of the Uruguay Round of Multilateral Trade Negotiations-TheLegal Texts’.
ITC (2000) ‘International Marketing and the Trading System’.
International Trade Strategies (2000) ‘Enhancing WTO Capacity in developing Economies(Energising the Private Sector)’
Imani (2000) ‘Development: Strategic Options for SADC Countries in Preparation for theNew WTO Post Seattle initiatives’, Paper by R. Hess at Conference on “Emerging TradeRelations in the 21st Century”, Harare, 2000.
Martin Khor (2000) ‘Globalisation and the South-Some Critical Issues’.
South Centre (1998) ‘The WTO Multilateral Trade Agenda and the South’.
South Centre (1997) ‘Foreign Direct Investment, Development and the New GlobalEconomic Order’.
SADC (1992) ‘Declaration Treaty and Protocol’.
SADC (1996) ‘Protocol on Trade’.
UNCTAD (1999) ‘Implications of Multilateral and Sub-regional Trade Agreements on theEconomy and External Trade of Zimbabwe: Report of National Conference on WTO’,Harare.
42
UNCTAD (1999) ‘Globalisation and Liberalisation: Effects of International EconomicRelations on Poverty’.
UNCTAD: (2000) ‘Positive Agenda and Future Trade Negotiations’.
Martin and Winters (eds) (1996) ‘The Uruguay Round and Developing Countries’.
World Bank:(1999) ‘Improving African Participation in the WTO’ (Paper by Blackhurst,Lyakurwa and Oyedije).
World Bank: (2000) ‘World Development Report’.
UNDP/UNCTAD (2000) ‘Zimbabwe: Globalisation, Liberalisation and Sustainable HumanDevelopment’, -UNDP/UNCTAD Country Assessment Report.